Quality and Nutritional Compounds of Prunus Cerasus L. Var ...
10
HORTSCIENCE 54(6):1005–1012. 2019. https://doi.org/10.21273/HORTSCI13960-19 Quality and Nutritional Compounds of Prunus Cerasus L. Var. Austera Fruit Grown in Central Italy Simona Proietti, Stefano Moscatello, Fiorella Villani, and Federica Mecucci Istituto di Ricerca sugli Ecosistemi Terrestri (IRET) Consiglio Nazionale delle Ricerche (CNR), 05010 Porano (TR), Italy Robert P. Walker and Franco Famiani Dipartimento di Scienze Agrarie, Alimentari e Ambientali, Universit a degli Studi di Perugia, Via Borgo XX Giugno 74, 06121, Perugia, Italy Alberto Battistelli 1 Istituto di Ricerca sugli Ecosistemi Terrestri (IRET) Consiglio Nazionale delle Ricerche (CNR), 05010 Porano (TR), Italy Additional index words. Morello sour cherry, anthocyanins, bioactive compounds, flesh dry matter, malic acid, sugars Abstract. Key nutritional characteristics of the fruit flesh of 41 sour cherries growing in the region of Umbria in central Italy have been determined. Fruit size, flesh dry matter content, nonstructural carbohydrates, organic acids, and anthocyanins were the analyzed parameters. Both the growing environment and genotype were statistically significant for most of the characteristics. Morello sour cherries were characterized by a large amount of sorbitol (up to 44.2 mg · g L1 FW), which contributed significantly to the dry matter content of the flesh, malic acid content that was higher (up to 48.4 mg · g L1 FW) than any published values for cherry flesh, and high anthocyanin content (up to 383.4 mg per 100 g FW). Cyanidin 3-glucosyl rutinoside was the most abundant compound. The analyzed germplasm could be the basis for breeding programs and new industrial products with high nutritional value. The term ‘‘cherry’’ identifies a group of species belonging to the genus Prunus within the family Rosaceae that is native to Europe and Western Asia (St eger-M at e, 2012). Sweet cherry (Prunus avium L.), the most cultivated species, is grown for its fruit in temperate regions of the world. There are numerous cultivars of sweet cherry that have both nutritional and commercial importance. According to FAOSTAT (2017), the leading world producers in 2017 were Turkey, the Russian Federation, Ukraine, the United States, and Iran. There are three main culti- vars of sour cherry, also known as tart cherry (Prunus cerasus L.): caproniana or amarella cherry, with light-colored flesh; marasca, with soft red flesh and a slightly tart flavor; and austera or Morello cherry, with dark red flesh and strong acidic juice (St eger-M at e, 2012). Studies of sour cherry have rarely indicated the cultivar used, and this has generated confusion regarding the character- istics of the flesh of each sour cherry cultivar, particularly the nutritional aspects. The fruit of sour cherry is rich in nutritional components that are thought to be beneficial to human health (Chaovanalikit and Wrolstad, 2004; Mikulic-Petkovsek et al., 2016; Siddiq et al., 2011). The consumption of sour cherry has been reported to decrease the risk of certain cancers, decrease arthritic pain, de- crease systemic and local inflammation, and decrease the risk of type 2 diabetes and certain cardiovascular diseases (McCune et al., 2011). In addition to several important dietary com- ponents, such as fiber, carbohydrates, min- erals, and organic acids (Mikulic-Petkovsek et al., 2016), the fruit from the genus Prunus is a source of various phenolic compounds, including anthocyanins and polyphenols (Blando et al., 2004; Ko1odziejczyk et al., 2013; Siddiq et al., 2011). These metabolites are abundant in sour cherries, reaching values more than 80 mg per 100 g FW (Ballistreri et al., 2013; Blando et al., 2004). Furthermore, anthocyanins have high bioavailability in both fresh and processed fruit and largely contrib- ute to the attractive red color of both the fruit and fruit products (McDougall et al., 2005; Toydemir et al., 2013). The composition of the fruit is greatly dependent on genotype, environmental con- ditions, and agronomic and storage practices (Di Matteo et al., 2016; Di Vaio et al., 2015; Faniadis et al., 2010; Gonc xalves et al., 2007; Ko1odziejczyk et al., 2013). This has stimu- lated research aimed at obtaining knowledge of the effects of these factors on qualitative and nutritionally relevant characteristics of fruits and vegetables (Di Vaio et al., 2015; Kalt, 2006). However, for cherry, this type of research has largely been restricted to culti- vars of sweet cherry (Di Matteo et al., 2016; Faniadis et al., 2010; Papapetros et al., 2018). Therefore, very little information is available regarding the influence of either the genotype or the growing conditions on the nutritional and industrial quality of sour cherry fruit from the cultivar austera. The austera cultivar is commercially cul- tivated in Europe, particularly Hungary, Ser- bia, Turkey, and Poland (St eger-M at e, 2012). In Italy, the austere cultivar was traditionally appreciated, and one tree or a small number of trees were grown on farms as a supple- mentary source of food before the moderni- zation of agriculture. The fruit was and still is used for different traditional preparations (jams, conserves, or liquor), whereas the fresh fruit was and still is rarely consumed because of its acidic taste. Remnant plants from that time period are still the main source of fruit for personal and commercial use. Increasing interest from the food and bever- age industry in sour cherry has encouraged the planting of sour cherry in orchards and conferred greater value to the traditional preparations for commercial use. However, it is difficult to industrialize sour cherry production due to the lack of a consolidated set of horticultural techniques, qualified and certified reproduction materials for the estab- lishment of new orchards, and knowledge about what influences the quality character- istics needed for industrial use that meet the requirements for products rich in nutraceut- ical components (Di Vaio et al., 2015). In the case of the wine industry, for example, grape cultivation achieves the fruit quality required for the production of each specific type of wine. In the case of sour cherry, this type of organization for producing fruit in line with its industrial transformation is absent. Hence, because of the growing interest in sour cherry–based products, it is essential to in- crease our knowledge of the genetic charac- teristics and nutritional and industrial quality of Prunus cerasus L. var. austera germplasm. The hypotheses of the present work were as follows: the sour cherry cultivar austera possesses distinct nutritional quality charac- teristics with regard to the caproniana and marasca cultivars; the germplasm of sour cherries present in different areas of central Italy (region of Umbria) has large variability in terms of nutritional quality parameters; the nutritional quality parameters can be affected by the genetic background and the growing environment; and the nutritional quality char- acteristics of the germplasm from central Italy could be exploited for industrial trans- formation of this highly valuable fruit. The sour cherry cultivar austera was shown to possess distinctive compositional Received for publication 11 Feb. 2019. Accepted for publication 21 Mar. 2019. We thank Marcello Cherubini for his invaluable support with the germplasm sampling procedures. This study was supported by the FANP project [Frutti Antichi per Nuovi Prodotti (Ancient Fruit for New Products)] and grants from PSR Umbria 2007–2013. 1 Corresponding author. E-mail: alberto.battistelli@ cnr.it. HORTSCIENCE VOL. 54(6) JUNE 2019 1005
Transcript of Quality and Nutritional Compounds of Prunus Cerasus L. Var ...

HORTSCIENCE 54(6):1005–1012. 2019. https://doi.org/10.21273/HORTSCI13960-19
Quality and Nutritional Compounds ofPrunus Cerasus L. Var. Austera FruitGrown in Central ItalySimona Proietti, Stefano Moscatello, Fiorella Villani,and Federica MecucciIstituto di Ricerca sugli Ecosistemi Terrestri (IRET) Consiglio Nazionaledelle Ricerche (CNR), 05010 Porano (TR), Italy
Robert P. Walker and Franco FamianiDipartimento di Scienze Agrarie, Alimentari e Ambientali, Universit�a degliStudi di Perugia, Via Borgo XX Giugno 74, 06121, Perugia, Italy
Alberto Battistelli1
Istituto di Ricerca sugli Ecosistemi Terrestri (IRET) Consiglio Nazionaledelle Ricerche (CNR), 05010 Porano (TR), Italy
Additional index words. Morello sour cherry, anthocyanins, bioactive compounds, flesh drymatter, malic acid, sugars
Abstract. Key nutritional characteristics of the fruit flesh of 41 sour cherries growing inthe region of Umbria in central Italy have been determined. Fruit size, flesh dry mattercontent, nonstructural carbohydrates, organic acids, and anthocyanins were theanalyzed parameters. Both the growing environment and genotype were statisticallysignificant for most of the characteristics. Morello sour cherries were characterized by alarge amount of sorbitol (up to 44.2 mg·gL1 FW), which contributed significantly to thedrymatter content of the flesh, malic acid content that was higher (up to 48.4mg·gL1 FW)than any published values for cherry flesh, and high anthocyanin content (up to 383.4 mgper 100 g FW). Cyanidin 3-glucosyl rutinoside was the most abundant compound. Theanalyzed germplasm could be the basis for breeding programs and new industrialproducts with high nutritional value.
The term ‘‘cherry’’ identifies a group ofspecies belonging to the genus Prunus withinthe family Rosaceae that is native to Europeand Western Asia (St�eger-M�at�e, 2012).Sweet cherry (Prunus avium L.), the mostcultivated species, is grown for its fruit intemperate regions of the world. There arenumerous cultivars of sweet cherry that haveboth nutritional and commercial importance.According to FAOSTAT (2017), the leadingworld producers in 2017 were Turkey, theRussian Federation, Ukraine, the UnitedStates, and Iran. There are three main culti-vars of sour cherry, also known as tart cherry(Prunus cerasus L.): caproniana or amarellacherry, with light-colored flesh; marasca,with soft red flesh and a slightly tart flavor;and austera or Morello cherry, with dark redflesh and strong acidic juice (St�eger-M�at�e,2012). Studies of sour cherry have rarelyindicated the cultivar used, and this has
generated confusion regarding the character-istics of the flesh of each sour cherry cultivar,particularly the nutritional aspects.
The fruit of sour cherry is rich in nutritionalcomponents that are thought to be beneficial tohuman health (Chaovanalikit and Wrolstad,2004; Mikulic-Petkovsek et al., 2016; Siddiqet al., 2011). The consumption of sour cherryhas been reported to decrease the risk ofcertain cancers, decrease arthritic pain, de-crease systemic and local inflammation, anddecrease the risk of type 2 diabetes and certaincardiovascular diseases (McCune et al., 2011).In addition to several important dietary com-ponents, such as fiber, carbohydrates, min-erals, and organic acids (Mikulic-Petkovseket al., 2016), the fruit from the genus Prunus isa source of various phenolic compounds,including anthocyanins and polyphenols(Blando et al., 2004; Ko1odziejczyk et al.,2013; Siddiq et al., 2011). These metabolitesare abundant in sour cherries, reaching valuesmore than 80 mg per 100 g FW (Ballistreriet al., 2013; Blando et al., 2004). Furthermore,anthocyanins have high bioavailability in bothfresh and processed fruit and largely contrib-ute to the attractive red color of both the fruitand fruit products (McDougall et al., 2005;Toydemir et al., 2013).
The composition of the fruit is greatlydependent on genotype, environmental con-ditions, and agronomic and storage practices
(Di Matteo et al., 2016; Di Vaio et al., 2015;Faniadis et al., 2010; Goncxalves et al., 2007;Ko1odziejczyk et al., 2013). This has stimu-lated research aimed at obtaining knowledgeof the effects of these factors on qualitativeand nutritionally relevant characteristics offruits and vegetables (Di Vaio et al., 2015;Kalt, 2006). However, for cherry, this type ofresearch has largely been restricted to culti-vars of sweet cherry (Di Matteo et al., 2016;Faniadis et al., 2010; Papapetros et al., 2018).Therefore, very little information is availableregarding the influence of either the genotypeor the growing conditions on the nutritionaland industrial quality of sour cherry fruitfrom the cultivar austera.
The austera cultivar is commercially cul-tivated in Europe, particularly Hungary, Ser-bia, Turkey, and Poland (St�eger-M�at�e, 2012).In Italy, the austere cultivar was traditionallyappreciated, and one tree or a small numberof trees were grown on farms as a supple-mentary source of food before the moderni-zation of agriculture. The fruit was and still isused for different traditional preparations(jams, conserves, or liquor), whereas thefresh fruit was and still is rarely consumedbecause of its acidic taste. Remnant plantsfrom that time period are still the main sourceof fruit for personal and commercial use.Increasing interest from the food and bever-age industry in sour cherry has encouragedthe planting of sour cherry in orchards andconferred greater value to the traditionalpreparations for commercial use. However,it is difficult to industrialize sour cherryproduction due to the lack of a consolidatedset of horticultural techniques, qualified andcertified reproduction materials for the estab-lishment of new orchards, and knowledgeabout what influences the quality character-istics needed for industrial use that meet therequirements for products rich in nutraceut-ical components (Di Vaio et al., 2015). In thecase of the wine industry, for example, grapecultivation achieves the fruit quality requiredfor the production of each specific type ofwine. In the case of sour cherry, this type oforganization for producing fruit in line withits industrial transformation is absent. Hence,because of the growing interest in sourcherry–based products, it is essential to in-crease our knowledge of the genetic charac-teristics and nutritional and industrial qualityof Prunus cerasus L. var. austera germplasm.
The hypotheses of the present work wereas follows: the sour cherry cultivar austerapossesses distinct nutritional quality charac-teristics with regard to the caproniana andmarasca cultivars; the germplasm of sourcherries present in different areas of centralItaly (region of Umbria) has large variabilityin terms of nutritional quality parameters; thenutritional quality parameters can be affectedby the genetic background and the growingenvironment; and the nutritional quality char-acteristics of the germplasm from centralItaly could be exploited for industrial trans-formation of this highly valuable fruit.
The sour cherry cultivar austera wasshown to possess distinctive compositional
Received for publication 11 Feb. 2019. Acceptedfor publication 21 Mar. 2019.We thank Marcello Cherubini for his invaluablesupport with the germplasm sampling procedures.This study was supported by the FANP project[Frutti Antichi per Nuovi Prodotti (Ancient Fruitfor New Products)] and grants from PSR Umbria2007–2013.1Corresponding author. E-mail: [email protected].
HORTSCIENCE VOL. 54(6) JUNE 2019 1005

characteristics regarding the caproniana andmarasca cultivars. Moreover, the germplasmavailable in central Italy possesses widevariability of key compositional traits. Thisgermplasm can represent valuable material toboost the production and transformation ofthe fruit and to provide consumers withproducts with high nutritional value.
Materials and Methods
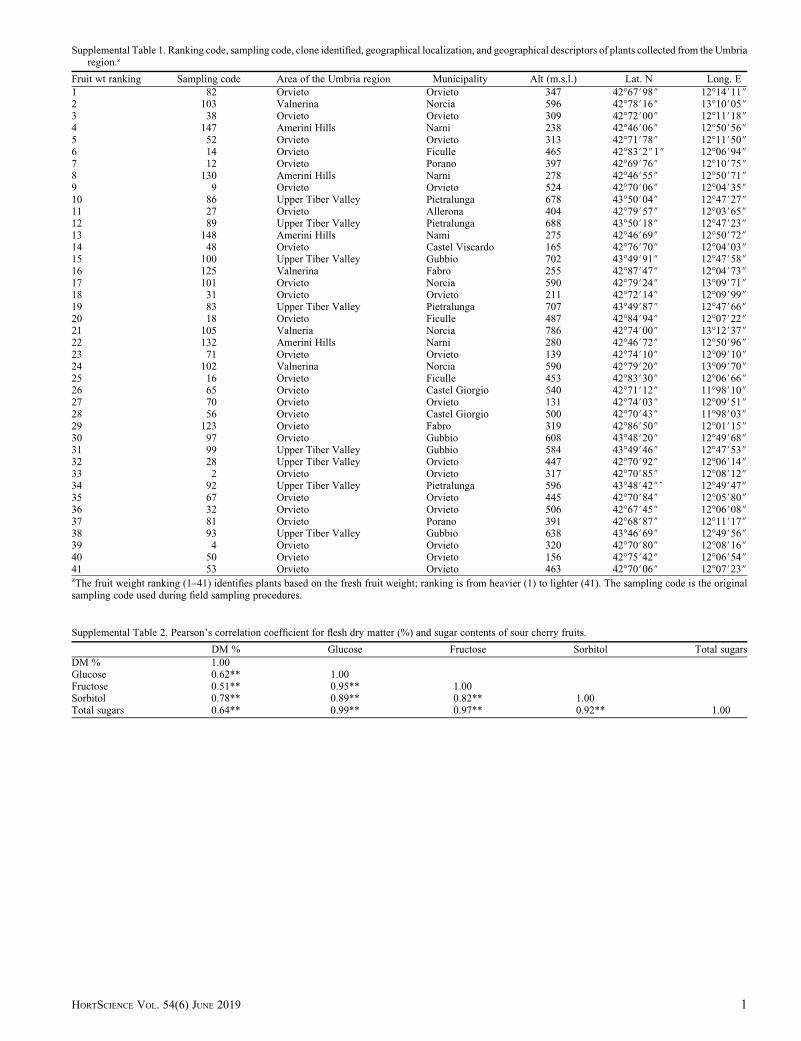
Plant material. In 2013, Morello sourcherries were collected from 41 individualscattered trees growing in different locationsin the region of Umbria in central Italy. Noneof the sampled plants was grafted. The plantswere mature, although the age was not testedand they were not part of commercial or-chards. The locations of the plants werethe Upper River Valley of the TiberTevere (northern Umbria), Valnerina (south-eastern Umbria), Orvieto city area (southwest-ern Umbria), and the Amerini Hills (southernUmbria). The Upper River Valley of theTiber Tevere (northern Umbria) is character-ized by an annual average temperature of�13 �C and rainfall of 870 mm. The Valn-vaslerina (southeastern Umbria) is character-ized by an annual average temperature of�13.5 �C and rainfall of 980 mm. TheOrvieto city area (southwestern Umbria) ischaracterized by an annual average tempera-ture of �14 �C and rainfall of 850 mm. TheAmerini Hills (southern Umbria) is charac-terized by an annual average temperature of�14.5 �C and rainfall of 930 mm. The sourcherry trees sampled were all geneticallytested and were shown to be the Morello(Prunus cerasus) species of botanical cultivaraustera (Gaudet et al., 2018). As similarlyperformed for sweet cherry (Marchese et al.,2017), ripe fruit was collected from May toJuly. For each tree, three replicates witheach consisting of seven fruits were col-lected and used for analysis. All fruit waspicked when it was fully ripe and had dense,dark red skin. The fruit was immediatelyplaced in liquid nitrogen and stored at–80 �C until analyzed. Supplemental Table 1lists the trees and their geographical loca-tions (i.e., height above sea level, latitude,and longitude). Each of these trees was alsoidentified by fruit weight ranking from 1 to41 using the fruit weight as the rankingparameter, with the rank code 1 given tothe plant with the heaviest fruit. Theseranking codes are used to identify each treedescribed here.
Fruit weight and chemical analyses(carbohydrates, polyols, and organic acids).Fruit weight refers to the weight of thewhole ripe fruit without the stem. The fruitwas coarsely ground in a mortar containingliquid nitrogen. The intact undamagedstones and the enclosed seed were manuallyremoved, and the flesh plus skin (defined asflesh) was ground further to achieve a finepowder. The powder was used for all chem-ical analyses and for determining thepercentage of dry matter (DM) (by lyophi-lization).
Sugars (glucose, fructose, sucrose, sorbi-tol, starch) and inorganic anions weredetermined by high-performance anion ex-change chromatography using pulsed amper-ometric detection (ICS-5000; DionexThermo Scientific, Sunnyvale, CA). Organicacids were determined using the samemethod, but malic acid was determined usingan enzyme-coupled spectrophotometric as-say described by Walker et al. (2011). Sugarswere extracted as described by Walker et al.(2011), and these extracts were then passedthrough a 0.2-mm PPII syringe filter(Whatman Inc., Maidstone, UK). The sugarswere then separated using an analytical Carbo-Pac PA20 column (3 mm · 150 mm, i.d.5 mm) with a guard column in series andupstream of the aforementioned column.
Sugars were determined using a cell contain-ing a gold working electrode (diameter, 1.0)together with an Ag/AgCl reference elec-trode, and the resulting electrical signalswere integrated to provide the values innanocoulombs (nC). Runs were performedat 30 �C, and NaOH (10 mmol·L–1) was usedas the mobile phase at a flow rate of 0.5mL·min–1. A post-column addition of 300mmol·L–1 of NaOH at a flow rate of 0.25mL·min–1 was used. Inorganic anions weredetermined in the same extracts as those usedfor the sugar determinations with the samechromatographic system (ICS-5000; DionexThermo Scientific). However, for inorganicanion determinations, the system used aconductivity detector, an analytical IonPacAS11-HC column (4 mm · 250 mm, i.d.
Fig. 1. Fruit fresh weight (g) (A) and flesh dry matter content (%) (B) of sour cherry fruit collected indifferent geographical areas of the region of Umbria. Values represent the mean ± SE. Data wereanalyzed according to a one-way analysis of variance. The bars indicate the least significant difference(LSD) between means according to Fisher’s post-hoc test (P # 0.05).
1006 HORTSCIENCE VOL. 54(6) JUNE 2019

5 mm) with a guard column, and an IonPacATC-1 (Anion Trap Column) coupled withan anion self-regenerating suppressor (allcomponents were from Dionex Thermo Sci-entific). The electrical signal was integratedto provide the value in micro Siemens (mS).Runs were performed at 30 �C at a flow rateof 1.0 mL·min–1. A sodium hydroxide–stepped gradient was applied using 1 mM
NaOH from 0 to 8 min, 15 mM NaOH from 9to 18 min, 30 mM NaOH from 19 to 28 min,80 mM NaOH from 29 to 39 min, and 1.0 mM
NaOH from 40 to 55 min. Various com-pounds were determined using an externalstandard calibration curve. The eluentsand standard solutions were prepared usinghigh-performance liquid chromatography(HPLC) grade reagents (Sigma, Steinheim,Germany). Chromatographic data werereviewed using Chromeleon software ver-sion 6.8.
HPLC analysis of anthocyanins. Antho-cyanins were extracted according to themethod of Usenik et al. (2008). Briefly,100 mg of frozen fruit flesh powder wasextracted by adding 2 mL of methanolacidified with 1% HCl and then placing it inan ultrasonic bath for 1 h at 25 �C. The extractwas then filtered through a 0.2-mm PPIIsyringe filter (Whatman Inc.). The anthocy-anin content was then determined using anUltiMate 3000 HPLC system (DionexThermo Scientific) in conjunction with anultraviolet-Vis detector. An Acclaim Polar-Advantage C16 column (4.6 · 250 mm, i.d.5 mm) was used to separate anthocyanins.This was performed at 30 �C using a mobilephase gradient with two aqueous solutions of10% formic acid (solution A) and 10%formic acid, 22.5% acetonitrile, and 22.5%methanol (solution B) at a flow rate of 0.7mL·min–1. The gradient was formed withsolution B at 18% from 0 to 1 min, 25% from1 to 5 min, 50% from 5 to 15 min, and at 18%from 15 to 20 min. Anthocyanins in theextracts were identified using cyanidin 3-sophoroside, cyanidin 3-rutinoside, cyanidin3-glucoside, and peonidin 3-rutinoside stan-dards, and they were quantified using anexternal standard calibration curve. Cyanidin3-glucosyl-rutinoside was identified andquantified as described by Blando et al.(2004) using cyanidin 3-glucoside as a refer-
ence. Chromatographic peaks were analyzedat a wavelength of 520 nm. The eluents andthe anthocyanin standards were preparedusing HPLC grade reagents (Sigma andExtrasynthese, Lyon, France). Chromato-graphic data were processed using Chrome-leon software version 6.8.
Data handling and statistical analysis.First, all fruit data were analyzed as a uniquepool, which made it possible to test the totalvariability of the germplasm. Second, thedata from the four genotypes present in thegrowing area of the Amerini Hills wereanalyzed. This allowed testing of the geneticvariability within the four genotypes. Third,data regarding fruit from plants growing inthe five geographical areas and recognized asa single clone by genetic analysis (Gaudetet al., 2018) were analyzed. Hence, theenvironmental effects on one genotype weretested. Statistical analysis was performedusing a one-way analysis of variance, anddifferences between the means were esti-mated by the least significant difference test(P # 0.05). These analyses were performedusing Statistics 8 (StatSoft for Windows1998). In addition, the SE was calculated foreach variable (see tables and figures).
Results
When the fruit from all genotypes wasanalyzed together, there were statisticallysignificant differences between fruit freshweights and flesh DM contents (Fig. 1A andB). The mean fruit fresh weight was 2.5 g,and the maximum and minimum values were3.6 g and 1.8 g. The mean flesh DM contentwas 19.2%, with maximum and minimumvalues of 24.8% and 14.8%. There wassignificant variability between fruit freshweight and flesh DM content of the differentgenotypes grown in the same environment(i.e., the ‘‘Amerini’’ Hills). Fruit fresh weightranged from 2.4 to 3.2 g, whereas the DMcontent ranged from 15.7% to 23.3%(Table 1). When the same genotype wasgrown in different areas, there were statisti-cally significant differences in the fruit freshweight and flesh DM content. Fruit freshweight ranged from 2.1 g to 3.3 g, whereasthe flesh DM content ranged from 18.1% to24.8% (Table 2).
The amounts of sucrose, glucose, fruc-tose, and sorbitol and their total combinedamount in the flesh of sour cherry fruit fromall the different genotypes were determined(Fig. 2A–D). Starch and polyols other thansorbitol were undetectable or occasionallypresent in very low levels; therefore, theircontents are not reported here. For all geno-types, glucose, fructose, and sorbitol, whichare the main soluble carbohydrates (MSC),were present in large quantities. The amountsof many of these sugars and the total MSCwere statistically significant between geno-types. Glucose ranged from 20.9 to 70.4mg·g–1 FW (Fig. 2B), and fructose rangedfrom 16.0 to 65.0 mg·g–1 FW (Fig. 2C). Thegenotypes that contained higher amounts ofglucose also had higher fructose, and thosewith lower glucose had lower fructose; therewas a significant correlation between theamounts of glucose and fructose (R2 = 0.85)(Fig. 2C inset). In general, sorbitol levelswere lower than hexose levels (�38% lower,on average), and they varied between geno-types, with a range of 10.6 to 44.2 mg·g–1 FW(Fig. 2D). For a given genotype, sorbitol wascorrelated significantly with glucose andfructose (R2 = 0.72) (Fig. 2D inset). Theamount of MSC varied from 48.9 to 175.5mg·g–1 FW. The differences in the quantity ofall carbohydrates in the flesh of the fourgenotypes grown in the same area (i.e., the‘‘Amerini’’ Hills) were statistically signifi-cant (Table 1). The mean values of glucose,fructose, sorbitol, and total carbohydrateswere, respectively, 52, 46, 28, and 126mg·g–1
FW. Glucose, fructose, sorbitol, and totalcarbohydrates in the flesh of the samegenotype grown in different areas of Umbriashowed statistically significant differences(Table 2). The average amounts of glucose,fructose, sorbitol, and total carbohydrateswere 50, 48, 33, and 131 mg·g–1 FW, re-spectively. Absolute changes in the quantityof hexoses and sorbitol affected their rela-tive abundance. The ratio spanned from amaximum of 4.7 to a minimum of 2.2. Theratio of different genotypes grown in thesame environment showed statistically sig-nificant differences, but there were no dif-ferences in the same genotype grown indifferent environments. Ion-exchange chro-matography showed that malic acid
Table 1. Qualitative parameters of sour cherry fruits collected from four trees from the Amerini Hills in the region of Umbria.
Fruit weight ranking
4 8 13 22
Geographic area Amerini Hills
Fruit flesh weight (g) 3.2 ± 0.11 a 2.7 ± 0.04 b 2.6 ± 0.15 b 2.4 ± 0.16 bDM % 23.3 ± 0.84 a 16.9 ± 1.09 c 19.9 ± 0.91 b 15.7 ± 0.41 cGlucose 66.5 ± 3.80 a 51.7 ± 9.17 ab 53.9 ± 5.45 ab 36.8 ± 3.39 bFructose 60.3 ± 1.93 a 41.4 ± 7.07 b 49.2 ± 4.33 ab 34.6 ± 3.67 bSorbitol 42.3 ± 4.43 a 22.8 ± 4.61 bc 29.9 ± 4.34 b 15.5 ± 2.16 cTotal carbohydrates 169.1 ± 10.13 a 115.8 ± 20.56 b 132.9 ± 14.12 ab 86.8 ± 9.20 bMalic acid 35.8 ± 1.73 ab 38.1 ± 3.81 a 30.4 ± 1.57 b 31.2 ± 1.31 abCyan. 3-sophoroside 7.5 ± 0.51 a 6.5 ± 1.46 ab 10.3 ± 2.27 a 2.6 ± 0.71 bCyan. 3-gluc rutinoside 126.1 ± 1.81 ab 84.4 ± 20.91 b 136.1 ± 15.90 a 39.50 ± 6.02 cCyan. 3-rutinoside 4.9 ± 0.10 ab 2.9 ± 0.70 bc 6.1 ± 1.35 a 1.6 ± 0.25 cPeonidin3-rutinoside 42.4 ± 0.25 a 25.7 ± 4.78 b 46.1 ± 5.04 a 14.9 ± 2.16 bCyan. 3-glucoside 3.5 ± 0.07 a 2.5 ± 0.25 b 3.5 ± 0.06 a 2.3 ± 0.36 bTotal anthocyanins 184.4 ± 2.03 a 122.0 ± 28.01 b 202.4 ± 24.11 a 60.9 ± 9.41 c
HORTSCIENCE VOL. 54(6) JUNE 2019 1007
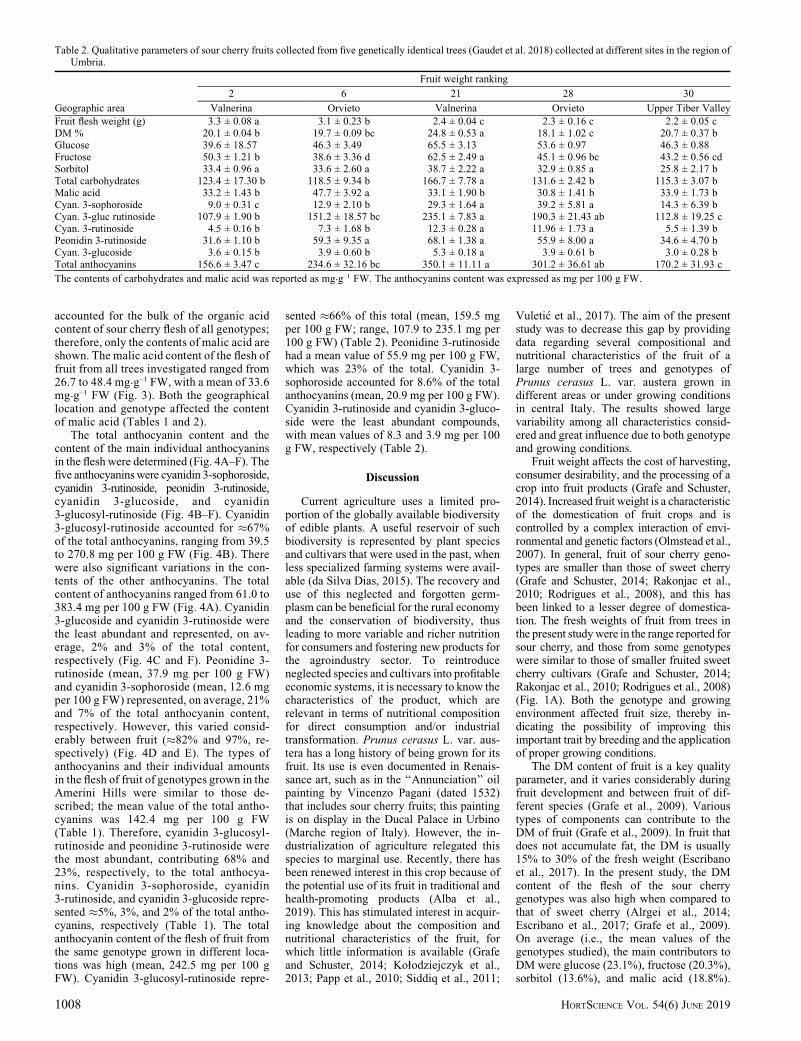
accounted for the bulk of the organic acidcontent of sour cherry flesh of all genotypes;therefore, only the contents of malic acid areshown. The malic acid content of the flesh offruit from all trees investigated ranged from26.7 to 48.4 mg·g–1 FW, with a mean of 33.6mg·g–1 FW (Fig. 3). Both the geographicallocation and genotype affected the contentof malic acid (Tables 1 and 2).
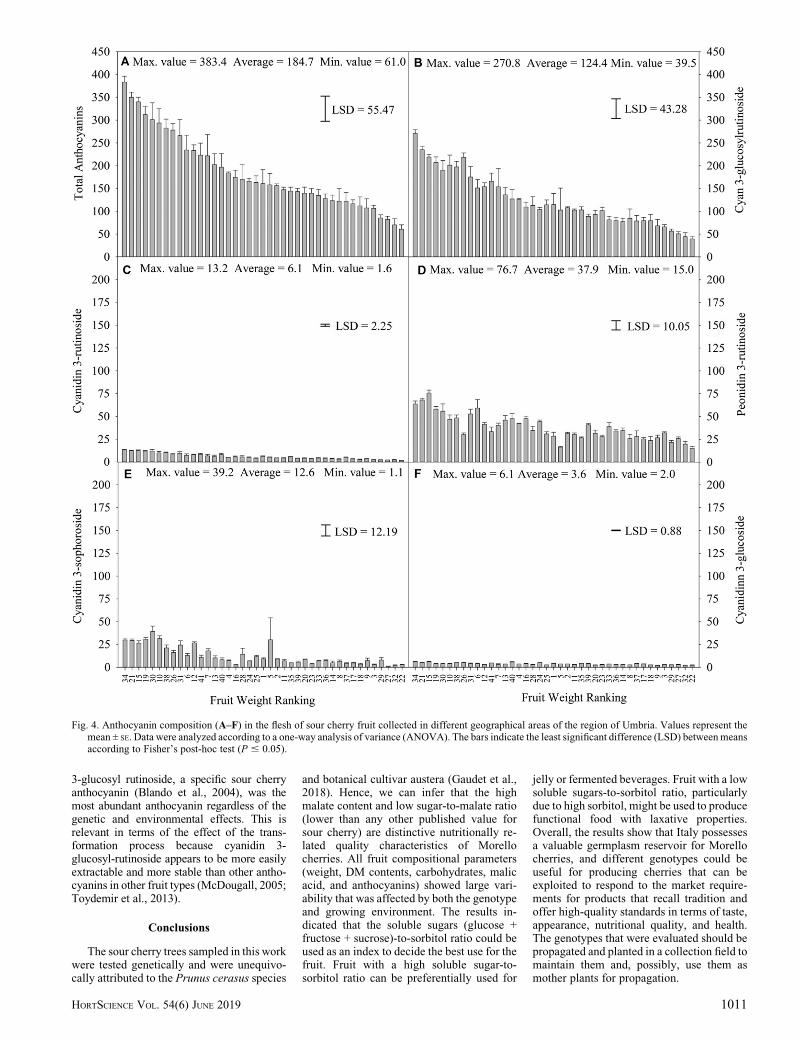
The total anthocyanin content and thecontent of the main individual anthocyaninsin the flesh were determined (Fig. 4A–F). Thefive anthocyaninswere cyanidin 3-sophoroside,cyanidin 3-rutinoside, peonidin 3-rutinoside,cyanidin 3-glucoside, and cyanidin3-glucosyl-rutinoside (Fig. 4B–F). Cyanidin3-glucosyl-rutinoside accounted for �67%of the total anthocyanins, ranging from 39.5to 270.8 mg per 100 g FW (Fig. 4B). Therewere also significant variations in the con-tents of the other anthocyanins. The totalcontent of anthocyanins ranged from 61.0 to383.4 mg per 100 g FW (Fig. 4A). Cyanidin3-glucoside and cyanidin 3-rutinoside werethe least abundant and represented, on av-erage, 2% and 3% of the total content,respectively (Fig. 4C and F). Peonidine 3-rutinoside (mean, 37.9 mg per 100 g FW)and cyanidin 3-sophoroside (mean, 12.6 mgper 100 g FW) represented, on average, 21%and 7% of the total anthocyanin content,respectively. However, this varied consid-erably between fruit (�82% and 97%, re-spectively) (Fig. 4D and E). The types ofanthocyanins and their individual amountsin the flesh of fruit of genotypes grown in theAmerini Hills were similar to those de-scribed; the mean value of the total antho-cyanins was 142.4 mg per 100 g FW(Table 1). Therefore, cyanidin 3-glucosyl-rutinoside and peonidine 3-rutinoside werethe most abundant, contributing 68% and23%, respectively, to the total anthocya-nins. Cyanidin 3-sophoroside, cyanidin3-rutinoside, and cyanidin 3-glucoside repre-sented �5%, 3%, and 2% of the total antho-cyanins, respectively (Table 1). The totalanthocyanin content of the flesh of fruit fromthe same genotype grown in different loca-tions was high (mean, 242.5 mg per 100 gFW). Cyanidin 3-glucosyl-rutinoside repre-
sented �66% of this total (mean, 159.5 mgper 100 g FW; range, 107.9 to 235.1 mg per100 g FW) (Table 2). Peonidine 3-rutinosidehad a mean value of 55.9 mg per 100 g FW,which was 23% of the total. Cyanidin 3-sophoroside accounted for 8.6% of the totalanthocyanins (mean, 20.9 mg per 100 g FW).Cyanidin 3-rutinoside and cyanidin 3-gluco-side were the least abundant compounds,with mean values of 8.3 and 3.9 mg per 100g FW, respectively (Table 2).
Discussion
Current agriculture uses a limited pro-portion of the globally available biodiversityof edible plants. A useful reservoir of suchbiodiversity is represented by plant speciesand cultivars that were used in the past, whenless specialized farming systems were avail-able (da Silva Dias, 2015). The recovery anduse of this neglected and forgotten germ-plasm can be beneficial for the rural economyand the conservation of biodiversity, thusleading to more variable and richer nutritionfor consumers and fostering new products forthe agroindustry sector. To reintroduceneglected species and cultivars into profitableeconomic systems, it is necessary to know thecharacteristics of the product, which arerelevant in terms of nutritional compositionfor direct consumption and/or industrialtransformation. Prunus cerasus L. var. aus-tera has a long history of being grown for itsfruit. Its use is even documented in Renais-sance art, such as in the ‘‘Annunciation’’ oilpainting by Vincenzo Pagani (dated 1532)that includes sour cherry fruits; this paintingis on display in the Ducal Palace in Urbino(Marche region of Italy). However, the in-dustrialization of agriculture relegated thisspecies to marginal use. Recently, there hasbeen renewed interest in this crop because ofthe potential use of its fruit in traditional andhealth-promoting products (Alba et al.,2019). This has stimulated interest in acquir-ing knowledge about the composition andnutritional characteristics of the fruit, forwhich little information is available (Grafeand Schuster, 2014; Ko1odziejczyk et al.,2013; Papp et al., 2010; Siddiq et al., 2011;
Vuleti�c et al., 2017). The aim of the presentstudy was to decrease this gap by providingdata regarding several compositional andnutritional characteristics of the fruit of alarge number of trees and genotypes ofPrunus cerasus L. var. austera grown indifferent areas or under growing conditionsin central Italy. The results showed largevariability among all characteristics consid-ered and great influence due to both genotypeand growing conditions.
Fruit weight affects the cost of harvesting,consumer desirability, and the processing of acrop into fruit products (Grafe and Schuster,2014). Increased fruit weight is a characteristicof the domestication of fruit crops and iscontrolled by a complex interaction of envi-ronmental and genetic factors (Olmstead et al.,2007). In general, fruit of sour cherry geno-types are smaller than those of sweet cherry(Grafe and Schuster, 2014; Rakonjac et al.,2010; Rodrigues et al., 2008), and this hasbeen linked to a lesser degree of domestica-tion. The fresh weights of fruit from trees inthe present studywere in the range reported forsour cherry, and those from some genotypeswere similar to those of smaller fruited sweetcherry cultivars (Grafe and Schuster, 2014;Rakonjac et al., 2010; Rodrigues et al., 2008)(Fig. 1A). Both the genotype and growingenvironment affected fruit size, thereby in-dicating the possibility of improving thisimportant trait by breeding and the applicationof proper growing conditions.
The DM content of fruit is a key qualityparameter, and it varies considerably duringfruit development and between fruit of dif-ferent species (Grafe et al., 2009). Varioustypes of components can contribute to theDM of fruit (Grafe et al., 2009). In fruit thatdoes not accumulate fat, the DM is usually15% to 30% of the fresh weight (Escribanoet al., 2017). In the present study, the DMcontent of the flesh of the sour cherrygenotypes was also high when compared tothat of sweet cherry (Alrgei et al., 2014;Escribano et al., 2017; Grafe et al., 2009).On average (i.e., the mean values of thegenotypes studied), the main contributors toDM were glucose (23.1%), fructose (20.3%),sorbitol (13.6%), and malic acid (18.8%).
Table 2. Qualitative parameters of sour cherry fruits collected from five genetically identical trees (Gaudet et al. 2018) collected at different sites in the region ofUmbria.
Fruit weight ranking
2 6 21 28 30
Geographic area Valnerina Orvieto Valnerina Orvieto Upper Tiber Valley
Fruit flesh weight (g) 3.3 ± 0.08 a 3.1 ± 0.23 b 2.4 ± 0.04 c 2.3 ± 0.16 c 2.2 ± 0.05 cDM % 20.1 ± 0.04 b 19.7 ± 0.09 bc 24.8 ± 0.53 a 18.1 ± 1.02 c 20.7 ± 0.37 bGlucose 39.6 ± 18.57 46.3 ± 3.49 65.5 ± 3.13 53.6 ± 0.97 46.3 ± 0.88Fructose 50.3 ± 1.21 b 38.6 ± 3.36 d 62.5 ± 2.49 a 45.1 ± 0.96 bc 43.2 ± 0.56 cdSorbitol 33.4 ± 0.96 a 33.6 ± 2.60 a 38.7 ± 2.22 a 32.9 ± 0.85 a 25.8 ± 2.17 bTotal carbohydrates 123.4 ± 17.30 b 118.5 ± 9.34 b 166.7 ± 7.78 a 131.6 ± 2.42 b 115.3 ± 3.07 bMalic acid 33.2 ± 1.43 b 47.7 ± 3.92 a 33.1 ± 1.90 b 30.8 ± 1.41 b 33.9 ± 1.73 bCyan. 3-sophoroside 9.0 ± 0.31 c 12.9 ± 2.10 b 29.3 ± 1.64 a 39.2 ± 5.81 a 14.3 ± 6.39 bCyan. 3-gluc rutinoside 107.9 ± 1.90 b 151.2 ± 18.57 bc 235.1 ± 7.83 a 190.3 ± 21.43 ab 112.8 ± 19.25 cCyan. 3-rutinoside 4.5 ± 0.16 b 7.3 ± 1.68 b 12.3 ± 0.28 a 11.96 ± 1.73 a 5.5 ± 1.39 bPeonidin 3-rutinoside 31.6 ± 1.10 b 59.3 ± 9.35 a 68.1 ± 1.38 a 55.9 ± 8.00 a 34.6 ± 4.70 bCyan. 3-glucoside 3.6 ± 0.15 b 3.9 ± 0.60 b 5.3 ± 0.18 a 3.9 ± 0.61 b 3.0 ± 0.28 bTotal anthocyanins 156.6 ± 3.47 c 234.6 ± 32.16 bc 350.1 ± 11.11 a 301.2 ± 36.61 ab 170.2 ± 31.93 c
The contents of carbohydrates and malic acid was reported as mg·g–1 FW. The anthocyanins content was expressed as mg per 100 g FW.
1008 HORTSCIENCE VOL. 54(6) JUNE 2019

Glucose, fructose, and sorbitol together con-tributed an average of 57% to the DM of thefruit flesh (Supplemental Fig. 1). After com-bining the total nonstructural componentsthat were measured, it was found that theycomprised more than 75% of the DM, in-dicating that sour cherry fruit contains large
amounts of metabolites of interest regardingits nutritional quality, sensory perception,and industrial transformation.
Fruit is a sink organ that imports most ofits sugars via the phloem, and many speciesof Prunus, including sour cherry, import bothsucrose and sorbitol (Gao et al., 2003). The
accumulation of soluble sugars occursmainly during phase III of fruit growth(Walker et al., 2011). The carbohydratecomposition of sour cherry flesh resemblesthat of sweet cherry, but sucrose is absent (notdetectable) in sour cherry, and sorbitol ismore abundant than it is in sweet cherry (Gaoet al., 2003; Walker et al., 2011). This in-dicates that sucrose is preferentially used forsink catabolism with regard to sorbitol. Infact, although the intake is mediated by aspecific expression of a sorbitol transporter,sorbitol accumulation is favored by the lackof efficient catabolism as a result of the lowabundance of the sorbitol-catabolizing en-zyme sorbitol dehydrogenase (Gao et al.,2003). The results of the present study in-dicate that for Morello cherries, both geno-type and environment have a significantinfluence on both the absolute and relativeamounts of glucose, fructose, and sorbitol.There was large variability in the relativecontents of hexoses and sorbitol, which havedifferent organoleptic and nutritional charac-teristics, roles, and outcomes with technolog-ical transformation. Hexoses are sweeter thansorbitol per unit of mass and have a wider,direct, and complex impact on human health(Rippe and Angelopoulos, 2015). S. cerevi-siae ferments hexoses, but not sorbitol, toethanol (Parrou et al., 1997). Sorbitol, but nothexose, is a prebiotic because it differentiallystimulates the Lactobacillus genera (Succiet al., 2017). Sorbitol has low cariogenicpotential (Burt, 2006) and exerts an osmoticeffect, retaining water in the intestine,thereby affecting the feces water content.Hence, the hexose-to-sorbitol ratio is a rele-vant parameter that can affect the taste andnutritional quality of transformed products.In Italy, for example, sour cherry is tradition-ally added to red wine to produce an aroma-tized alcoholic beverage called visner, andthe quality of this product, and that of similarpreparations, can likely be modulated usingsour cherry with different ratios of hexose tosorbitol. Furthermore, among the MSC, theconcentration of sorbitol is most closelylinked to the flesh DM content (SupplementalTable 2). The large variability in the solublesugar contents and composition (i.e., hexose-to-sorbitol ratio) of Morello cherry flesh canbe used as a tool to modulate the quality,taste, and nutritional characteristics of thetransformed products. Producers and the in-dustrial sector can take advantage of thevariability of the carbohydrate content linkedto the different combinations of genotypesand growing conditions when deciding on theuse (as fresh or different types of processedproducts) of sour cherries. In this regard, thehexose-to-sorbitol ratio is a valuable indexfor the nutritional and quality characteriza-tion of food products derived from sourcherry.
The organic acid content of fruit has amajor effect on its organoleptic propertiesand its processing into fruit products. Thepredominant organic acid in both sour andsweet cherries is malic acid (Ballistreri et al.,2013; Rodrigues et al., 2008; St�eger M�at�e,
Fig. 2. Total carbohydrates (A), glucose (B), fructose (C), and sorbitol (D) contents in the flesh of sourcherry fruit collected in different geographical areas of the region of Umbria. Values represent themean ± SE. Data were analyzed according to a one-way analysis of variance. The bars indicate the leastsignificant difference (LSD) between means according to Fisher’s post-hoc test (P # 0.05).
HORTSCIENCE VOL. 54(6) JUNE 2019 1009

2012; Usenik et al., 2008; Walker et al.,2011). Nevertheless, only partial research ofthe organic acid content of sour cherry hasbeen performed. Several reports have de-termined titratable acidity but not the contentof each specific organic acid (F€uzfai et al.,2004). Others have focused on sour cherryjuice because often it is not possible tocalculate the content in the flesh; in addition,many studies have not unequivocally definedthe type of sour cherry fruit that was analyzed(i.e., caproniana, marasca, and austera), butlarge differences in the acid content of thedifferent types can be expected (Grafe andSchuster, 2014). Furthermore, contrastingdata exist regarding the content of organicacids in sour cherry fruit, even for the samecultivars. F€uzfai et al. (2004) reported that
malic acid contents of the fruit of the ‘‘au-thentic sour cherry’’ cultivars �Erdi b€oterm€oand K�antorj�anosi were 12.7 and 15.3 mg·g–1
FW, respectively (these values were calcu-lated because their contents were expressedas the percentage of the DM); the content inthe flesh of citric, quinic, and stearic acidswere approximately two orders of magnitudelower than that of malic acid, and tartaric acidwas not reported. In contrast, for �Erdi b€oterm€oand K�antorj�anosi (indicated as K�antor j�anosi3), Ficzec et al. (2015) reported that malic acidcontents at optimal harvest time were 2.5 and3.8 mg·g–1 FW, respectively, and that thecontents of succinic acid and tartaric acid wereapproximately half that of malic acid. In oursamples (analyzed by ion-exchange chroma-tography), the contents of acids other than
malic were very low or undetectable. Themalate content of sour cherry fruit (26.7–48.4 mg·g–1 FW) found in the present studywas higher than that reported in the literature,and even higher than that reported by F€uzfaiet al. (2004).Walker et al. (2011) found that insweet cherry (cv. Durone Nero II), malic acidaccumulates mainly during phase III ofgrowth, reaching a peak concentration of 8mg·g–1 FW, and that a small decrease in itsconcentration in ripe fruit was due to dilutionbut not to dissimilation. Ficzec et al. (2015)showed minor changes in malic acid during thepre-ripening and post-ripening periods. The av-erage malic acid content of germplasm collec-tions of sweet cherry has been reported to varyfrom 5.7 to 8.8 mg·g–1 FW, with a minimumvalue of 3.5mg·g–1 FWand amaximumvalue of14.1 mg·g–1 FW (Ballistreri et al., 2013; Useniket al., 2008). The results of the present studyindicated that Morello sour cherry has consider-ably higher levels of malic acid than do sweetcherry and other sour cherry cultivars studied sofar.
The ratio of sugars to organic acids is animportant parameter in terms of taste, con-sumer acceptance, and processing into fruitproducts (Famiani et al., 2015). Sour cherrieswith a high sugar-to-acid ratio can be suitablefor direct consumption, whereas those with alow sugar-to-acid ratio are better suited forprocessing into fruit products (Papp et al.,2010). The data of a survey regarding sweetcherry cultivars (Table 3 in Ballistreri et al.,2013) indicated an average sugar (glucose +fructose + sorbitol)-to-malic acid ratio of20.9, with a minimum value of 14.7. F€uzfaiet al. (2004) analyzed ‘‘authentic sourcherry’’ and found an average sugar-to-malic acid ratio of 7.9, with small variationsbetween cultivars. Higher values of this ratiofor sour cherry were reported by Ficzec et al.(2015) (average value, 21.9; range, 14.7–30.2) (recalculated using data regarding op-timal picking time from Table 6 of thisarticle). Interestingly, in Italy, the sourcherries of the Morello type, named ‘‘vis-ciola,’’ have been traditionally used only forprocessing into fruit products. This is becauseof the low sugar-to-malate ratio found duringour study (mean, 3.3; range, 1.3–5.6)(Fig. 3B), and it is a relevant aspect in termsof quality-related fruit market destinations(Famiani et al., 2015).
Various health-promoting qualities havebeen attributed to the consumption of cherriesand their products because they appear to haveprotective action against serious illnesses(McCune et al., 2011) by reducing markersfor oxidative stress and inflammation and byimproving sleep, cognitive function, and re-covery from pain after heavy exercise (Kelleyet al., 2018). Many of these effects of cherrieshave been linked to the presence of antioxidantcompounds, particularly polyphenols (includ-ing anthocyanins) (McCune et al., 2011;Kelley et al., 2018). The sour cherry antioxi-dant capacity is largely dependent on itspolyphenol content, and, in cherry, the mostabundant polyphenols are represented by an-thocyanins (Alba et al., 2019). The cyanidin
Fig. 3. Malic acid content (A) and sugar-to-malate ratio (B) in the flesh of sour cherry fruit collected indifferent geographical areas of the region of Umbria. Values represent the mean ± SE. Data wereanalyzed according to a one-way analysis of variance (ANOVA). The bars indicate the least significantdifference (LSD) between means according to Fisher’s post-hoc test (P # 0.05).
1010 HORTSCIENCE VOL. 54(6) JUNE 2019
3-glucosyl rutinoside, a specific sour cherryanthocyanin (Blando et al., 2004), was themost abundant anthocyanin regardless of thegenetic and environmental effects. This isrelevant in terms of the effect of the trans-formation process because cyanidin 3-glucosyl-rutinoside appears to be more easilyextractable and more stable than other antho-cyanins in other fruit types (McDougall, 2005;Toydemir et al., 2013).
Conclusions
The sour cherry trees sampled in this workwere tested genetically and were unequivo-cally attributed to the Prunus cerasus species
and botanical cultivar austera (Gaudet et al.,2018). Hence, we can infer that the highmalate content and low sugar-to-malate ratio(lower than any other published value forsour cherry) are distinctive nutritionally re-lated quality characteristics of Morellocherries. All fruit compositional parameters(weight, DM contents, carbohydrates, malicacid, and anthocyanins) showed large vari-ability that was affected by both the genotypeand growing environment. The results in-dicated that the soluble sugars (glucose +fructose + sucrose)-to-sorbitol ratio could beused as an index to decide the best use for thefruit. Fruit with a high soluble sugar-to-sorbitol ratio can be preferentially used for
jelly or fermented beverages. Fruit with a lowsoluble sugars-to-sorbitol ratio, particularlydue to high sorbitol, might be used to producefunctional food with laxative properties.Overall, the results show that Italy possessesa valuable germplasm reservoir for Morellocherries, and different genotypes could beuseful for producing cherries that can beexploited to respond to the market require-ments for products that recall tradition andoffer high-quality standards in terms of taste,appearance, nutritional quality, and health.The genotypes that were evaluated should bepropagated and planted in a collection field tomaintain them and, possibly, use them asmother plants for propagation.
Fig. 4. Anthocyanin composition (A–F) in the flesh of sour cherry fruit collected in different geographical areas of the region of Umbria. Values represent themean ± SE. Data were analyzed according to a one-way analysis of variance (ANOVA). The bars indicate the least significant difference (LSD) betweenmeansaccording to Fisher’s post-hoc test (P # 0.05).
HORTSCIENCE VOL. 54(6) JUNE 2019 1011
Literature Cited
Alba, C.M.A., M. Daya, and C. Franck. 2019. Tartcherries and health: Current knowledge andneed for a better understanding of the fate ofphytochemicals in the human gastrointestinaltract. Crit. Rev. Food Sci. Nutr. 59(4):626–638.
Alrgei, H.O.S., D.�C. Dabi�c, M.M. Nati�c, V.S.Rakonjac, D. Milojkovi�c-Opsenica, �Z.L.Te�si�c, and M. Milica. 2014. Chemical pro-file of major taste- and health-related com-pounds of Obla�cinska sour cherry. J. Sci.Food Agr. 96:1241–1251.
Ballistreri, G., A. Continella, A. Gentile, M.Amenta, S. Fabroni, and P. Rapisarda. 2013.Fruit quality and bioactive compounds relevantto human health of sweet cherry (Prunus aviumL.) cultivars grown in Italy. Food Chem.140:630–638.
Blando, F., C. Gerardi, and I. Nicoletti. 2004. Sourcherry (Prunus cerasus L.) anthocyanins asingredients for functional foods. BioMed.Res. Inter. 5:253–258.
Burt, B.A. 2006. The use of sorbitol-and xylitol-sweetened chewing gum in caries control. J.Amer. Dent. Assoc. 137:190–196.
Chaovanalikit, A. and R.E. Wrolstad. 2004. Totalanthocyanins and total phenolics of fresh andprocessed cherries and their antioxidant prop-erties. J. Food Sci. 69:FCT 67–72.
da Silva Dias, J.C. 2015. Biodiversity and plantbreeding as tools for harmony between modernagriculture production and the environment, p.3–44. In: M. Caliskan (ed.). Molecular ap-proaches to genetic diversity. InTechOpen.
Di Matteo, A., R. Russo, G. Graziani, A. Ritieni,and C. Di Vaio. 2016. Characterization ofautochthonous sweet cherry cultivars (Prunusavium L.) of southern Italy for fruit quality,bioactive compounds and antioxidant activity.J. Sci. Food Agr. 97(9):2782–2794.
Di Vaio, C., N. Marallo, G. Graziani, A. Ritieni,and A. Di Matteo. 2015. Evaluation of fruitquality, bioactive compounds and total antiox-idant activity of flat peach cultivars. J. Sci.Food Agr. 95(10):2124–2131.
Escribano, S., W.V. Biasi, R. Lerud, D.C. Slaugh-ter, and E.J. Mitcham. 2017. Non-destructiveprediction of soluble solids and dry mattercontent using NIR spectroscopy and its re-lationship with sensory quality in sweetcherries. Postharvest Biol. Technol. 128:112–120.
Famiani, F., A. Battistelli, S. Moscatello, J.G.Cruz-Castillo, and R.P. Walker. 2015. Theorganic acids that are accumulated in the fleshof fruits: Occurrence, metabolism and factorsaffecting their contents-a review. Rev. Cha-pingo Ser. Hortic. 21:97–128.
Faniadis, D., P.D. Drogoudi, and M. Vasilakakis.2010. Effects of cultivar, orchard elevation, andstorage on fruit quality characters of sweetcherry (Prunus avium L.). Scientia Hort.125:301–304.
FAOSTAT. 2017. Food and Agriculture Organiza-tion of the United Nations. Food and agriculturedata. <http://www.fao.org/faostat/en/#data>.
Ficzek, G., M. Lad�anyi, G. V�egv�ari, and M. T�oth.2015. Mathematical modelling of the accumu-lation of carbohydrates and organic acids
throughout the ripening process of Hungariansour cherry cultivars. Trees 29:797–807.
F€uzfai, Z., Z.F. Katona, E. Kov�acs, and I.Moln�ar-Perl. 2004. Simultaneous identifica-tion and quantification of the sugar, sugaralcohol, and carboxylic acid contents of sourcherry, apple, and ber fruits, as their trime-thylsilyl derivatives, by gas chromatogra-phy–mass spectrometry. J. Agr. Food Chem.52:7444–7452.
Gao, Z., L. Maurousset, R. Lemoine, S.D. Yoo, S.Van Nocker, and W. Loescher. 2003. Cloning,expression, and characterization of sorbitol trans-porters from developing sour cherry fruit and leafsink tissues. Plant Physiol. 131:1566–1575.
Gaudet, M., F. Villani, M. Cherubini, I. Beritognolo,I. Dalla Ragione, S. Proietti, and C. Mattioni.2018. Genetic diversity and molecular finger-printing of Prunus cerasus var. austera fromcentral Italy. Plant Biosyst. 1–7, doi. 10.1080/11263504.2018.1498403.
Goncxalves, B., A.P. Silva, J. Moutinho-Pereira, E.Bacelar, E. Rosa, and A.S. Meyer. 2007. Effectof ripeness and postharvest storage on theevolution of colour and anthocyanins incherries (Prunus avium L.). Food Chem.103:976–984.
Grafe, C. and M. Schuster. 2014. Physicochemicalcharacterization of fruit quality traits in aGerman sour cherry collection. Scientia Hort.180:24–31.
Grafe, C., M. Hofer, and M. Schuster. 2009.Evaluation of dry matter in sour cherry (Prunuscerasus L.). Acta Hort. (839):281–286.
Kalt, W. 2006. Effects of production and process-ing factors on major fruit and vegetable anti-oxidants. J. Food Sci. 70:R11–R19.
Kelley, D.S., Y. Adkins, and K.D. Laugero. 2018.A review of the health benefits of cherries.Nutrients 10:368.
Ko1odziejczyk, K., M. S�ojka, M. Abadias, I.Vi~nas, S. Guyot, and A. Baron. 2013. Poly-phenol composition, antioxidant capacity, andantimicrobial activity of the extracts obtainedfrom industrial sour cherry pomace. Ind.Crops Prod. 51:279–288.
Marchese, A., D. Giovannini, A. Leone, R.Mafrica, M. Palasciano, C. Cantini, C. DiVaio, F.R. De Salvador, G. Giacalone, T.Caruso, and F.P. Marra. 2017. S-genotypeidentification, genetic diversity and struc-ture analysis of Italian sweet cherry germ-plasm. Tree Genet. Genomes 13(5):93.
McCune, L.M., C. Kubota, N.R. Stendell-Hollis,and C.A. Thomson. 2011. Cherries and health:A review. Crit. Rev. Food Sci. Nutr. 51:1–12.
McDougall, G.J., P. Dobson, P. Smith, A. Blake,and D. Stewart. 2005. Assessing potential bio-availability of raspberry anthocyanins using anin vitro digestion system. J. Agr. Food Chem.53(15):5896–5904.
Mikulic-Petkovsek, M., F. Stampar, R. Veberic,and H. Sircelj. 2016. Wild Prunus fruit speciesas a rich source of bioactive compounds. J.Food Sci. 81:C1928–C1937.
Olmstead, J.W., A.F. Iezzoni, and M.D. Whiting.2007. Genotypic differences in sweet cherryfruit size are primarily a function of cellnumber. J. Amer. Soc. Hort. Sci. 132:697–703.
Papapetros, S., A. Louppis, I. Kosma, S. Kontakos,A. Badeka, and M.G. Kontominas. 2018. Char-acterization and differentiation of botanical andgeographical origin of selected popular sweetcherry cultivars grown in Greece. J. FoodCompos. Anal. 72:48–56.
Papp, N., B. Szilv�assy, L. Abrank�o, T. Szab�o, P.Pfeiffer, Z. Szab�o, and A. Heged}us. 2010. Mainquality attributes and antioxidants in Hungariansour cherries: Identification of genotypes withenhanced functional properties. Intl. J. FoodSci. Technol. 45:395–402.
Parrou, J.L.,M.A. Teste, and J. Francxois. 1997. Effectsof various types of stress on the metabolism ofreserve carbohydrates in Saccharomyces cerevi-siae: Genetic evidence for a stress-induced recy-cling of glycogen and trehalose. Microbiology143:1891–1900.
Rakonjac, V., M.F. Ak�si�c, D. Nikoli�c, D.Milatovi�c, and S. �Coli�c. 2010. Morphologicalcharacterization of ‘Obla�cinska’ sour cherryby multivariate analysis. Scientia Hort.125(4):679–684.
Rippe, J.M. and T.J. Angelopoulos. 2015. Sugarsand health controversies: What does the sci-ence say? Adv. Nutr. 6(4):493S–503S.
Rodrigues, L.C., M.R. Morales, A.J.B. Fernandes,and J.M. Ortiz. 2008. Morphological charac-terization of sweet and sour cherry cultivars in agermplasm bank at Portugal. Genet. ResourcesCrop Evol. 55(4):593–601.
Siddiq, M., A. Iezzoni, A. Khan, P. Breen, A.M.Sebolt, K.D. Dolan, and R. Ravi. 2011. Char-acterization of new tart cherry (Prunus cerasusL.): Selections based on fruit quality, totalanthocyanins, and antioxidant capacity. Intl.J. Food Prop. 14:471–480.
St�eger-M�at�e, M. 2012. Sweet and tart cherries, p.433–446. In: N.K. Sinha, J.S. Sidhu, J. Barta,J.S.B. Wu, and M.P. Cano (eds.). Handbook offruits and fruit processing. 2nd ed. Wiley-Blackwell.
Succi, M., P. Tremonte, G. Pannella, L. Tipaldi,A. Cozzolino, R. Romaniello, E. Sorrentino,and R. Coppola. 2017. Pre-cultivation withselected prebiotics enhances the survival andthe stress response of Lactobacillus rhamno-sus strains in simulated gastrointestinal tran-sit. Front. Microbiol. 8:1067.
Toydemir, G., E. Capanoglu, M.V.G. Roldan,R.C. de Vos, D. Boyacioglu, R.D. Hall, andJ. Beekwilder. 2013. Industrial processingeffects on phenolic compounds in sour cherry(Prunus cerasus L.) fruit. Food Res. Intl.53:218–225.
Usenik, V., J. Fab�ci�c, and F. �Stampar. 2008.Sugars, organic acids, phenolic compositionand antioxidant activity of sweet cherry (Pru-nus avium L.). Food Chem. 107:185–192.
Vuleti�c, M.V., K. Dugali�c, I. Mihaljevi�c, V.Toma�s, D. Vukovi�c, Z. Zduni�c, B. Pu�skar,and Z. Jurkovi�c. 2017. Season, location andcultivar influence on bioactive compounds ofsour cherry fruits. Plant Soil Environ. 63:389–395.
Walker, R.P., A. Battistelli, S. Moscatello, Z.H.Chen, R.C. Leegood, and F. Famiani. 2011.Phosphoenolpyruvate carboxykinase in cherry(Prunus avium L.) fruit during development. J.Expt. Bot. 62:5357–5365.
1012 HORTSCIENCE VOL. 54(6) JUNE 2019
Supplemental Table 1. Ranking code, sampling code, clone identified, geographical localization, and geographical descriptors of plants collected from the Umbriaregion.z
Fruit wt ranking Sampling code Area of the Umbria region Municipality Alt (m.s.l.) Lat. N Long. E
1 82 Orvieto Orvieto 347 42�67#98$ 12�14#11$2 103 Valnerina Norcia 596 42�78#16$ 13�10#05$3 38 Orvieto Orvieto 309 42�72#00$ 12�11#18$4 147 Amerini Hills Narni 238 42�46#06$ 12�50#56$5 52 Orvieto Orvieto 313 42�71#78$ 12�11#50$6 14 Orvieto Ficulle 465 42�83#2$1$ 12�06#94$7 12 Orvieto Porano 397 42�69#76$ 12�10#75$8 130 Amerini Hills Narni 278 42�46#55$ 12�50#71$9 9 Orvieto Orvieto 524 42�70#06$ 12�04#35$10 86 Upper Tiber Valley Pietralunga 678 43�50#04$ 12�47#27$11 27 Orvieto Allerona 404 42�79#57$ 12�03#65$12 89 Upper Tiber Valley Pietralunga 688 43�50#18$ 12�47#23$13 148 Amerini Hills Nami 275 42�46#69$ 12�50#72$14 48 Orvieto Castel Viscardo 165 42�76#70$ 12�04#03$15 100 Upper Tiber Valley Gubbio 702 43�49#91$ 12�47#58$16 125 Valnerina Fabro 255 42�87#47$ 12�04#73$17 101 Orvieto Norcia 590 42�79#24$ 13�09#71$18 31 Orvieto Orvieto 211 42�72#14$ 12�09#99$19 83 Upper Tiber Valley Pietralunga 707 43�49#87$ 12�47#66$20 18 Orvieto Ficulle 487 42�84#94$ 12�07#22$21 105 Valneria Norcia 786 42�74#00$ 13�12#37$22 132 Amerini Hills Narni 280 42�46#72$ 12�50#96$23 71 Orvieto Orvieto 139 42�74#10$ 12�09#10$24 102 Valnerina Norcia 590 42�79#20$ 13�09#70$25 16 Orvieto Ficulle 453 42�83#30$ 12�06#66$26 65 Orvieto Castel Giorgio 540 42�71#12$ 11�98#10$27 70 Orvieto Orvieto 131 42�74#03$ 12�09#51$28 56 Orvieto Castel Giorgio 500 42�70#43$ 11�98#03$29 123 Orvieto Fabro 319 42�86#50$ 12�01#15$30 97 Orvieto Gubbio 608 43�48#20$ 12�49#68$31 99 Upper Tiber Valley Gubbio 584 43�49#46$ 12�47#53$32 28 Upper Tiber Valley Orvieto 447 42�70#92$ 12�06#14$33 2 Orvieto Orvieto 317 42�70#85$ 12�08#12$34 92 Upper Tiber Valley Pietralunga 596 43�48#42$’ 12�49#47$35 67 Orvieto Orvieto 445 42�70#84$ 12�05#80$36 32 Orvieto Orvieto 506 42�67#45$ 12�06#08$37 81 Orvieto Porano 391 42�68#87$ 12�11#17$38 93 Upper Tiber Valley Gubbio 638 43�46#69$ 12�49#56$39 4 Orvieto Orvieto 320 42�70#80$ 12�08#16$40 50 Orvieto Orvieto 156 42�75#42$ 12�06#54$41 53 Orvieto Orvieto 463 42�70#06$ 12�07#23$zThe fruit weight ranking (1–41) identifies plants based on the fresh fruit weight; ranking is from heavier (1) to lighter (41). The sampling code is the originalsampling code used during field sampling procedures.
Supplemental Table 2. Pearson’s correlation coefficient for flesh dry matter (%) and sugar contents of sour cherry fruits.
DM % Glucose Fructose Sorbitol Total sugars
DM % 1.00Glucose 0.62** 1.00Fructose 0.51** 0.95** 1.00Sorbitol 0.78** 0.89** 0.82** 1.00Total sugars 0.64** 0.99** 0.97** 0.92** 1.00
HORTSCIENCE VOL. 54(6) JUNE 2019 1
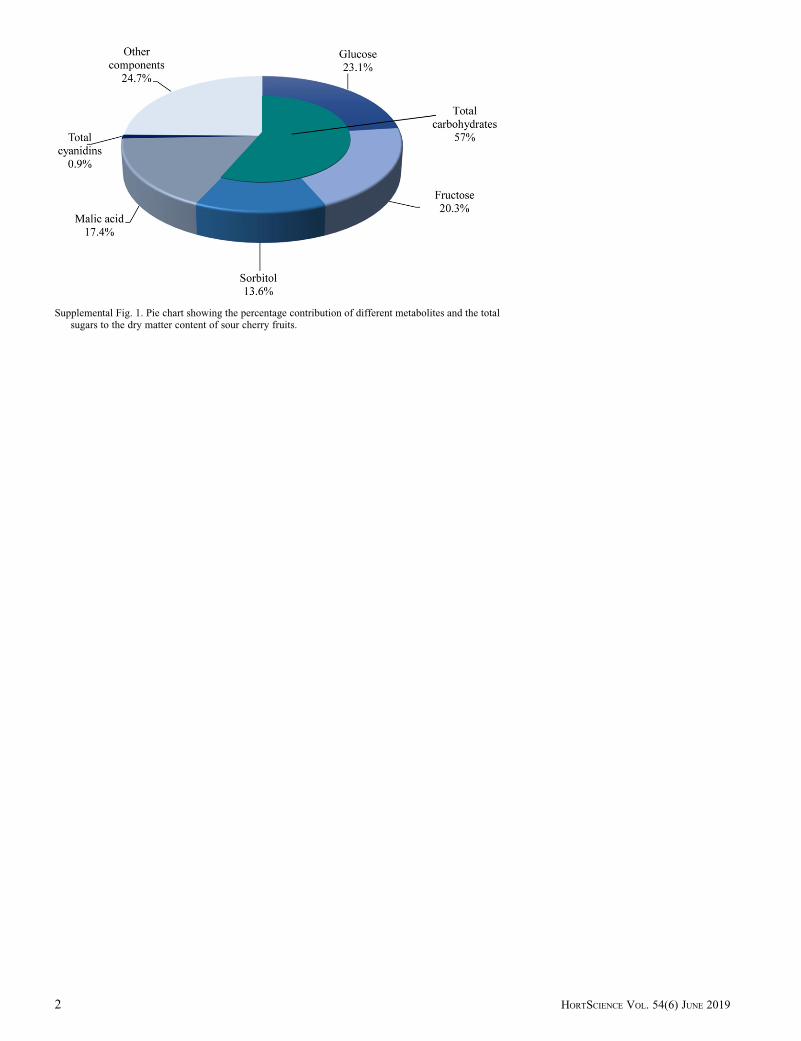
Supplemental Fig. 1. Pie chart showing the percentage contribution of different metabolites and the totalsugars to the dry matter content of sour cherry fruits.
2 HORTSCIENCE VOL. 54(6) JUNE 2019


![Cell Wall Changes in Nectarines (Prunus persica)'Nectarine fruit (Prunus persica L. Batsch var nectarina [Ait] maxim) ... Inc.). The columnwasmaintainedat 1000Cfor 2minandincreasedto](https://static.fdocuments.in/doc/165x107/5f12baf6290ffe2baf0f91a2/cell-wall-changes-in-nectarines-prunus-persica-nectarine-fruit-prunus-persica.jpg)