QUALITY 2017 MANAGEMENT P - Boston Public … Management Subrecipients ... A Medical Case Management...
20
QUALITY MANAGEMENT PLAN BOSTON EMA 2017 Boston Eligible Metropolitan Area Ryan White Treatment Modernization Act Part A & MAI Boston Public Health Commission Infectious Disease Bureau Ryan White Services Division
Transcript of QUALITY 2017 MANAGEMENT P - Boston Public … Management Subrecipients ... A Medical Case Management...

QUALITY
MANAGEMENT
PLAN
BOSTON EMA
2017
Boston Eligible Metropolitan Area
Ryan White Treatment Modernization Act Part A & MAI
Boston Public Health Commission
Infectious Disease Bureau
Ryan White Services Division

1
TABLE OF CONTENTS
Contents
Background & Introduction .......................................................................................................................... 2
Timeline of Quality Management Activities ................................................................................................ 2
Definitions..................................................................................................................................................... 3
Mission .......................................................................................................................................................... 4
Vision ............................................................................................................................................................ 4
FY 2017 Goals & Objectives ........................................................................................................................ 4
Components of Quality Management ........................................................................................................... 5
Infrastructure ................................................................................................................................................. 5
Ryan White Service Division Roles and Responsibilities ........................................................................... 6
Stakeholders .................................................................................................................................................. 7
Ryan White Boston EMA Planning Council ............................................................................................... 7
Planning Council Committees .............................................................................................................. 7
Quality Management Committee .......................................................................................................... 8
Quality Management Subrecipients ...................................................................................................... 8
Performance Measurement ......................................................................................................................... 10
Health Outcome Measures (see also Appendix C) ............................................................................. 10
Quality of Life Outcome Measures ..................................................................................................... 10
Clinical Chart Review ......................................................................................................................... 10
Results and Dissemination .................................................................................................................. 11
Capacity Building ....................................................................................................................................... 12
Subrecipients ....................................................................................................................................... 12
Planning Council ................................................................................................................................. 12
Recipient ............................................................................................................................................. 12
Internal Program Evaluation ....................................................................................................................... 12
Resources .................................................................................................................................................... 14

2
Background & Introduction
The Boston Eligible Metropolitan Area (EMA) consists of seven counties in Massachusetts (MA) and
three in southern New Hampshire (NH). The recipient for Part A funds is the Boston Public Health
Commission’s (BPHC) Ryan White Services Division within the Infectious Disease Bureau (IDB). The
Quality Management (QM) program was originally established to guide the development of Standards of
Care for HIV services in MA and has now evolved into a comprehensive quality improvement component
for the Boston EMA.
In FY 2016, 74 programs were funded at 35 agencies. The 13 direct service categories are medical case
management, dental services, drug reimbursement, food services, housing, mental health, psychosocial
support (including mental health & substance abuse), residential substance abuse, medical nutrition
therapy, and transportation, as well as MAI services (medical case management and psychosocial support
services). The Boston EMA was awarded $14.2 million and served 5,040 clients in FY 2016.
Timeline of Quality Management Activities
1995 - 2009 Established universal HIV service guidelines
Established external system to collect client level outcome data
2013 Partnered with RDE Systems to create a new cloud based client level data system,
e2Boston
2015 Launched client level Outcomes Module in e2Boston
2017 Initiate and support quality improvement projects to improve viral suppression
Train agencies without quality improvement programs about the basics of quality
improvement
2018 50% Part A funded agencies have an HIV-specific quality management plan
50% of Part A agencies have completed two quality improvement activities
2019 100% of Part A funded agencies have an HIV-specific quality management plan
100% of Part A agencies have completed two quality improvement activities

3
Definitions
Quality Management (QM) Program encompasses all quality management activities and consists of the
Grantee’s Client Services and specific Quality Management staff, the involvement of fiscal and data staff,
quality management subrecipients, the Boston EMA HIV Health Services Planning Council, and the
EMA Quality Management Committee.
Quality Assurance (QA) refers to a broad spectrum of evaluation activities aimed at ensuring
compliance with minimum quality standards. The primary aim of quality assurance is to demonstrate that
a service or product fulfills or meets a set of requirements or criteria. QA is identified as focusing on
“outcomes,” and CQI identified as focusing on “processes” as well as “outcomes.”
Quality Improvement (QI) refers to activities aimed at improving performance and is an approach to the
continuous study and improvement of the processes of providing services to meet the needs of the
individual and others.
Continuous Quality Improvement (CQI) refers to an ongoing effort to increase an agency’s approach
to manage performance, motivate improvement, and capture lessons learned in areas that may or may not
be measured as part of accreditation. It is an ongoing effort to improve the efficiency, effectiveness,
quality, or performance of services, processes, capacities, and outcomes.
Plan, Do, Study, Act (PDSA) Cycle is a model of improvement used to test and implement changes in a
real work setting.
Plan: Identify Problems
Do: Use strategies/test that are designed to address the problem
Study: Collect and Analyze data to see if strategies have resulted in improvements
Act: If the strategies are effective, make them an ongoing activity; if not, return to the plan stage
Standards of Care (or Service Standards) are the minimal level of service or care that a Ryan White
HIV/AIDS Program (RWHAP) funded agency or provider may offer within a state, territory or
jurisdiction.
Recipient in this case the Boston Public Health Commission is the principal awardee of grant money
from HRSA. The recipient will implement work plans to ensure that the project’s goals and objectives are
achieved in an efficient and timely manner.
Subrecipient is an entity that receives a sub award from a recipient or another subrecipient under an
award of financial assistance and is accountable to the recipient or other subrecipient for the use of the
Federal funds provided by the sub award.
e2Boston is a cloud based electronic data system used to collect demographic and service utilization data
from subrecipients.
Demographic Data are client characteristics; such as, race, ethnicity, age and gender.
Service Utilization Data are units of services, types of service and service dates.

4
Mission
The Quality Management Program (QMP) will work with all subrecipients to continuously improve the
quality of care and health outcomes among People Living with HIV (PLWH) in the Boston EMA,
particularly achievement and maintenance of HIV viral suppression.
Vision
The QMP will improve patient care, health outcomes, and patient satisfaction for PLWH throughout the
Boston EMA. To achieve this vision, the Ryan White Division staff will hold itself to the highest internal
standards to support a service delivery system that provides the high quality care. The commitment is to:
Share information, including current research and evaluation findings, with stakeholders.
Utilize all available internal and external data sources in an effort to best understand the service
population.
Consider and value the input of all stakeholders, especially consumers of HIV services.
Incorporate clinical guidelines and best practices into quality management activities.
Integrate quality management activities within Client Services and Planning Council activities.
Recognize the importance of a comprehensive continuum of care, including a combination of
core medical and support services.
Identify emerging needs and barriers to care in order to facilitate response.
Educate subrecipients, consumers, and the community about quality improvement.
Facilitate quality improvement activities.
FY 2017 Goals & Objectives
The Boston EMA Integrated Care Plan (ICP) lays out several goals for BPHC, MDPH and partner
organizations to achieve, based on known gaps and client needs within the EMA. The ICP goals informed
the first goal of the QM program, but two additional goals were chosen to establish processes that will
inform future QM activities. During FY17, BPHC QM will focus on increasing the proportion of virally
suppressed clients seen at agencies funded to provide medical case management, create an external
quality planning body, and formalize processes to ensure the QM plan is revised annually.
Goal 1: Promote health and wellbeing of all Boston EMA Part A clients and reduce the incidence of HIV.
In FY17, BPHC QM will work toward this goal by increasing viral suppression among Boston EMA Part
A Medical Case Management clients from 85% to 88%.
Goal 2: Establish a Boston EMA Part A Quality Management committee.
Goal 3: Maintain a Quality Management Plan for the purpose of guiding the formal evaluation and
assessment of the quality of services provided in the Boston EMA.

5
Components of Quality Management
The infrastructure of BPHC, external stakeholders, the performance measurement system and capacity
building activities are integral to the success of the QM program. The infrastructure within BPHC will
play a key role in achieving QM goals because all Ryan White Services staff will play a part in QM
activities. All staff is expected to understand the basic principles of quality management and quality
improvement, and be able to communicate that knowledge to subrecipients or community partners. BPHC
will also work with Jon Snow Incorporated (JSI) and Boston University to gather data for QM activities
and lead quality improvement initiatives among subrecipients. Community stakeholders will advise
BPHC about QM activities through the QM Committee and other events that foster discussion about the
HIV service system, including Planning Council Meetings and community events.
The performance management system, or e2Boston, allows staff to track client level data in real time and
offers a window into agency and client performance at any time. e2Boston is critical for tracking progress
towards goals such as viral suppression and providing additional data to inform programmatic decisions.
The QM program has numerous resources to achieve the stated goals, including a strong medical case
management training program, the National Quality Center, and staff that are familiar with quality
management principles. Progress towards FY17 goals will be tracked through measurable objectives and
concrete action steps. This information will be routinely shared with Ryan White Services Division staff
as well as the QM committee. The goals are outlined with greater detail in the Appendix.
Infrastructure
The Part A Quality Management Program is housed within the Ryan White Services Division. The
division is one of four major departments within IDB, which includes the CDC Division and TB Clinic.
BPHC is the largest local health department in MA and is responsible for a broad range of public health
activities including disease surveillance and intervention services. The QM program supports internal
activities within the IDB and the Commission’s Office of Public Health Accreditation and Quality
Improvement to evaluate impact of services and community engagement efforts.
Dedicated QM staff lead all internal and external Quality Improvement activities. They report to a Ryan
White Services Division Director, who is responsible for overall administration of the Part A grant. The
Division Director reports to the ID Bureau Director, who also provides supervision and clinical expertise
to the QM program. Figure 1 is an organizational chart of the Infectious Disease Bureau:

6
Figure 1: Organizational Chart
Ryan White Service Division Roles and Responsibilities
Director, Ryan White Services Division: Supervises all activities related to Quality Management. The
work and implementation plan developed by the Sr. Program Coordinator of QM team requires the
approval of the Director of Ryan White Services Division. The director facilitates the integration of other
Ryan White Services Division staff into QM initiatives. Supervises QM staff and supports the process of
developing the work and implementation plan.
Quality Management Senior Program Coordinator: Responsible for the daily management of all QM
activities. QM Program Coordinators oversee the subcontracted work, monitor client health outcome
progress, and work to ensure that stakeholders, including subrecipients, have the resources that can aid
them in being successful.
Quality Management Program Coordinators: Analyze demographic and utilization data in order to
monitor trends in the local epidemic, identify issues which may need additional research, and report back
to stakeholders, including the Planning Council for service planning purposes.
Agency Monitoring Program Coordinators: Facilitate activities including, but not limited to, annual
subrecipient site visits, assisting subrecipients with the development of Plan of Corrective Actions, and
providing technical assistance to ensure agencies are adherent to the Standards of Care.
Contract Management Program Coordinators: Monitors subrecipients year-round for timely submission
of data and meeting service delivery quotas. This includes monitoring the progress towards service
utilizations goals outlined in the scope of services, processing budget revisions, and providing year round
technical assistance to ensure subrecipients are adherent to the Standards of care.
Infectious Disease
Anita Barry
Infectious Disease
Administration Ryan White Services Division Dennis Brophy
Agency Monitoring
Contract Management
Quality Management
Education and Community Engagement
Planning Council
Executive NRAC SPEC
CDC Division TB Clinic
7
Infectious Disease Bureau Administration: Processes subrecipients’ invoices, manages budgets, and
performs annual fiscal site visits.
CDC Division: CDC Data Manager works with QM staff to oversee development and maintenance of
e2Boston and conducts all site administrator duties.
Stakeholders
Ryan White Boston EMA Planning Council
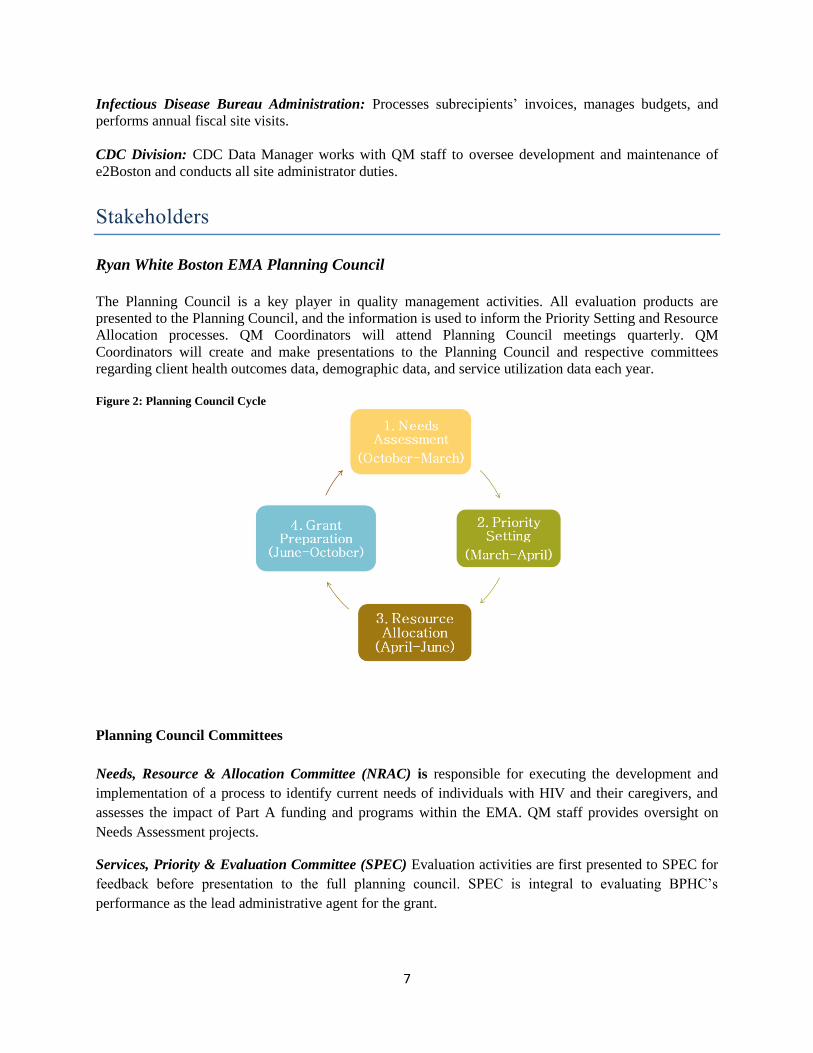
The Planning Council is a key player in quality management activities. All evaluation products are
presented to the Planning Council, and the information is used to inform the Priority Setting and Resource
Allocation processes. QM Coordinators will attend Planning Council meetings quarterly. QM
Coordinators will create and make presentations to the Planning Council and respective committees
regarding client health outcomes data, demographic data, and service utilization data each year.
Figure 2: Planning Council Cycle
Planning Council Committees
Needs, Resource & Allocation Committee (NRAC) is responsible for executing the development and
implementation of a process to identify current needs of individuals with HIV and their caregivers, and
assesses the impact of Part A funding and programs within the EMA. QM staff provides oversight on
Needs Assessment projects.
Services, Priority & Evaluation Committee (SPEC) Evaluation activities are first presented to SPEC for
feedback before presentation to the full planning council. SPEC is integral to evaluating BPHC’s
performance as the lead administrative agent for the grant.

8
Quality Management Committee
This formal committee will work with the Quality Management team to monitor the progress of QM
objectives. Members of the QM Committee provide feedback while reports are in draft stage, review
research protocols/tools, and help shape the overall Quality Management Program. Each year, the QM
Committee includes suggestions for future evaluation projects in their annual year-end report.
Quality Management Subrecipients
John Snow Inc. (JSI) The subrecipient utilizes staff with expertise in medical record abstraction, data
analysis, and qualitative research to conduct the Clinical Chart Review project and other activities for the
grantee. JSI has the expertise, technical skills, and capacity needed to administer quality management
studies in the Boston EMA. JSI helps design the studies, analyze the data, and communicate the results to
BPHC and the Planning Council.
Communication: The Quality Management Coordinators manage the Evaluation contracts and
communicate with JSI frequently regarding project progress. QM staff is the primary point of contact for
JSI, and QM staff is responsible for including the Ryan White Division Director and Infectious Disease
Bureau Director in key project decisions. Planning meetings are held throughout the year, as needed. JSI
is also required to submit quarterly progress reports to the Grantee.
Boston University (BU): The Boston University School of Public Health – Center for Advancing Health
Policy and Practice (CAHPP) is funded to analyze disparities in achieving health outcomes among PLWH
in the Boston EMA. CAHPP’s organizational mission is to advance the well-being and health of
vulnerable populations.
The Performance Gap Analysis includes examination of the provision of core services and support
services among affected populations. This project is intended to serve as a tool to guide the Council’s
work in the upcoming years in making decisions about the HIV service gaps in the Boston EMA. This
analysis looks to identify barriers that prevent PLWH both in and out of care from receiving needed
services or from continuing in care, including an assessment of unmet needs for PLWH who know their
HIV status but are not in care and strategies to reach out to those unaware of their status. Data will be
gathered through several focus groups among HIV care providers and PLWH, as well as consumer and
provider surveys distributed throughout the Boston EMA. CAHPP will also provide recommendations to
address disparities and information to promote quality improvement activities and innovations.
The study will focus on special populations identified in previous Planning Council and BPHC work.
These populations have been selected based on a combination of variables below:
Age
Gender
Race and ethnicity
Year of diagnosis
Commonly occurring comorbidities
Viral suppression rates

9
Communication: Planning Council Support staff regularly holds conference calls with BU staff to discuss
project updates. BU is scheduled to present preliminary study results to the Planning Council in March
2017 and publish a final report in April, 2017.
Subrecipients: Providers are engaged in quality management through the annual Provider Training,
where they meet the Quality Management team and learn about new features in e2Boston or new
reporting requirements. The JSI program requires the cooperation of providers while performing
evaluation studies; the training is a way to introduce providers to the annual quality management
initiatives and explain how they can help make the projects successful. All service providers also have
the option to request quality management technical assistance throughout the year.
Communication The Quality Management team communicates directly with Providers at the end of the
2nd
and 4th quarters for submission of client outcome data. Every other year during an agency’s site visit,
a Quality Management Coordinator reviews the Standards of Care with staff to ensure their Part A and/or
MAI programs are providing the quality of service expected by BPHC. Providers can also request
technical assistance for outcome submission or compliance with the Standards of Care at any point
throughout the fiscal year.

10
Performance Measurement
Quality Management performance measurement activities include reviewing and analyzing client health
and outcome information, stratifying outcome measurement information by demographic characteristics,
and using clinical chart review data for quality improvement.
BPHC collects health and quality of life outcomes through e2Boston. Providers are required to submit
outcome reports for each client they serve according to the Client Clock Model. The Client Clock Model
is based on outcome due dates of service utilization patterns for each client. When a client access
services, he is then considered eligible for a report and the report is due six months from the date of
service. One outcome report will cover all services received within the six month period. After that period
expires, the client is considered ineligible for submission until the client receives another service.
Health Outcome Measures (see also Appendix C)
1. CD-4 counts – client has a CD-4 count greater than 500
2. Viral load – client has HIV viral load less than 75 or an undetectable level
3. Date of most recent HIV medical appointment – month and year in which client was last
seen by their HIV medical provider (to monitor whether clients are receiving care every
six months)
4. Adherence to prescribed HIV medication – client always adheres to HIV medications as
prescribed
5. Active engaged with medical case management program – to monitor whether or not a
client is receiving medical case management services, and where.
Quality of Life Outcome Measures
6. Impact of side effects from HIV medications – client has no side effects or side effects
are not impacting activities of daily living
7. Severity of side effects of HIV medications – client has no side effects
8. Mental health status – client shows no indication of mental health problems
9. Access to support network – has very strong personal support network(s) that can be
consistently relied upon
10. Care Adherence – client is often or almost always able to attend HIV-related
appointments
11. Housing status – client has stable and satisfactory housing
Clinical Chart Review
JSI is responsible for evaluating quality of care through clinical chart reviews every two years at medical
sites providing medical case management in the Boston EMA. This information forms a foundation for
agencies to initiate quality improvement projects. Clinical chart review reports and special evaluation
reports using these data are produced every other year, creating a constant stream of incoming knowledge
for Quality Management staff. JSI is also responsible for the dissemination of feedback to the clinical
sites and site-specific data is made available to the Grantee. To focus attention of the clinical staff on the

11
quality management findings, JSI staff prepares summary presentations for each clinic and delivers them
via webcast, conference call or in person for staff use and discussion. The information focuses on key
process and clinical indicators, comparing earlier rounds of data collection with the most recent round, to
examine trends and identify areas in need of improvement. Discussions explore underlying problems or
successes from the individual providers’ perspectives and generate new questions and requests for
focused technical assistance.
The Quality Management team arranges meetings and conference calls with JSI to discuss projects, as
needed. Regular communication about ongoing evaluation projects helps to prevent issues and allows the
Quality Management Program Coordinators to help shape the reports/studies.
The clinical performance indicators evaluated are the current HAB measures: medical visits; CD4 count;
PCP prophylaxis; antiretroviral therapy; Hepatitis A and B vaccinations; Hepatitis C treatment when
applicable; pneumococcal vaccination; and Pap smears among female clients.
Results and Dissemination
Results from reports and research are disseminated by various means including the Boston Public Health
Commission website, provider forums, email communication to providers, and multiple presentations at
the Planning Council and committee meetings. The information collected through JSI and BU work is
important for funded agencies in the services they provide and also for the Planning Council in their
decision-making processes. The Quality Management Program reviews all reports and uses the
information to monitor trends or changes in populations, identify gaps of knowledge, and share with
providers to inform best practices at their agencies.
The quality management program will release quarterly reports summarizing performance measures
system wide for all subrecipients to review. Additional reports are released annually which summarize
client demographic and client service utilization.

12
Capacity Building
Subrecipients
Quality Management Technical Assistance and Training: The QM Program Coordinator will be
responsible for consulting with agencies and will assist in the development of QI initiatives. A Technical
Assistance form will be introduced during FY 2017. This form will allow funded agencies to request
Technical Assistances and Training sessions focused on QI Activities.
Throughout the year, Providers can request technical assistance for any issues related to quality
improvement, outcome collection and submission. If there is a request for technical assistance, a Quality
Management Coordinator will visit the agency and conduct in-person training or invite staff to 1010 Mass
Ave. for training. Also, Providers are encouraged to contact the Quality Management Program if they
have new staff members learning the outcome system.
Planning Council
PCS Evaluation Training: PCS staff will offer several optional trainings to members of the Planning
Council. One of the annual trainings will be “Understanding Evaluation Materials,” facilitated by the QM
Coordinators. This covers the structure of the QM Program and introduces any different types of
evaluation study designs, how evaluation studies are used to inform service delivery, and various
interactive exercises using actual evaluation reports.
Recipient
National Quality Center Technical Assistance Webcasts: The Quality Management Program
Coordinators occasionally participate in the monthly NQC webcasts. The presentations provide a unique
opportunity for Quality Management Programs across the country to share information. Ryan White
Services staff is invited to join the webcasts and often provide a different perspective on the topic
presented. This builds quality management capacity among the team and serves as a refresher for staff
members who are not directly working in quality improvement.
Internal Training: QM Staff are responsible for training BPHC staff on best practices in quality
management and cover the basic knowledge of quality management and improvement.
Internal Program Evaluation
Quality Management Goals and Objectives: QM staff will use the goals and objectives table (Appendix
A) to track deadlines and project progress throughout the year.
Quality Management Team Meetings: QM staff will host regular check-in meetings to discuss the status
of projects, upcoming deadlines, and any pressing issues. This helps set manageable goals and keeps the
program running efficiently. The Program Coordinators also schedule monthly meetings with senior
Ryan White Division staff to keep them informed about quality management activities.

13
Updating Quality Management Plan: The Quality Management Program Coordinators will be
responsible for initiating the review and updating the Quality Management Plan at the end of each fiscal
year. Annual quality goals will be developed using the previous years’ evaluation study results, site visit
findings, service utilization data, and the annual client outcomes report. The Quality Management team
will create a draft plan that will be reviewed by the, the Director of the Ryan White Services Division and
senior staff, a Client Services Program Coordinator, and the Planning Council. Quality Management
Coordinators will incorporate feedback from the review team and a final plan will be signed off by the
Coordinators, management, and the Chair of the Evaluation Committee.
Outcome Measurement System Review: Each year QM staff will review Performance Measurement
indicators and assess their appropriateness for evaluating client health outcomes and the HIV service
delivery system. Performance measures which are no longer relevant need to be discarded or redefined.
Yearend report/Plan Do Study Act (PDSA): At the end of each fiscal year, QM staff will evaluate
program performance by comparing annual program goals to the work completed. Progress, or lack
thereof, will assist QM staff with creating goals for the following year.

14
Resources
National Quality Center (NQC) The National Quality Center’s website, webcasts, and staff are often
utilized by Quality Management Program Coordinators and shared with Program Coordinators and
service providers.
HRSA/HAB offers technical assistance (TA) calls and webcasts on a number of topics relevant to data
and quality of care.
Local Collaborative Groups Service providers will participate in local groups, such as NQC sponsored
regional quality management group.
Boston EMA Planning Council The Planning Council consists of an array of service providers, policy
makers, and consumers; this diversity of perspectives makes it an indispensable source of knowledge.
Frequent educational presentations by stakeholders in the Boston EMA HIV service delivery system also
make the Planning Council a valuable resource.
State Health Departments Collaborations with the Massachusetts Department of Public Health’s Office
of HIV/AIDS (MDPH) and New Hampshire’s STD/HIV Section within the Department of Health and
Human Services allow for access to pertinent data resources and research.
Data A wealth of data is available to the Quality Management Program, including internal client-level
utilization and demographic data. Collaborations with state counterparts in Massachusetts and New
Hampshire also allow for sharing of surveillance information.
Public Health Community the Quality Management Program engages the community through
networking at external trainings, supporting advocacy initiatives, and posting evaluation reports on the
Boston Public Health Commission’s public website.
Consumers It is absolutely essential to engage consumers in quality management. Consumers regularly
participate in annual evaluation studies. Providers help spread the word about Grantee-sponsored studies
to ensure consumer participation. Consumers participate in the Evaluation Committee, interviews, focus
groups, and satisfaction surveys. Additionally, the Quality Management team presents evaluation project
results at the Consumer Committee, another formal Planning Council committee.
Regional Quality Management Group The Regional Quality Management group brings HIV service
providers from Massachusetts together to share best practices in quality management and collaborate on
larger quality improvement activities. The group meets quarterly and is overseen by the National Quality
Center (NQC) (see nationalqualitycenter.org).

15
Appendix A: FY 2017 Annual Quality Goal
Goal 1: Increase viral suppression among Boston EMA Part A Medical Case Management clients
from 85% to 88%.
OBJECTIVES RESPONSIBLE
PARTY ACTION STEPS
Objective 1: Identify three
agencies with the lowest viral
suppression rates
BPHC QM staff Use e2Boston to identify racial/ethnic disparities in viral suppression at each agency.
Review prior Outcome Summary reports to identify previous disparities in viral
suppression
Objective 2: At each of the
three agencies, identify
common barrier to viral
suppression among
unsuppressed clients in the
affected demographic group
BPHC QM staff Guide agency to review unsuppressed client population to identify barriers that impact the
largest proportion of clients
Objective 3: Work with each
agency to develop targeted
quality improvement activity
around identified common
barrier
BPHC QM staff Review agency’s resources for quality improvement
Identify key staff to carry out QI activity
Provide training on PDSA
Assist agency with creating PDSA plan
Objective 4: Assist target
agencies with PDSA cycle
BPHC QM staff Monitor PDSA process, regularly check in with agency staff
At end of cycle, summarize findings and results
Objective 5: Review
additional MCM programs for
demographic disparities for
viral suppression
BPHC QM staff Share experiences from first three agencies with other funded MCM providers.
Goal 2: Establish a Boston EMA Part A Quality Management committee. Objective 1: Work with
Planning Council and other
stakeholders to create a CQM
committee
QM Staff, PCS
Staff, HIV Division
Director
Identify volunteers to form 3-6 person committee
Educate committee members about CQM and QI
Review QM plan and devise additional action steps to facilitate QI activities in the Boston
EMA
Objective 2: Identify agenda
for Committee
Committee
members, QM
staff, PCS
Review QM Plan and goals
Identify topics to explore through discussion in Committee
Objective 3: Set dates and
times for meetings one year out
Committee
members, QM
staff, PCS
Committee will meet regularly at least once per quarter

16
Goal 3: Maintain a Quality Management Plan for the purpose of guiding the formal evaluation and
assessment of the quality of services provided in the Boston EMA.
GOAL RESPONSIBLE
PARTY ACTION STEPS
Objective 1: Review and
update quality management
plan.
QM Coordinators,
SPEC, Director of
Ryan White
Services Division
and other Senior
BPHC staff
Update any cited numbers and dates
Revise outdated language about work processes
Conduct literature review to determine validity of performance indicators
Objective 2: Establish
guidelines for quality
management plans and
activities for funded agencies.
QM Coordinators Identify minimum requirements for sub-recipient QM work
Embed QM expectations into contracts reflecting legislative requirement
Discuss QM plans with providers and educate providers on how to write QM plans where
necessary.
Objective 3: Identify clinical
indicators which need
improvement using chart
reviews.
JSI, QM
Coordinators Compare updated chart review findings with previous findings.
Communicate with JSI re: differences.
Based on findings, create action steps.
QM coordinators participate in TA calls with Primary Medical Care providers.
Objective 4: Review outcome
measurement data related to
HAB measures bi-annually.
QM Coordinators Provide TA to providers regarding the new outcome measures, the new Access database
and the electronic uploading of files prior to the March submission deadline.
Present at Provider Training in April.
Clean data upon receiving.
Share data with JSI for analysis.
In conjunction with JSI, determine analyses for Annual Report (Part A & MAI separately).
Evaluate data completeness of newly included outcome measures.
Readdress outcome instructions based on successes and challenges of new reporting
requirements.
Objective 5: Determine the
effectiveness of the QM
Program infrastructure and
activities
QM Coordinators,
QM Committee Work with QM Committee to review annual goals and objectives
Identify which deadlines were met and which were not
If work is past deadline, create workplan to ensure timely completion

17
Appendix B: FY17 Quality Management Goal Logic Model
Goals
•Promote the health and wellbeing of PLWH
• Reduce incidence of HIV within the Boston EMA
Outcomes
•Increase Vrial Suprression rates from 85% to 88% within the Medical Case Management service category
Resources
•E2Boston
•Subrecipients
•Client Services
Activities
•Identify high acuity, virally unsupressed clients
•Develop plan to engage unsuppressed clients
•Conduct workgroups to share best practices
Outputs
•# of High Acuity Virally Suprressed clients identifeid
•# of "Reaching Suppression" plans
•# of workgroups held
Goals
•Establish a Boston EMA part A Quality Management Committee (QMC)
Outcomes
•Increase community participation in the planning and execution of quality management activities
Resources
•Planning Council Members
•Planning Council Support
•Subrecipients
•Client Services
Activities
•Develop clear role and responsibilities for a committee
•Recruit Planning Council Members to new committee
Outputs
•# of meetings of the new committee
•# of new members recruited
•Mission Statement for the new committee
Goals
•A quality management plan that is updated annually in collaboration with Quality Management Committee and guides quality management activites conducted by the Quality Managment program
Outcomes
• Improve the quality management process for the Boston EMA
Resources
• E2Boston
•QMC
•Health, Resources and Services Administration (HRSA)
• Subrecipients
•Client Services
•National EMA/TGA Network
• JSI
•Boston University
Activities
•Develop quality management activity timeline
•Develop clear guideslines of quality management activities expected by subrecipients
Outputs
• Timeline
•Guidelines for Subrecipients
• # of meetings with Quality Management Committee

18
Appendix C: FY 17 Performance Measures Targets
Service
Category
Performance
Measure
(N) Description (D) Description % Source
Medical Case
Management
Viral Suppression 2,027 Number of patients in the denominator with a
HIV viral load less than 75 copies/mL at last
HIV viral load test during the measurement
year
2,330 Number of patients with at least one HIV
viral load test during the measurement year
82 e2boston
Medical Case
Management
(MAI)
Viral Suppression 205 Number of patients in the denominator with a
HIV viral load less than 75 copies/mL at last
HIV viral load test during the measurement
year
260 Number of patients with at least one HIV
viral load test during the measurement year
79 e2boston
Housing Housing Status 15 Percentage of patients in the measurement
year there were homeless
510 Percentage of patients who received Ryan
White Part A funded housing services
during the measurement year
3 e2boston
AIDS Drug
Assistance Program
HIV Medical Visit
Frequency
65 Percentage of clients who reported an HIV
medical visit within the previous six months
85 Percentage of clients who received an
ADAP service during the measurement
year
76 e2boston
Oral Health Care HIV Medical Visit
Frequency
1,245 Percentage of clients who reported an HIV
medical visit within the previous six months
1,500 Percentage of clients who received an oral
health care service during the measurement
year
83 e2boston
Psychosocial
Support (Peer
Support)
Viral Suppression 497 Number of patients in the denominator with a
HIV viral load less than 75 copies/mL at last
HIV viral load test during the measurement
year
558 Number of patients with at least one HIV
viral load test during the measurement year
89 e2boston
Psychosocial
Support (Peer
Support, MAI)
Viral Suppression 142 Number of patients in the denominator with a
HIV viral load less than 75 copies/mL at last
HIV viral load test during the measurement
year
185 Number of patients with at least one HIV
viral load test during the measurement year
77 e2boston
Psychosocial
Support (Mental
Health)
HIV Medical Visit
Frequency
103 Percentage of clients who reported an HIV
medical visit within the previous six months
136 Percentage of clients who received an
psychosocial support – mental health
service during the measurement year
76 e2boston
Psychosocial
Support (Substance
Abuse)
Viral Suppression 124 Number of patients in the denominator with a
HIV viral load less than 75 copies/mL at last
HIV viral load test during the measurement
year
155 Number of patients with at least one HIV
viral load test during the measurement year
80 e2boston
Residential
Substance Abuse
Viral Suppression 75 Number of patients in the denominator with a
HIV viral load less than 75 copies/mL at last
HIV viral load test during the measurement
year
116 Number of patients with at least one HIV
viral load test during the measurement year
65 e2boston

19
Food Bank/Home
Delivered Meals
Viral Suppression 863 Number of patients in the denominator with a
HIV viral load less than 75 copies/mL at last
HIV viral load test during the measurement
year
1,215 Number of patients with at least one HIV
viral load test during the measurement year
71 e2boston
Medical
Transportation
HIV Medical Visit
Frequency
874 Percentage of clients who reported an HIV
medical visit within the previous six months
1,028 Percentage of clients who received a
medical transportation service during the
measurement year
85 e2boston
Medical Nutrition
Therapy
Viral Suppression 302 Number of patients in the denominator with a
HIV viral load less than 75 copies/mL at last
HIV viral load test during the measurement
year
347 Number of patients with at least one HIV
viral load test during the measurement year
87 e2boston