qualities - ShareData · PDF filequalities INNOVATIVE• ... customers,built on a...
94
qualities INNOVATIVE • DIVERSE • RESPONSIVE • FLEXIBLE • PROACTIVE 1 Nampak Limited Profile 2 Goals 2 Values 3 Financial Summary 5 The Group at a Glance 8 Group Structure 9 Chairman’s Statement 16 Group Managing Director’s Report 42 Corporate Governance 47 Certificate by Secretary 47 Approval by the Directors 48 Report of the Independent Auditors 49 Value Added Statement 50 Directors’ Report 54 Balance Sheets 55 Income Statements 56 Statements of Changes in Equity 57 Cash Flow Statements 58 Six Year Financial Review 60 Accounting Policies 64 Notes to the Financial Statements 84 Interest in Subsidiaries and Joint Ventures 85 Investments 86 Share Performance 87 Ordinary Shareholders’ Analysis 88 Directorate and Administration 90 Notice of Annual General Meeting 92 Shareholders’ Diary Form of Proxy
Transcript of qualities - ShareData · PDF filequalities INNOVATIVE• ... customers,built on a...

qualitiesI N N O V A T I V E • D I V E R S E • R E S P O N S I V E • F L E X I B L E • P R O A C T I V E
1 Nampak Limited Profile
2 Goals
2 Values
3 Financial Summary
5 The Group at a Glance
8 Group Structure
9 Chairman’s Statement
16 Group Managing Director’s Report
42 Corporate Governance
47 Certificate by Secretary
47 Approval by the Directors
48 Report of the Independent Auditors
49 Value Added Statement
50 Directors’ Report
54 Balance Sheets
55 Income Statements
56 Statements of Changes in Equity
57 Cash Flow Statements
58 Six Year Financial Review
60 Accounting Policies
64 Notes to the Financial Statements
84 Interest in Subsidiaries and Joint Ventures
85 Investments
86 Share Performance
87 Ordinary Shareholders’ Analysis
88 Directorate and Administration
90 Notice of Annual General Meeting
92 Shareholders’ Diary
Form of Proxy

N A M P A K 1
Nampak is Africa’s largest and most diversified packaging manufacturer,
with the major market share in South Africa and manufacturing facilities
in eight other countries in Africa. We export packaging from our
South African operations to some 56 countries around the world.
We are also extensively involved in collection and recycling activities
in all areas of packaging.
Nampak produces a wide variety of packaging products from all the
primary packaging raw materials – metals, paper, plastic and glass and
our diversity of offerings is unique, making us one of the few companies
in the world that can offer a total packaging solution to our customers.
Nampak is a significant player in rigid plastics in Europe, holding a
strong position in supplying plastic bottles to the dairy industry in the
United Kingdom.
In addition to packaging, Nampak is also South Africa’s largest
manufacturer of tissue paper products and holds a substantial share
of the paper merchanting market.
Nampak’s IT subsidiary, NamITech, develops and implements secure
end-to-end business solutions.
N A M P A K L I M I T E D Registration number: 1968/008070/06
ISIN code: ZAE000004933
Share code: NPK

N A M P A K 2
GOALS
� To strengthen and grow our position as the leading manufacturer and marketer of
packaging products on the African continent.
� To strengthen our offshore earnings capacity by increasing our presence internationally
in selected markets.
� To grow and unlock value in our non-packaging interests.
� To create shareholder wealth by generating returns in excess of the annual inflation rate
plus the economic growth rate.
� To build an organisation that reflects the diversities of the societies in which we operate.
VALUES
� We acknowledge the benefits of both operational ownership and corporate driven
strategic initiatives, systems and best practices.
� We believe in a culture that actively recruits, develops and retains talent and diversity.
� We value mutually beneficial long-term partnerships with both our suppliers and
customers, built on a foundation of superior quality, innovation and service.
� We uphold the principles of integrity, professional business ethics and internationally
accepted standards.

F I N A N C I A L S U M M A R Y
N A M P A K 3
2001 2000 Change %
REVENUERand million 10 474.3 9 632.8 +9
PROFIT BEFORE ABNORMAL ITEMSRand million 860.5 955.7 -10
PROFIT FROM OPERATIONSRand million 702.3 922.6 -24
NET PROFIT FOR THE YEARRand million 421.4 619.7 -32
BASIC EARNINGS PER SHARECents 82.7 121.7 -32
HEADLINE EARNINGS PER SHARECents 88.1 121.1 -27
DIVIDENDS PER SHARECents 53.3 53.3 —
NET ASSETS EMPLOYEDRand million 4 832.9 4 339.9 +11
MARKET CAPITALISATIONRand million 5 476.1 6 774.4 –19
0
25
50
75
100
125
010099989796HEADLINE EARNINGS ANDDIVIDENDS PER SHARE
cents
headline earnings per sharedividends per share
010099989796REVENUE
Rm
0
2 000
4 000
6 000
8 000
10 000
12 000
0
100
200
300
400
500
600
010099989796NET ASSET VALUE PER SHARE
cents
PROFIT FROM OPERATIONS
0
200
400
600
800
1 000
010099989796
Rm
0
2 000
4 000
6 000
8 000
10 000
010099989796MARKET CAPITALISATION
Rm
0
2
4
6
8
10
12
14
010099989796OPERATING MARGIN
%

products“Offering a packaging solution with world-class products”

N A M P A K 5
BEVCAN John Moyes (53)Tinplate beverage cans and aluminium ends for beer, carbonated soft drinks, alcoholic fruit beverages and fruit juice products.I&CS – suppliers of coding and inspection equipment to thebeverage and packaging industries.Collect-A-Can, a joint venture with Iscor, collects 65% ofSouth Africa’s used beverage cans for recycling.
FOODCAN Charles Bromley (38)Tinplate cans for fruit, vegetables, meat, fish, pet food BSc Eng (Chem)
and other processed foods.
DIVPAC Charles Bromley (38)A wide range of tinplate products for the industrial and household BSc Eng (Chem)
markets. These include paint, aerosol, oil and polish containers.Manufacturers of aluminium aerosols and a wide range ofdecorative tinware.
BEVCAP James MacDonald (41)Roll-on pilferproof aluminium closures for wine and spirits, BSc (Hons)
metal closures for glass jars, plastic closures for carbonatedsoft drinks and specialised plastic closures for sports drinks,cordials, condiments, edible oils, chemicals and motor oils.
MB GLASS Barry Kockott (60)Bottles for beer, carbonated soft drinks, wine, spirits and ketchup.A member of the Glass Recycling Association, which collects andrecycles 100 000 tonnes of glass per annum.
NAMPAK LIQUID PACKAGING John Arnold (54)Polyethylene-coated cartons for sorghum beer, milk, mageu, BComm
wine and juices. Packaging systems for non-carbonated liquidfoods. Plastic bottles for dairy, fruit juice, wine, sorghum beerand household products.
NAMPAK CORRUGATED Tom Reid (39)Corrugated-based packaging for a wide range of HND Mech Eng, BComm
products predominantly for the manufacturing and agricultural industries.
PRINTPAK Rob Morris (39)High-quality folding cartons and labels for the food, Pr Eng, BSc Eng (Chem), BComm (Hons)
cigarette, detergent, beverage, household productsand pharmaceutical industries. Litho laminated products and packaging machine systems.
NAMPAK TISSUE Roy Douglas (44)Manufacturer, distributor and marketer of tissue, feminine BSoc Sci, MBA
hygiene, baby diaper and foil products. South African market leader in tissue products.Nampak Paper Recycling collects 140 000 tonnes of paper waste per annum and recycles it for use in our tissue and corrugated manufacturing processes.
PETERS PAPERS/SPICERS Lawrence Mendoza (57)Distributors of local and imported fine papers CA(SA)
and graphic materials.
D I V I S I O N M A N A G I N G D I R E C TO R P R O D U C T S
T H E G R O U P A T A G L A N C E

N A M P A K 6
PETPAK Peter van Lienden (55)PET bottles and preforms for carbonated soft drinks, BSc (Hons), MSc (cum laude)
sports drinks, water, fruit juice and household products.
MEGAPAK Peter van Lienden (55)Plastic crates and drums for the beverage, dairy, bakery, poultry, BSc (Hons), MSc (cum laude)
chemical and other non-food markets.Nampak Polycyclers recycles 4 500 tonnes of plastic annually for conversion by Megapak into crates and drums.
TUFBAG Glenn Start-Taylor (37)Polypropylene flexible intermediate bulk containers (bulk bags) ACIMA
for the sugar, chemical and base mineral markets as well as arange of flexible mining support systems.
L&CP Rob Francois (40)Laminated protective wrappings and foil-based roof insulations BComm
(Super Sisalation).
ROTOFLEX-QUIX Graham Braby (42)Flexible packaging for the snacks, confectionery, biscuit and MSc Mech Eng
general food markets. Conversion of aluminium foil for the dairy,pharmaceutical, industrial, cigarette and beverage markets.
POLYFOIL Riz Hassen (47)Plastic check-out carrier bags for the retail, wholesale BCompt (Hons), CA(SA)
and cash-and-carry markets.
NAMPAK SACKS Tim Elliott (48)Multiwall paper sacks and self-opening paper bags for BComm
granular/free flowing products such as sugar, maize, cement,chemicals, wheat products and pet food.
NAMITECH
Telecommunications – specialises in end-to-end telecommunication Nikki Kettles (39)solutions. BSc Eng, MBA
Financial Services – offers a broad range of secure products and Chris Steyn (54)solutions. BComm, CA(SA)
New and Emerging Business – constantly seeks out new secure Charles Laxton (42)business solutions opportunities in the local and global arena.
Velocit-e Gaming and Leisure – provides secure automated William Wilsnagh (34)payment and cash-to-cashless gaming solutions for the casino, MSc Information Systems
restaurant and hotel industries.
AFRICA Sandy McLeish (55)Corrugated boxes, folding cartons, paper sacks, flexible packaging, Pr Eng, C Eng, BSc (Hons)
plastic check-out bags, crates, poly-coated cartons, PET bottles,plastic bottles and tissue products.
NAMPAK plc Nick Templeton-Ward (50)BA (Hons)
Liquid Foods – plastic containers for dairy and fruit juice products. Robin Moore (41)BComm
Containers – plastic containers for automotive and agri-chemicals. James Crick (49)BA (Hons)
D I V I S I O N M A N A G I N G D I R E C TO R P R O D U C T S


G R O U P S T R U C T U R E
N A M P A K 8
BevcanDivpacFoodcan
Nampak 85%Crown Cork 15%
M E T A L S
South Africa
Printpak
Nampak 70%Malbak 30%
P A P E R
BevcapGlass
CorrugatedPaper MerchantsTissue
L&CPLiquid PackagingMegapakPetpakPolyfoilRotoflex-QuixSacksTufbag
P L A S T I C S
TelecommunicationsFinancial Gaming & LeisureNew & Emerging
N A M I T E C H
ContainersLiquid FoodsPersonal Care
Europe
Botswana
Kenya
Malawi
Mocambique
Namibia
Swaziland
Tanzania
Zambia
Zimbabwe
Rest of Africa
BelgiumFranceNetherlandsSpainUnited Kingdom

N A M P A K 9
O V E RV I E W
The past year has again been
very challenging for the group.
After disappointing volume
growth in the first quarter,
particularly in the South
African packaging business,
management decided to
aggressively adjust the cost
base of the group.
Projections of the costs
associated with this action
and the poor trading
conditions led to a profit
warning in January, the first
such warning in our history.
The deterioration in the
Zimbabwe situation resulted
in a decision to deconsolidate
the profits from that country.
Solid progress was made in
the European businesses.
Our IT business, NamITech,
produced impressive profit
growth.
During the year the new cluster
organisational structure
shown on page 8 was
successfully bedded down
and the Chairman of ten
years’ standing retired.
A new Chairman and a new
Group managing director
were appointed from within
the company.
T H E Y E A R ’ S
P E R F O R M A N C E
Revenue increased by 8.7% to
R10.5 billion mainly as a
result of last year’s acquisition
of Plysu plc (now known as
Nampak plc) which was held
for a full year against only
nine months in 2000.
In South Africa, revenue
increased by only 6.7%,
reflecting the pressure on
selling prices and minimal
growth in volumes.
Operating profit decreased by
23.9% primarily as a result of
the costs associated with the
restructuring exercise, product
claims and other abnormal
items. In aggregate, all
abnormal items amounted to
R158 million. Operating
margin after adjusting for the
abnormal costs was 8.2%
(2000: 9.9%), a clear indication
of the difficult trading
environment. The magnitude
of the product claims was
abnormal compared to previous
years. Analysis of the problem
did not suggest that quality
standards had deteriorated,
but rather that a combination
of unusual one-off
circumstances had arisen.
A higher interest charge was
incurred following the
acquisition of Plysu and this,
together with the lower
operating profit, culminated
in a decline of 32% in
attributable profit and of
27.3% in headline earnings
per share.
Despite the lower earnings, an
unchanged total dividend of
53.3 cents for the year has
been declared, reflecting our
confidence in an earnings
recovery in 2002. This has
resulted in a temporary drop
in the dividend cover to
1.6 times. Over time we
C H A I R M A N ’ S S T A T E M E N T
confidence in earnings recovery
“Despite the lower earnings an unchanged total dividend of 53.3 cents for the year has been declared, reflecting ourconfidence in an earnings recovery in 2002”

C H A I R M A N ’ S S T A T E M E N T continued
N A M P A K 1 0
expect to return to the
stated dividend cover
objectives.
The balance sheet remains
strong, despite the cash costs
of restructuring, and the net
debt-to-equity ratio ended at
31.6% (2000: 26.8%).
In addition, active steps
were taken to manage the
currency risks associated
with the sterling debt, raised
to purchase Plysu. During the
year, the European
operations were
recapitalised, and the
outstanding capital amount
on the loan reduced
accordingly. In addition,
interest rate swaps were
entered into to control the
interest rate risk. It is
expected that by
December 2001, the capital
balance of the sterling debt
will be broadly equal to the
net assets held in sterling,
thereby providing a
matched translation hedge.
T H E T R A D I N G
E N V I R O N M E N T
Although the overall growth
in the South African economy
was 2.5%, spending on non-
durable items continued at
the low levels experienced in
previous years. Services
continued to command an
increasing share of consumer
spending. However, packaging
demand from July 2001
suggests that this trend could
be levelling off. Volumes in
the important beverage
sector of the market also
appear more encouraging.
This improvement is due more
to our customers’ export
growth than to local demand.
The low volume growth
domestically, coupled with
industry overcapacity and
high raw material costs,
resulted in selling prices
remaining under pressure
throughout the year. Despite
this, recently improved price
increases to our customers
have been achieved, although
not at full recovery levels.
Growth in the United
Kingdom manufacturing
sector was disappointing
and this had a negative
effect on our Containers
business. The Liquid Foods
business continued to
experience some growth in
volumes.
The market for prepaid cell
phone vouchers grew
substantially, both in South
Africa and the rest of the
African continent, although
the slow-down in the global
economy has caused a
surplus of silicone chips. This
has resulted in a decrease in
NamITech’s margins.
In the rest of Africa, the
instability in Zimbabwe
resulted in hyperinflation
and devaluation of the local
currency to such an extent
that a decision was made to
only bring to account cash
received. Prior year figures
have been adjusted
accordingly.
spending on non-durables continued
“Spending on non-durable items continued at the low levelsexperienced in previous years”

N A M P A K 1 1
T H E G L O B A L
PA C K A G I N G
I N D U S T RY
The past year has seen
further consolidation taking
place in the global packaging
industry and there are
indications that shareholder
value is starting to return to
the sector after many years
of below average performance.
Although sometimes viewed
as an unexciting investment,
packaging companies
nevertheless have the
advantage of stable demand
for their products and have
been less affected by the
boom-bust cycles that have
characterised some other
industries.
The consolidation phase is,
however, not over and we
expect to see further mergers
and acquisitions in the coming
year. Opportunities exist for
Nampak to participate in the
inevitable further consolidation
of the European packaging
industry.
T H E S O U T H A F R I C A N
PA C K A G I N G
I N D U S T RY
As previously indicated, the
packaging industry in South
Africa has, for a number of
years, been adversely affected
by low economic growth and
changing consumer spending
patterns which have led
to overcapacity in most
sectors. At the same time,
customers have rigorously
resisted price increases
despite significant raw
material price escalations,
resulting in downward
pressure on margins.
The packaging industry has
responded by rationalising
factories, improving
efficiencies and reducing
employee numbers. Margins
in the industry as a whole are
still below international
levels, particularly when the
cost of capital in South Africa
is considered. It is significant
to note that several
packaging companies were
liquidated during the year.
Some further industry
consolidation may be
required to restore returns to
acceptable levels.
A R E V I E W O F
T H E I N I T I AT I V E S
I N T R O D U C E D L A S T
Y E A R
The cost base of the business
has been substantially reduced.
Unfortunately, this has resulted
in the loss of more than
1 000 jobs in South Africa
during the year and 600 jobs
in Europe over the past
18 months. The sale of the
loss-making Brands business
in Europe (2000 turnover:
£8 million) contributed to the
reduction in jobs.
Retrenching is an unpleasant
and debilitating task for all
concerned. The company
provides training, assistance
and counselling to affected
employees and pays above-
average severance packages
to alleviate hardship as much
as practically possible.
Trevor Evans

C H A I R M A N ’ S S T A T E M E N T continued
N A M P A K 1 2
The reduction in employee
numbers was managed without
any major industrial problems,
either in South Africa or Europe.
Purchasing and logistic costs
were also reduced together
with a general tightening up
of all expenditure on
consumable items.
Further impetus was added
to our diversification strategy
with the acquisition by
NamITech of Velocit-e for
R68 million in August this year.
Whilst we were disappointed
at not having made further
acquisitions in Europe, much
progress has been made in
understanding the strategic
fit of the various options
being considered.
F U T U R E G R O W T H
S T R AT E G I E S
We do not believe that the
growth in private consumption
expenditure in South Africa
will stimulate growth in the
packaging industry to any
appreciable degree for the
next few years.
Whilst the effects of the
growth in the new industries
– cell phones and gambling,
etc. have slowed down, the
effect of AIDS is beginning to
manifest itself. The net result
is that we are planning for
little or no growth in the
overall demand from the
South African market.
The measures taken to
reduce costs will make a
major contribution towards
improving earnings next year
and to some extent the year
thereafter.
The company has modern
assets in most factories, a
much lower cost base and
globally competitive prices
now enhanced by the
weakening of the rand. As a
consequence, a determined
effort will be placed on both
increasing direct exports and
assisting our customers to
develop higher levels of their
exports.
The developments in Zimbabwe
have not deterred the group
from pursuing an African
growth strategy. Efforts to
find attractive investment
opportunities will continue.
In Europe, important
agreements have been signed
with major dairies to
manufacture a much larger
percentage of milk and juice
bottles in the dairies
themselves. These agreements
tie in volume with favourable
long-term commercial
benefits. The current year will
involve capital expenditure of
approximately R280 million to
install the necessary equipment.
Costs associated with the
closure of some production
capacity in one of the mother
factories will be incurred.
The Liquid Foods division is
now a world-class business,
making acceptable returns in
pounds sterling. The action
planned for the year ahead
will entrench its position
for years to come.We continue
european dairy contracts
“In Europe, important agreements have been signed with majordairies to manufacture a much larger percentage of milk and juice bottles in the dairies themselves”

N A M P A K 1 3
to explore other acquisition
opportunities in allied fields.
NamITech will also explore
the many acquisition
opportunities that could
complement its business.
E N V I R O N M E N T
Packaging is a visible
component of the waste
stream in South Africa.
This is less so in the
developed world as societies
are more disciplined in their
disposal of packaging waste
after use.
Nampak has, for many years,
been very active in recycling
the various packaging
materials and we set out
below our status for each
raw material.
METALS
Collect-A-Can – a joint venture
between Nampak and Iscor –
is a model of collaborative
effort in an industry. It was
started in the early nineteen
eighties and now collects
some 65% of South Africa’s
used beverage cans, a world-
class recovery rate.
PAPER
Our wholly owned paper
recycling business collects
some 140 000 tonnes of
paper waste annually to feed
our seven paper machines –
six tissue and one paperboard
– and these products are in
turn sold through our Tissue
and Corrugated divisions.
GLASS
Nampak is a member of the
Glass Recycling Association
which collects and recycles
some 100 000 tonnes per
annum.
PLASTICS
This group of products
presents a significant
challenge to the packaging
industry as it is characterised
by a huge variety of products
made from different polymers
which are not easy to identify
and separate. Additionally
there are many manufacturers
in the plastics industry,
making a joint industry
initiative much more difficult.
Collection and recycling rates
for plastic are thus lower than
for other materials.
The Minister of Environment
and Tourism has confirmed
that he intends to issue
regulations that prohibit the
use of plastic bags and
packets with a wall thickness
of less than 80 microns. To
provide a comparison, the
current thickness of plastic
carrier bags is approximately
16 microns.
A study completed in
NEDLAC, and limited to thin
micron vest-type carrier bags,
has supported the view held
by industry and labour that
the intended regulations
would have significant socio-
economic costs.
Nampak is working closely
with its industry colleagues
on this issue and supports an
approach that doubles the
thickness of plastic bags using
current technologies and
thereby creating recyclable
value. Industry has also made
a proposal to work with
Government in a co-operative
agreement to establish
mechanisms that increase the
overall recycling levels.
Nampak’s activities in plastic
recycling centre around
Nampak Polycyclers, which
recycles approximately
4 500 tonnes of plastic waste
annually into crates, drums
and garbage bins. In all, the
plastics industry recycles well
in excess of 100 000 tonnes
per annum.

C H A I R M A N ’ S S T A T E M E N T continued
N A M P A K 1 4
Nampak is a contributor to
the Peace Parks Foundation,
the World Wildlife Fund
and its Wildlife College, as
well as a number of other
conservation organisations.
C O R P O R AT E S O C I A L
I N V E S T M E N T
Education has remained the
key focus of our corporate
social investment during the
year with more than 80% of
our funding being allocated
to this important sector. Our
main support has been at
tertiary level with a special
focus on technical skills and
on bridging education.
In addition to our own direct
efforts, we contributed a
further R1.25 million to the
Business Trust which in turn
also supports education, as
well as tourism.
The National Business
Initiative (NBI), of which
Nampak is a member, is also
involved in a number of
initiatives on a national level
including skills development,
employment creation and
service and infrastructure
delivery.
We also supported a variety
of charitable organisations
whose aims are to help the
less fortunate members of
our society.
HIV/AIDS is starting to have
a devastating effect on our
population in South Africa
and we have commissioned
a pilot study in the worst
affected region of the
country. The results of this
study will be used to establish
a programme to prevent and
reduce exposure to this
disease, primarily through the
education of our employees.
C O R P O R AT E
G O V E R N A N C E
Our compliance with the
current King Code on
Corporate Governance is
detailed on pages 42 to 46.
In particular, we continue to:
● practise high ethical
standards and good
corporate governance;
● ensure transparency
in our reporting and
communication with
stakeholders;
● act in a socially responsible
manner as evidenced by the
diverse range of initiatives
in which we are involved;
● promote Black Economic
Empowerment both
through our employment
policy and in seeking to
establish viable business
enterprises through
appropriate partnerships.
Considerable work has already
been completed to ensure
that we will be able to comply
substantially with any new
governance recommendations
arising from the revised King
Report, due to be finalised soon.
M A N A G E M E N T
Brian Connellan retired as
Chairman of the company on
earnings boost anticipated
“We are expecting a significant improvement in earnings from ourSouth African operations off a much lower cost base following theactions that were taken in 2001”

N A M P A K 1 5
30 June 2001 and I was
appointed Executive Chairman
on 1 July 2001. I am pleased
that Brian has remained on as
a non-executive director of
the company.
Simultaneously, John Bortolan,
who has over 20 years’
experience in Nampak, was
appointed Group managing
director responsible for all
operations, with the exception
of NamITech, which continues
to report to me.
With a few minor exceptions,
the recommendations of the
King Report on Corporate
Governance on the roles of
Chairman and Chief Executive
Officer have been implemented
by the company.
P R O S P E C T S
We are expecting a significant
improvement in earnings from
our South African operations
next year, off a much lower
cost base, following the actions
that were taken in 2001.
NamITech is also expected
to achieve good growth in
earnings on the strength of
strong sales demand for existing
and new technology solutions.
Profits from the rest of Africa
are expected to be lower, due
mainly to the uncertainty in
Zimbabwe, but we are hoping
that Zimbabwe’s economy
will settle down and resume
growing after the March 2002
general elections in that
country.
In Europe, profits are
expected to be marginally
lower in 2002 due to some
duplicated costs associated
with the major dairy in-plant
projects, but will rebound
in 2003.
Overall a strong earnings
growth is expected for 2002,
provided the domestic and
European economies are not
further disrupted by the
current world crisis.
A P P R E C I AT I O N
First of all, I thank
Brian Connellan for his
tremendous contribution to
Nampak and wise counsel over
many years and wish him the
very best in his retirement.
Our Human Resources
Director, Sipho Ngidi, resigned
during the year to take up a
senior position at a leading
financial institution and I
thank him for his efforts at
Nampak and wish him well in
his new challenge.
It has not been an easy year
for management and staff as
they managed the cost
reduction and restructuring
exercises and I thank them all
for their understanding and
effort and positive attitude in
meeting the challenges.
A word of thanks also to our
Zimbabwean colleagues who
have managed through a
uniquely difficult period.
The Group managing director
and the executive directors
have had a tremendous
responsibility this past year to
ensure that all the changes
were implemented as
effectively as possible, whilst
ensuring that service to our
customers continued at a
high level. I thank them for
their leadership under very
difficult circumstances.
Finally, I thank the non-
executive directors for their
contribution and advice in
shaping the future of
Nampak.
Trevor EvansC H A I R M A N
27 November 2001

G R O U P M A N A G I N G D I R E C T O R ’ S R E P O R T
N A M P A K 1 6
T H E M A R K E T F O R
O U R P R O D U C T S
South Africa
Overall economic growth in
South Africa was between
2% and 3% for the period
under review. Despite this,
spending on non-durables,
upon which much of
packaging demand depends,
continued at the low level of
recent years mainly as a
result of the shift in consumer
spending towards services.
With the exception of a few
sectors, notably glass and
flexibles where some growth
was evident, demand for
packaging was essentially
unchanged from a year ago.
This ongoing low growth
has meant that there is still
spare capacity in the South
African packaging industry,
resulting in a highly
competitive trading
environment. Operating
margins continued to come
under pressure from higher
raw material prices and
other costs, which could not
be fully recovered in the
market.
Demand for toilet tissue was
steady but the expected
growth was affected by the
general low consumer
spending on non-durables.
Demand for printing paper
supplied by our paper
merchants suffered from
intense competition and
lower activity in the
printing industry.
Further growth of cellular
telephones resulted in a
strong demand for prepaid
recharge vouchers and related
solutions provided by
NamITech.
Rest of Africa
Although the total market for
packaging in the rest of Africa
is estimated at more than
US$1 billion, high inflation in
many African countries has
seriously eroded consumer
spending power.
We have, nevertheless, seen
some growth in demand for
plastic packaging for edible
oil, cartons and toilet tissue
as well as strong demand for
cellphone prepaid recharge
vouchers.
Climate plays an important
role in the demand for
packaging of export
products in Africa and,
with the exception of Kenya
which has experienced some
drought conditions, demand
for corrugated boxes,
especially for tobacco, held
up reasonably well.
Europe
Economic activity in Europe
began slowing towards the end
of our financial year but we
experienced steady demand
for rigid plastic packaging.
tough operating conditions
“Operating margins continued to come under pressure fromhigher raw material prices and other costs, which could not be fully recovered in the market”

N A M P A K 1 7
In the United Kingdom, where
we generate more than half
of our European turnover,
consumer spending was
relatively strong.
The European packaging
industry, however, remained
highly competitive due to
ongoing surplus capacity, and
selling price increases were
difficult to achieve.
R AW M AT E R I A L
P R I C E S
The slowdown in the global
economy resulted in a
levelling-off in commodity
prices in dollar terms. The
benchmark NBSK pulp price
declined whilst polymer
prices in dollars levelled off
after their sharp rise in 2000.
However, due to the
devaluation of the rand and
import parity pricing by most
raw material suppliers in
South Africa, we did not
benefit fully from the lower
international prices.
P R O F I T
I M P R O V E M E N T
I N I T I AT I V E S
The weak demand for
packaging and pressure on
margins, which we predicted
in our last annual report,
continued throughout much
of this year and necessitated
the implementation of a
number of profit
improvement initiatives.
R E D U C T I O N I N
G E N E R A L A N D
A D M I N I S T R AT I O N
C O S T S
The division clustering structure
that was introduced towards
the end of last year allowed
us to consolidate financial,
personnel administration and
information technology
resources. This resulted in a
reduction of employees
involved in these services and,
whilst significant retrenchment
costs were incurred in the
year under review, future cost
savings are substantial.
Procurement and logistics
We centralised the purchasing
of a range of items and this
led to major savings being
achieved. This is an ongoing
exercise and we expect
further benefits to arise as
negotiations with suppliers
are concluded.
Factory rationalisation
A number of factories were
either closed or consolidated
with others, where
appropriate. Foodcan and
Divpac Vanderbijlpark now
operate under one
management structure;
Divpac Main Tin was closed,
and three Sacks factories in
KwaZulu-Natal were
consolidated. The Megapak
factory in Cape Town was
closed and consolidated with
Petpak.
John Bortolan

markets“Understanding our markets’ current and future needs and positioning ourselves accordingly”

N A M P A K 1 9
Marketing
The Nampak product range is
extensive and in many cases
we have the capability to
offer our customers a total
packaging solution for their
needs. We have developed a
system called “Explorer” which
enables Nampak to align with
customers in understanding
their packaging supply
chain and thereby provide
solutions for both packaging
performance and efficiency.
Consumers are facing ever-
increasing choices and
marketers recognise that
packaging will play a more
important role in attracting
and retaining customers.
Innovation and speed to
market are becoming more
critical for our customers and
Nampak is ensuring that it
can assist in these vital areas
of retailing and wholesaling
of fast-moving consumer
goods.
At the biennial Institute of
Packaging Awards, which
recognise excellence and
innovation and which were
announced in October 2001,
Nampak won 35 of the 76
awards, including the overall
winning trophy and 55% of
the gold plaques.
We also entered five packs in
the prestigious World Star
Awards in which forty
countries competed – and
won awards for all our entries.
This supports our contention
that South African packaging
is truly world-class, both in
quality and innovation.
Our standing in the market
place was confirmed in the
past year by no less than
twelve top supplier awards
from customers.
The declining rand has
significantly helped both
export opportunities and
import replacement. Our own
direct exports from South
Africa to 56 countries around
the world grew to over
R1 billion.
O P E R AT I N G
P E R F O R M A N C E
South Africa
Sales in South Africa increased
by just under 7% to
R8.5 billion with little growth
in demand. In addition, the
substantial increase in raw
material costs could be only
partially recovered in selling
prices. Operating profits were
down 21% following the
restructuring and cost
reduction exercise that took
place, with abnormal costs
amounting to some
R155 million. This, together
with selling price pressure,
resulted in the operating
margin declining from 9.3%
of sales in 2000 to 6.9%
in 2001.
Rest of Africa
In rand terms the operations
in all countries in which we
are involved, with the
exception of Zambia, increased
their operating profits.
In view of the political
uncertainty in Zimbabwe and
the ongoing lack of foreign
exchange, we changed the
method of accounting for our
businesses in that country to
a cash received basis only.
Europe
Sales in Europe reached almost
R2 billion for the year against
R1.6 billion for the nine
SALESR10,5 bn
South Africa 80%
Rest of Africa 1%
Europe 19%
South Africa 82%
Rest of Africa 2%
Europe 16%
OPERATING PROFITR702 m
G R O U P M A N A G I N G D I R E C T O R ’ S R E P O R T continued
G E O G R A P H I C A L
A N A LY S I S


G R O U P M A N A G I N G D I R E C T O R ’ S R E P O R T continued
N A M P A K 2 2
months in 2000, as a result of
continuing good demand
from the dairy industry in the
United Kingdom and a higher
rand/sterling exchange rate.
The Brands business, with a
turnover of some £8 million,
and two properties were sold
during the year.
Operating profit at
R112 million was only slightly
higher than the comparable
period in 2000 due to some
restructuring costs and a
lower performance by the
Containers and Personal Care
businesses.
NamITech
NamITech substantially
increased both sales and
profits on strong growth in
demand for prepaid cellular
recharge vouchers. It expanded
its offerings in secure end-to-
end solutions with the
acquisition of Velocit-e and
The South African Certification
Authority (SACA).
Other
Income from Property and
Treasury declined mainly as a
result of lower utilisation of
group properties as the
restructuring programme was
completed. We also incurred
an impairment write-down of
R16 million on certain
properties.
The decline in head office and
other is due to various
abnormal, consulting and
other costs associated with
the restructuring programme.
Last year’s figure also
included some accumulated
income from our offshore
operations.
Group
In total, sales increased by 9%
to R10.5 billion from
R9.6 billion in 2000 partly as
a result of the inclusion of
Nampak plc for a full
12 months compared to only
nine months in 2000. With
volumes almost static, the
low increase in sales value is
indicative of the tough
trading environment where
selling prices were under
constant pressure.
Profit from operations of
R702 million was 24% down
on last year due to the poor
trading conditions, the
restructuring which took
place in South Africa and to
extraneous product claims
in Foodcan and Polyfoil
amounting to some
R34 million.
Interest paid increased to
R71 million from R50 million
last year as a result of a full
year’s interest on borrowings
raised to fund the acquisition
of Plysu. Headline earnings
per share declined by 27% to
88.1 cents.
The balance sheet remained
strong with the group
generating cash from
operations of R344.3 million
after abnormal costs, extra
tax payments and the
depreciation in the value of
the rand against sterling.
The largest single amount of
capital expenditure was for
dairy in-plant equipment in
the United Kingdom.
Capital expenditure totalled
R391 million of which South
Africa and the rest of Africa
comprised R206 million,
NamITech R43 million and
Europe R142 million.


Significant items of capital expenditure are shown in the table below:
Division Project Rm Justification
Europe Dairy in-plants 66 Lower costsLong-term supply contracts
Bevcan Super-end 28 InnovationLower costs
Rotoflex Gravure press 14 Increased demandIndustry rationalisation
NamITech Pre-paid voucher plant 12 Increased demand
Information system 10 Systems upgrade
Foodcan Rectangular can 14 InnovationPeel-off end 8 Innovation
Export opportunities
Tissue Diaper plant 7 Increased demandModernisation
Liquid Clarified polypropylene bottles 6 Innovation
D I V I S I O N A L R E V I E W S
Segmental analysis
Revenue Operating profit
2001 2000 % 2001 2000 %Rm Rm change Rm Rm change
Bevcan 1 455.0 1 398.9 4 109.1 153.7 (29)Foodcan and Divpac 1 181.7 1 176.1 — 82.8 118.4 (30)Other 460.1 417.3 10 11.6 25.4 (54)
Metals 3 096.8 2 992.3 3 203.5 297.5 (32)
Corrugated and Printpak 1 736.7 1 586.5 9 160.5 155.2 3Tissue 853.4 794.5 7 37.9 57.5 (34)Paper Merchants 681.9 622.0 10 31.5 40.1 (21)Other 70.7 87.1 (19) 12.4 29.9 (59)
Paper 3 342.7 3 090.1 8 242.3 282.7 (14)
Nampak plc 1 982.4 1 570.9 26 111.9 97.8 14Rotoflex and Sacks 643.2 573.5 12 0.2 27.4 (99)Petpak and Liquid 615.6 603.1 2 39.4 29.7 33Other 623.3 675.2 (8) 16.3 25.2 (35)
Plastics 3 864.5 3 422.7 13 167.8 180.1 (7)
NamITech 256.5 149.2 72 37.3 22.3 67
Property and Treasury 69.9 93.0 (25)Other (86.2) (21.5) (18.5) 47.0 (139)
Other (86.2) (21.5) 51.4 140.0 (63)
Total 10 474.3 9 632.8 9 702.3 922.6 (24)
G R O U P M A N A G I N G D I R E C T O R ’ S R E P O R T continued
N A M P A K 2 4
world-class packaging
“The Nampak product range is extensive and in many cases wehave the capability to offer our customers a total packagingsolution for their needs”

N A M P A K 2 5
Metals
Bevcan
Volumes in the beverage sector
remained under pressure due
to the continuing shift in
consumer spending patterns.
Demand for beverage cans
was also affected by the
ongoing consumer preference
for glass and PET.
Sales volumes in the
domestic market were down
on last year but were partially
offset by market promotions
and exports of filled cans by
some customers.
The lower volumes and
continued pressure on selling
prices resulted in a fall in
operating profits. These
conditions also led to the
closure of the only other
manufacturer of beverage
cans in Southern Africa.
Significant restructuring and
cost reduction took place
during the year and the
replacement of the two older
Cape Town production lines
with the more modern, high
speed Crown Cork Roodekop
line will be completed in the
first quarter of the new
financial year.
The new Super-end, which
lowers the overall cost of the
can, was successfully
introduced and is currently
being launched nationally and
in neighbouring territories.
We do not expect any
improvement in domestic
volumes next year but are
planning to increase sales
through further promotional
campaigns and exports of
filled cans by our customers.
This, together with the cost
reduction exercise completed
this year, will result in an
improvement in operating
performance in 2002.
Foodcan and Divpac
These divisions now operate
under one management
structure.
Demand for food cans grew
during the year with increases
in sales of fish, fruit and
vegetable cans.
The technological
improvements to the
rectangular can mentioned
last year were successfully
implemented and a new
aluminium foil peel-off end
line was installed. Both
innovations have created new
opportunities for domestic
and export markets.
With selling prices of food
cans remaining under
pressure, margins were
maintained through further
cost reduction and efficiency
improvements.
Operating profits in Foodcan
were marginally better than
last year and we are
expecting a much better
result in the year ahead on
the strength of cost savings
already achieved.
Divpac saw a year of
significant cost reduction and
rationalisation. The
Vanderbijlpark operation was
successfully combined with
that of Foodcan and has
started to deliver substantial
benefits.
Demand for aerosol cans
continued to grow but sales
of paint cans and motor-oil

G R O U P M A N A G I N G D I R E C T O R ’ S R E P O R T continued
N A M P A K 2 6
cans were lower due to the
ongoing conversion to plastic.
Sales of cans for household
products were in line with
lower consumer spending.
Additional aluminium aerosol
can capacity is being installed
at our Durban factory to
meet increasing demand and
will be commissioned early in
the new year.
The costs of restructuring and
lower sales volumes caused
operating profits in Divpac to
fall well below those of last
year, but we anticipate a
considerable improvement in
2002 on a much reduced cost
base and better volumes.
Bevcap
The metal closures market
was affected by competition
from imports, but good
volume growth was achieved
in plastic closures for sports
drinks. Demand for plastic
closures for carbonated soft
drink bottles was similar to
that of last year.
The substantial increase in
polymer raw material prices
could only be partly recovered
and led to a deterioration in
profit margins. This, together
with restructuring costs,
resulted in lower operating
profits for the year.
However, we are expecting a
much-improved performance
next year due to a lower cost
base and the introduction of
new plastic products.
Glass
Strong demand for alcoholic
fruit beverages helped to
grow the total market for
glass containers by some
9%. The demand for beer
and soft drink glass bottles
declined due to lower
consumption of beer and the
continuing trend towards PET
packaging for soft drinks.
A major power interruption
by the local municipality
caused the collapse of a wall
of a furnace, resulting in lost
production and sales. The
costs of this could only be
partially recovered from
insurers and a small operating
loss was incurred for the year.
Continuing growth in the
export of wine and the
resurgence of returnable
soft drink bottles are expected
to increase the demand for
glass packaging in the year
ahead. Consequently we are
expecting a significant
improvement in profitability.
Other
During the year we acquired
a share in Burcap Plastics, a
niche manufacturer of quality
plastic buckets.
Paper
Corrugated
The market for corrugated
boxes did not show any
growth in the year with
reduced demand from the
agricultural sector following a
season of poor fruit quality,
which negatively affected
exports. There was marginal
growth in the industrial and
commercial sectors.
Operating profit improved
following efficiency
improvements and a
reduction in converting


G R O U P M A N A G I N G D I R E C T O R ’ S R E P O R T continued
N A M P A K 2 8
costs which were offset to
some extent by one-off
restructuring costs and an
inadequate recovery of raw
material price increases.
The retail Redibox operations
continued to show good
growth by penetrating both
existing and new markets.
Towards the end of the year
we concluded an agreement
with Houers Co-operative in
terms of which we will close
our factory in Tzaneen and
sell the equipment to
Houers in exchange
for membership in the co-
operative. We are confident
that this will result in better
returns despite the reduced
demand for corrugated
boxes in the area.
Better operating profits are
expected next year on the
lower cost base, increased
exports and greater product
innovation.
Printpak
Demand for folding cartons
was disappointing and, when
added to industry over-
capacity, resulted in an
intensely competitive trading
environment. Under such
conditions it was not possible
to fully recover input cost
increases but operating profit
levels were nevertheless
maintained through cost
reduction and production
efficiency improvements.
These tough trading conditions
also resulted in the liquidation
of a competitor in the labels
market.
Market demand domestically
is expected to remain flat in
2002 although we anticipate
some growth in export sales.
Costs will be reduced still
further but, without
meaningful volume growth,
we are expecting only a small
increase in operating profits.
Paper Merchants
Lower volumes in the printing
industry, rationalisation of
some customers and a very
competitive market caused
margins and operating
profits to fall compared to
last year.
Despite lower pulp prices,
the cost of imported papers
nevertheless increased due
to the devaluation of the
rand. This extra cost could not
in all instances be recovered
in the market.
Costs and working capital
were further reduced during
the year and we are planning
for a much-improved
performance in 2002.
Tissue
Selling price increases that
were implemented towards
the end of the last financial
year, to partly compensate for
the dramatic rise in pulp and
cost base lowered
“We are expecting a substantial improvement in 2002 as the fullbenefits of cost reductions are realised”

N A M P A K 2 9
waste paper raw material
prices, resulted in our initially
losing some market share.
This was, however, regained
in the second half of the year
once other manufacturers
also increased their selling
prices.
The loss of volume resulted
in significant factory under-
recoveries and a poor
performance in the first half
of the year. As market prices
recovered, conditions
improved in the second half
but operating profit for the
full year fell significantly
below that of last year.
The new diaper plant at
Kliprivier was commissioned
during the year and is
successfully supplying
product to this growing
market sector.We
experienced strong growth in
the fempro sector and
gained market share.
The better trading conditions
that were evident in the
second half of the year are
expected to continue into
next year and we anticipate a
substantial increase in
operating profit.
Plastics
Liquid Packaging
Demand for both plastic
bottles and paper cartons in
the dairy, juice and sorghum
beer markets was lower than
in the previous year.
A weaker rand exchange rate
and import parity pricing
caused both imported paper
and polymer raw material
prices to rise.
Due to a more competitive
trading environment, cost
increases could not be
adequately recovered in selling
prices. A number of cost
reduction initiatives were
undertaken and the cost base
significantly reduced, allowing
operating profits to end
higher than last year.
Manufacturing plant was
upgraded and, together
with planned productivity
improvements, we are
expecting an improved
performance in the year
ahead.
Petpak
Some volume growth was
achieved in bottles for
carbonated soft drinks, juice
and sports drinks whilst we
gained market share in
preforms following
technology improvements.
The introduction of the 1 litre
bottle for carbonated soft
drinks also assisted in lifting
bottle sales.
Further cost reductions took
place which, together with
plant rationalisations, resulted
in operating profits being
higher than last year.
The full benefits of the
lower costs will be realised
in the year ahead and will
result in a better operating
result.
Megapak
Demand for crates for beer
and carbonated soft drink
bottles fell away almost
completely due to low
growth in beverage sales,
especially beer, which
resulted in the life of crates in
circulation being extended.

G R O U P M A N A G I N G D I R E C T O R ’ S R E P O R T continued
N A M P A K 3 0
Sales to customers using our
plastic drums to export their
products were especially
strong and we invested in
additional capacity in our
KwaZulu-Natal factory to
meet growing demand.
Operating profits declined
substantially as a result of
low crate sales and the costs
of major restructuring which
included the Cape Town
factory being closed and
amalgamated with Petpak.
We are expecting a substantial
improvement in 2002 as the
full benefits of cost reductions
are realised together with
some recovery in demand for
crates and continued growth
in drum sales.
Polyfoil
This business continues to be
affected by the uncertainty
concerning the legislation on
the future of lightweight
carrier bags.
Although demand for bags
was reasonably stable during
the year, our manufacturing
volumes declined in line with
the rationalisation of
productive capacity that was
implemented last year.
Profit margins were
maintained through factory
rationalisation, cost reduction
and efficiency improvements
but operating profits were
lower following a claim by an
export customer.
Although we are confident of
an improvement in operating
profit next year, much will
depend on the resolution of
the issues facing the
lightweight carrier bag.
Rotoflex-Quix
Although better demand for
packaging for snack foods and
confectionery was evident,
the flexible packaging
industry continued to be
characterised by overcapacity,
which diminished during the
year with the closure of some
competitors.
The introduction of new
products assisted in
increasing market share
at major customers. This,
together with tighter
control of converting costs,
improved operating profits
substantially.
Some R20 million was
invested in modern
equipment to meet higher
demand, as well as for
improved quality and greater
product innovation, which has
become an important factor
in growing the market for
this type of packaging.
There are significant export
opportunities for flexible
packaging and, together with
expected growth in domestic
volumes, we anticipate a
further improvement in
operating profit next year.
Sacks
Domestic demand was weak
but lower volumes were
offset to some extent by
stronger export sales. Selling
prices remained under
pressure in a highly
competitive market, which
also continues to be affected
by the rationalisation of the
grain milling industry and
competitive pressures from


G R O U P M A N A G I N G D I R E C T O R ’ S R E P O R T continued
N A M P A K 3 2
woven polypropylene cement
sacks.
Further restructuring of the
Durban and Cape Town
factories took place resulting
in some one-off costs and,
together with tighter market
conditions, an operating loss
was incurred for the year.
We are anticipating a
substantial turnaround next
year on a much lower cost
base and further growth in
export sales.
L&CP
Export sales exceeded those
of the previous year but,
with domestic demand
remaining weak, total
volumes for the year were
unchanged. An increase in
sales of lower margin
products, together with
higher costs of raw materials
that could not be fully
recovered, led to lower
operating profits.
Exports are expected to
increase further and, with the
introduction of new products
and a reduction in costs, we
are expecting a much better
performance in the year ahead.
Tufbag
This business recorded a
reduced loss in 2001 and
traded profitably for the last
six months.
Further rationalisation of
production capacity took
place and we are expecting a
small profit in the year ahead.
NamITech
NamITech continued its
evolution as a provider of
secure business solutions in
the security sector of the
information technology
industry. An appropriate
structure focusing on market
channels was implemented
with operations, services and
research and development
being consolidated for
maximum efficiency.
The acquisition of Velocit-e
for R68 million, which is an
innovative electronic security
and transaction business, has
a good fit with NamITech and
will further enhance our
technology base. This focus
has been further strengthened
through the recent acquisition
of electronic security and
authentication specialist, the
South African Certification
Authority (SACA), a VeriSign
affiliate.VeriSign is the world’s
largest provider of Internet
trust services, authentication
and encryption for
e-commerce transactions.
Demand for prepaid recharge
vouchers for the cellular
telephone industry was
particularly strong and volumes
doubled during the year.
We are expecting further
good growth next year,
especially from countries in
the rest of Africa where
cellular telephones are still in
their relative infancy.
Other growth areas include
business solutions applications
in which we have a leading
position in telecommunications
and financial services.
Considerable prospects for
the employment of secure
solutions technology exist in
the gaming and leisure


G R O U P M A N A G I N G D I R E C T O R ’ S R E P O R T continued
N A M P A K 3 4
sectors where we are well
positioned.
Operating profit for the year
increased substantially and
we are expecting a further
significant improvement in
2002. The currently depressed
information technology
industry offers scope for
further acquisitions and we
are carefully evaluating
possible opportunities.
Rest of Africa
We are involved in packaging
manufacturing operations in
several African countries
north of South Africa.
Kenya
Bullpak Limited, in which
we have a 49% share,
manufactures paper sacks
for the milling industry and
increased its operating profit
through better manufacturing
efficiencies and increased
volumes.
Malawi
We have a 60% share in stock
exchange-listed Packaging
Industries Malawi Limited
which is the country’s largest
packaging company.
Operating profit increased
over last year and additional
investment has been added in
the form of a flat bag
production line.
Moçambique
Carmoc, in which we have a
55% shareholding, increased
operating profit compared
to last year. Although a
relatively small market,
packaging has been growing
in Moçambique and we re-
organised our factory during
the year to improve both
production and efficiency to
meet demand for
corrugated boxes and toilet
rolls.
Tanzania
Our new tissue converting
joint venture, Nasaba Tissue,
commenced operations
during the latter part of the
year and sales volumes are
growing as market
penetration improves.
Zambia
We own 100% of International
Cartons & Packaging in
Zambia, which was affected
by weak economic conditions
and events in neighbouring
Zimbabwe. These conditions
caused a decline in operating
profit. We are in the process
of establishing a conical
carton manufacturing facility
to meet the needs of the
local traditional beer market.
Zimbabwe
Zimbabwe represents the
largest proportion of our
business in the rest of Africa.
We own 40% of Hunyani
Holdings Limited, which is the
country’s largest paper and
packaging manufacturer, 49%
of Megapak Zimbabwe and
70% of Nampak Polyfoil
Zimbabwe. We are pleased to
note that all the businesses
performed better than last year
despite extremely difficult
economic and political
conditions.
Due to the uncertainty these
conditions have created and a


G R O U P M A N A G I N G D I R E C T O R ’ S R E P O R T continued
N A M P A K 3 6
lack of foreign currency in
Zimbabwe, we no longer
consolidate the results from
this country.
Europe
The United Kingdom
manufacturing sector was in
decline for most of the year
due to the high value of the
pound sterling and some
customers have begun shifting
production to mainland
Europe and consolidating on
fewer sites.
Demand for milk and juice
in the United Kingdom, in
which we generate nearly
half of our European sales,
was steady. The trend to in-
plant manufacture of
bottles continued and we
are presently spending
some £20 million on new
plant and equipment at
two of our major dairy
customers.
Demand for other products in
the personal care and
industrial sectors was not as
strong and the industry
continued to be affected by
substantial overcapacity.
Operating profit in pounds
sterling was better than
last year following a
significant reduction in the
number of employees as
well as an improvement in
productivity from selected
capital investments.
The dairy in-plant
investments, which will
initially involve some
duplicated costs during the
transition phase, will give
us a secure volume base
for a number of years.
Some sectors of the
European rigid plastics
industry are fragmented
and suffer from
overcapacity. The industry
needs to consolidate to
improve profitability and,
with many businesses for
sale, we are actively seeking
opportunities that will
provide synergies with our
existing manufacturing
capabilities and enhance our
offering to customers.
We anticipate tough
market conditions
continuing until the
industry benefits from
consolidation. A marginal
decrease in operating
profits in 2002 is expected
as the in-plant capital
expenditure comes on
stream, with some
duplication of running
costs incurred during full
commissioning of the
project.
The depreciation in the value
of the rand should, however,
result in an improved
performance in rand terms.
strong earnings growth
“We expect a significant improvement in profitability from theSouth African operations in 2002”

N A M P A K 3 7
Corporate services
Information technology
A group-wide marketing and
customer data warehouse
system was implemented
during the year and is already
assisting in our customer
relationship management
programmes.
We are currently implementing
a new centralised information
technology delivery model for
the group, which will deliver
superior services at a reduced
cost. This includes the
modernisation of technology
infrastructure where
appropriate and capital
expenditure of R37 million
has recently been approved.
We have commenced the
implementation of a phased
project to replace older systems
with a modern enterprise
resource plan (ERP) that will
result in a further increase in
the capability of our
information systems. This will
be a major area of investment
over the next four to five
years and will enable systems
to be streamlined still further
with a commensurate
lowering of costs.
Purchasing and logistics
This newly created function
identified and saved
substantial costs in a variety
of areas across the group
and developed systems
that will enable further
savings to be made through
the use of more effective
purchasing and supply chain
management.
Human resources
The management and
development of all of our
employees is regarded as one
of the cornerstones of our
success.
We are committed to the
provisions of the Employment
Equity Act and have elected
to submit employment equity
reports in respect of each
division. Divisional managing
directors are responsible for
ensuring that employment
equity strategies are
implemented. New goals have
been set as a result of the
restructuring that has taken
place and are linked to senior
management incentive targets.
As a proportion of our
management category, African
managers represent 16.2%
against a target of 20%, and
managers from all previously
disadvantaged groups represent
41.4% of all managers against
an initial target of 35%.
Employment equity is a
regular agenda topic at joint
management/worker forums
in the operations.
We also continued our
management and other
employee development
programmes during the year
and invested over R22 million
in this important area.
Treasury
Our in-house treasury
operation continued to
efficiently manage our cash
flows and the various
financial risks associated with
our growth into the global
arena, thus minimising

interest costs and covering
currency fluctuation risks.
Group finance
Nampak now operates in
more than 15 countries and
we have strengthened our
financial management to
ensure that we continue to
provide reliable and
accurate financial
information to our
shareholders and to
management.
Group legal
We continued to employ our
own in-house legal counsel,
which provided competitively
priced expert advice and the
drafting of a wide range of
commercial and other
agreements.
O U T L O O K F O R 2 0 0 2
In South Africa most
economists are forecasting a
GDP growth rate next year
of between 2% and 3%.
Although signs are
beginning to emerge
suggesting that the trend
towards spending on
cellphones, gambling and
lotteries is abating, spending
on non-durables is expected
to remain low.
The depreciation in the value
of the rand that has taken
place in recent months has
made products manufactured
in South Africa much more
competitive on world markets.
Our efforts to grow direct
exports and exports by our
customers have intensified
and we expect to see the
benefits in the year ahead.
Any extra volume that is
generated off the much
lower cost base following
the restructuring that took
place in 2001 will have a
direct benefit on operating
profits.
Our staff complement in the management and skilled band, as per our latest reports to the Director-
General of Labour as at 31 July 2001, is as follows:
Male Female
African Coloured Indian White African Coloured Indian White
Management 177 69 91 754 31 5 17 142
Skilled 1 135 632 566 982 91 128 63 397
We currently employ 75 people who are disabled and 3 656 employees attended occupational training
courses for the advancement of skills and knowledge during the reporting period as indicated below:
African Coloured Indian White Total
1 779 433 515 929 3 656
G R O U P M A N A G I N G D I R E C T O R ’ S R E P O R T continued
N A M P A K 3 8


G R O U P M A N A G I N G D I R E C T O R ’ S R E P O R T continued
N A M P A K 4 0
We expect a significant
improvement in profitability
from the South African
operations in 2002. NamITech
is also expected to continue
its rapid growth and will
generate higher profits.
Due to the uncertainty that
has taken place in Zimbabwe
and the impact that this is
having on their economy, we
are expecting a decline in
earnings from the rest of
Africa.
Although trading in Europe is
expected to be steady the
extra costs associated with
the dairy in-plant projects
will result in a marginal
decrease in operating
profits in pounds sterling.
In 2003 profits are expected
to return to the levels
achieved this year.
Overall we are expecting a
substantially improved
performance next year on a
lower cost platform and
gradually improving demand.
A P P R E C I AT I O N
This has been an especially
difficult year at Nampak and
I thank all our employees for
their ongoing commitment to
maximising Nampak’s
performance and rising to the
challenges that faced us.
I thank our customers
for their continued support
and trust that our approach
to increasing value has been
of benefit and we look
forward to expanding
this collaboration in the
years ahead.
John BortolanG RO U P M A N A G I N G
D I R E C TO R
27 November 2001


C O R P O R A T E G O V E R N A N C E
N A M P A K 4 2
The Nampak group is
committed to the principles
of openness, integrity and
accountability advocated by
the King Report on Corporate
Governance. Except to the
extent indicated below, the
group complies with the
material provisions of the
Code of Corporate Practices
and Conduct. It is noted that
the King II Committee Report
on Corporate Governance in
South Africa will come into
effect during the course of
2002 and, where appropriate,
changes will be made to
Nampak’s corporate
governance policy and
procedures.
B O A R D O F
D I R E C TO R S
Nampak has a unitary board
structure comprising ten
executive directors, and eight
non-executive directors chosen
for their business acumen and
skills. The board meets at
least six times per annum.
The group follows a decen-
tralised approach with regard
to the day-to-day running of
its businesses but the board
reserves to itself a range of
key decisions to ensure that it
retains the strategic direction
of and proper control over
material matters affecting the
group. The service contracts
of executive directors, details
of which are set out in
note17.9 to the financial
statements, do not exceed
a three-year term in any
instance. Re-appointment
of group non-executive
directors is not automatic.
The selection and appointment
of all directors is dealt with
by the board as a whole.
There are comprehensive
management reporting
disciplines in place which
include the preparation of
annual budgets by all
operating units. The strategic
plan and the group budget
and summaries of divisional
sales, operating profit and
capital expenditure are
reviewed and approved by
the board. Results and the
financial status of divisions
are reported on at board
meetings against approved
budgets and compared to the
prior year. Profit projections,
forecast cash flows and
working capital and borrowing
levels are also reported on at
these meetings.
C H A I R M A N
The posts of chairman and
group managing director are
separate and are filled by
different directors. It is not
considered to be in the best
interests of the company to
have a part-time non-executive
chairman at this time.
R E M U N E R AT I O N
C O M M I T T E E
The group remuneration
committee, which operates
under a written mandate, is
composed of four non-
executive directors, one of
whom chairs the committee.
The committee approves the
following:
● remuneration policy and
changes thereto for
executive directors and
senior management;
● the remuneration of the
chairman, group managing
director and all executive
directors (including
alternates);
● the granting of options to
acquire ordinary shares in
terms of the Nampak 1985
Share Option Scheme.
The committee also considers
the remuneration of non-

N A M P A K 4 3
executive directors and mem-
bers of special committees of
the board (including ad hoc
committees) and, in conjunc-
tion with the chairman and
group managing director, nom-
inations of new directors, and
makes recommendations there-
on to the board for its approval.
The emoluments of the
executive directors and
non-executive directors are
disclosed in total in the
annual financial statements.
E X E C U T I V E
M A N A G E M E N T
The chairman and the group
managing director meet
regularly to consider various
issues of strategic importance
to the group. Ongoing succes-
sion planning within the
group is an integral part of
this process.
The executive directors meet
frequently to consider a wide
range of matters relating to
the management of the
group including:
● divisional budgets and
strategic plans;
● continuing development
and review of the group
strategic plan and budget;
● significant capital
expenditure proposals;
● affirmative action;
● world-class manufacturing
and service;
● growth opportunities; and
● market-place
developments.
A capital expenditure
committee, consisting of the
executive directors, meets
regularly to consider capital
expenditure proposals and to
re-evaluate performance on
previously approved capital
expenditure proposals.
Executive directors conduct
group visits of selected plants
annually to obtain first-hand
knowledge of their operations
and to review progress with
capital and other projects.
The chairman, the group
managing director and the
directors responsible for
finance, legal and insurance
affairs meet weekly to discuss
matters of importance
related to these portfolios.
R I S K M A N A G E M E N T
Risk control audits of all
plants against written
standards, including
compliance with the
Occupational Health and
Safety Act, are conducted
annually by the group
insurance/risk manager with
the assistance of outside
consultants. The group
participates in a sophisticated
self-insurance and external
insurance programme
designed to provide sound
covers at a competitive cost.
Operations in the group have
been accredited with the
following ratings:
Number of
Rating operations
NOSA 5 stars 7
NOSA 4 stars 4
ISO 9001/2 41
American Institute
of Baking 8
Hazard Analysis
Critical Control Points 5
P R O F E S S I O N A L
A D V I C E
All directors have access to
the advice and services of the
company secretary. In
appropriate circumstances
they may seek independent
professional advice about the
affairs of the company at the
company’s expense.

C O R P O R A T E G O V E R N A N C E continued
N A M P A K 4 4
Unless this would be
inappropriate, the director
concerned would initially
discuss and clear the matter
with the chairman or the
company secretary.
S TA K E H O L D E R
C O M M U N I C AT I O N
The board subscribes to the
concepts of openness, fairness,
relevance and promptness in
communications, but believes
that the best interests of
the company should be
considered in applying
the concept of openness,
as disclosures may not
be appropriate in all
circumstances and, in certain
instances, may be in conflict
with legal or regulatory
requirements.
I N T E R N A L C O N T R O L
A N D I N T E R N A L
A U D I T
The directors are responsible
for and ensure that the group
maintains adequate
accounting records and
internal controls and systems
designed to provide
reasonable assurance on
the integrity and reliability of
the financial statements and
to adequately safeguard, verify
and maintain accountability
for its assets. Such controls
are based on established
policies and procedures and
are implemented by trained
personnel with an appropriate
segregation of duties, except
in isolated instances which
are not material.
The effectiveness of these
internal controls and systems
is monitored in a number of
ways, as set out below,
dependent upon the
particular circumstances:
● through the utilisation by
management of internal
control checklists;
● formalised reporting of
material defalcations and
other losses;
● the use of an internal audit
department, which
independently reviews the
adequacy and effectiveness
of internal controls and the
systems which support
them, at the various
operating entities, as well as
business and financial risks
which could have an
adverse effect on the group.
The external auditors, through
the audit work that they
perform, confirm that the
above-mentioned monitoring
procedures are being
effectively applied.
The internal audit department
is an independent appraisal
function and has the respect
and co-operation of both the
board of directors and
management. Weaknesses
identified by the internal
auditors are reported on and
brought to the attention of
the directors and management.
Nothing has come to the
attention of the directors, nor
to the attention of the
internal or external auditors,
to indicate that any material
breakdown in the functioning
of the above-mentioned
internal controls and systems
has occurred during the year
under review.
F I N A N C I A L
S TAT E M E N T S
The directors of Nampak are
responsible for preparing the
financial statements and
other information presented
in the annual report in a
manner that fairly presents
the state of affairs and results
of the operations of the
company and the group.
The external auditors are

N A M P A K 4 5
responsible for carrying out
an independent examination
of the financial statements in
accordance with Statements
of South African Auditing
Standards and reporting
their findings thereon. The
auditors’ report is set out on
page 48.
The annual financial
statements contained on
pages 50 to 85 have been
prepared in accordance with
South African Statements of
Generally Accepted
Accounting Practice. They are
based on appropriate
accounting policies which
have been consistently
applied and are supported by
reasonable and prudent
judgements and estimates.
The directors have no reason
to believe that the group’s
businesses will not continue
as going concerns in the year
ahead, other than where
closures or discontinuations
are anticipated, in which case
reasonable provision is made
to reduce the carrying cost of
the relevant assets to
estimated net realisable
value. Reasonable provision is
also made for any future
operating losses which are
expected to be incurred from
the date of discontinuance to
the anticipated disposal date
of such assets.
A U D I T C O M M I T T E E
The group audit committee
adopted written terms of
reference on 19 March 1996
and meets at least twice per
year. The composition of the
committee includes four non-
executive directors, one of
whom is the chairman of the
committee. The external
auditors and the head of
internal audit have
unrestricted access to the
committee and its chairman
and attend audit committee
meetings. These meetings are
also attended by appropriate
executives including those
responsible for finance. The
audit committee reviews the
effectiveness of the internal
controls of the group with
reference to the findings of
both the internal and external
auditors. Other areas covered
include the review of
important accounting issues,
material pending litigation,
specific disclosures in the
financial statements, material
defalcations, insurance
covers and a review of the
major external audit
recommendations.
W O R K E R
PA RT I C I PAT I O N
The group has a variety of
participative structures, at
various levels, for handling
issues which affect employees
directly and materially. These
include collective bargaining
mechanisms, structures to
drive the World Class
Manufacturing and Service
programme, safety
committees and other
participative forums. These
structures, which have been
set up with trade unions and
other employee represen-
tatives, are designed to
achieve good employer/
employee relations through
effective sharing of relevant
information, the identification
and resolution of conflict and
consultation by management
with the workforce about
decisions that materially and
directly affect employees,
except where this is
prohibited by law or
regulation or would adversely
affect the well-being of the
company.

C O R P O R A T E G O V E R N A N C E continued
N A M P A K 4 6
E M P L OY M E N T
E Q U I T Y
The group has been engaged
in an affirmative action
programme for a number of
years. This is designed to
increase the number of
previously disadvantaged
persons appointed as
managers in the group and, at
another level, to empower
disadvantaged employees on
the factory floor.
As required by the
Employment Equity Act,
annual reports have been
submitted to the
Employment Equity Registry.
Please refer to the Group
managing director’s report
on page 37 for further
particulars.
H I V / A I D S
AWA R E N E S S
P R O G R A M M E
A pilot awareness and
prevention programme
for HIV/AIDS has been
established for the Nampak
operations in KwaZulu-Natal
and the programme will be
extended to operations in
other regions during the
course of 2002.
P R I C E - S E N S I T I V E
I N F O R M AT I O N
In accordance with the JSE
Securities Exchange South
Africa’s guidelines on price-
sensitive information, the
company has adopted a
policy dealing with the
determination of
information as price-
sensitive, confidentiality
undertakings and
discussions with the press,
institutional investors and
analysts. Only the chairman,
the group managing director
or the financial director may
discuss matters which may
involve price-sensitive
information with third
parties. The company
follows a “closed period”
principle, during which
periods employees and
directors are prohibited
from dealing in the
company’s shares.
In order to preserve the
confidentiality of price-
sensitive information during
closed periods, management
will not hold discussions
regarding the company’s
performance with analysts,
institutional investors,
the media or any other
persons who may gain
unfair advantage from such
discussions.
The usual closed periods are
from approximately the
middle of March until the
publication in May of the
interim results for the six-
month period ended
31 March and from
approximately the middle
of September until the
publication in November of
the financial results for the
year ended 30 September.
Additional periods may be
declared “closed” from time
to time if circumstances
warrant this action.
E T H I C S
Directors and employees are
required to maintain the
highest ethical standards,
ensuring that business
practices are conducted in a
manner which, in all
reasonable circumstances, is
beyond reproach. With the
approval of the board,
the group has distributed
a formal Code of Business
Conduct to all its employees
and explained its contents
to them.

N A M P A K 4 7
C E R T I F I C A T E B Y S E C R E T A R Y
I certify that the company has lodged with the Registrar of Companies all such returns as are required of a public
company in terms of the Companies Act 61 of 1973 and that all such returns are true, correct and up to date.
N P O’BrienS E C R E TA RY
27 November 2001
A P P R O V A L B Y T H E D I R E C T O R S
The directors of the company are responsible for the preparation and integrity of the annual financial statements and
related financial information included in this report. The financial statements have been prepared in accordance with
South African Statements of Generally Accepted Accounting Practice and incorporate full and responsible disclosure in
line with the accounting philosophy of the group.
An audit committee, consisting of non-executive directors, meets periodically with the company’s external auditors and
executive management to discuss accounting, auditing, internal control and financial reporting matters.
The external auditors have unrestricted access to the audit committee.
These financial statements have been approved by the board of directors and are signed on its behalf by:
T EvansC H A I R M A N
G E BortolanG RO U P M A N A G I N G D I R E C TO R
Sandton
27 November 2001
To the members of Nampak Limited
N A M P A K 4 8
R E P O R T O F T H E I N D E P E N D E N T A U D I T O R S
We have audited the annual financial statements and group annual financial statements set out on pages 50 to 85 for
the year ended 30 September 2001. These annual financial statements are the responsibility of the company’s directors.
Our responsibility is to express an opinion on these annual financial statements based on our audit.
S C O P E
We conducted our audit in accordance with statements of South African Auditing Standards. Those standards require
that we plan and perform the audit to obtain reasonable assurance that the annual financial statements are free of
material misstatement. An audit includes :
● examining, on a test basis, evidence supporting the amounts and disclosures in the annual financial statements;
● assessing the accounting principles used and significant estimates made by management; and
● evaluating the overall financial statement presentation.
We believe that our audit provides a reasonable basis for our opinion.
A U D I T O P I N I O N
In our opinion, these annual financial statements fairly present, in all material respects, the financial position of the
company and the group at 30 September 2001 and the results of their operations and cash flows for the year then
ended in accordance with South African Statements of Generally Accepted Accounting Practice, and in the manner
required by the Companies Act 1973 in South Africa.
Deloitte & ToucheR E G I S T E R E D AC C O U N TA N T S A N D AU D I TO R S
C H A RT E R E D AC C O U N TA N T S (S A )
Sandton
27 November 2001
To the members of Nampak Limited

N A M P A K 4 9
V A L U E A D D E D S T A T E M E N Tfor the year ended 30 September
Group
2001 2000R million % R million %
REVENUE 10 474.3 9 632.8
Less: Paid and payable for raw materials, goods and services 7 022.5 6 260.0
VALUE ADDED 3 451.8 3 372.8
Income from investments 2.5 9.6
TOTAL WEALTH CREATED 3 454.3 100.0 3 382.4 100.0
APPLIED AS FOLLOWS:
EMPLOYEES’ COSTS 2 208.9 63.9 2 005.1 59.3
GOVERNMENT (SEE BELOW) 238.6 6.9 254.0 7.5
PROVIDERS OF CAPITAL
Net finance costs 71.0 2.1 49.9 1.5
Dividends to ordinary shareholders 91.7 2.7 271.4 8.0
Dividends to preference and outside shareholders 45.8 1.3 30.0 0.9
REINVESTED FOR FUTURE GROWTH
Depreciation less surplus on disposal of property, plant and equipment 461.6 13.3 385.0 11.4
Deferred taxation 12.0 0.4 22.6 0.7
Retained profit in holding, subsidiary and joint venture companies 324.7 9.4 364.4 10.7
3 454.3 100.0 3 382.4 100.0
D E A L I N G S W I T H G O V E R N M E N T S
GROSS CONTRIBUTION TO GOVERNMENTS
Company taxes 159.4 192.4
RSC levies 16.7 14.9
Rates and taxes 33.1 24.6
Customs and excise duty 29.4 23.7
238.6 255.6
Deduct: cash grants and subsidies — (1.6)
CHARGED AGAINST GROUP INCOME 238.6 254.0
COLLECTED ON BEHALF OF GOVERNMENTS
PAYE and other employee taxes 550.3 340.8
Value added tax (net) 311.0 303.8
Non-resident shareholders’ tax — 0.2
861.3 644.8

D I R E C T O R S ’ R E P O R Tfor the year ended 30 September
N A M P A K 5 0
N AT U R E O F B U S I N E S S
Nampak Limited is listed on the JSE Securities Exchange South Africa in the Packaging and Printing sector. It is the largest
and most diversified packaging company in Africa, producing packaging products from metal, paper, plastic and glass. It is
also a major manufacturer and distributor of tissue products and plays a significant role in the paper merchanting market.
NamITech, a subsidiary company operating in the security sector of the IT industry, provides leading edge business solutions.
Nampak operates from manufacturing and distribution sites throughout South Africa and the rest of Africa and has
blow-moulding businesses in Belgium, France, the Netherlands, Spain and the United Kingdom. Nampak also exports to
many countries world-wide.
R E V I E W O F O P E R AT I O N S A N D R E S U LT S
The performance of the divisions and the group’s results are comprehensively reviewed on pages 16 to 40 and 54 to 85.
G R O U P S T R U C T U R E
During the year, NamITech acquired the business of Velocit-e, a provider of secure technology systems, for a consideration
of R68 million. As part of the merging of the NamITech and Velocit-e businesses, the vendors of the Velocit-e business
acquired a 10% shareholding in NamITech Holdings. With effect from 1 November 2001, NamITech also acquired the
business of The South African Certification Agency (“SACA”), a VeriSign affiliate, for a consideration of R4.5 million.
VeriSign is the world’s largest provider of Internet trust services.
Metal Box South Africa Limited acquired a 50% interest in Burcap Plastics (Pty) Limited at a cost of R4 million. Burcap
manufactures and distributes plastic buckets for the paint, food and allied industries.
Nasaba Tissue Limited of Tanzania was formed during the year as a 50% joint venture with Saba Industries Limited for
the purposes of manufacturing and distributing tissue products.
Subsequent to 30 September 2001, Consolidated Corrugated Containers (Pty) Ltd sold its business to Houers Co-operative
in exchange for membership in the Co-operative. Certain group properties surplus to requirements were sold during the
year for a total consideration of R26.6 million.
Subsequent to 30 September 2001, a further two properties were sold for a total consideration of R7.6 million.
S H A R E C A P I TA L
Details of the authorised and issued share capital are given in note 10 to the financial statements.
During the year the issued ordinary share capital was increased as follows:
Ordinary shares of5 cents each
Issued at 30 September 2000 509 350 500
Shares allotted to employees other than directors in termsof the Nampak 1985 Share Option Scheme 55 600
Issued at 30 September 2001 509 406 100
There were no changes to the issued 6.5% and 6% preference share capitals.

N A M P A K 5 1
S H A R E I N C E N T I V E S C H E M E S
There are two share incentive schemes, the Nampak 1979 Share Purchase Scheme (“the Purchase Scheme”) and theNampak 1985 Share Option Scheme (“the Option Scheme”).
55 600 ordinary shares were allotted during the year consequent upon the exercise of options.
The relevant particulars of the schemes are set out below:
Ordinary shares
2001 2000
Unallocated shares set aside for utilisation at the commencement of the financial year 20 613 580 20 910 680Shares in respect of which options were granted 3 875 000 590 200Options forfeited as a result of resignations 696 100 293 100
Available for utilisation at the end of the financial year 17 434 680 20 613 580
STATUS OF SCHEMES AT THE END OF THE FINANCIAL YEAR
– PURCHASE SCHEME
Shares held for participants 1 533 100 1 716 400
Number of participants 53 54
Shares held by The Nampak 1979 Share Purchase Trust 57 000 2 000
– OPTION SCHEME
Shares in respect of which options are outstanding:these are exercisable over periods between 1 October 2001 and 1 December 2010 at varying option prices, the weighted average price of which is 1 084 cents:Directors 2 763 400 1 620 400Other employees and retirees 8 236 600 6 256 300
Total 11 000 000 7 876 700
Number of participants 254 256
D I V I D E N D S
Details of dividends dealt with in the financial statements are shown below:
CentsClass of share Dividend No. per share Declared Paid/payable
6% cumulative preference 64 6.00 08/12/00 05/02/0165 6.00 21/06/01 31/07/01
6.5% cumulative preference 64 6.50 08/12/00 05/02/0165 6.50 21/06/01 31/07/01
Ordinary 65 17.8 14/05/01 10/07/0166 35.5 06/11/01 08/01/02

D I R E C T O R S ’ R E P O R T continued
for the year ended 30 September
N A M P A K 5 2
D I R E C TO R S A N D S E C R E TA RY
The names of the directors and secretary in office at the date of this report are set out on pages 88 and 89.
In terms of the company’s articles of association, Messrs D E Cooper, T Evans, D A Hawton, J W C Sayers and R A Williams
retire by rotation but, being eligible, offer themselves for re-election at the forthcoming annual general meeting.
Messrs D E Cooper, D A Hawton and R A Williams do not have directors’ service contracts. The undermentioned directors’
service contracts will expire on the dates indicated:
T Evans 30 September 2004
J W C Sayers 30 June 2004
I N T E R E S T S O F D I R E C TO R S
The total direct and indirect beneficial and non-beneficial interests of the directors of Nampak Limited in the issued share
capital of the company as at 30 September 2001 are shown below:
Options to purchaseOrdinary shares ordinary shares*
2001 2000 2001 2000
Beneficial interests 1 472 632 1 807 632 2 763 400 1 620 400
Non-beneficial interests 16 16
*In terms of the Option Scheme
S P E C I A L R E S O L U T I O N S
Special resolutions were passed by shareholders of the following South African subsidiary companies during the year
under review:
SPECIAL RESOLUTIONS TO CHANGE COMPANY NAMES
From BDM Technologies (Pty) Limited to NamITech (Pty) Limited
From Ikar Trading (Pty) Limited to NamITprepaidz (Pty) Limited
From BN Card Technologies (Pty) Limited to NamITcardz (Pty) Limited
From BDM Security Printing (Pty) Limited to Secure Document Solutionz (Pty) Limited
From BDM Specialised Printing (Pty) Limited to NamITdraftz (Pty) Limited
From BNCT Investments (Pty) Limited to NamITsmartz (Pty) Limited
From Hentiq 2825 (Pty) Limited to NamIT-IDz (Pty) Limited
From Hentiq 2277 (Pty) Limited to Velocit-e (Pty) Limited
From NamITech (Pty) Limited to NamITech Holdings (Pty) Limited
From Secure Document Solutionz (Pty) Limited to NamITech (Pty) Limited

N A M P A K 5 3
SPECIAL RESOLUTIONS TO AMEND ARTICLES OF ASSOCIATION
Nampak Products Limited
Metal Box South Africa Limited
SPECIAL RESOLUTION TO INCREASE THE AUTHORISED SHARE CAPITAL
Sancella S.A. (Pty) Limited
SPECIAL RESOLUTION TO CONVERT SHARE CAPITAL
NamITech Holdings (Pty) Limited (formerly NamITech (Pty) Limited)
SPECIAL RESOLUTION TO REDUCE SHARE PREMIUM ACCOUNT
NamITsmartz (Pty) Limited
SPECIAL RESOLUTION TO ADOPT NEW ARTICLES OF ASSOCIATION
NamITech Holdings (Pty) Limited
N A M E C H A N G E S
The following foreign subsidiary companies changed their names during the period under review:
From Plysu plc to Nampak plc
From Plysu Halfweg BV to Nampak Halfweg BV
From Plysu Kerkrade BV to Nampak Kerkrade BV
From Plysu Gent NV to Nampak Gent NV
From Plysu Montpont SA to Nampak Montpont SA
From Plysu Belgium NV to Nampak Belgium NV
From Plysu France SA to Nampak France SA
From Plysu Deutschland GmbH to Nampak Deutschland GmbH
From Plysu Continental Holdings BV to Nampak Continental Holdings BV
R E T I R E M E N T F U N D S
Details of retirement funds are reflected in note 2 to the financial statements.

B A L A N C E S H E E T Sas at 30 September
N A M P A K 5 4
Group Company
2001 2000 2001 2000Notes R million R million R million R million
A S S E T S
NON-CURRENT ASSETS
Property, plant and equipment 5 3 500.6 3 340.9 — —
Intangible assets 6 (73.8) (101.6) — —
Investments 7 19.1 39.4 15.8 16.4
Investment in subsidiaries and joint ventures 8 108.6 72.2 865.2 794.7
Deferred tax 14 7.8 — — —
3 562.3 3 350.9 881.0 811.1
CURRENT ASSETS
Inventories 9 1 236.1 1 146.1 — —
Trade and other receivables 1 862.6 1 685.9 — —
Taxation 69.9 — 0.3 —
Subsidiary companies 13.1 0.8 237.3 256.1
Bank balances, deposits and cash 1 011.1 741.3 0.4 0.3
4 192.8 3 574.1 238.0 256.4
TOTAL ASSETS 7 755.1 6 925.0 1 119.0 1 067.5
E Q U I T Y A N D L I A B I L I T I E S
CAPITAL AND RESERVES
Capital 10 357.6 357.1 357.6 357.1
Non-distributable reserves 11 54.7 10.5 — —
Retained earnings 12 2 389.5 2 068.4 269.3 271.1
2 801.8 2 436.0 626.9 628.2
OUTSIDE SHAREHOLDERS’ INTEREST 242.2 222.0
NON-CURRENT LIABILITIES
Interest bearing debt 13 1 365.4 1 302.8 — —
Deferred tax 14 423.5 379.1 — —
1 788.9 1 681.9 — —
CURRENT LIABILITIES
Trade and other payables 2 208.7 2 104.0 1.0 0.6
Interest bearing debt 13 606.2 150.6 — —
Provisions 15 40.3 19.5 — —
Subsidiary companies 491.1 240.8
Taxation 67.0 130.2 — 17.1
Shareholders for dividend — 180.8 — 180.8
2 922.2 2 585.1 492.1 439.3
TOTAL EQUITY AND LIABILITIES 7 755.1 6 925.0 1 119.0 1 067.5

I N C O M E S T A T E M E N T Sfor the year ended 30 September
N A M P A K 5 5
Group Company
2001 2000 2001 2000Notes R million R million R million R million
REVENUE 16 10 474.3 9 632.8 — —
Selling expenses 182.4 171.6 — —
Distribution costs 400.4 347.0 — —
Raw materials 5 298.3 4 623.4 — —
GROSS PROFIT 4 593.2 4 490.8 — —
Employee costs 2 208.9 2 005.1 — —
Depreciation and other amortisation expenses 456.9 385.2 — —
Other operating expenses 1 278.0 1 196.9 2.1 2.3
Other operating income (211.1) (52.1) — —
PROFIT/(LOSS) BEFORE ABNORMAL ITEMS 17 860.5 955.7 (2.1) (2.3)
Abnormal items 18 158.2 33.1 — —
PROFIT/(LOSS) FROM OPERATIONS 702.3 922.6 (2.1) (2.3)
Net finance (costs)/income 19 (71.0) (49.9) 0.1 3.9
Income from investments 20 2.5 9.6 83.5 146.7
PROFIT BEFORE TAXATION 633.8 882.3 81.5 148.3
Taxation 21 171.4 215.0 (7.5) 24.9
PROFIT AFTER TAXATION 462.4 667.3 89.0 123.4
Share of associate companies’ losses — 1.4
Attributable to outside shareholders 41.0 46.2
NET PROFIT FOR THE YEAR 421.4 619.7 89.0 123.4
BASIC EARNINGS PER SHARE (CENTS) 22 82.7 121.7
FULLY DILUTED EARNINGS PER SHARE (CENTS) 22 82.7 121.4
HEADLINE EARNINGS PER SHARE (CENTS) 22 88.1 121.1
FULLY DILUTED HEADLINE EARNINGS
PER SHARE (CENTS) 22 88.1 120.8
DIVIDENDS PER SHARE (CENTS) 23 53.3 53.3

S T A T E M E N T S O F C H A N G E S I N E Q U I T Yfor the year ended 30 September
N A M P A K 5 6
Group Company
2001 2000 2001 2000R million R million R million R million
EQUITY AT BEGINNING OF YEAR 2 436.0 2 988.3 628.2 773.1
CHANGE IN ACCOUNTING POLICY (106.4)
CHANGES IN CAPITAL 0.5 3.2 0.5 3.2
Share capital — 0.1 — 0.1
Share premium on new issues 0.5 3.1 0.5 3.1
CHANGES IN NON-DISTRIBUTABLE RESERVES 44.2 (63.6) — —
Increase/(decrease) in foreign currency translation reserve 44.2 (74.1)
Transfer from retained earnings — 10.5 — —
CHANGES IN RETAINED EARNINGS 321.1 (385.5) (1.8) (148.1)
Goodwill written off (0.7) (723.2) — —
Subsidiaries not previously consolidated (7.8) —
Net profit for the year 421.4 619.7 89.0 123.4
Preference shares – dividends (0.1) (0.1) (0.1) (0.1)
Ordinary shares – dividends (91.7) (271.4) (90.7) (271.4)
Transfer to non-distributable reserves — (10.5) — —
EQUITY AT END OF YEAR 2 801.8 2 436.0 626.9 628.2

C A S H F L O W S T A T E M E N T Sfor the year ended 30 September
N A M P A K 5 7
Group Company
2001 2000 2001 2000Notes R million R million R million R million
CASH FLOWS FROM OPERATING ACTIVITIES
Cash generated from operations 27.1 1 030.3 1 118.5 267.4 237.0
Investment income 2.5 9.6 83.5 146.7
Interest received 101.0 84.5 0.1 5.1
Interest paid (172.0) (134.4) — (1.2)
Dividends paid (318.3) (295.7) (271.6) (269.5)
Taxation paid (299.2) (155.7) (9.9) (9.6)
Net cash inflow from operating activities 344.3 626.8 69.5 108.5
CASH FLOWS FROM INVESTING ACTIVITIES
Replacement capital expenditure (245.5) (294.2) — —
Expansion capital expenditure (145.1) (119.4) — —
Acquisition of businesses 27.2 (35.0) 97.9 — —
Increase in investment in subsidiaries (3.5) — (70.5) (266.1)
Proceeds on realisation of investments 7.2 — 0.6 —
Purchase of investments — (18.4) — —
Proceeds on the sale of property, plant and equipment 69.6 50.1 — —
Proceeds on the sale of businesses — 63.8 — —
Net movement on loans and advances — 4.1 — 4.2
Net cash outflow from investing activities (352.3) (216.1) (69.9) (261.9)
CASH FLOWS FROM FINANCING ACTIVITIES
Interest bearing debt raised — 481.1 — —
Interest bearing debt repaid (201.4) (928.3) — —
Movement on short-term interest bearing debt — 1.0 — —
Capital proceeds from issue of shares 0.5 3.2 0.5 3.2
Net cash (outflow)/inflow from financing activities (200.9) (443.0) 0.5 3.2
NET (DECREASE)/INCREASE IN CASH AND
CASH EQUIVALENTS (208.9) (32.3) 0.1 (150.2)
Cash and cash equivalents at beginning of year 596.8 637.7 0.3 150.5
Translation of cash in foreign subsidiaries 20.4 (8.6)
CASH AND CASH EQUIVALENTS AT END OF YEAR 27.3 408.3 596.8 0.4 0.3
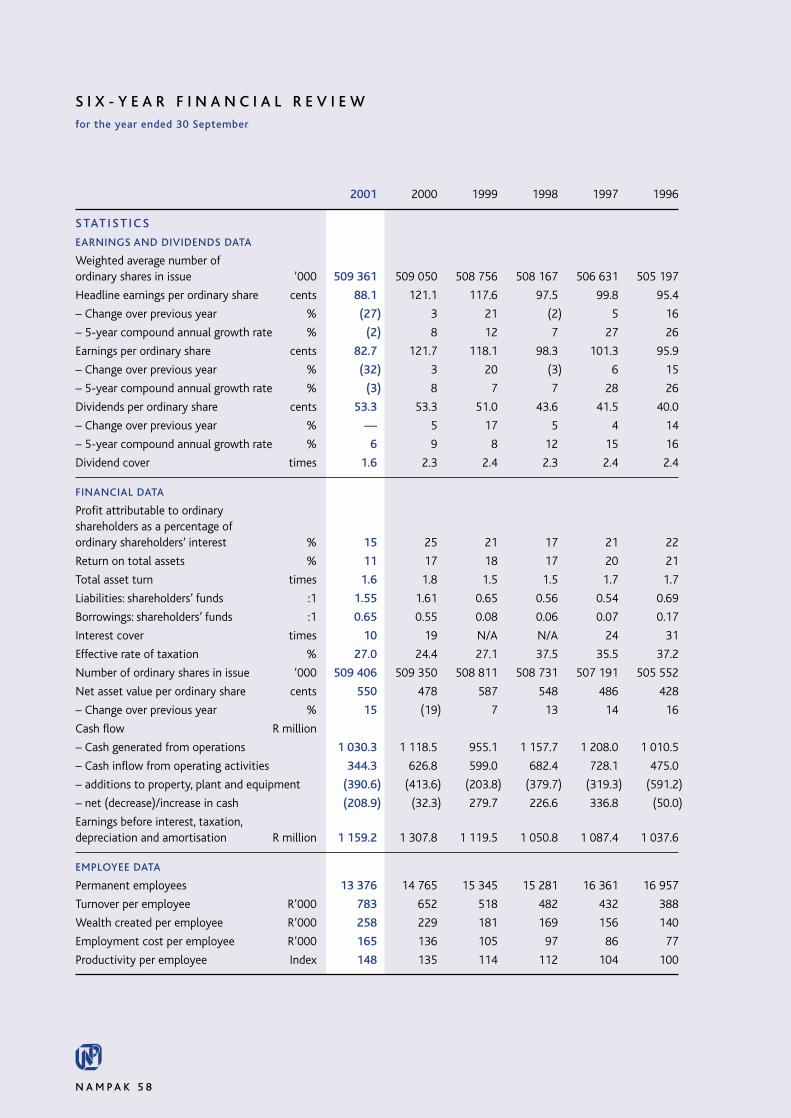
S I X - Y E A R F I N A N C I A L R E V I E Wfor the year ended 30 September
N A M P A K 5 8
2001 2000 1999 1998 1997 1996
S TAT I S T I C S
EARNINGS AND DIVIDENDS DATA
Weighted average number of ordinary shares in issue ’000 509 361 509 050 508 756 508 167 506 631 505 197
Headline earnings per ordinary share cents 88.1 121.1 117.6 97.5 99.8 95.4
– Change over previous year % (27) 3 21 (2) 5 16
– 5-year compound annual growth rate % (2) 8 12 7 27 26
Earnings per ordinary share cents 82.7 121.7 118.1 98.3 101.3 95.9
– Change over previous year % (32) 3 20 (3) 6 15
– 5-year compound annual growth rate % (3) 8 7 7 28 26
Dividends per ordinary share cents 53.3 53.3 51.0 43.6 41.5 40.0
– Change over previous year % — 5 17 5 4 14
– 5-year compound annual growth rate % 6 9 8 12 15 16
Dividend cover times 1.6 2.3 2.4 2.3 2.4 2.4
FINANCIAL DATA
Profit attributable to ordinary shareholders as a percentage of ordinary shareholders’ interest % 15 25 21 17 21 22
Return on total assets % 11 17 18 17 20 21
Total asset turn times 1.6 1.8 1.5 1.5 1.7 1.7
Liabilities: shareholders’ funds :1 1.55 1.61 0.65 0.56 0.54 0.69
Borrowings: shareholders’ funds :1 0.65 0.55 0.08 0.06 0.07 0.17
Interest cover times 10 19 N/A N/A 24 31
Effective rate of taxation % 27.0 24.4 27.1 37.5 35.5 37.2
Number of ordinary shares in issue ’000 509 406 509 350 508 811 508 731 507 191 505 552
Net asset value per ordinary share cents 550 478 587 548 486 428
– Change over previous year % 15 (19) 7 13 14 16
Cash flow R million
– Cash generated from operations 1 030.3 1 118.5 955.1 1 157.7 1 208.0 1 010.5
– Cash inflow from operating activities 344.3 626.8 599.0 682.4 728.1 475.0
– additions to property, plant and equipment (390.6) (413.6) (203.8) (379.7) (319.3) (591.2)
– net (decrease)/increase in cash (208.9) (32.3) 279.7 226.6 336.8 (50.0)
Earnings before interest, taxation,depreciation and amortisation R million 1 159.2 1 307.8 1 119.5 1 050.8 1 087.4 1 037.6
EMPLOYEE DATA
Permanent employees 13 376 14 765 15 345 15 281 16 361 16 957
Turnover per employee R’000 783 652 518 482 432 388
Wealth created per employee R’000 258 229 181 169 156 140
Employment cost per employee R’000 165 136 105 97 86 77
Productivity per employee Index 148 135 114 112 104 100

N A M P A K 5 9
R E T U R N
Operating profit plus income from investments.
TO TA L L I A B I L I T I E S
The aggregate of long-term and current liabilities (deferred taxation is excluded).
S H A R E H O L D E R S ’ F U N D S
The aggregate of ordinary, preference and outside shareholders’ interest.
TO TA L B O R R O W I N G S
All interest bearing debt.
E B I T D A
Earnings before interest, tax, depreciation and amortisation.
R E T U R N
To achieve a return before interest and taxation of at least 25% p.a. onaverage gross assets.
A S S E T M A N A G E M E N T
To manage the investment in inventories and receivables to itscommercially lowest level.
C A S H F L O W
To generate sufficient cash flow after absorbing increases in workingcapital, financing charges, taxes and dividends, to fund capital expenditurefor replacement of fixed assets.
E A R N I N G S
To achieve a growth in earnings per share of not less than the annualinflation rate plus the economic growth rate (gross domestic product).
D I V I D E N D
To determine the annual dividend cover with regard to the group’sfunding requirements, with minimum cover of 2.4 times.
D E F I N I T I O N S G R O U P F I N A N C I A L O B J E C T I V E S
2001 2000 1999 1998 1997 1996
INFLAT ION ADJUSTED INFORMATIONCPI index (base 1996 = 100) 139.4 135.0 126.0 117.1 109.8 100Deflation factor (base 1996 = 100) 71.7 74.1 79.4 85.4 91.1 100Headline earnings per share (cents)– Historical 88.1 121.1 117.6 97.5 99.8 95.4– Deflated † 63.2 89.7 93.3 83.3 90.9 95.4Dividends per share (cents)– Historical 53.3 53.3 51.0 43.6 41.5 40.0– Deflated † 38.2 39.5 40.5 37.2 37.8 40.0Total assets (Rm)– Historical 7 755.1 6 925.0 5 518.8 4 822.3 4 302.2 4 111.1– Deflated † 5 560.4 5 131.4 4 381.9 4 118.2 3 919.3 4 111.1
† = Historical statistics adjusted to 2001 money terms using the average Consumer Price Index
O P E R AT I N G R E S U LT S * R millionRevenue 10 474.3 9 632.8 7 942.9 7 361.1 7 070.7 6 572.1Profit from operations 702.3 922.6 824.9 792.0 835.6 804.2Margin to revenue 6.7% 9.6% 10.4% 10.8% 11.8% 12.2%Profit before taxation 633.8 882.3 861.9 824.3 826.4 798.5Profit after taxation 462.4 667.3 628.5 515.5 532.8 501.7Net profit for the year 421.4 619.7 600.9 499.4 513.3 484.3
B A L A N C E S H E E T S * R millionTotal shareholders’ funds 3 044.0 2 658.0 3 202.7 2 869.7 2 543.7 2 237.4Deferred taxation 423.5 379.1 242.9 350.5 282.3 253.9Interest bearing debt 1 368.8 1 308.9 268.4 174.7 199.3 393.9Current liabilities 2 918.8 2 579.0 1 804.8 1 427.4 1 276.9 1 225.9
TOTAL EQUITY AND LIABILITIES 7 755.1 6 925.0 5 518.8 4 822.3 4 302.2 4 111.1
Property, plant and equipment 3 500.6 3 340.9 2 451.4 2 237.3 2 066.5 1 927.4Intangibles (73.8) (101.6) — — — —Investments and deferred tax 135.5 111.6 45.0 114.0 44.7 43.2Current assets 4 192.8 3 574.1 3 022.4 2 471.0 2 191.0 2 140.5
TOTAL ASSETS 7 755.1 6 925.0 5 518.8 4 822.3 4 302.2 4 111.1
*Amounts relating to years ended 1999 and prior have not been re-stated for the effects of the change in accounting policy

A C C O U N T I N G P O L I C I E Sfor the year ended 30 September
N A M P A K 6 0
1. B A S I S O F P R E PA R AT I O N
These financial statements are presented in South
African rand, being the currency in which the majority
of the group’s transactions are denominated.
The financial statements have been prepared under
the historic cost convention, as modified by the
revaluation of certain trading assets and liabilities
to fair value and certain long-term assets which
have been written down to recognise permanent
diminutions in value.
These financial statements have been prepared in
conformity with South African Statements of
Generally Accepted Accounting Practice. The principal
accounting policies adopted are set out below.
The principal accounting policies of the group have
been applied consistently with the previous year
except for the change set out in note 4.
2. B A S I S O F C O N S O L I D AT I O N
The consolidated financial statements include the
assets, liabilities, results and cash flow information
of the company, its subsidiaries, associate companies
and joint ventures. The results of subsidiaries,
associate companies and joint ventures are included
in the consolidated financial statements from the
effective dates of acquisition until the effective date
of disposal. Those subsidiaries and joint ventures
operating out of Zimbabwe, which were previously
consolidated, are now shown in the consolidated
financial statements at carrying value.
All intercompany transactions, balances and
unrealised surpluses and deficits on transactions
between group companies have been eliminated.
3. S U B S I D I A RY C O M PA N I E S
Subsidiary companies are those companies in which
the group has an interest of more than one half of
the voting rights or otherwise has the power to
exercise control over the operations.
The assets and liabilities of subsidiary companies
are measured at their fair values at the date of
acquisition. The interest of outside shareholders is
stated at their proportion of the fair values of the
assets and liabilities recognised.
4. A S S O C I AT E C O M PA N I E S
Associate companies are those companies in
which the group holds a long-term equity interest
and is in a position to exercise significant
influence, but not control, through participation in
the financial and operating policy decisions of the
investee. The results, assets and liabilities of
associate companies are incorporated in these
consolidated financial statements using the equity
method of accounting. The carrying amount of
such investments is reduced to recognise any
decline, other than a temporary decline, in the
value of individual investments.
5. J O I N T V E N T U R E S
A joint venture is a contractual arrangement whereby
the group and outside parties undertake an economic
activity which is subject to joint control.
Joint venture arrangements undertaken in a separate
entity are referred to as jointly controlled entities.
The group reports its interests in jointly controlled
entities using proportionate consolidation, in terms
of which the group’s share of the assets, liabilities,
results and cash flow information of jointly
controlled entities are included in the consolidated
financial statements on a line-by-line basis.
Where the group transacts with its jointly controlled
entities, unrealised profits and losses are eliminated
to the extent of the group’s interest in the joint
venture, except where unrealised losses provide
evidence of an impairment of the asset transferred.
6. F O R E I G N E N T I T I E S
Assets and liabilities of foreign entities are translated
into South African rand at rates ruling at the balance
sheet date. Income statement items are translated
at the weighted average rate of exchange for the
period. Equity and goodwill are translated at the rate
ruling at date of acquisition. Exchange differences
arising, if any, are classified as equity and are taken
directly to a foreign currency translation reserve.
Such translation differences are recognised as

N A M P A K 6 1
income or expenses in the period in which the
operation is disposed of.
7. F O R E I G N C U R R E N C I E S
Assets and liabilities denominated in foreign
currencies, other than those covered by forward
exchange contracts, are translated at rates ruling at
the balance sheet date. Transactions in foreign
currencies are accounted for at the rate ruling at
the date of the transaction. Profit or losses on
translation are charged to the income statement in
the period in which they are incurred except for
differences on exchange arising on the purchase of
plant and equipment prior to commissioning, which
are recognised as part of the cost of such assets.
8. G O O D W I L L
Goodwill arising on consolidation represents the
excess of the cost of an acquisition over the group’s
interest in the fair value of the identifiable assets
and liabilities of a subsidiary, associate or jointly
controlled entity at the date of acquisition. Goodwill
is recognised as an asset and amortised on a
systematic basis over its useful economic life, subject
to a maximum of twenty years. The assessment of
useful economic life of goodwill is based on the
nature of the specific underlying business acquired.
Negative goodwill represents the excess of the group’s
interest in the fair value of the identifiable assets
and liabilities acquired over the cost of the
acquisition. To the extent that negative goodwill
relates to expected future losses and expenses it is
recognised as income in the period when the future
losses and expenses occur. To the extent that
negative goodwill relates to an identifiable non-
monetary asset, it is recognised as income over the
estimated useful economic life of that asset not
exceeding 20 years, provided that where the
amount of negative goodwill is in excess of the fair
value of the non-monetary asset, this portion is
recognised as income immediately. To the extent
that negative goodwill relates to monetary assets,
it is recognised as income immediately.
On disposal of a subsidiary, associate or joint
venture, any unamortised goodwill, or goodwill set
off against shareholders’ funds, is included in the
determination of the profit or loss on disposal.
The carrying amount of goodwill is reviewed annually
for impairment. Any provision for permanent
impairment is charged against profit for the period
in which the impairment arose.
The treatment of goodwill represents a change in
accounting policy during the current year.
Previously goodwill was charged directly against
shareholders’ funds in the acquisition period.
Purchased goodwill has not been restated.
Negative goodwill, which was previously included in
non-distributable reserves, has been restated for the
change in accounting policy and comparative
amounts adjusted accordingly.
9. I N TA N G I B L E S
Acquired intangible assets, including trademarks, are
capitalised and amortised on a straight line basis
over their estimated useful economic life, not
exceeding 20 years.
Prior to 1 October 2000, intangibles acquired on
acquisition were written off directly to shareholders’
funds in the acquisition period.
10. R E S E A R C H , D E V E L O P M E N T A N D
R E L AT E D E X P E N D I T U R E
Research costs are recognised as an expense in the
period in which they are incurred.
Expenditure on development is charged to income
in the period in which it is incurred except where a
clearly defined project is undertaken and it is
reasonably anticipated that development costs will
be recovered through future commercial activity.
Such development costs are recognised as an
intangible asset and amortised over the estimated
useful economic life of the project from the date of
commencement of the commercial operation,
subject to a maximum of five years.

A C C O U N T I N G P O L I C I E S continued
for the year ended 30 September
N A M P A K 6 2
11. P R O P E RT Y , P L A N T A N D E Q U I P M E N T
Property, plant and equipment are accounted for at
cost less accumulated depreciation. All direct costs,
including finance costs relating to major capital
projects, are capitalised up to the date of
commissioning. Where the recoverable amount of
an asset has declined below its carrying amount,
the carrying amount is reduced to reflect this
decline in value.
Depreciation is charged so as to write off the cost
or valuation of assets, other than freehold land and
property, over their estimated useful economic
lives, using the straight-line method. Depreciation is
not provided in respect of freehold land and
property except where a capitalised cost has been
incurred to provide a specialised facility for
the tenant.
Assets held under finance leases are depreciated
over the lesser of expected useful life or the term
of the lease.
The rates of depreciation used are:
Freehold specialised buildings 50 years
Leasehold buildings Lease term
Plant and equipment 4 to 15 years
Furniture and equipment 4 to 15 years
Motor vehicles 4 to 5 years
12. I N V E S T M E N T S
Long-term investments, other than subsidiary,
associate companies and jointly controlled entities,
are stated individually at the lower of cost and their
recoverable amount. Recoverable amount is
determined by taking the higher of net realisable
value and value in use.
13. I N V E N TO R I E S
Inventories are stated at the lower of cost and net
realisable value, after making allowance for slow-
moving and redundant items. Cost comprises direct
materials and, where applicable, direct labour and
those overheads that have been incurred in bringing
the inventories to their present location and
condition. Cost is calculated using the first-in, first-
out method.
14. TA X AT I O N
The charge for the year is based on the results for the
year as adjusted for items which are non-deductible
or disallowed. It is calculated using tax rates that
have been enacted or substantively enacted by the
balance sheet date.
Deferred taxation is provided on the comprehensive
basis using the balance sheet liability method.
A deferred tax liability is recognised for all taxable
temporary differences. A deferred tax asset is
recognised to the extent that it is probable that
taxable profit will be available against which
deductible temporary differences can be utilised.
Such assets and liabilities are not recognised if the
temporary differences arise from goodwill or from
the initial recognition of other assets and liabilities
which affects neither the tax profit nor the
accounting profit at the time of the transaction.
Deferred tax liabilities are recognised for taxable
temporary differences associated with investments
in subsidiaries and associates, and interests in joint
ventures, except where the group is able to control
the reversal of the temporary difference and it is
probable that the temporary difference will not
reverse in the future.
Deferred tax is calculated at the tax rates that are
expected to apply to the period when the asset is
realised or the liability settled.
15. O F F S E T
Financial assets and liabilities are offset and disclosed
on a net basis in the consolidated balance sheet
when there is legal right to set off and there is
either an intention to settle on a net basis or to
realise the asset and settle the liability simultaneously.

N A M P A K 6 3
16. P R O V I S I O N S
Provisions are raised when a present obligation
exists as a result of a past event and it is probable
that an outflow of resources will be required to
settle the obligation, and a reliable estimate can be
made of the amount of the obligation.
17. I M PA I R M E N T
On an annual basis the group reviews all assets, both
tangible and intangible, carried on the balance sheet
for impairment. Where the recoverable amount of
an asset or cash generating unit is estimated to be
lower than its carrying amount, its carrying amount
is reduced to its recoverable amount. Impairment
losses are charged against income in the period in
which they are identified.
Where an impairment loss subsequently reverses,
the carrying amount of the asset or cash generating
unit is increased to the revised estimate of its
recoverable amount. Such increases in carrying
amount are limited to original cost. A reversal of an
impairment loss is recognised in income in the
period in which such reversal is identified.
18. R E V E N U E R E C O G N I T I O N
Sales of goods are recognised when goods are delivered
or title has passed. Revenue comprises the net
invoiced value of goods delivered and services rendered
during the year and excludes value added tax.
Where companies act as agents and are remunerated
on a commission basis, only the commission income,
not the value of business handled, is recognised as
revenue.
Interest income is accrued on a time basis, by
reference to the principal outstanding and at the
interest rate applicable.
Dividend income from investments is recognised
when the shareholders’ rights to receive payment
have been established, except in circumstances
where severe long-term restrictions impair the
ability of the underlying operation from
transferring funds to the group. In these
circumstances, dividends are recognised
on a cash receipt basis.
19. S E G M E N TA L R E P O RT I N G
For management purposes, the group is organised
into business clusters.
Operating divisions are grouped into one or other
of these clusters depending on the dominant nature
of the underlying business.
In addition, the businesses are grouped by geographical
location. The main geographic regions identified are
South Africa, Africa and Europe. Geographic split is
determined by location of the operating assets.
Inter-company transactions and balances are
separately disclosed.
20. A B N O R M A L I T E M S
Abnormal items are defined as items of income and
expenditure which do not arise from normal trading
activities or are of such size, nature or incidence
that their disclosure is relevant to explain the
performance for the period.
21. H E A D L I N E E A R N I N G S P E R S H A R E
The group has followed the recommendation
contained in Accounting Task Force Opinion AC 306
and has published headline earnings per share in
addition to attributable earnings per share.
Headline earnings per share has been calculated in
accordance with the requirements of AC 306.
Attributable profit per share has been based on
earnings attributable to ordinary shareholders.
22. C O M PA R AT I V E F I G U R E S
Comparative figures have been restated to show
the effect of the change in accounting policy for
negative goodwill, and the effect of deconsolidating
the Zimbabwe operations.

N O T E S T O T H E F I N A N C I A L S T A T E M E N T Sfor the year ended 30 September
N A M P A K 6 4
1. F I N A N C I A L R I S K M A N A G E M E N T
TREASURY RISK MANAGEMENT
The group’s treasury risk is managed through two subcommittees reporting to the board of directors. The role ofthese committees is to decide the appropriate philosophy to be adopted within the group regarding the managementof treasury risks and for considering and managing the group’s existing financial market risks by adopting strategieswithin the guidelines set by the board of directors.
The group has adopted the Value at Risk methodology for evaluating financial market risks. The main risk areas thegroup is exposed to are interest rates, liquidity, currency and commodity prices.
INTEREST RATE RISK MANAGEMENT
Interest rate risk is the possibility that the group may suffer financial loss if either a fluctuating interest rate or fixedinterest rate position is entered into and interest rates move adversely. The group uses swaps, options, forward rateagreements and other standard market instruments to manage this risk. The risk profile of financial assets and liabilitiesat balance sheet date is detailed below:
NetFloating rate Fixed rate Floating rate liability/
liabilities liabilities assets (asset)
R million R million R million R million
South African rand 407.5 69.2 39.1 437.6
UK pounds 1 308.4 — 869.7 438.7
Other currencies 120.1 — — 120.1
TOTAL AT 30 SEPTEMBER 2001 1 836.0 69.2 908.8 996.4
South African rand 50.0 85.9 230.0 (94.1)
UK pounds 1 231.1 — 436.6 794.5
Other currencies 79.2 — — 79.2
TOTAL AT 30 SEPTEMBER 2000 1 360.3 85.9 666.6 779.6
LIQUIDITY RISK MANAGEMENT
Liquidity risk is the possibility that the group may suffer financial loss through liquid funds not being available or thatexcessive finance costs must be paid to obtain funds to meet payment requirements. The group manages this riskthrough forecasting and monitoring cash flow requirements on a daily basis, and by maintaining sufficient undrawnfacilities. Significant liquid resources were held at the year end. The group had the following undrawn facilitiesavailable at the balance sheet date:
South Africa Europe Total
R million R million R million
EXPIRY PERIOD AT 30 SEPTEMBER 2001
One year 1 795.0 56.2 1 851.2
Two to five years 395.0 686.1 1 081.1
2 190.0 742.3 2 932.3
EXPIRY PERIOD AT 30 SEPTEMBER 2000
One year 1 735.0 42.7 1 777.7
Two to five years 445.0 394.7 839.7
2 180.0 437.4 2 617.4

N A M P A K 6 5
1. F I N A N C I A L R I S K M A N A G E M E N T (continued)
CURRENCY RISK MANAGEMENT
Currency risk is the possibility that the group may suffer financial loss as a consequence of a depreciation in a reportingcurrency relative to a foreign currency prior to payment of a commitment in that foreign currency or of the reportingcurrency strengthening prior to receiving payment in that foreign currency. The group also has translation risk arisingfrom the consolidation of foreign entities into South African rands.
The group uses swaps, options and other financial instruments, in particular forward contracts, to manage transactionalcurrency risks. Specific translation risks are managed through the selective use of options and hedge positions. Netcurrency exposures and hedging positions are centrally controlled and managed for South African operations. Thecurrency exposure of the group’s European operations is centrally controlled and managed through the Isle of Man.Speculative positions are not permitted.
All imports and exports are fully covered at balance sheet date. The values of forward contracts entered into at30 September are:
Contract rate 2001 2000R million R million
US dollars 8.40 132.8 173.0
Euro 7.52 94.1 84.3
UK pounds 12.04 (6.3) (14.6)
Other 4.8 4.4
225.4 247.1
Currency conversion guide at 30 September 2001 2000
US dollars 8.9940 7.2530
Euro 8.2183 6.3620
UK pounds 13.1951 10.6681
COMMODITY PRICE RISK MANAGEMENT
Commodity price risk is the risk that the group may suffer financial loss when a fluctuating price contract obligationis entered into and commodity prices increase or when a fixed price agreement is entered into and commodity pricesfall. The following open commodity positions were held at 30 September:
2001 2000R million R million
Aluminium futures 70.9 10.3
The group uses derivative instruments including forward agreements and futures to hedge commodity price risk.
CREDIT RISK MANAGEMENT
Potential concentrations of credit risk consist principally of cash investments and trade debtors. The group onlydeposits cash surpluses with major banks of high standing.
Trade debtors comprise a large, widespread customer base. Ongoing credit evaluations on the financial condition ofcustomers are performed and, where appropriate, credit guarantee insurance cover is purchased or provisions made.
The group does not consider there to be any significant concentration of credit risk which had not been insured oradequately provided for at the balance sheet date.
FAIR VALUE OF FINANCIAL INSTRUMENTS
The carrying amounts reported in the balance sheet for liquid resources, trade debtors and trade creditorsapproximate fair value.

N O T E S T O T H E F I N A N C I A L S T A T E M E N T S continued
for the year ended 30 September
N A M P A K 6 6
2. R E T I R E M E N T B E N E F I T I N F O R M AT I O N
2.1 RETIREMENT BENEFITS
The policy of the group is to provide retirement benefits for its permanent employees through defined benefitand defined contribution pension and provident funds, except where employees are required, either bylegislation and/or negotiation, to be members of a designated industry scheme.
All funds are fully funded with their assets held in trust funds controlled by trustees which include electedemployee representatives or in funds effectively managed by independent experts.
South African funds are governed by the Pension Funds Act of 1956. United Kingdom funds are governed by thePensions Act 1995. Defined benefit funds are actuarially valued at intervals of not more than three years usingthe attained age method in South Africa and the minimum funding basis in the United Kingdom. Where anydeficit is identified it is funded by the entity concerned by way of increased future contributions or by thepayment of an actuarially determined lump sum.
Current contribution costs in respect of defined benefit retirement funds are actuarially determined, andservice costs in respect of existing employees, including changes in actuarial assumptions, fund amendmentsand experience adjustments, are recognised as an expense systematically over the expected remaining workinglives of the relevant employees. However, any surplus income arising is only recognised to the extent that acontribution holiday is taken. Past service adjustments required in respect of retired employees are raised as anexpense in the period in which the relevant fund implements its amendment.
Membership costs and unrecognised surpluses for each fund are as follows:
ContributionCountry Employees Members costs Reserves†
R million R million
DEFINED BENEFIT FUNDS
Nampak Group Pension Fund* RSA 18 26 — 1.7
Nampak plc Pension Plan UK 895 1 818 2.4 94.9
Nampak plc Staff Pension Plan UK 151 320 4.8 36.4
1 064 2 164 7.2 133.0
DEFINED CONTRIBUTION FUNDS
Nampak Group Pension Fund RSA 2 261 2 293 —
Nampak Group Provident Fund RSA 4 668 4 764 29.6
Metal Box Provident Fund RSA 3 157 3 157 21.0
Crown Cork Provident Fund RSA 71 71 1.0
Metal Box Namibia Provident Fund Namibia 18 18 —
BlowMocan Polysystems Retirement
Benefit Scheme UK 156 469 2.2
10 331 10 772 53.8

N A M P A K 6 7
2. R E T I R E M E N T B E N E F I T I N F O R M AT I O N (continued)
ContributionCountry Employees Members costs
R million
EXTERNAL FUNDS
External funds** Europe 337 337 4.0
Industry funds RSA 1 644 1 644 4.2
1 981 1 981 8.2
TOTALS 13 376 14 917 69.2
*Closed fund **Funded by insurance policies †Reserves at revaluation date
The actuarial valuations and basis of valuation of the defined benefit funds are as follows:
PresentValuation Fair value value of Valuation
date of assets liabilities basis
R million R million
DEFINED BENEFIT FUNDS
Nampak Group Pension Fund# Feb 01 20.5 18.8 AA
Nampak plc Pension Plan Apr 00 403.0 308.1 MFR
Nampak plc Staff Pension Plan Apr 00 306.8 270.4 MFR
AA: attained age method MFR: minimum funding requirements#Valuation subject to approval by Trustees
The latest actuarial valuations in respect of the defined benefit funds found them in sound financial condition.In arriving at their findings the actuaries have taken into account reasonable long-term estimates of inflation,future increases in wages, salaries and pensions and sustainable investment returns.
2.2 POST-RETIREMENT MEDICAL BENEFITS
The group policy is not to provide post-retirement medical benefits for employees who joined the companyafter 1 June 1996. The cost of funding current pensioner and future post-retirement medical contributions topersons employed before the change in policy is expensed as and when incurred. Premiums paid this year inrespect of pre-funded post-retirement contribution cover amounted to R20.5 million (2000: R0.5 million).
The actuarially determined exposure in respect of past service costs relating to covered employees wasR258 million at the last valuation dated 1 January 1999. The group has fully insured this exposure through apre-funded post-retirement policy. The next valuation is due to take place as at 31 March 2002.

N O T E S T O T H E F I N A N C I A L S T A T E M E N T S continued
for the year ended 30 September
N A M P A K 6 8
3. S E G M E N TA L R E P O RTMETALS 3 096.8 2 992.3 203.5 297.5 6.6 9.9
Bevcan 1 455.0 1 398.9 109.1 153.7 7.5 11.0
Foodcan and Divpac 1 181.7 1 176.1 82.8 118.4 7.0 10.1
Other 460.1 417.3 11.6 25.4 2.5 6.1
PAPER 3 342.7 3 090.1 242.3 282.7 7.2 9.2
Corrugated/Printpak 1 736.7 1 586.5 160.5 155.2 9.2 9.8
Tissue 853.4 794.5 37.9 57.5 4.4 7.2
Paper Merchants 681.9 622.0 31.5 40.1 4.6 6.4
Other 70.7 87.1 12.4 29.9 17.5 34.3
PLASTICS 3 864.5 3 422.7 167.8 180.1 4.3 5.3
Nampak plc 1 982.4 1 570.9 111.9 97.8 5.6 6.2
Rotoflex and Sacks 643.2 573.5 0.2 27.4 0.0 4.8
Petpak and Liquid 615.6 603.1 39.4 29.7 6.4 4.9
Other 623.3 675.2 16.3 25.2 2.6 3.7
OTHER 170.3 127.7 88.7 162.3 52.1 127.1
Property and Treasury — — 69.9 93.0 — —
NamITech 256.5 149.2 37.3 22.3 14.5 15.0
NIL 124.5 127.7 (7.7) 52.9 (6.2) 41.4
Other (210.7) (149.2) (10.8) (5.9) 5.1 4.0
TOTAL 10 474.3 9 632.8 702.3 922.6 6.7 9.6
GEOGRAPHICAL ANALYSIS
South Africa 8 507.3 7 976.8 585.8 742.0 6.9 9.3
Africa 70.8 87.1 12.3 29.9 17.4 34.3
Europe – Nampak plc 1 982.4 1 570.9 111.9 97.8 5.6 6.2
Europe – NIL 124.5 127.7 (7.7) 52.9 (6.2) 41.4
Intergroup eliminations (210.7) (129.7)
TOTAL 10 474.3 9 632.8 702.3 922.6 6.7 9.6
Profit/(loss) from Operating Revenue operations margin
2001 2000 2001 2000 2001 2000R million R million R million R million % %

N A M P A K 6 9
304.8 386.5 1 504.2 1 453.8 635.1 678.0 93.6 104.2 101.3 89.0
153.0 193.1 656.5 650.9 251.0 281.3 46.5 33.5 43.9 39.4
104.7 138.6 540.0 497.2 280.5 278.6 37.2 56.5 21.9 20.2
47.1 54.8 307.7 305.7 103.6 118.1 9.9 14.2 35.5 29.4
340.6 386.9 1 693.1 1 669.3 1 020.5 1 015.6 36.1 50.1 98.3 104.2
218.4 215.3 774.1 808.6 391.6 378.2 20.0 19.9 57.9 60.1
77.3 98.6 593.9 547.5 499.2 485.5 13.6 24.6 39.4 41.1
33.2 41.8 261.0 268.1 108.8 130.1 1.2 1.7 1.7 1.7
11.7 31.2 64.1 45.1 20.9 21.8 1.3 3.9 (0.7) 1.3
406.1 367.4 2 821.6 2 467.3 1 106.4 1 149.0 207.6 217.4 238.3 187.3
273.3 208.8 1 952.6 1 587.7 741.4 722.2 142.4 135.1 161.4 111.0
17.0 41.9 268.9 253.0 135.4 158.0 27.3 21.0 16.8 14.5
73.0 64.8 337.5 354.6 112.7 132.5 25.7 32.3 33.6 35.1
42.8 51.9 262.6 272.0 116.9 136.3 12.2 29.0 26.5 26.7
107.7 167.0 647.4 593.3 (513.0) (538.3) 53.3 41.9 19.0 4.7
70.1 93.1 403.3 435.8 110.0 2.8 5.5 22.7 0.2 0.1
45.0 27.4 243.5 73.1 86.0 27.1 42.5 16.0 7.7 5.1
(7.4) 53.1 1 159.7 680.5 124.1 26.1 –– 0.5 0.3 0.2
— (6.6) (1 159.1) (596.1) (833.1) (594.3) 5.3 2.7 10.8 (0.7)
1 159.2 1 307.8 6 666.3 6 183.7 2 249.0 2 304.3 390.6 413.6 456.9 385.2
881.7 1 014.8 3 489.9 3 870.4 1 362.6 1 534.2 246.9 274.1 295.9 272.8
11.6 31.2 64.1 45.1 20.9 21.8 1.3 3.9 (0.7) 1.3
273.3 208.7 1 952.6 1 587.7 741.4 722.2 142.4 135.1 161.4 110.9
(7.4) 53.1 1 159.7 680.5 124.1 26.1 — 0.5 0.3 0.2
1 159.2 1 307.8 6 666.3 6 183.7 2 249.0 2 304.3 390.6 413.6 456.9 385.2
Capital Depreciation EBITDA Operating assets Operating liabilities expenditure and amortisation
2001 2000 2001 2000 2001 2000 2001 2000 2001 2000R million R million R million R million R million R million R million R million R million R million

N O T E S T O T H E F I N A N C I A L S T A T E M E N T S continued
for the year ended 30 September
N A M P A K 7 0
4. C H A N G E I N A C C O U N T I N G P O L I C Y
The group has changed its accounting policy in respect of intangible assets and goodwill to comply with the requirements of AC129 – Intangible Assets, and AC131 – Business Combinations.
The aggregate effect of the change in accounting policy on the annual financial statements for the year ended 30 September is as follows:
Net profit for the year as previously stated 416.5 625.0
Business combinations – negative goodwill 4.9 4.9
PROFIT AFTER EFFECT OF CHANGE
IN ACCOUNTING POLICY 421.4 629.9
Deconsolidation of Zimbabwean operations — (10.2)
PROFIT PER INCOME STATEMENT 421.4 619.7
The aggregate effect of the change in accounting policy on opening retained income is as follows:
Opening retained income as previously stated 2 382.9
Prior year adjustment – business combinations 71.0
OPENING RETAINED INCOME AFTER CHANGE
IN ACCOUNTING POLICY 2 453.9
Group Company
2001 2000 2001 2000R million R million R million R million

N A M P A K 7 1
Freehold Plant, Capitalisedland and Leasehold equipment leased plantbuildings buildings and vehicles and vehicles Total
R million R million R million R million R million
5. P R O P E RT Y , P L A N T A N D E Q U I P M E N T
2001
COST
Balance at beginning of year 1 022.3 44.4 5 643.1 1.8 6 711.6
Additions 8.7 0.5 381.2 0.2 390.6
Acquisition of businesses — — 28.3 — 28.3
Disposals 29.9 2.5 284.9 0.2 317.5
Impairment loss 20.7 — 0.8 — 21.5
Translation differences and other movements 227.8 12.3 463.3 (0.8) 702.6
BALANCE AT END OF YEAR 1 208.2 54.7 6 230.2 1.0 7 494.1
DEPRECIATION
Balance at beginning of year 101.0 25.4 3 242.7 1.6 3 370.7
Acquisition of businesses — — 9.6 — 9.6
Charge for the year (5.3) 0.6 446.0 2.2 443.5
Depreciation on disposals 1.5 — 245.6 — 247.1
Translation differences and other movements 1.1 2.5 416.1 (2.9) 416.8
BALANCE AT END OF YEAR 95.3 28.5 3 868.8 0.9 3 993.5
NET BOOK VALUE AT 30 SEPTEMBER 2001 1 112.9 26.2 2 361.4 0.1 3 500.6
NET BOOK VALUE AT 30 SEPTEMBER 2000 921.3 19.0 2 400.4 0.2 3 340.9
The open market value of the group’s freehold land and buildings, as determined by The Property Partnership at30 September 1999, adjusted for subsequent additions, disposals, impairments and translation differencetotalled R1 107.8 million (2000: R924.4 million). A schedule of the group’s properties is available to users of thefinancial statements on receipt of a written request. The insured value of the plant, equipment and vehicles at30 September 2001 was R13 998.0 million (2000: R12 627.3 million).
Refer to note 13 for details of property, plant and equipment encumbered.

N O T E S T O T H E F I N A N C I A L S T A T E M E N T S continued
for the year ended 30 September
N A M P A K 7 2
NegativeGoodwill goodwill Other Total
R million R million R million R million
6. I N TA N G I B L E A S S E T S
2001
COST
Balance at beginning of year — (193.2) 17.6 (175.6)
Acquisition of business 41.2 — — 41.2
BALANCE AT END OF YEAR 41.2 (193.2) 17.6 (134.4)
AMORTISATION
Balance at beginning of year — (74.0) — (74.0)
Charge for the year 0.7 (4.9) 17.6 13.4
BALANCE AT END OF YEAR 0.7 (78.9) 17.6 (60.6)
CARRYING VALUE AT 30 SEPTEMBER 2001 40.5 (114.3) — (73.8)
CARRYING VALUE AT 30 SEPTEMBER 2000 — (119.2) 17.6 (101.6)
Group Company
2001 2000 2001 2000R million R million R million R million
7. I N V E S T M E N T S
(Refer to Annexure B for details)
Shares at cost less amounts written off 3.3 10.0 — —
DIRECTORS’ VALUATION 3.3 10.0 — —
Loans
– Nampak 1979 Share Purchase Scheme 14.6 15.2 14.6 15.2
– Other 1.2 14.2 1.2 1.2
Total loans 15.8 29.4 15.8 16.4
TOTAL 19.1 39.4 15.8 16.4

N A M P A K 7 3
8. I N V E S T M E N T I N S U B S I D I A R I E S A N D J O I N T V E N T U R E S
(Refer to Annexure A for details)
Interest in subsidiaries and joint ventures not consolidated 121.7 73.0
Interest in subsidiaries and joint ventures 611.4 810.0
Net amount (due by)/due to subsidiaries and joint ventures (13.1) (0.8) 253.8 (15.3)
SHARES AT COST LESS AMOUNTS WRITTEN OFF 108.6 72.2 865.2 794.7
9. I N V E N TO R I E S
Raw materials 309.7 288.7 — —
Work in progress 68.5 55.8 — —
Finished goods 505.5 446.7 — —
Consumables 352.4 352.8 — —
Development land — 2.1 — —
TOTAL 1 236.1 1 146.1 — —
10. C A P I TA L
SHARE CAPITAL
Authorised:
600 000 000 ordinary shares of 5 cents each 30.0 30.0 30.0 30.0
100 000 6.5% cumulative preference shares of R2 each 0.2 0.2 0.2 0.2
400 000 6% cumulative preference shares of R2 each 0.8 0.8 0.8 0.8
TOTAL 31.0 31.0 31.0 31.0
Issued:
509 406 100 (2000: 509 350 500) ordinary shares of 5 cents each 25.5 25.5 25.5 25.5
100 000 6.5% cumulative preference shares of R2 each 0.2 0.2 0.2 0.2
400 000 6% cumulative preference shares of R2 each 0.8 0.8 0.8 0.8
TOTAL 26.5 26.5 26.5 26.5
28 434 680 ordinary shares (2000: 28 490 280) have been set aside for employees’ share schemes. The balance of unissued shares of 62 159 220 (2000: 62 159 220) has been placed at the disposal of the directors until the next annual general meeting.
Group Company
2001 2000 2001 2000R million R million R million R million
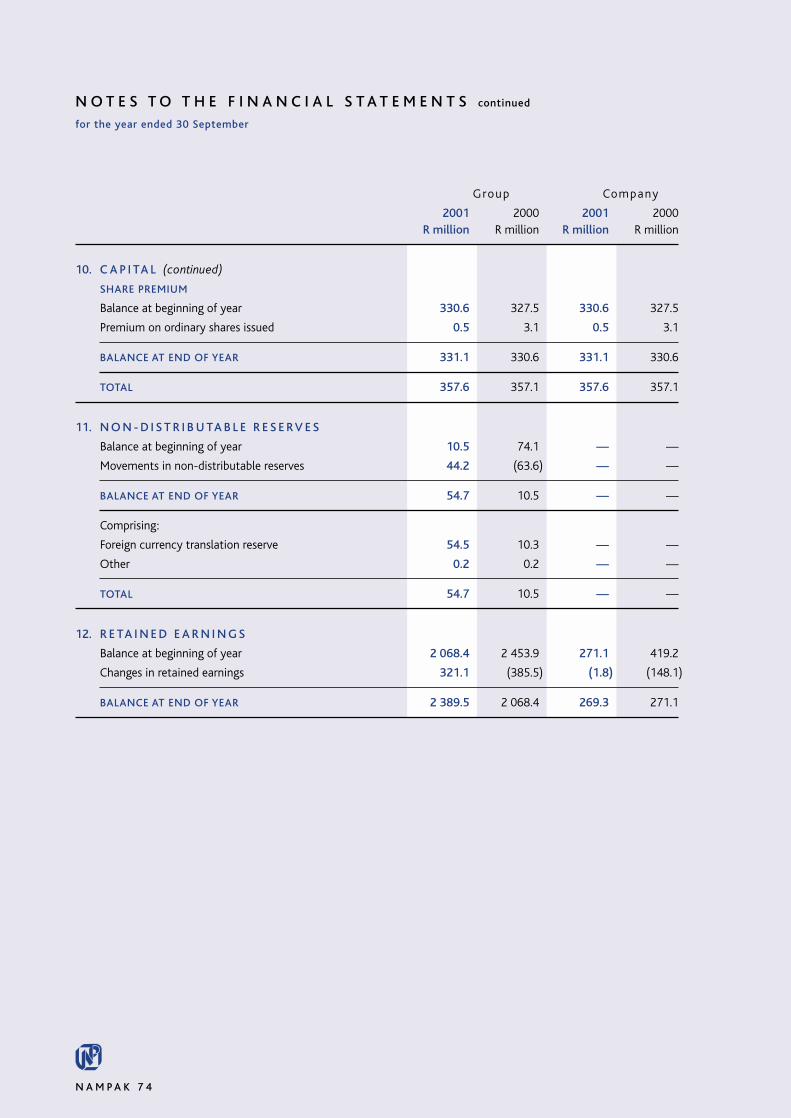
N O T E S T O T H E F I N A N C I A L S T A T E M E N T S continued
for the year ended 30 September
N A M P A K 7 4
10. C A P I TA L (continued)
SHARE PREMIUM
Balance at beginning of year 330.6 327.5 330.6 327.5
Premium on ordinary shares issued 0.5 3.1 0.5 3.1
BALANCE AT END OF YEAR 331.1 330.6 331.1 330.6
TOTAL 357.6 357.1 357.6 357.1
11. N O N - D I S T R I B U TA B L E R E S E RV E S
Balance at beginning of year 10.5 74.1 — —
Movements in non-distributable reserves 44.2 (63.6) — —
BALANCE AT END OF YEAR 54.7 10.5 — —
Comprising:
Foreign currency translation reserve 54.5 10.3 — —
Other 0.2 0.2 — —
TOTAL 54.7 10.5 — —
12. R E TA I N E D E A R N I N G S
Balance at beginning of year 2 068.4 2 453.9 271.1 419.2
Changes in retained earnings 321.1 (385.5) (1.8) (148.1)
BALANCE AT END OF YEAR 2 389.5 2 068.4 269.3 271.1
Group Company
2001 2000 2001 2000R million R million R million R million
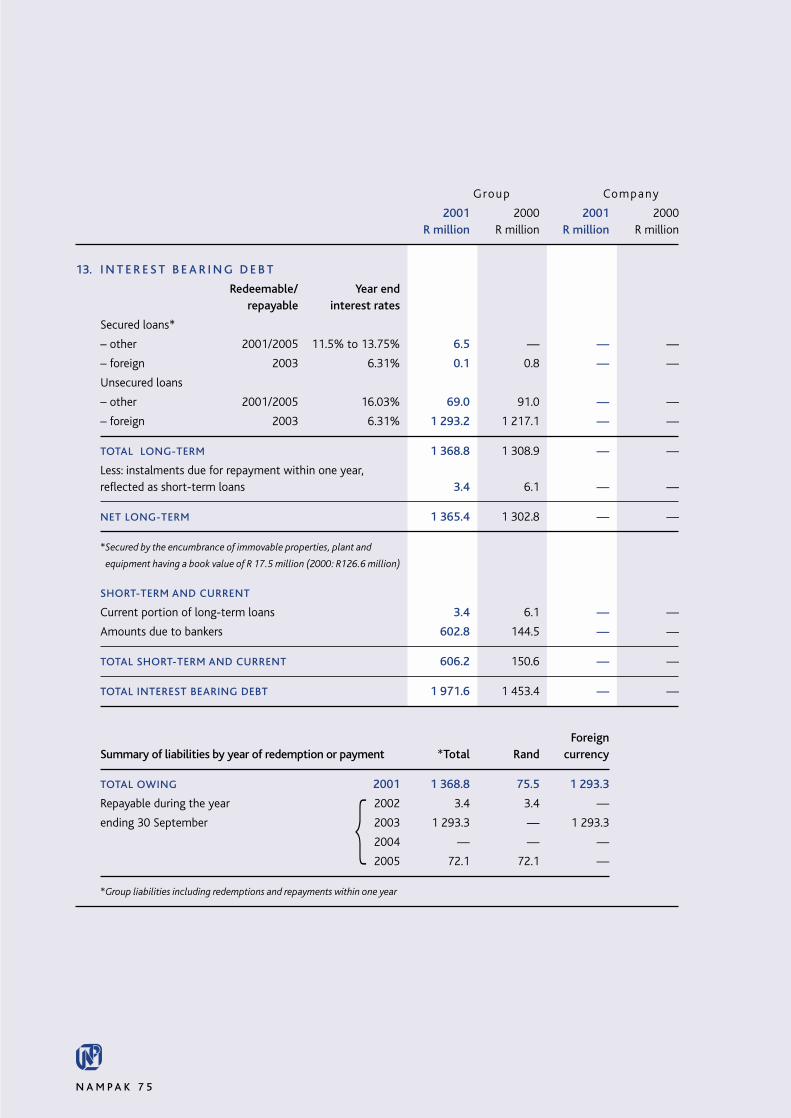
N A M P A K 7 5
13. I N T E R E S T B E A R I N G D E B T
Redeemable/ Year endrepayable interest rates
Secured loans*
– other 2001/2005 11.5% to 13.75% 6.5 — — —
– foreign 2003 6.31% 0.1 0.8 — —
Unsecured loans
– other 2001/2005 16.03% 69.0 91.0 — —
– foreign 2003 6.31% 1 293.2 1 217.1 — —
TOTAL LONG-TERM 1 368.8 1 308.9 — —
Less: instalments due for repayment within one year,reflected as short-term loans 3.4 6.1 — —
NET LONG-TERM 1 365.4 1 302.8 — —
*Secured by the encumbrance of immovable properties, plant and
equipment having a book value of R 17.5 million (2000: R126.6 million)
SHORT-TERM AND CURRENT
Current portion of long-term loans 3.4 6.1 — —
Amounts due to bankers 602.8 144.5 — —
TOTAL SHORT-TERM AND CURRENT 606.2 150.6 — —
TOTAL INTEREST BEARING DEBT 1 971.6 1 453.4 — —
Foreign Summary of liabilities by year of redemption or payment *Total Rand currency
TOTAL OWING 2001 1 368.8 75.5 1 293.3
Repayable during the year 2002 3.4 3.4 —
ending 30 September 2003 1 293.3 — 1 293.3
2004 — — —
2005 72.1 72.1 —
*Group liabilities including redemptions and repayments within one year
Group Company
2001 2000 2001 2000R million R million R million R million
{

N O T E S T O T H E F I N A N C I A L S T A T E M E N T S continued
for the year ended 30 September
N A M P A K 7 6
14. D E F E R R E D TA X
Accelerated wear and tear for taxation purposes on property, plant and equipment 408.8 439.6 — —
Other 51.4 (56.3) — —
Estimated losses (44.5) (4.2) — —
NET DEFERRED TAX LIABILITY 415.7 379.1 — —
Reconciliation between deferred tax opening and closing balance:
Net deferred tax liability at beginning of year 379.1 242.9 — —
Deconsolidation adjustment to opening balance — (0.6) — —
Taxation rate adjustment 0.3 — — —
Originating temporary differences on acquisition of businesses — 111.8 — —
Originating temporary differences on property, plant,equipment and other 36.3 25.0 — —
NET DEFERRED TAX LIABILITY AT END OF YEAR 415.7 379.1 — —
Analysed between:
Deferred tax assets (7.8) — — —
Deferred tax liabilities 423.5 379.1 — —
NET DEFERRED TAX LIABILITY AT END OF YEAR 415.7 379.1 — —
15. P R O V I S I O N S
CustomerRestructuring Rebates claims Total
R million R million R million R million
Opening balance — 15.8 3.7 19.5
Additions 22.9 10.7 3.6 37.2
Usage (1.5) (9.6) (0.6) (11.7)
Reversals — (1.4) (3.3) (4.7)
CLOSING BALANCE 21.4 15.5 3.4 40.3
All the above provisions are expected to be utilised in full during the next financial year.
Group Company
2001 2000 2001 2000R million R million R million R million

N A M P A K 7 7
16. R E V E N U E
(Inter-group transactions and VAT are excluded)
NET INVOICED SALES 10 474.3 9 632.8 — —
17. P R O F I T / ( L O S S ) B E F O R E A B N O R M A L I T E M S
is stated after taking account of the following items:
17.1 AUDITORS’ REMUNERATION
Audit fees 9.5 8.6 0.1 0.1
Expenses 0.4 0.2 — —
Other services 1.2 1.8 — —
TOTAL 11.1 10.6 0.1 0.1
17.2 DEPRECIATION AND AMORTISATION
Freehold, specialised and leasehold buildings (4.7) 5.3 — —
Plant, equipment and vehicles 448.2 384.8 — —
Intangible assets 13.4 (4.9) — —
TOTAL 456.9 385.2 — —
17.3 ADMINISTRATION AND TECHNICAL FEES 42.2 43.9 — —
17.4 RENTALS IN RESPECT OF OPERATING LEASES
– property 58.0 48.5 — —
– plant, equipment and vehicles 4.1 5.7 — —
TOTAL 62.1 54.2 — —
17.5 RESEARCH AND DEVELOPMENT COSTS EXPENSED
– Research and development expenditure 5.1 3.1 — —
– technology, royalty and associated costs 7.0 8.5 — —
TOTAL 12.1 11.6 — —
17.6 SURPLUS ON DISPOSAL OF PLANT
AND EQUIPMENT — 5.1 — —
Group Company
2001 2000 2001 2000R million R million R million R million

N O T E S T O T H E F I N A N C I A L S T A T E M E N T S continued
for the year ended 30 September
N A M P A K 7 8
17. P R O F I T / ( L O S S ) B E F O R E A B N O R M A L I T E M S(continued)
17.7 NET PROFIT ON FOREIGN EXCHANGE 10.9 20.7 — —
17.8 DIRECTORS’ EMOLUMENTS
Executive directors
For managerial services 16.2 14.5
Retirement fund contributions for managerial services 1.5 1.5
TOTAL (a) 17.7 16.0
Non-executive directors
For services as directors 0.5 0.4
For managerial services 2.4 1.0
TOTAL (b) 2.9 1.4
Paid by:
Subsidiary companies 20.6 17.4
TOTAL (a) + (b) 20.6 17.4
Gains made on the exercise of share options 1.4 3.6
17.9 DIRECTORS’ SERVICE CONTRACTS
The following executive directors and alternate directors have fixed term contracts for periods which vary, the unexpired terms of which exceed one year in each instance, but do not exceed three years effective 1 October 2001:
G E Bortolan, N Cumming, P A de Weerdt, T Evans,A S Lang, A M Marthinusen, A D S Morais andJ W C Sayers. The contract periods are necessary to retain the management skills and expertise of the persons concerned for the benefit of the company for periods commensurate with the expertise and age of the individual and the difficulty likely to be experienced in recruiting a replacement.
Group Company
2001 2000 2001 2000R million R million R million R million

N A M P A K 7 9
18. A B N O R M A L I T E M S
Retrenchment and restructuring costs 98.0 23.1 — —
Product claims 34.2 3.1 — —
Impairment losses 21.5 — — —
Net loss on disposal of business and property 0.8 4.6 — —
Loss on re-organisation of debt 3.7 2.3 — —
TOTAL 158.2 33.1 — —
19. N E T F I N A N C E ( C O S T S ) / I N C O M E
Gross interest paid (172.0) (134.4) — (1.2)
Deduct: interest received 101.0 84.5 0.1 5.1
NET FINANCE (COSTS)/INCOME (71.0) (49.9) 0.1 3.9
20. I N C O M E F R O M I N V E S T M E N T S
Dividends 2.5 8.5 90.8 143.2
Interest received (paid to)/from subsidiaries — — (9.5) 1.0
Fees — — 2.0 1.4
Interest received from other investments — 1.1 0.2 1.1
TOTAL 2.5 9.6 83.5 146.7
Sources:
– South African — 1.1 83.5 146.7
– Foreign 2.5 8.5 — —
21. TA X AT I O N
South African normal taxation
– Current year 163.6 145.9 0.1 8.9
– Prior year (27.4) (19.8) (0.1) —
Deferred tax
– Current year 11.2 28.3 — —
– Prior year 0.8 (5.7) — —
Secondary taxation on companies 19.4 40.8 (7.5) 16.0
Withholding and foreign taxation 3.8 25.5 — —
TOTAL 171.4 215.0 (7.5) 24.9
Group Company
2001 2000 2001 2000R million R million R million R million
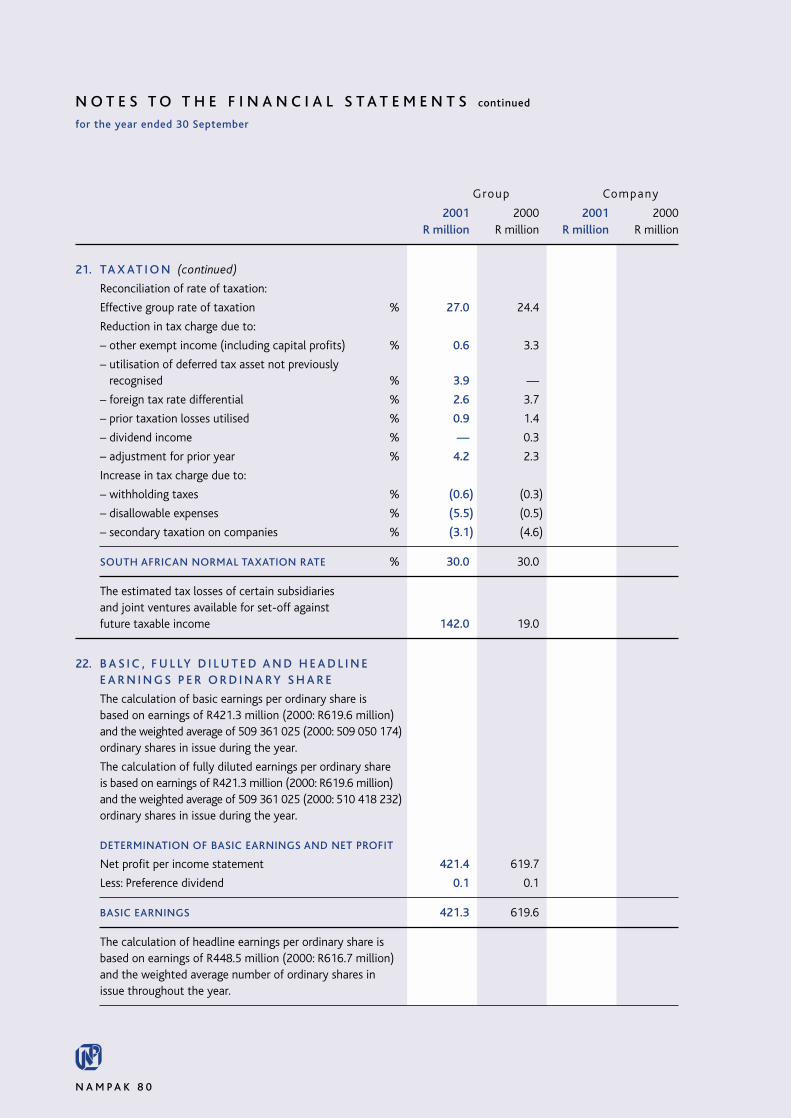
N O T E S T O T H E F I N A N C I A L S T A T E M E N T S continued
for the year ended 30 September
N A M P A K 8 0
21. TA X AT I O N (continued)
Reconciliation of rate of taxation:
Effective group rate of taxation % 27.0 24.4
Reduction in tax charge due to:
– other exempt income (including capital profits) % 0.6 3.3
– utilisation of deferred tax asset not previously recognised % 3.9 —
– foreign tax rate differential % 2.6 3.7
– prior taxation losses utilised % 0.9 1.4
– dividend income % — 0.3
– adjustment for prior year % 4.2 2.3
Increase in tax charge due to:
– withholding taxes % (0.6) (0.3)
– disallowable expenses % (5.5) (0.5)
– secondary taxation on companies % (3.1) (4.6)
SOUTH AFRICAN NORMAL TAXATION RATE % 30.0 30.0
The estimated tax losses of certain subsidiaries and joint ventures available for set-off against future taxable income 142.0 19.0
22. B A S I C , F U L LY D I L U T E D A N D H E A D L I N E E A R N I N G S P E R O R D I N A RY S H A R E
The calculation of basic earnings per ordinary share is based on earnings of R421.3 million (2000: R619.6 million) and the weighted average of 509 361 025 (2000: 509 050 174)ordinary shares in issue during the year.
The calculation of fully diluted earnings per ordinary share is based on earnings of R421.3 million (2000: R619.6 million) and the weighted average of 509 361 025 (2000: 510 418 232)ordinary shares in issue during the year.
DETERMINATION OF BASIC EARNINGS AND NET PROFIT
Net profit per income statement 421.4 619.7
Less: Preference dividend 0.1 0.1
BASIC EARNINGS 421.3 619.6
The calculation of headline earnings per ordinary share is based on earnings of R448.5 million (2000: R616.7 million) and the weighted average number of ordinary shares in issue throughout the year.
Group Company
2001 2000 2001 2000R million R million R million R million

N A M P A K 8 1
22. B A S I C , F U L LY D I L U T E D A N D H E A D L I N E E A R N I N G S P E R O R D I N A RY S H A R E (continued)
DETERMINATION OF HEADLINE EARNINGS
Net profit per income statement 421.4 619.7
After tax adjustment for:
Impairment losses 16.0 —
Goodwill written off (4.2) (4.9)
Provision for retrenchments 12.2 —
Loss on sale of operations 3.2 2.0
Profit on sale of property, plant and equipment (2.7) (2.4)
Loss on re-organisation of debt 2.6 2.3
HEADLINE EARNINGS 448.5 616.7
23. D I V I D E N D S P E R S H A R E
The final dividend declared for the current year of 35.5 centsper share has not been provided for in the annualfinancial statements in terms of AC 130 – Provisions,Contingent Liabilities and Contingent Assets.
24. O P E R AT I N G L E A S E C O M M I T M E N T S
The group has certain lease commitments in respect of land and buildings, plant, equipment and vehicles,which are payable as follows:
Year ending 30 September
2001 44.3 —
2002 66.1 44.9 — —
2003 56.1 39.9 — —
2004 47.7 37.9 — —
2005 43.4 55.5 — —
2006 and beyond 51.5 — — —
TOTAL 264.8 222.5 — —
Comprising:
Land and buildings 229.8 205.1 — —
Vehicles 12.8 5.5 — —
Other 22.2 11.9 — —
264.8 222.5 — —
Group Company
2001 2000 2001 2000R million R million R million R million
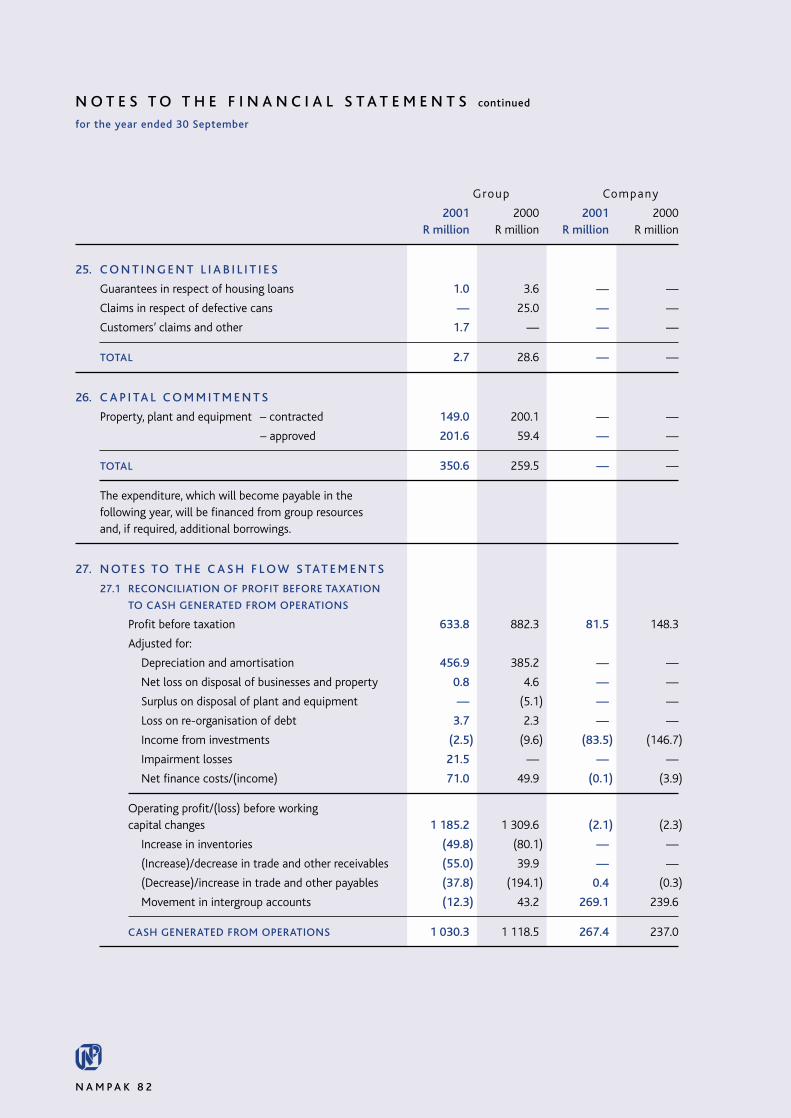
N O T E S T O T H E F I N A N C I A L S T A T E M E N T S continued
for the year ended 30 September
N A M P A K 8 2
25. C O N T I N G E N T L I A B I L I T I E S
Guarantees in respect of housing loans 1.0 3.6 — —
Claims in respect of defective cans — 25.0 — —
Customers’ claims and other 1.7 — — —
TOTAL 2.7 28.6 — —
26. C A P I TA L C O M M I T M E N T S
Property, plant and equipment – contracted 149.0 200.1 — —
– approved 201.6 59.4 — —
TOTAL 350.6 259.5 — —
The expenditure, which will become payable in the following year, will be financed from group resources and, if required, additional borrowings.
27. N O T E S TO T H E C A S H F L O W S TAT E M E N T S
27.1 RECONCILIATION OF PROFIT BEFORE TAXATION
TO CASH GENERATED FROM OPERATIONS
Profit before taxation 633.8 882.3 81.5 148.3
Adjusted for:
Depreciation and amortisation 456.9 385.2 — —
Net loss on disposal of businesses and property 0.8 4.6 — —
Surplus on disposal of plant and equipment — (5.1) — —
Loss on re-organisation of debt 3.7 2.3 — —
Income from investments (2.5) (9.6) (83.5) (146.7)
Impairment losses 21.5 — — —
Net finance costs/(income) 71.0 49.9 (0.1) (3.9)
Operating profit/(loss) before working capital changes 1 185.2 1 309.6 (2.1) (2.3)
Increase in inventories (49.8) (80.1) — —
(Increase)/decrease in trade and other receivables (55.0) 39.9 — —
(Decrease)/increase in trade and other payables (37.8) (194.1) 0.4 (0.3)
Movement in intergroup accounts (12.3) 43.2 269.1 239.6
CASH GENERATED FROM OPERATIONS 1 030.3 1 118.5 267.4 237.0
Group Company
2001 2000 2001 2000R million R million R million R million

N A M P A K 8 3
27. N O T E S TO T H E C A S H F L O W S TAT E M E N T S(continued)
27.2 ACQUISITION OF BUSINESSES
With effect 1 June 2001 50% of the issued sharecapital of Burcap Plastics (Pty) Ltd was acquired.With effect from 1 August 2001 the issued share capital of Velocit-e (Pty) Ltd was acquired in exchange for a 10% share in the issued share capital of NamITech Holdings (Pty) Ltd.,as well as cash. The fair value of assets acquiredand liabilities assumed at those dates are as follows:
Non-current assets 18.7 954.2 — —
Non-current liabilities (9.7) (540.6) — —
Net working capital 0.3 (87.6) — —
Outside shareholders’ interest (15.9) (0.4) — —
(6.6) 325.6 — —
Goodwill arising on acquisition 41.2 723.2 — —
Discount on acquisition of businesses — (17.1) — —
Total purchase consideration 34.6 1 031.7 — —
Overdraft/(cash) acquired 0.4 (96.3) — —
Less: long-term loan raised — (1 016.8) — —
Less: investments in subsidiaries now consolidated — (16.5)
35.0 (97.9) — —
27.3 CASH AND CASH EQUIVALENTS
Cash and cash equivalents included in the cash flow statement comprise the following balance sheet amounts:
Bank balances, cash and deposits 1 011.1 741.3 0.4 0.3
Interest bearing borrowings – amounts due to bankers (note 13) (602.8) (144.5) — —
408.3 596.8 0.4 0.3
Group Company
2001 2000 2001 2000R million R million R million R million

I N T E R E S T I N S U B S I D I A R I E S A N D J O I N T V E N T U R E S
A N N E X U R E A
N A M P A K 8 4
Effective Interest of holding companyType Issued percentage Shares at
(see note Country of share holding book value Indebtednessbelow) incorporation capital 2001 2000 2001 2000 2001 2000
% % Rm Rm Rm Rm
1. SUBSIDIARIES (CONSOLIDATED)Amalgamated Packaging Industries
(Pty) Ltd I RSA R2 834 224 100 100 — — — —AMK Plastics Ltd D UK £2 100 100 — — — —BDM Properties (Riverside Durban)
(Pty) Ltd P RSA R30 100 100 — — — —BlowMocan Polysystems Ltd D UK £4 530 000 100 100 — — — —BlowMocan Holdings Ltd I UK £101 100 100 — — — —Buduff Handling Ltd D Isle of Man £2 000 100 100 — — — —Buduff Incorporated Ltd I Isle of Man $182 682 100 100 — — — —CCSA Property (Pty) Ltd P RSA R1 000 100 100 — — — —Ciskei Buyers (Pty) Ltd D RSA R10 000 100 100 — — — —Consolidated Corrugated Containers
(Pty) Ltd O RSA R600 000 100 100 6.4 6.4 8.4 9.7Crown Nampak (Pty) Ltd O RSA R8 776 85 85 — — — —KDY Properties (Pty) Ltd P RSA R2 100 100 — — — —Megapak Tanzania Ltd D Tanzania SHS300 000 100 100 — — — —Metal Box Botswana (Pty) Ltd O Botswana P224 435 100 100 — — — —Metal Box Namibia (Pty) Ltd O Namibia N$1 100 100 — — — —Metal Box South Africa Ltd O RSA R68 153 240 100 100 367.2 367.2 134.8 213.3The Metal Press Co 1973 (Pty) Ltd D RSA R3 000 100 100 — — — —NamITcardz (Pty) Ltd O RSA R168 960 100 100 — — — —NamITdraftz (Pty) Ltd O RSA R250 000 100 100 — — — —NamITech (Isle of Man) Ltd D Isle of Man £1 100 — — — —NamITech (Pty) Ltd O RSA R777 778 100 100 — — — —NamITech Holdings (Pty) Ltd I RSA R500 000 90 100 — — — —NamIT-IDz (Pty) Ltd O RSA R100 100 — — — —NamITprepaidz (Pty) Ltd O RSA R1 000 82 100 — — — —NamITsmartz (Pty) Ltd O RSA R600 100 100 — — — —Nampak Belgium NV O Belgium 247 900 100 100 — — — —Nampak Confirming Ltd D Isle of Man £1 100 — — — —Nampak Continental Holdings BV I Netherlands 59 890 100 100 — — — —Nampak Corrugated PMB (Pty) Ltd O RSA R100 70 70 — — — —Nampak Deutschland GmbH O Germany DM50 000 100 100 — — — —Nampak France SA I France 7 257 936 100 100 — — — —Nampak Gent NV O Belgium 2 480 650 100 100 — — — —Nampak Halfweg BV O Netherlands 1 837 900 100 100 — — — —Nampak Holdings (UK) plc I UK £1 401 000 100 100 — — — —Nampak Holdings Ltd I Mauritius $1 000 100 100 — — — —Nampak International Ltd I Isle of Man £32 949 100 100 473.3 402.8 1.4 73.9Nampak Kerkrade BV O Netherlands 2 178 200 100 100 — — — —Nampak Leasing (Pty) Ltd F RSA R100 100 100 — — — —Nampak Montpont SA O France 3 136 740 100 100 — — — —Nampak Paper Ltd D RSA R2 307 533 100 100 7.5 7.5 — —Nampak plc O UK £4 863 281 100 100 — — — —Nampak Polycyclers (Pty) Ltd O RSA R20 000 100 100 — — — —Nampak Products Ltd O RSA R3 528 641 100 100 10.5 10.5 (407.8) (292.2)Nampak Properties (Isle of Man) Ltd P Isle of Man £100 100 100 — — — —Nampak Resources Ltd F Isle of Man £1 393 100 100 — — — —Nampak Technical Services Ltd O Isle of Man £1 100 100 — — — —Nampak Tissue (Pty) Ltd O RSA R100 100 100 — — — —-National Containers (Pty) Ltd I RSA R245 000 100 100 0.3 0.3 9.4 10.6Neopac Swaziland Ltd O Swaziland E250 000 90 90 — — — —Ombar Properties (Pty) Ltd P RSA R2 100 100 — — — —Packaging Industries (Malawi) Ltd O/L Malawi MK13 450 000 60 60 — — — —Pak Projects (Pty) Ltd D RSA R4 100 100 — — — —-Paklite Ltd D UK £100 100 100 — — — —Plysu Brands Ltd O UK £1 042 100 100 — — — —Plysu Containers Ltd D UK £600 100 100 — — — —Plysu Envases Alimentarios O Spain Pts720 000 96 96 — — — —Plysu Protection Systems Ltd O UK £7 000 100 100 — — — —Polyad (Pty) Ltd D RSA R200 100 100 — — — —Printpak Ltd O RSA R5 833 333 70 70 — — — —Simon Renfrew Containers Ltd D UK £3 187 100 100 — — — —Teknol BV I Netherlands NLG40 000 100 100 — — — —Teknol NV I Netherlands NLG15 000 100 100 — — — —Thermakeep Ltd D UK £50 000 100 100 — — — —Transmar (Isle of Man) Ltd I Isle of Man £364 232 100 100 — — — —Twinsaver (Pty) Ltd D Namibia N$1000 100 100 — — — —Velocit-e (Pty) Ltd D RSA R100 100 — — — —

N A M P A K 8 5
Effective Interest of holding companyType Issued percentage Shares at
(see note Country of share holding book value Indebtednessbelow) incorporation capital 2001 2000 2001 2000 2001 2000
% % Rm Rm Rm Rm
2. JOINT VENTURES(PROPORTIONATELY CONSOLIDATED)Burcap Plastics (Pty) Ltd O RSA R1 000 50 — — — —Collect-A-Can (Pty) Ltd O RSA R4 000 000 40 40 — — — —Elopak South Africa (Pty) Ltd O RSA R16 982 710 50 50 — — — —Integrated Card Technology (Pty) Ltd O RSA R100 25 25 — — — —Sancella South Africa (Pty) Ltd O RSA R5 000 50 50 — — — —
3. SUBSIDIARIES AND JOINT VENTURES(NOT CONSOLIDATED)Bullpak Ltd O Kenya S233 240 49 49 — — — —Cartonagens de Mocambique LDA O Mocambique MT20 million 55 55 — — — —Crown Cork Mocambique LDA O Mocambique MT2375 million 40 40 — — — —Embalagens de Mocambique SARL O Mocambique MT20 million 52 52 — — — —Hunyani Holdings Ltd O/L Zimbabwe Z$31 391 000 40 40 — — — —International Cartons and Packaging Ltd O Zambia K77 526 000 100 100 — — — —Megapak Zimbabwe (Pvt) Ltd O Zimbabwe Z$20 000 49 49 — — — —Nampak Polyfoil Zimbabwe (Pvt) Ltd O Zimbabwe Z$200 70 70 — — — —Nampak Zambia Ltd D Zambia K1 000 100 100 — — — —Nasaba Tissue Ltd O Tanzania SHS200 000 50 — — — —
TypeO – Operating F – Finance I – Investment holding P – Property owning D – Dormant L – Listed
A N N E X U R E A (continued)
I N V E S T M E N T S
Number of shares Effective Type held by group percentage holding
(see note below) 2001 2000 2001 2000
UNLISTED INVESTMENTS
National Sorghum Breweries Ltd O 250 000 250 000 <1 <1
Business Partners Ltd F 212 161 212 161 <1 <1
New Farmers Development Corporation Ltd O 150 000 150 000 <1 <1
Type
O – Operating F – Finance
A N N E X U R E B

S H A R E P E R F O R M A N C E
N A M P A K 8 6
J S E S E C U R I T I E S E XC H A N G ES O U T H A F R I C A 2001 2000 1999 1998 1997 1996
Market price per share
– Highest cents 1 340 2 075 1 745 2 300 2 030 2 300
– Lowest cents 980 1 180 650 630 1 625 1 600
– Year end cents 1 075 1 330 1390 800 1 740 1 970
Net asset value per share cents 550 501 587 548 486 428
Number of ordinary shares in issue 000 509 406 509 350 508 811 508 731 507 191 505 552
Market capitalisation* R million 5 476 6 774 7 072 4 070 8 825 9 959
Transactions recorded number 37 265 34 710 14 537 13 591 9 029 5 211
Volume of shares traded 000 330 127 242 459 150 858 83 627 52 302 30 147
Value of shares traded R million 3 773.0 3 577.7 1 905.3 1 225.1 963.6 580.1
Volume of shares traded as a percentage of total issued shares % 64.8 47.6 29.6 16.4 10.3 6.0
Earnings yield* % 7.7 9.2 8.5 14.1 6.2 5.3
Dividend yield* % 5.0 4.0 3.5 5.5 2.4 2.0
Price/earnings ratio* :1 13.0 10.9 11.7 7.1 16.1 18.9
*Based on year end market price
SHARE PRICE MOVEMENTS
High
Year end
Low
Indexed to JSE
0100999897960
500
1 000
1 500
2 000
2 500
cents

O R D I N A R Y S H A R E H O L D E R S ’ A N A L Y S I Sat 30 September 2001
N A M P A K 8 7
Number of % of Number of % of totalCategory shareholders shareholders shares held issued shares
H O L D I N G S
1 – 5 000 5 514 89.3 2 203 343 0.4
5 001 – 25 000 230 3.7 2 161 346 0.4
25 001 – 50 000 41 0.7 1 464 639 0.3
50 001 – upwards 389 6.3 503 576 772 98.9
6 174 100.0 509 406 100 100.0
Nominee companies 125 2.0 493 037 203 96.7
Private individuals 5 820 94.3 10 200 347 2.0
Pension funds 7 0.1 4 861 568 1.0
Companies 158 2.6 1 099 583 0.2
Other corporate bodies 64 1.0 207 399 0.1
6 174 100.0 509 406 100 100.0
South African 4 800 77.7 508 335 644 99.8
Foreign 1 374 22.3 1 070 456 0.2
6 174 100.0 509 406 100 100.0
M A J O R I N D I V I D U A L H O L D I N G S
According to the register of shareholders at 30 September 2001, the following registered shareholders held 5% or more of the issued share capital:
Nedcor Bank Nominees (Pty) Limited 153 329 841 30.1
CSD Dematerialised Control Account 87 183 400 17.1
Standard Bank Nominees (Tvl) (Pty) Limited 81 909 328 16.1
Old Mutual Nominees (Pty) Limited 60 567 685 11.9
ABSA Nominees (Pty) Limited 36 364 279 7.1
CMB Nominees (Pty) Limited 31 315 893 6.1
N O M I N E E D I S C L O S U R E S
Pursuant to the provisions of Section 140(A) 8(a) of the Companies Act of 1973,as amended, the following beneficial shareholdings exceeding 5% in aggregate at 30 September 2001 were disclosed by the above nominee companies or byother nominee companies:
Old Mutual group 86 292 419 16.9
RMB group 58 909 991 11.6
Public Investment Commissioner 47 708 757 9.4
Standard/Liberty group 31 771 536 6.2
Sanlam group 30 441 148 6.0
D I R E C T O R A T E A N D A D M I N I S T R A T I O N
N A M P A K 8 8
T EVANS (56)BSc, SEP (Stanford)
Chairman
Joined Metal Box in 1967.
Appointed to the board in 1990.
Appointed managing director in 1992 and deputychairman and chief executive officer in 2000.
Appointed Chairman in 2001.
G E BORTOLAN (53)SEP (Stanford)
Group managing director
Joined Peters Papers in 1980.
Appointed to the board in 1990.
Appointed managing director – South Africa and Africa in 2000.
Appointed group managing director in 2001.
N CUMMING (47)MSoc Sci, EDP (IMD Switzerland), HDPM, Reg. Industrial Psychologist
Executive director, responsible for Corrugated,Paper Merchants, Printpak, Redibox and the Africaoperations outside of South Africa.
Joined Metal Box in 1986.
Appointed alternate director in 1991 and a full directorin 1994.
P A de WEERDT (47)BSc, MBA, SEP (Stanford)
Alternate executive director, responsible for LiquidPackaging, Megapak and Petpak.
Joined Metal Box in 1980.
Appointed alternate director in 1998.
G V D DUFFEY (61)BA LLB (cum laude), MBL
Executive director, responsible for Insurance and Legaland Secretarial Affairs and NMS Services.
Joined Metal Box in 1977.
Appointed alternate director in 1994 and a full directorin 1998.
A S LANG (55) (British) CA, EDP (Columbia)
Executive director, responsible for Bevcan, Bevcap,Divpac, Foodcan and Glass.
Joined Metal Box in 1970.
Appointed to the board in 1990.
A M MARTHINUSEN (53)BComm, SEP (Stanford)
Executive director, responsible for Group marketing,exports and R&D.
Joined Nampak Sacks in 1983.
Appointed to the board in 1990.
A D S MORAIS (47)BComm, MBA, CA (SA), SEP (Stanford)
Alternate executive director, responsible for L&CP,Polyfoil, Rotoflex-Quix, Sacks and Tufbag.
Joined Nampak Corrugated in 1981.
Appointed alternate director in 1998.
J W C SAYERS (55)BA (Hons), FCA, CA (SA), MCT (SA), PMD (UCT)
Executive director, Finance, responsible for financialfunctions, Property and Treasury.
Joined Nampak in 1996.
Appointed to the board in 1996.
R G TOMLINSON (39)BComm, HDPM, SEP (Stanford)
Executive director, responsible for NamITech.
Rejoined Nampak in 1996.
Appointed alternate director in 1996 and a full directorin 1999.
E X E C U T I V E D I R E C TO R S

N A M P A K 8 9
P L CAMPBELL** (64)CA (SA), AMP (Harvard)
Chairman, Hudaco Industries Limited and PangbourneProperties Limited. Director of companies.
Appointed to the board in 1984.
B P CONNELLAN*‡ (61)CA (SA)
Director, Sasol Limited, ABSA Limited and otherlisted companies.
Appointed to the board in 1988.
D E COOPER† (61)CA (SA)
Chairman STANBIC. Director of companies.
Appointed to the board in 1986.
D A HAWTON† (64)FCIS
Executive chairman, Kersaf Investments Limited.Director of companies.
Appointed to the board in 1991.
M M KATZ*† (56)BComm LLB, LLM, LLD (h.c.)
Hon. Professor of Company Law, University of theWitwatersrand.
Chairman, Edward Nathan & Friedland (Pty) Limited.Director of companies.
Appointed to the board in 1985.
K M MOKOAPE (54)BSc, MM (Human Resources)
Chairman, Log-Tek Engineering Solutions (Pty) Limited.Director of companies.
Appointed to the board in 1998.
M L NDLOVU (50)Dip LR (UNISA), MAP (Wits), EDP (North Western USA),
AMP (Harvard)
Chief executive officer, Peoples Bank – a division ofNedcor Bank Limited. Director of companies.
Appointed to the board in 1993.
R A WILLIAMS* (60)BA LLB
Chairman, Tiger Brands Limited. Director of companies.
Appointed to the board in 1990.
**Chairman of the audit committee
*Member of the audit committee
‡Chairman of the remuneration committee
†Member of the remuneration committee
S E C R E TA RY
N P O’Brien BProc
A U D I TO R S
Deloitte & Touche
B U S I N E S S A D D R E S S A N DR E G I S T E R E D O F F I C E
Nampak Centre
114 Dennis Road, Atholl Gardens,
Sandton 2196, South Africa.
(PO Box 784324, Sandton 2146)
Telephone +27 11 719 6300
Telefax +27 11 444 4794
Website www.nampak.co.za
S H A R E T R A N S F E R S E C R E TA R I E S
Mercantile Registrars Limited
11 Diagonal Street, Johannesburg 2001,
South Africa.
(PO Box 1053, Johannesburg 2000)
Telephone +27 11 370 5000
N O N - E X E C U T I V E D I R E C TO R S

N O T I C E O F A N N U A L G E N E R A L M E E T I N G
N A M P A K 9 0
Notice is hereby given that the thirty-fourth annual general meeting of shareholders will be held at 114 Dennis Road,Atholl Gardens, Sandton, South Africa on Wednesday, 23 January 2002 at 12:30 for the following purposes:
1. To receive and consider the annual financial statements of the company and of the group for the year ended30 September 2001.
2. To elect directors in place of Messrs D E Cooper, T Evans, D A Hawton, J W C Sayers and R A Williams who retire byrotation but, being eligible, offer themselves for re-election.
3. To renew the general authority of the directors granted on 25 January 2001 to allot and issue the unissued ordinaryshares upon such terms and conditions as they deem fit in accordance with the provisions of Section 221 of theCompanies Act, 1973, as amended. No issue of these shares is however contemplated at the present time and noissue will be made which could effectively transfer control of the company without the prior approval ofshareholders in general meeting.
4. To fix the remuneration of the directors with effect from 1 October 2001, at R50 000 per director per annum payablein quarterly payments in arrear.
5. To consider and, if deemed fit, to pass with or without modification, the following resolution as an ordinaryresolution:
“RESOLVED THAT, subject to the approval of the JSE Securities Exchange South Africa hereto being obtained, thedirectors of the company be and they are hereby authorised to amend:
5.1 the Nampak 1979 Share Purchase Scheme adopted by resolution of shareholders passed on 27 September1979 (as amended) by the deletion in paragraph 3(a)i of the figure ‘1 325 000’ and the substitution therefor ofthe figure ‘2 000 000’.
5.2 the Nampak 1985 Share Option Scheme adopted by resolution of shareholders passed on 15 July 1985(as amended) by the deletion in paragraph 3.1 of the figure ‘1 325 000’ and the substitution therefor of thefigure ‘2 000 000’.”
S P E C I A L B U S I N E S S
6. To consider and, if deemed fit, to pass with or without modification, the following resolution as a special resolution:
“RESOLVED THAT, subject to compliance with the requirements of the JSE Securities Exchange South Africa (“JSE”),the directors of the company be and are hereby authorised in their discretion to procure that the company orsubsidiaries of the company acquire by purchase on the JSE ordinary shares issued by the company provided that:
(i) the number of ordinary shares acquired in any one financial year shall not exceed 10% of the ordinary shares inissue at the date on which this resolution is passed;
(ii) this authority shall lapse on the earlier of the date of the next annual general meeting of the company or thedate 15 months after the date on which this resolution is passed;
(iii) the price paid per ordinary share may not be greater than 10% above the weighted average of the market value ofthe ordinary shares for the five business days immediately preceding the date on which a purchase is made;
(iv) the number of shares purchased by subsidiaries of the company shall not exceed 10% in the aggregate of thenumber of issued shares in the company at the relevant times.”
The reason for this special resolution is to authorise the directors, if they deem it appropriate in the interests of thecompany, to procure that the company or subsidiaries of the company acquire or purchase ordinary shares issuedby the company subject to the restrictions contained in the above resolution.
The effect of this special resolution will be to authorise the directors of the company to procure that the companyor subsidiaries of the company acquire or purchase shares issued by the company on the JSE. Such purchases:
(i) may not in any financial year exceed 10% of the company’s ordinary shares in issue at the date of passing theabove resolution;
N A M PA K L I M I T E D

N A M P A K 9 1
(ii) may not be made at prices in excess of 10% above the weighted average of the market value of the ordinaryshares for the five days preceding the date of purchase;
(iii) must comply with the requirements of the JSE;
(iv) if made by a subsidiary or subsidiaries may not exceed 10% in the aggregate of the issued shares in thecompany.
The general authority granted by this resolution will lapse on the earlier of the date of the next annual generalmeeting of the company or the date 15 months after the date of this resolution.
At the present time the directors have no specific intention with regard to the utilisation of this authority which willonly be used if the circumstances are appropriate. If the authority is exercised the ordinary shares will be purchasedon the JSE.
The directors, after considering the effect of a repurchase of up to 10% of the company’s issued ordinary shares, areof the opinion that if such repurchase is implemented:
(i) the company and its subsidiaries will be able to pay their debts in the ordinary course of business for a periodof 12 months after the date of this notice;
(ii) recognised and measured in accordance with the accounting policies used in the latest audited annual groupfinancial statements, the assets of the company and its subsidiaries will exceed the liabilities of the companyand its subsidiaries for a period of 12 months after the date of this notice;
(iii) the ordinary capital and reserves of the company and its subsidiaries will be adequate for the purposes of thebusiness of the company and its subsidiaries for a period of 12 months after the date of this notice;
(iv) the working capital of the company and its subsidiaries will be adequate for the purposes of the business of thecompany and its subsidiaries for a period of 12 months after the date of this notice.
7. To consider and, if deemed fit, to pass with or without modification, the following resolution as a special resolution:
“RESOLVED THAT the company adopt the new articles of association tabled at the 34th annual general meeting ofthe company and initialled by the Chairman of the meeting for purposes of identification in substitution for thepresent articles of association.”
The reason for this special resolution is to bring the articles of association of the company into line with modernpractice, recent amendments to the Companies Act and recent amendments to the listings requirements of the JSE Securities Exchange South Africa.
The effect of this special resolution will be the adoption of new articles of association in substitution for the presentarticles of association.
The proposed new articles of association are available for inspection at the registered office of the company.
A member qualified to attend and vote at the meeting is entitled to appoint a proxy or proxies to attend, speak andvote in his/her stead.
A proxy need not be a member of the company.
Proxy forms must reach the company’s share transfer secretaries not later than 24 hours prior to the meeting.
By order of the board
N P O’Brien Nampak LimitedC O M PA N Y S E C R E TA RY 114 Dennis Road
Atholl Gardens, Sandton 21967 December 2001 South Africa

S H A R E H O L D E R S ’ D I A R Y
N A M P A K 9 2
Annual general meeting 23 January 2002
Interim statement and dividend announcementfor the half year ending 31 March 2002 May 2002
Group results and ordinary dividend announcementfor the year ending 30 September 2002 November 2002
D I V I D E N D S
ORDINARY
Final for the year ended 30 September 2001 To be paid on 8 January 2002
Interim for the half year ending 31 March 2002 To be paid July 2002
PREFERENCE
6.5% and 6% Cumulative Payable twice per annum during February and August

DESIGNED AND PRODUCED BY BASTION GRAPHICS
PHOTOGRAPHY BY MIKE DUFF AND CLIVE GLOVER
PAPER SUPPLIED BY PETERS PAPERS
PRINTED BY ULTRA LITHO