
Qualitative stability assessment of cut slopes along the ...
15
J. Earth Syst. Sci. (2017) 126:112 c Indian Academy of Sciences https://doi.org/10.1007/s12040-017-0893-0 Qualitative stability assessment of cut slopes along the National Highway-05 around Jhakri area, Himachal Pradesh, India Jagadish Kundu 1 , Kripamoy Sarkar 1 , Ashutosh Tripathy 2, * and T N Singh 2 1 Department of Applied Geology, Indian Institute of Technology (Indian School of Mines), Dhanbad 826 004, India. 2 Department of Earth Sciences, Indian Institute of Technology Bombay, Mumbai 400 076, India. *Corresponding author. e-mail: [email protected] MS received 26 July 2016; revised 12 April 2017; accepted 5 June 2017; published online 23 November 2017 Several deformation phases in tectonically active Himalayas have rendered the rock masses very complex in terms of structure, lithology and degree of metamorphism. Again, anthropogenic activities such as roads, tunnels and other civil engineering constructions have led to a state of disequilibrium which in many cases, results in failure of rock masses. National Highway-05 around Jhakri area in India is a major connecting route to the China border in the hilly terrains of the state Himachal Pradesh. It cuts through the Himalayan rocks and has a hazardous history of landslides destroying human lives and interrupting communication very frequently. As a contribution towards the mitigation process, a study has been carried out along the highway to analyse kinematic stability and qualitative estimation of rock mass condition through rock mass classification systems. The kinematic analysis shows that the rock slopes are prone to planar and wedge failure. Rock mass rating for most of the locations lies between 7 and 34, representing a poor rock mass quality (Class IV), whereas slope mass rating is more disperse and ranges from 11 to 52 for most of the slopes (Class III, IV and V). Keywords. Cut slope; kinematic analysis; continuous slope mass rating; geological strength index. 1. Introduction Himachal Pradesh, primarily is a mountainous area with variable climate and uneven rugged topography. It covers parts of Shiwaliks, lesser Himalayas and higher Himalayas with an altitude ranging from 350 to 6975 m above mean sea level (Srikantia and Bhargava 1998). The mountains in the state are dissected by deep gorges and valleys. Tectonically and morphologically active young and dynamic Himalayas in this region are intersected by many dormant and active thrusts namely Himalayan Frontal Thrust (HFT), the Main Boundary Thrust (MBT), Main Central Thrust (MCT), the Krol, the Giri, Jutogh and Nahan thrusts. These longitudinal tectonic frac- tures trend parallel to the Himalayas. Dislocations along these thrusts give rise to earthquake epicen- tres in the state. The state is assigned under zone IV and V of earthquake hazard zonation described in India hazard zonation map (Narula et al. 2000). According to National Institute of Disaster Man- agement (NIDM), Govt. of India report, about 250 earthquakes with magnitude 4 and 62 earthquakes having magnitude of 5 and above have impac- ted the state so far. In addition to earthquakes, 1 0123456789().,--: vol V
Transcript of Qualitative stability assessment of cut slopes along the ...

J. Earth Syst. Sci. (2017) 126:112 c© Indian Academy of Scienceshttps://doi.org/10.1007/s12040-017-0893-0
Qualitative stability assessment of cut slopes alongthe National Highway-05 around Jhakri area,Himachal Pradesh, India
Jagadish Kundu1, Kripamoy Sarkar
1, Ashutosh Tripathy
2,* and T N Singh
2
1Department of Applied Geology, Indian Institute of Technology (Indian School of Mines), Dhanbad826 004, India.2Department of Earth Sciences, Indian Institute of Technology Bombay, Mumbai 400 076, India.*Corresponding author. e-mail: [email protected]
MS received 26 July 2016; revised 12 April 2017; accepted 5 June 2017; published online 23 November 2017
Several deformation phases in tectonically active Himalayas have rendered the rock masses very complexin terms of structure, lithology and degree of metamorphism. Again, anthropogenic activities such asroads, tunnels and other civil engineering constructions have led to a state of disequilibrium which inmany cases, results in failure of rock masses. National Highway-05 around Jhakri area in India is a majorconnecting route to the China border in the hilly terrains of the state Himachal Pradesh. It cuts throughthe Himalayan rocks and has a hazardous history of landslides destroying human lives and interruptingcommunication very frequently. As a contribution towards the mitigation process, a study has beencarried out along the highway to analyse kinematic stability and qualitative estimation of rock masscondition through rock mass classification systems. The kinematic analysis shows that the rock slopesare prone to planar and wedge failure. Rock mass rating for most of the locations lies between 7 and 34,representing a poor rock mass quality (Class IV), whereas slope mass rating is more disperse and rangesfrom 11 to 52 for most of the slopes (Class III, IV and V).
Keywords. Cut slope; kinematic analysis; continuous slope mass rating; geological strength index.
1. Introduction
Himachal Pradesh, primarily is a mountainousarea with variable climate and uneven ruggedtopography. It covers parts of Shiwaliks, lesserHimalayas and higher Himalayas with an altituderanging from 350 to 6975 m above mean sea level(Srikantia and Bhargava 1998). The mountainsin the state are dissected by deep gorges andvalleys. Tectonically and morphologically activeyoung and dynamic Himalayas in this region areintersected by many dormant and active thrustsnamely Himalayan Frontal Thrust (HFT), the
Main Boundary Thrust (MBT), Main CentralThrust (MCT), the Krol, the Giri, Jutogh andNahan thrusts. These longitudinal tectonic frac-tures trend parallel to the Himalayas. Dislocationsalong these thrusts give rise to earthquake epicen-tres in the state. The state is assigned under zoneIV and V of earthquake hazard zonation describedin India hazard zonation map (Narula et al. 2000).According to National Institute of Disaster Man-agement (NIDM), Govt. of India report, about 250earthquakes with magnitude 4 and 62 earthquakeshaving magnitude of 5 and above have impac-ted the state so far. In addition to earthquakes,
1
0123456789().,--: vol V

112 Page 2 of 15 J. Earth Syst. Sci. (2017) 126:112
monsoonal rain causes flood each year in the statewhich makes the region very prone to landslides.Again, frequent flash floods, cloud bursts andglacial retreat due to global warming weaken therock mass, making it more vulnerable to failure.Landslide is the most common hazard in the state.Every year one or more major landslides affect thestate causing loss of life, property and severe inter-ruption in communication. In addition to rock massstrength and unfavourable orientation of joints andfractures, the intensity and effect of landslide in thearea varies with various geophysical factors such assteepness and height of slopes, water ingress in rockjoints and fractures, saturation of rock material dueto heavy rains, melting snow and ice, seismic vibra-tions, frost action, change in vegetable cover andtoe cutting by rivers and streams. Again, anthro-pogenic factors as a result of developmental activ-ities such as poorly designed roads, deforestation,unplanned agricultural practice, and encroachmenton steep slopes, further aggravate the process. Thelandslide vulnerability map of Himachal Pradeshis given in figure 1. Many hazardous landslides thathave occurred in the past, along the National High-way (NH)-05 in the state have been recorded andthe details are shown in table 1.
Apart from above history, another major land-slide had occurred in 1993 along NH-05 due to flashflood which damaged 1 km of road in Jhakri region.The failed mass of the road cut had blocked theSutlej River. Communication in the highway couldbe restored only after two months of the event(NIDM, Himachal Pradesh; http://nidm.gov.in/pdf/dp/himachal.pdf). Also, the road experiencesmajor/minor landslides every year mostly aftermonsoonal rainfall. District disaster managementauthority of Shimla has reported the Rampur–Jeorisector, a stretch of 25 km in NH-05 as landslidevulnerable area.
Keeping an eye on the problems mentionedabove, a study was carried out along NH-05 cov-ering a stretch of 12 km from Jhakri to Jeori inShimla district, Himachal Pradesh, India. Studiedlocations are illustrated in Google Earth image (fig-ure 2). The highway is located on the left bankof river Sutlej which makes the situation worseand threatens the stability of the road. Kinematicanalysis and rock mass characterisation have beenperformed to evaluate the rock mass condition.Similar works have been performed recently byUmrao et al. (2015) and Singh et al. (2015). Sarkaret al. (2016) have also assessed the quality of somecut slopes along the same highway.
2. Geology and geotechnical details
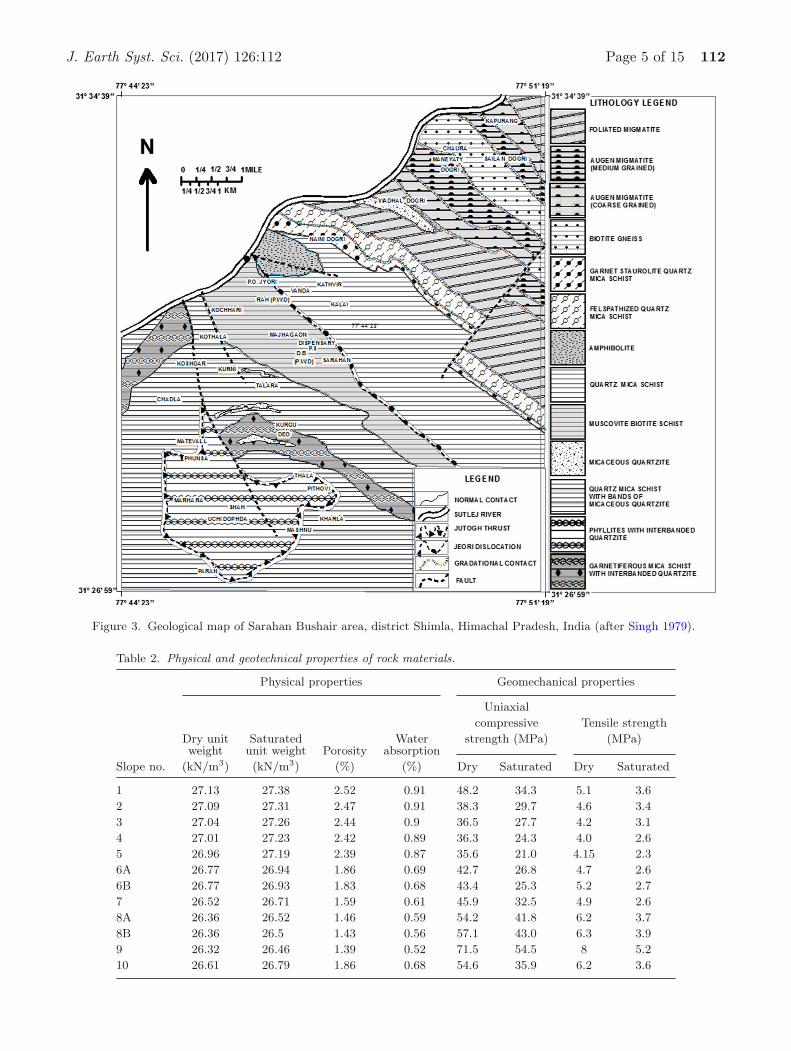
The Himalayas being a classic example of conti-nent–continent collision, comprises of two distincttectogens separated by the Main Central Thrust(MCT). These are the lesser Himalayan tecto-gen and Tethys Himalaya tectogen who bear theirown distinct geological history. The studied areafrom Jhakri to Jeori, a 15 km stretch in NH-05 is present in lesser Himalayan tectogen. Thearea lies in the Larji–Rampur–Wangtu windowzone of Larji tectono-stratigraphic domain (Srikan-tia and Bhargava 1998). Rocks in this area dateback to Paleoproterozoic and Mesoproterozoic andindicate medium to high grade inverted metamor-phism (Singh 1979). The rock types in the areaare augen migmatite, biotite gneiss, quartz micaschist, garnet bearing quartz mica schist, muscovitebiotite schist, and amphibolite, which are trun-cated by faults and other discontinuities (Singh1979; Kundu et al. 2016a, b). Regional strike oflithological units is ENE–WSW which shows localvariations in the trend (Singh 1979). The geologi-cal map of Sarahan Bushair (the investigated area)is given in figure 3.
A total of 12 locations were selected for the pro-posed study which covers four major rock typesnamely, foliated mica schist, strongly foliated micaschist, biotite gneiss, and crenulated mica schist.Rock masses in the area are foliated and blocky innature, intruded by small quartz veins and com-monly intersected by three sets of joints. Jointplanes are filled by soft infillings in most rockmasses and also remains unfilled in some places.Physical and geomechanical properties in both dryand saturated conditions for the rock materialswere determined according to ISRM (1981) spec-ifications. Details of these properties are given intable 2.
3. Stability evaluation (qualitative)
3.1 Kinematic analysis
It is an easy practice to use stereographic analysisfor the determination of potential failure typesand direction in jointed rock mass (Goodman1976; Hoek and Bray 1981; Matherson 1988). Theanalysis always indicates geometrically admissiblefailures which takes slope and joint orientationsinto consideration. However, friction cone (jointfriction angle) has been included in the analysis to

J. Earth Syst. Sci. (2017) 126:112 Page 3 of 15 112
Figure 1. Landslide hazard zonation map of Himachal Pradesh, India (modified from landslide hazard map of SEEDS’ 2009Himachal Pradesh vulnerability atlas).
Table 1. Major landslide history along NH-05 (source: NIDM, Himachal Pradesh; http:// nidm.gov.in/ pdf/ dp/ himachal.pdf ).
Location/highway Years Damage
NH-05 1988–1995 During the flood of 1988, 1993 and 1995, 250, 350 and 475 m of road was
washed away
NH-05, 292–293 km 1988–1995 During the flood of 1988, 1993 and 1995, 200, 500 and 300 m of road was
washed away
NH-05, 307 km 1988–1995 During the flood of 1988, 1993 and 1995, 100, 150 and 600 m of road was
washed away
satisfy both kinematic and frictional conditions forthe failure. Kundu et al. (2016a, b) have modifiedthe technique of kinematic analysis of wedge in acurved slope and analysed a curved slope, wherethey devised a way to represent varying degreeof vulnerability of wedges along a curved slope.A stereonet analysis program DIPS 6.0 (2015) ofRocscience has been used for the analysis in orderto find out modes of failure. Eleven slopes havebeen analysed for which the input parameters arepresented in table 3. It has to be noted that theterm ‘bedding plane’ has been used in this paperunder the assumption that joint set having major
continuity would represent the same and should notbe confused with sedimentary structure. As thereare no systematic joints other than some irregularfractures in slope no. 10, it has not been consideredfor the analysis.
Kinematic analysis for the locations shows thatthe slopes are highly vulnerable to wedge andplanar failure except for slope no. 5 which is kine-matically stable. Slope 1 shows potential for wedgefailure towards 270◦ but with small block sizes(figure 4).
Slope 2 (figure 5) consists of similar joints asof slope 1 and hence represents wedge towards

112 Page 4 of 15 J. Earth Syst. Sci. (2017) 126:112
Figure 2. Studied locations plotted in Google Earth image. The yellow line denotes NH-05 and the light blue line representsSutlej River.
271◦ but with less vulnerability, as the intersectionline is not inside the friction cone. Additionally,the slope face orientation, unlike slope 1 facilitatesplanar failure.
Slope 3 is exposed to wedge failure and trend ofthe intersection line is towards 301◦. As its direc-tion is adjacent to dip direction of the slope, thewedges are more open to failure. Furthermore, theblock sizes in this zone measure up to 1.8 m3,making it more hazardous in terms of rock fall(figure 6).
Kinematic analysis has been performed for slope4, which represents wedge towards 301◦ but failureis not probable due to low plunge angle of the inter-section line (intersection point falls outside of fail-ure zones). However, irregular fracture dominatesthe zone causing failure of rock mass (figure 7).
Slope 5, being more stable in the region, containsonly one tight joint set and no possible failure isexpected (figure 8). Besides, the location containsvery less and insignificant irregular fractures whichmakes a fair rock mass.
Slope 6A (figure 9) and 6B (figure 10) are weakrock masses intersected by closely spaced joints.Kinematically, the rock masses are exceedinglyprone to planar failure. Though analysis for Slope6A shows a wedge failure with intersection linetrend 343◦, the wedges slip along one plane mak-ing single plane wedge failure. Figure 11 representsboth planar and wedge failure for slope 7. Threejoint sets form wedges with two failure directionsalong 293◦ and 357◦. The wedge with intersec-tion line 357◦, fails along the joint plane dippingtowards 312◦.
Slope 8A comprises rock masses with kinemati-cally unsafe wedges and planes. Intersection linesof probable wedge failures are towards 288◦ and327◦. The wedge with intersection line towards 327◦
slips along the joint plane dipping towards 216◦
(figure 12).Slope 8B consists of rock mass cliffs with three
joint sets, out of which one joint set is responsiblefor failure. Kinematic analysis shows planar failuretowards 270◦ (figure 13).
J. Earth Syst. Sci. (2017) 126:112 Page 5 of 15 112
Figure 3. Geological map of Sarahan Bushair area, district Shimla, Himachal Pradesh, India (after Singh 1979).
Table 2. Physical and geotechnical properties of rock materials.
Physical properties Geomechanical properties
Uniaxial
compressive Tensile strength
Dry unit Saturated Water strength (MPa) (MPa)weight unit weight Porosity absorption
Slope no. (kN/m3) (kN/m3) (%) (%) Dry Saturated Dry Saturated
1 27.13 27.38 2.52 0.91 48.2 34.3 5.1 3.6
2 27.09 27.31 2.47 0.91 38.3 29.7 4.6 3.4
3 27.04 27.26 2.44 0.9 36.5 27.7 4.2 3.1
4 27.01 27.23 2.42 0.89 36.3 24.3 4.0 2.6
5 26.96 27.19 2.39 0.87 35.6 21.0 4.15 2.3
6A 26.77 26.94 1.86 0.69 42.7 26.8 4.7 2.6
6B 26.77 26.93 1.83 0.68 43.4 25.3 5.2 2.7
7 26.52 26.71 1.59 0.61 45.9 32.5 4.9 2.6
8A 26.36 26.52 1.46 0.59 54.2 41.8 6.2 3.7
8B 26.36 26.5 1.43 0.56 57.1 43.0 6.3 3.9
9 26.32 26.46 1.39 0.52 71.5 54.5 8 5.2
10 26.61 26.79 1.86 0.68 54.6 35.9 6.2 3.6

112 Page 6 of 15 J. Earth Syst. Sci. (2017) 126:112
Table
3.
Join
tand
slope
ori
enta
tions
for
diff
eren
tcu
tslope
s.
Slo
pe
no.
Bed
din
gpla
ne
(S0)
Join
tpla
ne
(J1)
Join
tpla
ne
(J2)
Join
tpla
ne
(J3)
Slo
pe
Dip
Dip
dir
ecti
on
Dip
Dip
dir
ecti
on
Dip
Dip
dir
ecti
on
Dip
Dip
dir
ecti
on
Slo
pe
angle
Slo
pe
dir
ecti
on
149
326
63
200
––
––
85
290
245
345
54
194
––
––
88
330
351
357
78
220
––
––
80
280
438
471
219
––
––
90
330
543
5–
––
––
–90
300
6A
47
360
46
337
––
––
84
347
6B
43
2–
––
––
–90
15
733
356
82
17
43
312
––
85
295
8A
50
316
84
12
64
23
––
86
300
8B
17
302
64
274
44
85
––
82
270
9–
–62
293
61
76
70
21
75
60
J1
=jo
int
no.1,J2
=jo
int
no.2,J3
=jo
int
no.3.
Slope 9 consists of rock mass intersected by threejoint sets. The rock blocks are frequently falling dueto unstable wedges. The rock mass forms wedgeswith two potential failure directions towards 4◦ and70◦. Wedge with intersection line trend 70◦ under-goes single plane wedge failure along the joint planedipping towards 75◦ (figure 14).
3.2 Rock mass characterisation
For better communication in rock engineeringcommunity, many classification systems have beendeveloped to quantify overall quality of rock massfor different purposes such as tunnelling, mining,foundation and rock slope. Some of the univer-sally accepted and well-established classificationsystems are Slope Mass Rating (SMR) (Romana1985; Tomas et al. 2007) for slope mass charac-terization, Rock Mass Rating (RMR) (Bieniawski1973, 1976, 1979, 1989) for tunnelling, mining,foundation and slope applications, Rock MassQuality (Q) (Barton et al. 1974) for tunnelling,Mining Rock Mass Rating (MRMR) (Laubscher1990), Rock Mass Strength (RMS) (Selby 1980)and Geological Strength Index (GSI) (Hoek et al.1998; Marinos and Hoek 2000) which is based onvisual examination including weak and shearedrock masses. Though RMR was originally devel-oped for tunnelling in moderate to hard rock mass,it was latter modified and adjusted over the years(Weaver 1975; Laubscher 1977, 1984; Romana1985; Newman and Bieniawski 1986; Venkateswarlu1986) for the application in mines, foundations, andslopes. Slopes in jointed rock masses are mainlycontrolled by joint orientations but there is noexplicit consideration of the factor in RMR whichrender the rating system less applicable for slopes(Mahanta et al. 2016). Romana (1985) proposedquantitative definitions for correction factors basedon joint orientations and their relationships whichlead to SMR system.
This paper covers classification of rock massesalong the road cut slopes using conventional RockMass Rating (RMR) system proposed byBieniawski (1979, 1989) and modified slope massrating using continuous functions for correctionfactors (Tomas et al. 2007) which was originallydeveloped by Romana (1985). Kinematic analysishas been carried out prior to RMR and SMR for theinvestigated slopes to anticipate potential modesof failure. Then SMR correction factors have beencalculated for the identified failure type. Geolog-ical strength index also has been calculated for

J. Earth Syst. Sci. (2017) 126:112 Page 7 of 15 112
Figure 4. Kinematic analysis for slope no. 1.
Figure 5. Kinematic analysis for slope no. 2.
Figure 6. Kinematic analysis for slope no. 3.

112 Page 8 of 15 J. Earth Syst. Sci. (2017) 126:112
Figure 7. Kinematic analysis for slope no. 4.
Figure 8. Kinematic analysis for slope no. 5.
Figure 9. Kinematic analysis for slope no. 6A.

J. Earth Syst. Sci. (2017) 126:112 Page 9 of 15 112
Figure 10. Kinematic analysis for slope no. 6B.
Figure 11. Kinematic analysis for slope no. 7.
Figure 12. Kinematic analysis for slope no. 8A.
the slopes using quantified method (Sonmez andUlusay 1999, 2002). Finally, a correlation betweenbasic RMR and GSI is given for the studied area.Twelve slopes were studied out of which RMR,SMR and GSI have been determined directly for 11
slopes. For the slope no. 10, as it does not containjoints except some irregularly oriented fractures,only GSI could be determined from visual obser-vation. Basic RMR has been estimated from thestated correlation (equation 9).

112 Page 10 of 15 J. Earth Syst. Sci. (2017) 126:112
Figure 13. Kinematic analysis for slope no. 8B.
Figure 14. Kinematic analysis for slope no. 9.
3.2.1 Basic RMR
The RMR system, which is otherwise known asgeomechanics classification, uses six parametersto classify a rock mass which are: (a) uniaxialcompressive strength (UCS) of rock material, (b)rock quality designation (RQD), (c) spacing ofdiscontinuities, (d) condition of discontinuities,(e) ground water conditions and (f) orientationof discontinuities. Out of these parameters, quan-tification for discontinuity orientation is not welldefined in the system. Excluding the last one,first five parameters constitute basic RMR whichis unadjusted for discontinuity orientations. Thefourth parameter, i.e., condition of discontinuitiesagain depends on five subparameters and those are(i) discontinuity persistence, (ii) aperture, (iii) sur-face roughness, (iv) infilling and (v) weathering.
Slopes were divided into zones based on unifor-mity in lithology, slope orientation, joint numbers
and spacing and each zone was consideredseparately for the classification. All the requiredparameters for basic RMR were obtained fromfield except UCS, which was determined in thelaboratory. Individual ratings were given for eachparameter and finally added together to find thefinal rating for the slope mass. The ratings forthe parameters are assigned according to Bieni-awski (1989). RQD was introduced on the basis ofcore recovery (Deere 1963), however, as cores areunavailable for the slopes, the relationship given byPalmstrom (1985) has been used to obtain RQDfrom volumetric joint count (Jv) (Zhang 2016). Jv
is the total number of joints encountered in a cubicmetre volume of rock mass. The relationship isgiven by
RQD = 115 − 3.3Jv. (1)
Basic RMR (RMRbasic) for each slope has been cal-culated to determine RMR and SMR and is given

J. Earth Syst. Sci. (2017) 126:112 Page 11 of 15 112
in table 4. Slope 5 has the highest value of 63and slope 6A being the lowest, has got a value40.5. The RMR for the cut slopes has been deter-mined by adding the adjustment factors for jointorientation given by Bieniawski (1989). There aresome slopes (slopes 6A and 6B) which show neg-ative RMR. This negative value can be attributedto high adjustment factor for joint orientation andshould be considered in the very poor quality cat-egory, representing the rock mass in Class V ofBieniawski (1989) interpretation. According to hisinterpretation, all other slopes belong to Class IIIand IV, representing poor to fair rock mass quality.
3.2.2 Continuous SMR
Romana (1985) proposed SMR system by addingfour correction factors to the basic RMR. Out offour, three correction factors depend on the rela-tionship between discontinuities and the fourth onedepends upon slope excavation method. InitiallySMR was proposed for planar and topple failureand the ratings for wedge failure was added to thesystem by Anbalagan et al. (1992). The expres-sion for continuous SMR is same as SMR and isas follows (Singh and Goel 1999)
SMR = RMRbasic + F1 × F2 × F3 + F4 (2)
where F1 depends on difference between dip direc-tion of joint (αj) and slope (αs). In case of wedgefailure, it depends on difference between αs andtrend of line of intersection αi.
F2 depends on dip of joint (βj) in case of planarfailure and plunge of line of intersection (βi) in caseof wedge failure. For toppling failure, F2 remains 1everywhere.
F3 depends on difference between βj and dip ofslope (βs) for planar failure and difference betweenβi and βs for wedge failure. For topple failure, itdepends on βj + βs.
F4 is the adjustment for method of excavation.The ratings suggested by Romana (1985) for F1,
F2, F3, and F4 are discrete and relies more onjudgement of the investigator. So it needs an expe-rienced person to allocate rating for the factors.Tomas et al. (2007) suggested continuous functionsfor F1, F2 and F3 which best fits the discretevalues.
He has given the following equations for thecontinuous functions:
F1 =1625
− 3500
tan−1
(110
(|A| − 17))
, (3)
Table
4.
Roc
km
ass
rating
tabl
eofall
the
para
met
ers
for
diff
eren
tslope
s.
Slo
pe
no.
UC
S
(A)
RQ
D
(B)
Join
t
id
Join
tsp
aci
ng
(C)
Join
tco
ndit
ion
(D)
Gro
und
wate
r
rati
ng
(E)
RM
Rbasic
(A+
B
+C
+D
+E
)
Adju
stm
ent
fact
or
for
join
tori
enta
tion
(F)
RM
R
(RM
Rbasic+
F)
16
13
S0
89
15
51
–25
26
25
13
S0
10
10
15
53
–25
28
35
17
J1
912
15
58
–25
33
45
13
S0
10
815
51
–25
26
55
17
S0
10
16
15
63
–5
58
6A
4.5
13
J1
10
76
40.5
–50
–9.5
6B
4.5
13
S0
99
641.5
–50
–8.5
76
8J1
510
15
44
–25
19
8A
713
S0
813
15
56
–25
31
8B
88
S0
10
11
15
52
–25
27
99
17
S0
810
15
59
–25
34
10*
42
–10
32
S0
=bed
din
gpla
ne,
J1
=jo
int
no.1.
*R
MR
for
the
slope
10
isdet
erm
ined
from
the
der
ived
empir
icalre
lati
on
bet
wee
nbasi
cR
MR
and
GSI
(equati
on
9)
for
the
studie
dare
a.

112 Page 12 of 15 J. Earth Syst. Sci. (2017) 126:112Table
5.
Slo
pem
ass
rating
for
diff
eren
tslope
susi
ng
continuous
funct
ions.
Pla
nar
Wed
ge
Conti
nuous
SM
R=
(RM
Rbasic+
(F1∗F
2∗F
3)+
F4
Slo
pe
no.
F1
F2
F3
F1
F2
F3
F4
RM
Rbasic
PW
1–
––
0.5
10.7
2–59.6
30
51
–29
20.7
10.9
1–59.5
70.1
80.2
2–59.7
30
53
14.5
51
3–
––
0.5
10.7
6–59.5
80
58
–35
4–
––
0.3
40.2
5–59.7
30
51
–46
50.1
70.9
0–59.5
9–
––
063
53.9
–
6A
0.8
50.9
2–59.5
00.9
50.9
2–59.5
10
40.5
–6.0
–12
6B
0.7
70.9
0–59.5
9–
––
041.5
0.2
–
7-W
10.6
40.9
0–59.5
50.3
50.6
8–59.6
40
44
9.7
30
-W2
––
–0.9
90.8
9–59.5
70
44
––8
8A
-W1
0.6
70.9
4–59.4
70.3
70.9
4–59.4
80
56
18.5
35
W2
––
–0.8
00.9
2–59.5
20
56
–12
8B
0.9
50.9
7–58.9
4–
––
052
–2.3
–
9-W
10.6
70.9
7–58.6
40.1
90.5
9–59.5
80
59
20.9
52
-W2
––
–0.8
50.9
7–58.7
30
59
–11
W1
=w
edge
no.1,W
2=
wed
ge
no.2.
F2 =916
+1
195tan−1
(17100
B − 5)
. (4)
For planar and wedge failure,
F3 = −30 +13tan−1C. (5)
And for topple failure,
F3 = −13 − 17tan−1 (C − 120) (6)
where A = parallelism between slope strike andjoint strike for planar and toppling failures and dif-ference between slope strike and plunge directionof angle of intersection for wedge failure. B = dipof joint in planar failure and plunge of angle ofintersection in wedge failure.
C = difference between angle of slope and dip ofjoint for planar failure, difference between angle ofslope and plunge of line of intersection for wedgefailure and addition of slope angle and dip of joint,in case of toppling failure.
The adjustment factors for SMR have beendetermined from continuous functions from equa-tions (3, 4 and 5). All the slopes excluding slope10 (due to unavailability of joints or systematicfractures) have been classified according to SMRsystem. The ratings for planar and wedge failuresare given in table 5. The rock masses are very badto bad in quality for most of the slopes and normalfor slopes 4 and 5. Negative values are obtained forslope 6A and 8B for planar failure and 6A and 7for wedge failure. These slopes with negative valuescan be considered in very bad rock mass and rep-resent Class V of Romana (1985) interpretation.Slopes 4 and 5 represent the rock mass in ClassIII. Slopes 1 and 3 come under the Class IV, whileslopes 2, 6B, 8A and 9 are in Class V. Romana(1985) has given a stability interpretation for slopeson the basis of SMR. Accordingly, slopes 2, 6A,6B, 7, 8A, 8B and 9 are in very critical condition(completely unstable), slopes 1 and 3 are unstable,while slopes 4 and 5 are partially stable. From thefield observations, it is envisaged that for slope nos2, 4, 8B and 9, the stability is underestimated bySMR. This is due to exclusion of shear strength ofjoints in the rating system. However, if we count forthe shear strength of the joints, it may provide abetter approximation to the natural condition. Forthis type of conflict in the rating systems, solutionsthrough numerical simulation is suggested by manyresearchers.

J. Earth Syst. Sci. (2017) 126:112 Page 13 of 15 112
Figure 15. Plotted values in SR vs. SCR graph from Sonmez and Ulusay (2002) to obtain GSI.
3.2.3 Geological strength index
Geological strength index (GSI) is a convenientrock mass classification system which can be esti-mated in the field from visual observation ofblockiness and discontinuity surface conditions ofthe rock mass (Hoek et al. 1998). Though it does
not consider discontinuity orientation, it is veryhelpful in determining overall rock mass health.The GSI for 11 slopes have been calculated accord-ing to modified quantitative GSI system proposedby Sonmez and Ulusay (1999, 2002), while slopeno. 10 is estimated from visual observations (Hoeket al. 1998; Marinos and Hoek 2000). There are two

112 Page 14 of 15 J. Earth Syst. Sci. (2017) 126:112
Table 6. Quantified GSI for studied slopes.
Slope
no. Jv SR Rr Rf Rw SCR GSI
1 17 30.2 3 2 3 8 35
2 13 34.9 3 0 5 8 36
3 10 39.5 3 2 3 8 38
4 14 33.6 3 0 5 8 36
5 11 37.8 5 2 5 12 47
6A 18 29.2 2 0 3 5 27
6B 18 29.2 3 0 5 8 34
7 21 26.5 3 0 5 8 33
8A 19 28.3 5 2 5 12 43
8B 21 26.5 5 0 5 10 37
9 8 43.4 3 0 5 8 39
10 – – – – – – 29
Figure 16. Linear correlation of RMRbasic and GSI for 11slopes of the studied area.
factors considered for the index, one is structurerating (SR) and another is surface condition rating(SCR). These two factors are represented by thefollowing equations (Sonmez and Ulusay 2002).
SR = 17 lnJv + 79.8 (7)SCR = Rr + Rw + Rf (8)
where Jv = volumetric joint count, Rr = roughnessrating, Rw = weathering rating, and Rf = Infillingrating.
The value of SR and SCR are plotted in thegraph (figure 15) to obtain GSI. The GSI value forslope no. 10 is estimated from visual observation.Obtained quantified GSI are given in table 6.
A correlation has been derived from linear fit-ting of RMRbasic vs. GSI for 11 slopes for the
studied area (figure 16). The equation derived fromempirical relation is
Basic RMR = 6.46 + GSI × 1.23. (9)
This empirical equation may be well applicable torock masses of similar kind of lithology and geolog-ical structures which are highly disturbed.
4. Conclusions
The kinematic analysis and geomechanical classifi-cations of the rock mass are very important toolsfor the assessment of vulnerable slopes. Twelve cutslopes have been taken along NH-05 in Jhakri areaand the SMR values indicate that the rock massesrange from very bad to bad in quality for mostof the slopes and normal for slope 5. The RMRrepresents poor to very poor rock mass qualityexcept for location 5 which is fair in quality. More-over, the kinematic results match with the fieldobservations. The results obtained through con-tinuous SMR can be useful in designing supportsystems and to strengthen the existing vulner-able slopes for safe transportation in the studyarea. It is further recommended to conduct numer-ical analysis for those slopes where SMR seems tounderestimate the stability due to high joint shearstrength.
Acknowledgements
The authors express their sincere acknowledgementto the Department of Earth Sciences, IIT Bom-bay, for providing facilities to conduct experimentalworks. The authors are also thankful to IIT (ISM)Dhanbad for providing financial support for Dips6.0 from Faculty Research Scheme (Project No:FRS (46)/2013-2014/AGL).
References
Anbalagan R, Sharma S and Raghuvanshi T K 1992 Rockmass stability evaluation using modified SMR approach;In: Proceedings 6th Natural Symposium on Rock Mechan-ics, Bangalore, India, pp. 258–268.
Barton N, Lien R and Lunde J 1974 Engineering classifica-tion of rock masses for the design of tunnel support; RockMechanics 6(4) 189–236.
Bieniawski Z T 1973 Engineering classification of jointed rockmasses; Trans. S. Afr. Inst. Civ. Eng. 15 335–344.

J. Earth Syst. Sci. (2017) 126:112 Page 15 of 15 112
Bieniawski Z T 1976 Rock mass classification in rock engi-neering; In: Proceedings of the symposium on explore forrock engineering, Johannesburg, pp. 97–106.
Bieniawski Z T 1979 The geomechanical classification in rockengineering applications; In: Proceedings of 4th Interna-tional Congress on Rock Mechanics, International Societyfor Rock Mechanics, Salzburg, 2 41–48.
Bieniawski Z T 1989 Engineering rock mass classification;Chichester, Wiley, London.
Deere D U 1963 Technical description of rock cores for engi-neering purposes; Rock Mech. Eng. Geol. 1 16–22.
Goodman R E 1976 Methods of geological engineering in dis-continuous rocks; West Publishing, San Francisco.
Hoek E and Bray J W 1981 Rock slope engineering ; Institu-tion of Mining and Metallurgy, London.
Hoek E, Marinos P and Benissi M 1998 Applicability of theGeological Strength Index (GSI) classification for veryweak and sheared rock masses: The case of the AthensSchist Formation; Bull. Eng. Geol. Env. 57(2) 151–160.
International Society of Rock Mechanics (ISRM) 1981 Rockcharacterization testing and monitoring: ISRM suggestedmethods; Pergamon Press, London.
Kundu J, Sarkar K and Singh A K 2016 Integrating struc-tural and numerical solutions for road cut slope stabilityanalysis – A case study, India; In: Rock Dynamics: FromResearch to Engineering, Proceedings of the 2nd Interna-tional Conference on Rock Dynamics and Applications,pp. 457–462.
Kundu J, Mahanta B, Tripathy A, Sarkar K and Singh T N2016 Stability evaluation of jointed rock slope with curvedface; In: INDOROCK 2016, pp. 971–978.
Laubscher D H 1977 Geomechanics classification of jointedrock masses-mining applications; Trans. Inst. Min. Met-all. Sect. A – Mining Industry 86 A1–A8.
Laubscher D H 1984 Design aspects and effectiveness ofsupport in different mining conditions; Trans. Inst. Min.Metall. Sect. A – Mining Industry 93 A70–A81.
Laubscher D H 1990 A geomechanics classification systemfor the rating of rock mass in mine design; J. S. Atr. Inst.Min. Metall. 90 257–273.
Mahanta B, Singh H O, Singh P K, Kainthola A and Singh TN 2016 Stability analysis of potential failure zones alongNH-305, India; Natural Hazards, https://doi.org/10.1007/s11069-016-2396-8.
Marinos P and Hoek E 2000 GSI – A geologically friendlytool for rock mass strength estimation; In: Proceedings ofGeoEng2000 Conference, Melbourne, pp. 1422–1442.
Matherson G D 1988 The collection and use of field discon-tinuity data in rock slope design; Quart. J. Eng. Geol. 2219–30.
Narula P L, Shanker R and Chopra C 2000 Rupture mech-anism of Chamoli earthquake of 29th March 1999 and itsimplications for seismotectonics of Garwal Himalaya; J.Geol. Soc. India 55(5) 493–503.
Newman D A and Bieniawski Z T 1986 Modified version ofthe geomechanics classification for entry design in under-ground coal mines; Trans. Soc. Min. Eng. AIME 2802134–2138.
Palmstrom A 1985 Application of the volumetric joint countas a measure of rock mass jointing; In: Proceedings ofthe International Symposium on Fundamentals of RockJoints, Bjorkliden, Sweden, pp. 103–110.
Romana M 1985 New adjustment ratings for applicationof Bieniawski classification to slopes; In: Proceedings ofInternational Symposium on Role of Rock Mech, ISRM,Zacatecas, Mexico, pp. 49–53.
Sarkar K, Singh A K, Niyogi A, Behera P K, Verma A Kand Singh T N 2016 The assessment of slope stabilityalong NH-05 in Rampur–Jhakri Area, Himachal Pradesh;J. Geol. Soc. India 88 387–393, https://doi.org/10.1007/s12594-016-0500-z.
Selby M J 1980 A rock mass strength classification for geo-morphic purposes: With tests from Antarctica and NewZealand; Z. Geomorpho. 24 31–51.
Singh B and Goel R K 1999 Rock mass classification. A prac-tical approach in civil engineering ; Elsevier.
Singh K P 1979 Deformation history of the rocks aroundSarahan Bushair, Himachal Pradesh; In: Structural geol-ogy of the Himalaya (ed.) Saklani P S, pp. 163–182.
Singh P K, Kainthola A and Singh T N 2015 Rock massassessment along the right bank of river Sutlej, Luhri,Himachal Pradesh, India; Geomatics. Nat. Hazards Risk 6212–223, https://doi.org/10.1080/19475705.2013.834486.
Sonmez H and Ulusay R 1999 Modifications to the geologicalstrength index (GSI) and their applicability to stability ofslopes; Int. J. Rock Mech. Mining Sci. 36 743–760.
Sonmez H and Ulusay R 2002 A discussion on the Hoek-Brown failure criterion and suggested modifications to thecriterion verified by slope stability case studies; Yerbilim-leri (Earth Sci.) 26 77–99.
Srikantia S V and Bhargava O N 1998 Geology of HimachalPradesh; Geol. Soc. India.
Tomas R, Delgado J and Seron J B 2007 Modification ofslope mass rating (SMR) by continuous functions; Int. J.Rock Mech. Mining Sci. 44 1062–1069.
Umrao R K, Singh R and Singh T N 2015 Stability evalu-ation of hill cut slopes along National Highway-13 nearHospet, Karnataka, India; Georisk Assess. Manag. RiskEng. Syst. Geohazards 1–13, https://doi.org/10.1080/17499518.2015.1053494.
Venkateswarlu V 1986 Geomechanics classification of coalmeasure rocks vis-a-vis roof supports; Ph.D. thesis, IndianSchool of Mines, Dhanbad.
Weaver J 1975 Geological factors significant in the assess-ment of rippability; Civ. Eng. S. Afr. 17 313–316.
Zhang L 2016 Determination and applications of rock qualitydesignation (RQD); J. Rock Mech. Geotech. Eng., https://doi.org/10.1016/j.jrmge.2015.11.008.
Corresponding editor: N Purnachandra Rao