
Qualifying Examination (Part I) · anxiolytic effect of the drug (Fig. 1). Figure 1 . Lack of...
17
STUDENT EDITION Qualifying Exam – August 2015 Department of Pharmacology Qualifying Examination (Part I) August 4-6, 2015 ALL EXAMS TAKE PLACE IN THE BASS CONFERENCE ROOM, 436 RRB Date Time Exam Tuesday, August 4 th 10:00 am – 12:00 pm (Exam #1) 1:00 pm – 3:00 pm (Exam #2) 3:00 pm – 5:00 pm (Exam #3) Wednesday, August 5 th 1:00 pm – 3:00 pm (Exam #4) 3:00 pm – 5:00 pm (Exam #5) Thursday, August 6 th 10:00 am – 12:00 pm (Exam #6) 1:00 pm – 3:00 pm (Exam #7) 3:00 pm – 5:00 pm (Exam #8) 5:00 pm – 5:30 pm (Committee Meets to determine results – Pharm South Conf. Rm.) 5:30 pm (Results given to students – Pharm South Conf. Rm.) Please remember that this is a closed-book examination. You must be prepared to answer 4 of the 7 questions. Although not necessary, you may prepare written answers, overhead figures, or any type of materials that you think might be useful in the presentation of your answers. You may bring such preparation materials with you to the examination. The oral examination itself will not extend beyond two hours. If you have any questions regarding the examination, please contact Christine Konradi at: 615-936-1021 (office) 615-480-5738 (cell) 615-469-2511 (home)
Transcript of Qualifying Examination (Part I) · anxiolytic effect of the drug (Fig. 1). Figure 1 . Lack of...

STUDENT EDITION Qualifying Exam – August 2015
Department of Pharmacology
Qualifying Examination (Part I)
August 4-6, 2015
ALL EXAMS TAKE PLACE IN THE BASS CONFERENCE ROOM, 436 RRB
Date Time Exam
Tuesday,
August 4th
10:00 am – 12:00 pm (Exam #1)
1:00 pm – 3:00 pm (Exam #2)
3:00 pm – 5:00 pm (Exam #3)
Wednesday,
August 5th
1:00 pm – 3:00 pm (Exam #4)
3:00 pm – 5:00 pm (Exam #5)
Thursday,
August 6th
10:00 am – 12:00 pm (Exam #6)
1:00 pm – 3:00 pm (Exam #7)
3:00 pm – 5:00 pm (Exam #8)
5:00 pm – 5:30 pm (Committee Meets to determine results –
Pharm South Conf. Rm.)
5:30 pm (Results given to students – Pharm South Conf. Rm.)
Please remember that this is a closed-book examination. You must be prepared to answer 4 of the 7 questions. Although not necessary, you may prepare written answers, overhead figures, or any type of materials that you think might be useful in the presentation of your answers. You may bring such preparation materials with you to the examination. The oral examination itself will not extend beyond two hours. If you have any questions regarding the examination, please contact Christine Konradi at:
615-936-1021 (office) 615-480-5738 (cell)
615-469-2511 (home)

Question 1 Qualifying Exam – August 2015
Brain serotonin (5-HT) is implicated in the etiology of neuropsychiatric disorders, such as anxiety
and depression. Recent work revealed that mice lacking the 5-HT1A serotonin receptor, when injected
with the classical benzodiazepine (BZ) diazepam to relieve anxiety, appeared to be insensitive to the
anxiolytic effect of the drug (Fig. 1).
Figure 1. Lack of anxiolytic-like effect of diazepam in 5-HT1A receptor KO mice demonstrated in elevated plus maze (A,
B) and in open field (C, D). Insets display the increased anxiety of KO mice (open bars) compared with WT animals (filled
bars) measured as a decrease in the number of entries into the open arm (inset in A) and time spent in the open arm (B), as
well as a decrease in the number of entries into the center (C) and time spent in the center.
The 5-HT1A receptor is expressed both pre- and post-synaptically. Presynaptic 5-HT1A receptors
are expressed on serotonergic neurons, and activation of these autoreceptors suppresses 5-HT synthesis,
turnover, and release. In vivo microdialysis studies showed that the absence of presynaptic receptors
does not alter 5-HT dynamics in 5-HT1A receptor KO mice. This indicates that the anxiety phenotype
of the 5-HT1A receptor KO mice is probably attributable to the lack of receptors at the postsynaptic
sites.
The researchers then performed experiments to determine the mechanisms of the loss of sensitivity
to BZ. First, they compared the plasma concentration of diazepam in the two mouse lines (Fig. 2A).
Then they compared the sensitivity to the sedative effect of pentobarbital (Fig. 2B). Next, the
researches examined the paired-pulse inhibition in the CA1 field of the hippocampus of WT and KO
mice (Fig. 3). Paired-pulse inhibition refers to the phenomenon when the second electrical pulse that
follows the first pulse of the same intensity within 10 msec induces a response of decreased magnitude.
The degree of the paired-pulse inhibition reflects the strength of the inhibitory neurotransmission.

Question 1 Qualifying Exam – August 2015
Figure 2. (A) Plasma concentration of the drug after single injection of 3 mg/kg of diazepam; (B) Sensitivity to the sedative
effect of pentobarbital, measured as time to regain righting reflex after a 65 mg/kg dose (left graph) and as a cumulative
dose of the drug required for deep anesthesia (right graph).
Figure 3. Impaired paired-pulse inhibition in the CA1 region of the hippocampus of 5-HT1A receptor KO mice.
Representative field potentials induced by paired-pulse stimuli presented at 10 msec intervals of WT (A) and KO (B)
hippocampal slices. Peak 1 represents the response to the first electrical pulse, and the peak 2 – response to the second pulse.
* - p<0.05 to the peak 1.
1. Briefly describe the behavioral tests used to measure anxiety in mice (and what exactly is
measured) as shown in Fig. 1. What receptor(s) mediate the actions of BZ in the brain?
What is the mode of action of BZ?
2. What conclusions can you reach based on the data presented in Fig. 2A as to the
mechanisms of the loss of the BZ anxiolytic effect in 5-HT1A receptor KO mice? What
does the data in Fig. 2B tell you? What receptor mediates the action of barbiturates?
3. Propose a simple model regarding the molecular underpinning of the loss of the BZ
anxiolytic effect in 5-HT1A receptor KO mice based on the data in Figs. 2 and 3. Propose
experiments to test the model.

Question 2 Qualifying Exam – August 2015
A flurry of activity is instigated in your drug development division when reports emerge of the first human trials
of the new tyrosine kinase inhibitor, GD-123, targeted for rheumatoid arthritis. The results seem in conflict with
the pre-clinical animal DMPK studies that supported its use in humans. It is undetectable in human plasma or
urine after oral dosing (only metabolite M1 was detectable in plasma). Within a month you have to present to
the scientific advisory panel a re-evaluation of the old data and new in vitro information you have produced to
shed light on this major mishap/miscalculation.
Note:
not all the data accumulated pointed to the results found in humans
not all the accumulated data is given to you here (you may propose experiments to fill in missing helpful
information)
And: For your information, typical hepatic blood flow values are:
(ml/min/kg)
Mouse (20-25g) 90
Rat 85
Dog (10-12Kg) 31
Monkey (4-5kg) 44
Human (70kg) 21
Questions:
1. Analyzing in retrospect, from the information that was available (presented here), identify the
parts that conflict with the findings in humans, and those that were predictive of the human
results. Give your reasoning.
2. Propose additional in vitro experiments that you and your team should carry out to further clarify
the mechanistic basis underlying the in vivo human results.
The data available to you is given in Tables 1, 2, and 3, and Figures 1 and 2.
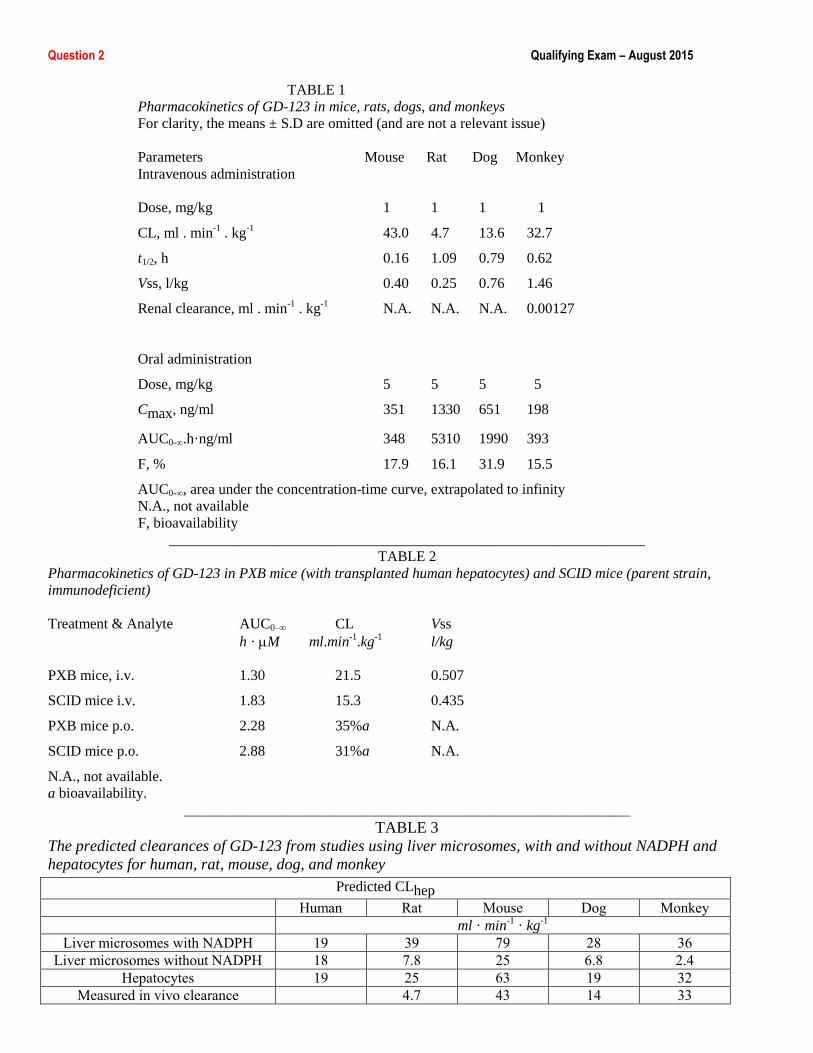
Question 2 Qualifying Exam – August 2015
TABLE 1
Pharmacokinetics of GD-123 in mice, rats, dogs, and monkeys
For clarity, the means ± S.D are omitted (and are not a relevant issue)
Parameters Mouse Rat Dog Monkey
Intravenous administration
Dose, mg/kg 1 1 1 1
CL, ml . min-1
. kg-1
43.0 4.7 13.6 32.7
t1/2, h 0.16 1.09 0.79 0.62
Vss, l/kg 0.40 0.25 0.76 1.46
Renal clearance, ml . min-1
. kg-1
N.A. N.A. N.A. 0.00127
Oral administration
Dose, mg/kg 5 5 5 5
Cmax, ng/ml 351 1330 651 198
AUC0-∞.h·ng/ml 348 5310 1990 393
F, % 17.9 16.1 31.9 15.5
AUC0-∞, area under the concentration-time curve, extrapolated to infinity
N.A., not available
F, bioavailability
_________________________________________________________________
TABLE 2
Pharmacokinetics of GD-123 in PXB mice (with transplanted human hepatocytes) and SCID mice (parent strain,
immunodeficient)
Treatment & Analyte AUC0–∞ CL Vss
h · M ml.min-1
.kg-1
l/kg
PXB mice, i.v. 1.30 21.5 0.507
SCID mice i.v. 1.83 15.3 0.435
PXB mice p.o. 2.28 35%a N.A.
SCID mice p.o. 2.88 31%a N.A.
N.A., not available.
a bioavailability.
_____________________________________________________________
TABLE 3
The predicted clearances of GD-123 from studies using liver microsomes, with and without NADPH and
hepatocytes for human, rat, mouse, dog, and monkey
Predicted CLhep
Human Rat Mouse Dog Monkey
ml · min-1
· kg-1
Liver microsomes with NADPH 19 39 79 28 36
Liver microsomes without NADPH 18 7.8 25 6.8 2.4
Hepatocytes 19 25 63 19 32
Measured in vivo clearance 4.7 43 14 33

Question 2 Qualifying Exam – August 2015
FIG. 1. Plasma PK profiles of GD-123 and its major
metabolite M1 in rats (A), dogs (B), and monkeys (C)
dosed orally at 5 mg/kg.
In rats, dogs, and monkeys. the metabolite/parent AUC
are 1.5%, 26%, and negligible, respectively.

Question 2 Qualifying Exam – August 2015
N
NHN
S
O
O
HN
N
N
O
GD-123
N
N
H2N
O
HN
N
N
O
metabolite M1
"Hydrolase"(amide
hydrolysis)
other metabolites
other metabolites
P450
P450 P450 Demethylation
P450 Oxidation
N
NHN
S
O
O
HN
N
N
O
NH
NHN
S
O
O
HN
N
N
O
HO
METABOLISM OF GD-123
FIG. 2. Allometric scaling of human clearance (CL) on the basis of the preclinical in vivo mouse, rat, monkey, and dog
PK data. The predicted human clearances are 13 and 5.4 ml · min-1
· kg-1
, respectively, based on the simple allometry (A)
and allometry corrected with mean life-span (B).

Question 3 Qualifying Exam – August 2015
Ovarian estrogens play a major role in the regulation of energy homeostasis. Decreased levels of estradiol (E2) after menopause are associated with hyperphagia, reduced energy expenditure, and weight gain. Ovariectomy (OVX) in rats has a number of physiological consequences, similar to menopause in women.
Figure 1: Sprague-Dawley rats were bilaterally ovariectomized (OVX) or sham operated. For the experiments of E2 replacement, OVX rats received a daily SC injection of E2 (estradiol benzoate; EB, 2 μg dissolved in 100 μL of sesame oil) or vehicle (100 μL of sesame oil; control rats) during 7 days. (A) Body weight change and (B) daily food intake on day 21.
1- Describe Figure 1 and what it indicates as to the mechanisms supporting positive energy balance in OVX rats. 2- OVX induces a decrease in E2 serum levels. What is the expected effect on luteinizing hormone (LH) and how does that work? 3-To dissect the relative contribution of the anorectic effect of E2 to its impact on energy homeostasis, a group of vehicle-treated pair-fed rats (i.e., received the average amount of food eaten by the E2-treated rats the day before) is studied. Results are plotted in Figure 2. Describe and interpret the data presented.
Figure 2: (A) Body weight change; (SC = subcutaneous), (B) daily food intake on day 7.

Question 3 Qualifying Exam – August 2015
4- Genetic models of loss of function of estrogen receptors (ERs), which are widely expressed in the hypothalamus have demonstrated that mice with global or brain-specific targeted disruption of ER alpha (ERα) are obese. To address a putative effect of E2 via the CNS, E2 is injected intracerebroventricularly (ICV) to OVX rats. Describe and discuss the results obtained as presented in Figure 3.
Figure 3: (A) Body weight change (left panel), daily food intake (middle panel), and core temperature (right panel); (B) protein levels (upper panel) and western blot autoradiographic images of BAT UCP1 protein (lower panel); (C) infrared thermal images (left panel) and quantification of temperature of the skin surrounding interscapular BAT (brown adipose tissue, right panel)
5- Describe the effect of administration of the beta 3 adrenergic receptor (β3-AR) specific antagonist SR59230A (Figure 4). What do you conclude as to the mechanism by which E2 may increased body weight and reduced energy expenditure in OVX rats?
Figure 4: (E) Body weight change, (F) daily food intake, (G) core temperature.

Question 4 Qualifying Exam – August 2015
Activation of the EGFR/HER network is tightly regulated throughout development. In the adult, components of the EGFR/HER network such as EGFR1 (HER1) and HER2 are frequently activated in gastric, ovarian and breast cancers. To investigate the contribution of each EGFR member in uncontrolled cell proliferation, a panel of six HER2 overexpressing breast cancer cell lines was analyzed and results are shown in Figure 1.
Figure 1: Proliferation and receptor
phosphorylation in HER2
overexpressing breast cancer cell
lines.
(A) Cell proliferation of cancer cell
lines transfected with either a non-
targeting control (NTC) siRNA
oligonucleotide (white columns) or a
pool of four siRNA oligonucleotides
against EGFR (hatched columns),
HER2 (gray columns), or HER3 black
columns). The extent of cell
proliferation under each condition was
plotted as a percentage (mean + SE) of
the normalized non-targeting control
value for each cell line.
(B) Effect of HER3 siRNA on HER2 in
each cancer cell line. Total cell lysates
were prepared and Western blotting
was performed using antibodies for
HER2, phosphorylated HER2, and
HER3. Equal protein was loaded in
each lane.
(C) Effect of HER2 siRNA on HER3.
Total cell lysates were analyzed using
antibodies for HER3, phosphorylated
HER3 and HER2. Equal protein was
loaded in each lane.
1. Explain the results shown in panel A of Figure 1. Which EGFR/HER is responsible
for the increased proliferation in BT474, EFM192A and HCC1954 cells, respectively?
2. Explain the results in panel B of Figure 1. What conclusion can be drawn from the results?
3. Explain the results in panel C of Figure 1. What conclusion can be drawn from the results?

Question 4 Qualifying Exam – August 2015
4. Based on the findings, propose potential signaling mechanisms (receptors and
downstream events) that could lead to the increased proliferation in BT474 and EFM192A cells, respectively.
5. Propose a series of experiments including results to support your hypothesis in (4).

Question 5 Qualifying Exam – August 2015
Calmodulin (CaM) is an essential Ca binding protein that transduces Ca signals in a wide range of biological
processes. CaM binds to larger proteins and functions as a Ca sensor for decoding Ca signals into downstream
responses. In the heart, CaM regulates many ion channels such as the L-type Ca channel (Ca-dependent
inhibition), Ca-activated K channels (Ca-dependent activation) and the RyR2 sarcoplasmic reticulum Ca
release channel (Ca-independent inhibition).
Excessive Ca leak through RyR2 channels has been identified as contributing to cardiac dysfunction and
arrhythmia risk in human heart failure (HF). Reactive oxygen species (ROS) are increased in HF. It is well
known that exposing cardiomyocytes to ROS increases RyR2 Ca leak, but the underlyng mechanism(s) are not.
The following experiments were performed to elucidate how ROS generate RyR2 Ca leak.
Abbreviations: CaM, calmodulin; CaSpF, calcium spark frequency; DAN, dantrolene; F, fluorescent; HF, heart
failure; H2O2, hydrogen peroxide; RyR2,cardiac ryanodine receptor; SR, sarcoplasmic reticulum;
Fig. 1 Measurement of spontaneous RyR2
openings (Ca sparks) in intact rat
cardiomyocytes. Ca sparks and SR Ca
content were measured in myocytes which
were treated or not for 5min with 50 μM
H2O2. A subset of myocytes were also
pretreated for 2 h with 1 μM dantrolene
(DAN). (A) Representative line-scan images
of Ca sparks. (B) Summarized data of
CaSpF and SR Ca content. Data are reported
as mean ± SE (n values on bars). *P < 0.05
vs. Control, # P < 0.05 vs. H2O2.
Fig. 2 Measurement of CaM binding to RyR2 in
permeabilized cardiomyocytes. Based on previous
work, fluorescent-labeled CaM binding at the Z-line
of the myocytes reflects >90% binding to RyR2. (A)
Representative confocal images illustrating the effect
of myocyte oxidation by H2O2 on F-CaM binding at
the Z-lines (FZ − FM). H2O2 was applied to the bath
1 h before beginning to image and was present
throughout the experiment. (B) Quantitative analysis
of data from A, normalized to FZ − FM at control.
(C) Representative confocal images of the effect of
F-CaM oxidation on specific binding at the Z-line
(FZ − FM). F-CaM was pre-incubated in H2O2, then
applied to the myocyte bath under control conditions
(F-CaMOx). (D) Quantitative analysis of data from C.
Data are reported as mean ± SE (n values on bars). *p
< 0.001 vs. control.

Question 5 Qualifying Exam – August 2015
In independent experiments (data not shown), DAN had no effect on cellular ROS levels (measured by ROS
fluorescent indicator) or RyR2 oxidation (measured by RyR2 relative free thiol content). Previous work has
demonstrated that calmodulin (CaM) has to be present for DAN inhibition of RyR2 (Mol Pharm 2015).
Question 1: Describe the results of the Ca spark (Fig. 1) and calmodulin binding experiments (Figs 2).
Formulate a hypothesis on how ROS activates Ca sparks and on how DAN inhibits ROS-induced Ca
sparks. Design experiments that will test your hypothesis.
To further explore the mechanism of the dantrolene action, CaM binding to normal and oxidized RyR2 was
measured in presence/absence of dantrolene in permeabilized rat moycytes. AIP is a selective inhibitor of
Ca/CaM activated kinase. Results are shown in Fig. 3
Fig. 3 Effect of dantrolene (DAN) on CaM
binding to RyR2. (A) H2O2 was applied to the
myocyte bath 1 h before beginning the recording,
and was removed before the applying the F-CaM.
Representative confocal images of the effects of
H2O2, H2O2 + AIP, and H2O2 + dantrolene on the
specific binding of F-CaM binding at the Z-lines
(FZ − FM). (B) Quantitative analysis of data from A.
(C) Representative confocal image of the effects of
AIP and DAN on F-CaM Z-line binding in control
myocyte. (D) Quantitative analysis of data from C.
Data are reported as mean ± SE (n values on bars;
a.u., arbitrary units). *p b 0.001 vs. control, #p
<0.001 vs. H2O2.
Question 2: Describe the results of the CaM binding measurements in Fig. 3. Speculate on the likely
mechanism of dantrolene action.

Question 6 Qualifying Exam – August 2015
The epithelial Na+ channel (ENaC) is essential for Na+ homeostasis, and dysregulation of this channel underlies many
forms of hypertension. Recent studies suggest that mTOR regulates phosphorylation and activation of
serum/glucocorticoid regulated kinase 1 (SGK1), which is known to inhibit ENaC internalization and degradation;
however, it is not clear whether mTOR contributes to the regulation of renal tubule ion transport. mTOR exists in 2
evolutionarily conserved complexes, mTORC1 and mTORC2, and controls a diverse array of physiological processes,
including protein translation, proliferation, migration, and metabolism. You compare in vivo administration of rapamycin
(an mTORC1 inhibitor) to PP242 (an mTORC2 inhibitor) in WT mice and observed the following.
Figure 1: WT mice were treated with the mTOR catalytic site inhibitor PP242 (30 mg/kg i.p., n=6 mice per treatment group, left column panels A-E) or the mTORC1 inhibitor rapamycin (1.5 mg/kg i.p., n=6 mice, Right column panels F–J), and all urine was collected for the next 6 hours. Values for (A and F) urine volume, (B and G) net Na
+ excretion (calculated as urinary Na
+ × volume [mmol/6
h]), (C and H) net K+
excretion (urinary K+
× vol), (D and I) net Cl
- excretion (urinary Cl
- × vol), and (E and J) urinary
Na+/K
+ concentration ratio represent fold change relative to
the vehicle-treated group. Data represent mean ± SEM; differences were determined by unpaired Student’s t -test. *P < 0.05 vs. vehicle.

Question 6 Qualifying Exam – August 2015
Questions:
1. Explain the observed effects and describe which mTORC is involved.
2. Does this fit with regulation of ENaC, and why or why not?
You treat WT mice with PP242 and either amiloride or hydrochlorothiazide (HCTZ) and observe the following.
3. What happens to the effect of PP242 in the presence of amiloride and what does this mean?
4. Why does PP242 still increase Na+ excretion in the presence of HCTZ?
Figure 2: WT mice were pretreated overnight with amiloride to block ENaC, then injected i.p. the next morning with amiloride plus vehicle or PP242 (A–D, n=6 mice per treatment group), or pretreated overnight with HCTZ to block NCC, then injected i.p. the next morning with HCTZ plus vehicle or PP242 (E–H, n=9 mice per treatment group); subsequently, urine was collected for 6 hours. Values for (A and E) urine volume, (B and F) net Na
+ excretion, (C and G)
net K+ excretion, (D and H) and net Cl
- excretion
represent fold change relative to the vehicle-treated group. Data represent mean ± SEM; differences were determined by unpaired Student’s t -test. *P < 0.05 vs. vehicle.
Question 7 Qualifying Exam – August 2015
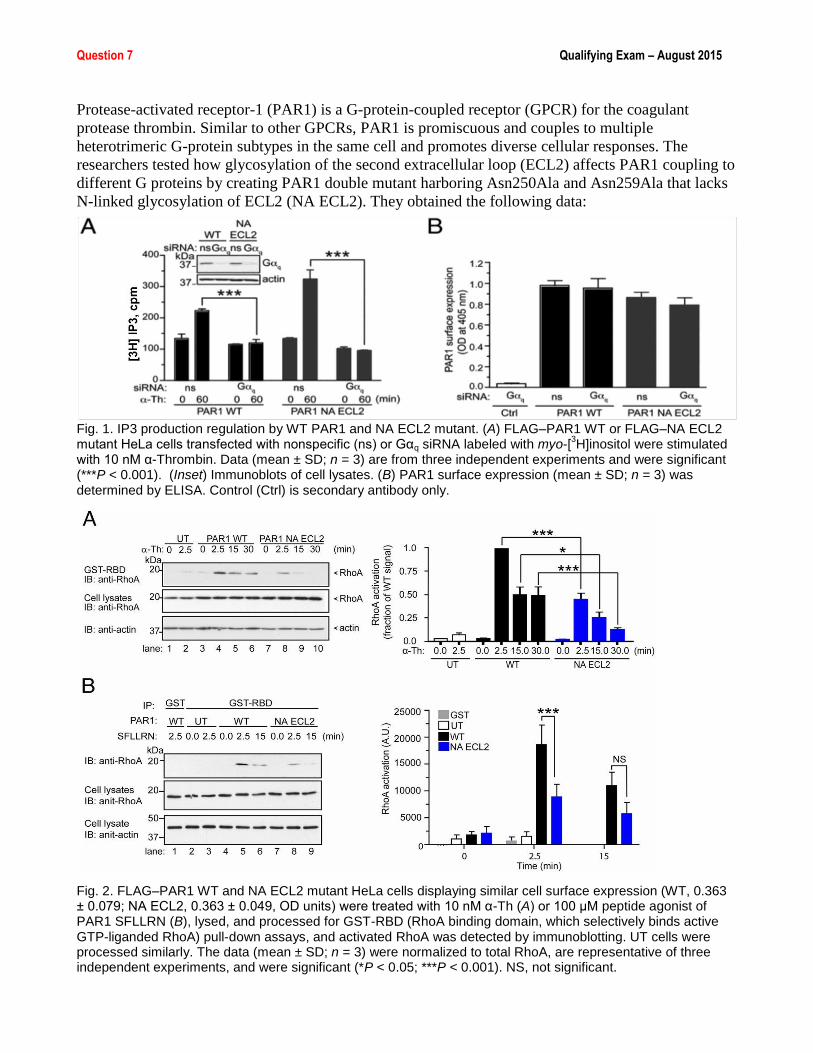
Protease-activated receptor-1 (PAR1) is a G-protein-coupled receptor (GPCR) for the coagulant
protease thrombin. Similar to other GPCRs, PAR1 is promiscuous and couples to multiple
heterotrimeric G-protein subtypes in the same cell and promotes diverse cellular responses. The
researchers tested how glycosylation of the second extracellular loop (ECL2) affects PAR1 coupling to
different G proteins by creating PAR1 double mutant harboring Asn250Ala and Asn259Ala that lacks
N-linked glycosylation of ECL2 (NA ECL2). They obtained the following data:
Fig. 1. IP3 production regulation by WT PAR1 and NA ECL2 mutant. (A) FLAG–PAR1 WT or FLAG–NA ECL2 mutant HeLa cells transfected with nonspecific (ns) or Gαq siRNA labeled with myo-[
3H]inositol were stimulated
with 10 nM α-Thrombin. Data (mean ± SD; n = 3) are from three independent experiments and were significant (***P < 0.001). (Inset) Immunoblots of cell lysates. (B) PAR1 surface expression (mean ± SD; n = 3) was determined by ELISA. Control (Ctrl) is secondary antibody only.
Fig. 2. FLAG–PAR1 WT and NA ECL2 mutant HeLa cells displaying similar cell surface expression (WT, 0.363 ± 0.079; NA ECL2, 0.363 ± 0.049, OD units) were treated with 10 nM α-Th (A) or 100 μM peptide agonist of PAR1 SFLLRN (B), lysed, and processed for GST-RBD (RhoA binding domain, which selectively binds active GTP-liganded RhoA) pull-down assays, and activated RhoA was detected by immunoblotting. UT cells were processed similarly. The data (mean ± SD; n = 3) were normalized to total RhoA, are representative of three independent experiments, and were significant (*P < 0.05; ***P < 0.001). NS, not significant.

Question 7 Qualifying Exam – August 2015
Fig. 3. (A) Endothelial cells incubated with 0.25 μg/mL of glycosylation inhibitor tunicamycin (TNC) for 18 h and treated with 10 nM α-Thrombin (α-Th). Cells were lysed, immunoprecipitated, and immunoblotted. Asterisk (*) is a nonspecific band. (B) TNC-treated and untreated endothelial cells labeled with myo-[
3H]inositol were
stimulated with 10 nM α-Th, and [3H]IPs were measured. Data (mean ± SD; n = 3) were normalized to PAR1
surface expression from three independent experiments and were significant (**P < 0.01). (C) Endothelial cells treated with or without TNC and 10 nM α-Thrombin were processed for GST-RBD pull-down assays, and RhoA activation was determined. Data (mean ± SD, n = 4) were normalized to PAR1 surface expression and were significant (*P < 0.05).
Questions: 1. How does PAR1 glycosylation affect its signaling?
2. Which G protein mediates IP3 production in the experiments shown in Fig. 1?
What other G protein subtypes can mediate IP3 production?
3. Describe signaling cascade downstream of Gq family members.
4. Through which G protein(s) do GPCRs mediate RhoA activation? What type of protein is RhoA and how its activity is regulated in the cell?
5. Propose at least two experiments (not performed here) to further test which G proteins WT and mutant PAR1 couples to.


![Anxiolytic ...downloads.hindawi.com/journals/ecam/2019/2156873.pdflinalool, administered by inhalation, induces anxiolytic ef-fectspreventedbyFLZ[24],whilesystemicadministration does](https://static.fdocuments.in/doc/165x107/6099a7122e21346bf31b92d6/anxiolytic-linalool-administered-by-inhalation-induces-anxiolytic-ef-fectspreventedbyflz24whilesystemicadministration.jpg)

