Qualified Majority Voting Explained - ResearchGate · D. Felsenthal and M. Machover: Qualified...
24
See discussions, stats, and author profiles for this publication at: https://www.researchgate.net/publication/5099676 Qualified Majority Voting Explained Article · December 2004 Source: RePEc CITATIONS 3 READS 46 2 authors: Some of the authors of this publication are also working on these related projects: A book whose name is "Monotonicity failures afflicting procedures for electing a single candidate" View project Dan S. Felsenthal University of Haifa 106 PUBLICATIONS 2,247 CITATIONS SEE PROFILE Moshé Machover The London School of Economics and Political Science 87 PUBLICATIONS 2,242 CITATIONS SEE PROFILE All content following this page was uploaded by Moshé Machover on 31 May 2014. The user has requested enhancement of the downloaded file.
Transcript of Qualified Majority Voting Explained - ResearchGate · D. Felsenthal and M. Machover: Qualified...

See discussions, stats, and author profiles for this publication at: https://www.researchgate.net/publication/5099676
Qualified Majority Voting Explained
Article · December 2004
Source: RePEc
CITATIONS
3READS
46
2 authors:
Some of the authors of this publication are also working on these related projects:
A book whose name is "Monotonicity failures afflicting procedures for electing a single candidate" View project
Dan S. Felsenthal
University of Haifa
106 PUBLICATIONS 2,247 CITATIONS
SEE PROFILE
Moshé Machover
The London School of Economics and Political Science
87 PUBLICATIONS 2,242 CITATIONS
SEE PROFILE
All content following this page was uploaded by Moshé Machover on 31 May 2014.
The user has requested enhancement of the downloaded file.

Homo Oeconomicus 21(3/4): 573–595 (2004)
Qualified Majority Voting Explained
Dan S Felsenthal University of Haifa, Haifa, Israel.
(e-mail: [email protected])
Moshé Machover King's College, London, UK.
(e-mail: [email protected])
Abstract We explain the issue of the decision rule of the EU’s Council of Ministers. We outline, in as non-technical fashion as we can, the mathematical theory (due to L S Penrose) that addresses this sort of issue. We assess the decision rule prescribed in the Nice Treaty as well as that included in the Draft Constitution proposed by the European Convention. Finally, we propose our own solution to this problem.
JEL Classification C43, C71, D71 Keywords EU Council of Ministers, EU Constitution, qualified majority voting, voting power
1. Introduction
Of all constitutional issues of the EU, probably the most contentious is the rule according to which the Council of Ministers (CM) – the EU’s leading legislative body – takes most of its decisions. The Intergovernmental Conference on institu-tional reform of the EU, held at Nice in December 2000, had to be extended be-yond its planned Sunday deadline, and ended in the small hours of Monday, 11 December – all because of this issue, which resisted agreement until the last mo-ment. In the end the heads of EU governments were so exhausted that the re-sulting text in the Treaty of Nice dealing with this issue is something of dog’s dinner.1 Almost exactly three years later, the Summit Conference of the then cur-
www.accedoverlag.de
29/01/2005 23:01 07-21-3 Felsenthal.doc
1 In his insider’s report, Galloway (2001, p. 83) puts it much more delicately: ‘Given the general state of weariness at 4.20 am at the end of a four-day marathon when overall agreement was reached,
© 2004 Accedo Verlagsgesellschaft, München.
ISBN 3-89265-056-x ISSN 0943-0180

574 Homo Oeconomicus 21(3/4): 573–595 (2004)
rent and prospective member-states of the EU that met in Brussels to agree on the Draft Constitution for Europe, proposed by the European Convention, broke down mainly because it reached a deadlock on this very issue.
The issue is not only contentious, but also ill understood. Essentially it in-volves a mathematical problem: how to measure voting power, the power that a member of a voting body such as the CM derives solely from the decision rule under which that body operates. This problem is not simple, particularly in cases such as that of the CM, where members have different numbers of votes. It is be-set by pitfalls: ideas that seem obvious to superficial common sense, but on careful analysis turn out to be false. The politicians who haggle about the CM’s decision rule are obviously concerned to maximize the voting powers of their re-spective states, subject to certain constraints.2 There is nothing particularly wrong with this: it is their job. But the pursuit of political interests had better be guided by precise knowledge of the scientific facts. Unfortunately, on the issue in question it has all too often been misguided by unreliable gut feeling.
If politicians and their advisers do not have sufficient understanding of this is-sue, it is no wonder that members of the public are quite perplexed about it.
We have published in scholarly journals many articles on the measurement of voting power (both in general and with special reference to the CM), and are the authors of the only monograph on this subject. These writings are for academic experts and presuppose some specialized mathematical knowledge. But the con-clusions of our research concerning the CM’s decision rule can be explained in non-technical outline, to any interested intelligent person. This is what we pro-pose to do here. For the technical details of our analysis we refer the reader to our publications listed in the References.
2. The weighting system before May 2004
The EU is supposed to be a ‘union of states’ as well as a ‘union of peoples’; in this sense it is a federal entity. Clearly, this ought to be reflected in its decision-mak-ing institutional architecture.
How should this be done? The most coherent and rational legislative ar-rangement would be a bi-cameral structure, consisting of two decision-making bodies, reflecting the ‘union of states’ and ‘union of peoples’ concepts, respec-
a degree of ambiguity inevitably crept into the final outcome.’ For a discussion of the ‘ambiguity’ – actually an inconsistency – see Felsenthal and Machover (2001, 2004).
2 An important constraint is that no member-state can be given voting power greater than that of another whose population is larger. A vital overall political constraint is that the decision rule must be acceptable to all member states, and have democratic legitimacy in the eyes of the EU’s citizenry.
29/01/2005 23:01 07-21-3 Felsenthal.doc29/01/2005 23:01 07-21-3 Felsenthal.doc

D. Felsenthal and M. Machover: Qualified Majority Voting Explained 575
tively. The former would make its decisions according to the principle one state, one vote (OSOV); the latter should apply the principle of one person, one vote (OPOV).
This kind of structure exists in the United States, a federation whose constitu-tion was framed by 18th century rationalists. In the Senate, each State, irrespec-tive of its size, has equal representation. In the House of Representatives, the people are supposed to be represented on the OPOV principle: members of the House are elected in constituencies of roughly equal size, thus giving equal vot-ing power to every citizen, across all States.
In the EU, the logical bi-cameral structure would consist of a European Par-liament (EP), representing the peoples and elected directly by them according to a proportional system; and a Council of Ministers, representing the member-states, according to OSOV. (This of course leaves open the question of the rela-tive power of these two bodies. This would be decided by the evolution of the Union: as it grows closer, as well as more democratic, the parliament would gain power.) This idea was in fact entertained by Sweden during the negotiations leading to its accession in 1995. But by then it was much too late: the CM – by far the most important legislative body of the EU – had an entrenched pattern of de-cision rules.3
Only the most important issues are decided by the unanimity rule, which in-deed gives equal voting power – the power of veto – to each member-state. But as the number of members increases, unanimity becomes very much harder to achieve; so as the EU enlarges, it becomes necessary to restrict the scope of issues requiring unanimity.4 Most (and a necessarily increasing number of) issues are decided in the CM by a weighted decision rule, known in Eurospeak as qualified majority voting (QMV): each member is assigned a weight (a number of votes); and in order for a bill to be passed by the CM the total weight of those voting for it must equal or exceed a set quota (also known as the ‘threshold’).
The weights and quota were first set for the original six members in the 1957
3 Article 45(2) of the Draft Constitution proposed by the European Convention (2003) states:
‘Citizens are directly represented at Union level in the European Parliament. Member States are represented in the European Council and in the Council of Ministers by their governments, them-selves accountable to national parliaments, elected by their citizens.’ However, the Draft Constitution stops short of drawing from this statement the logical conclusion regarding the decision rule of the CM.
4 The a priori odds against unanimity among 15 members are 32,767 to 1; for 25 members the a priori odds against unanimity are 33,554,431 to 1; and for 27 members they are 134,217,727 to 1. A priori odds are calculated as though voting were random, each member deciding how to vote by tossing a true coin. Of course, in reality voting is not random. But the a priori odds represent mathematically the steepness of the objective slope that the engine of diplomacy and the drive for consensus have to climb in order to achieve unanimity.
29/01/2005 23:01 07-21-3 Felsenthal.doc

576 Homo Oeconomicus 21(3/4): 573–595 (2004)
Treaty of Rome, and before the Nice Treaty had to be re-set four times, with each successive enlargement of the EU (1973, 1981, 1985, 1995). So far, there has been no explicit formula, agreed once and for all, prescribing how the weights and quota should be set each time the EU is enlarged. Rather, with each enlargement the allocation was re-negotiated ad hoc.5 Nevertheless, there was a fairly stable implicit pattern. On all five pre-Nice occasions, the quota was set at approxi-mately 71% of the total weight.6 As for the weights, they were allocated on the basis of population size: members were divided into groups; the members in each group being of roughly similar population size and assigned equal weight. Thus, for example, the allocation set in the 1995 enlargement assigned weight 10 to Germany, UK, France and Italy; 8 to Spain; 5 to the Netherlands, Greece, Belgium and Portugal; 4 to Sweden and Austria; 3 to Denmark, Finland and Ireland; and 2 to Luxembourg. This makes a total of 87; and the quota is 62, which is 71.26% of this total.7
3. The reasoning behind the pre-Nice QMV system
What is the reasoning behind this kind of weight allocation? If the CM is re-garded as a purely inter-governmental body, each minister acting solely as repre-sentative of his or her state, then the OSOV principle ought to apply, giving all member-states equal weight. The only democratically legitimate argument for giving more populous member-states greater voting weight in the CM than less populous ones is that the ministers represent at the CM their respective peoples; therefore the OPOV principle ought to apply.
The latter view of the CM regards it as the upper tier of a two-tier decision-making structure: the citizens of each country elect its government and thereby determine its policies (at least, they ought to, theoretically…); the minister of this country then votes in the CM on behalf of the country’s citizens, reflecting the majority’s views. Thus the citizens of the EU are regarded as the lower tier of this two-tier structure: they are indirect decision-makers, acting as it were through their respective ministers.
How is the OPOV principle to be implemented in this two-tier structure, giving all citizens, across all countries of EU, equal (indirect) power to affect the
5 The fixing of the quota in the previous enlargement (1995) was preceded by a particularly bitter
row, caused by the demand of the UK’s Thatcher government that the quota be increased as a pro-portion of the total weight.
6 To be precise: the quota was chosen as the whole number coming as close as possible to 71% of the total weight.
7 In fact, 62 is the whole number closest to 71% of 87.
29/01/2005 23:01 07-21-3 Felsenthal.doc29/01/2005 23:01 07-21-3 Felsenthal.doc

D. Felsenthal and M. Machover: Qualified Majority Voting Explained 577
decisions of the CM? A widely held and apparently self-evident belief is that OPOV is satisfied by making the weights of member-states strictly proportional to their population size. We shall refer to this formula for allocating weights as population–weight proportionality (PWP).
The EU practitioners – the politicians and officials who are responsible for designing the decision rules of the EU – share this belief that the PWP formula is the correct way to implement the OPOV principle in the CM. However, a deci-sion rule whose weights are allocated purely according to PWP would produce a very skewed distribution of voting power: it would give enormous power to the very large member states, leaving very little for the middle-sized ones and mak-ing the very small member-states virtually powerless.8 PWP in its pure form would never be acceptable for a CM decision rule.
In practice the design of all five pre-Nice QMV rules attempted to steer a middle course between the OPOV principle, as the practitioners understand it, and the OSOV principle. This is what was behind the allocation of weights: the weights allocated to the member-states increase with population size; but the in-crease of weight is considerably less steep than would be required by PWP. This is known in Eurospeak as degressive allocation of weights. For example, accord-ing to PWP Spain should get about four times the weight allocated to Belgium or Portugal, in true proportion to population size; on the other hand, OSOV would require all three countries to have the same weight. The weights actually allo-cated were a sort of compromise between the two formulas: Belgium and Portugal had 5 each, and Spain had neither 20 nor 5 but 8. Politically speaking, OSOV clearly benefits the smaller member-states, because it would give them voting power equal to that of the larger member-states. Therefore any shift from OPOV in the direction of OSOV may be regarded as a concession or accommo-dation in favour of the smaller member-states.
4. A widespread fallacy
Unfortunately, the reasoning just described is fallacious. The belief that PWP is the way to implement the OPOV principle in a legislative body such as the CM – plausible as it may seem and widespread as it undoubtedly is – is nevertheless quite erroneous.
There are several reasons why this mistaken belief seems so plausible,9 but the main one is that the idea of fair representation of citizens in the CM tends to be
8 This can be seen even without having a precise idea as to how voting power is to be measured. We shall return to this question later on.
9 For a more detailed discussion, see Ch. 2 of Felsenthal and Machover (2000).
29/01/2005 23:01 07-21-3 Felsenthal.doc
578 Homo Oeconomicus 21(3/4): 573–595 (2004)
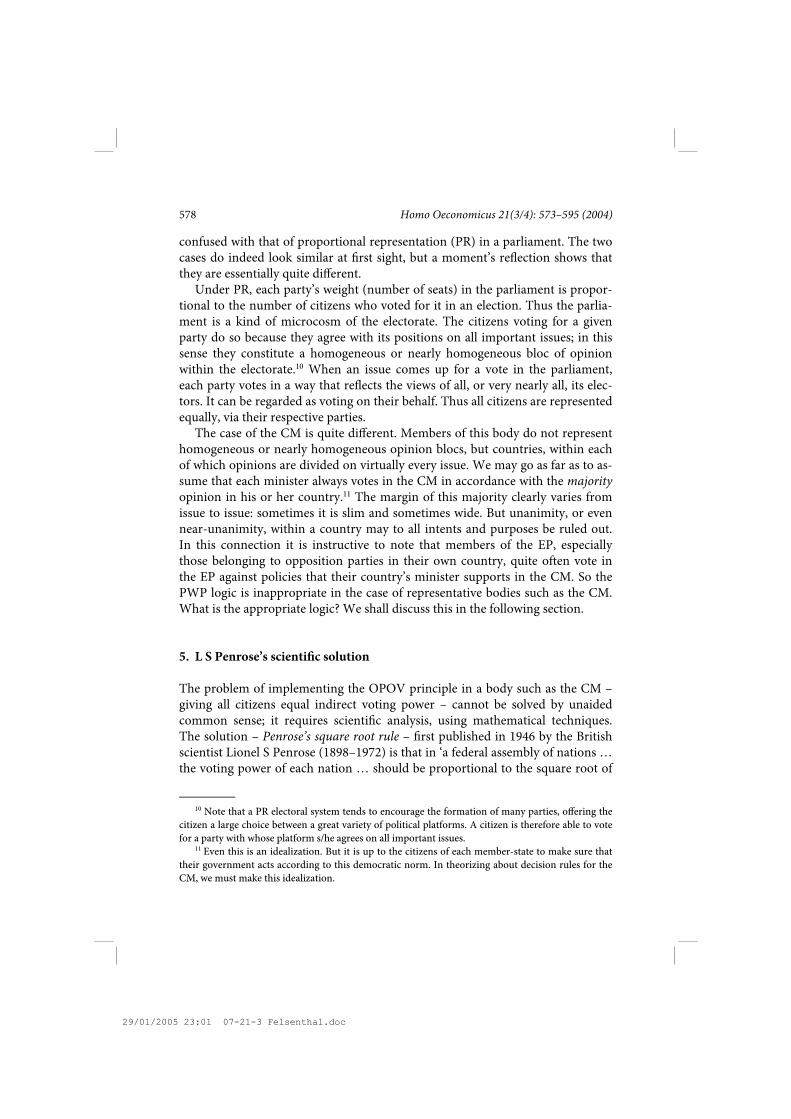
confused with that of proportional representation (PR) in a parliament. The two cases do indeed look similar at first sight, but a moment’s reflection shows that they are essentially quite different.
Under PR, each party’s weight (number of seats) in the parliament is propor-tional to the number of citizens who voted for it in an election. Thus the parlia-ment is a kind of microcosm of the electorate. The citizens voting for a given party do so because they agree with its positions on all important issues; in this sense they constitute a homogeneous or nearly homogeneous bloc of opinion within the electorate.10 When an issue comes up for a vote in the parliament, each party votes in a way that reflects the views of all, or very nearly all, its elec-tors. It can be regarded as voting on their behalf. Thus all citizens are represented equally, via their respective parties.
The case of the CM is quite different. Members of this body do not represent homogeneous or nearly homogeneous opinion blocs, but countries, within each of which opinions are divided on virtually every issue. We may go as far as to as-sume that each minister always votes in the CM in accordance with the majority opinion in his or her country.11 The margin of this majority clearly varies from issue to issue: sometimes it is slim and sometimes wide. But unanimity, or even near-unanimity, within a country may to all intents and purposes be ruled out. In this connection it is instructive to note that members of the EP, especially those belonging to opposition parties in their own country, quite often vote in the EP against policies that their country’s minister supports in the CM. So the PWP logic is inappropriate in the case of representative bodies such as the CM. What is the appropriate logic? We shall discuss this in the following section.
5. L S Penrose’s scientific solution
The problem of implementing the OPOV principle in a body such as the CM – giving all citizens equal indirect voting power – cannot be solved by unaided common sense; it requires scientific analysis, using mathematical techniques. The solution – Penrose’s square root rule – first published in 1946 by the British scientist Lionel S Penrose (1898–1972) is that in ‘a federal assembly of nations … the voting power of each nation … should be proportional to the square root of
10 Note that a PR electoral system tends to encourage the formation of many parties, offering the
citizen a large choice between a great variety of political platforms. A citizen is therefore able to vote for a party with whose platform s/he agrees on all important issues.
11 Even this is an idealization. But it is up to the citizens of each member-state to make sure that their government acts according to this democratic norm. In theorizing about decision rules for the CM, we must make this idealization.
29/01/2005 23:01 07-21-3 Felsenthal.doc29/01/2005 23:01 07-21-3 Felsenthal.doc

D. Felsenthal and M. Machover: Qualified Majority Voting Explained 579
the number of people on each nation’s voting list.’12
Note that Penrose’s rule specifies how voting powers, rather than voting weights, are to be allocated. Contrary to what many people seem to believe, the powers of voters under a weighted decision rule need not in general be propor-tional to their respective weights. To see this you don’t even need to have a pre-cise idea as to how voting power is measured. Consider a three-member com-mittee, in which Alice has weight 5, and Ben and Carol have 2 each. The total weight is 9. If the quota for passing a bill is 5, then Alice has dictatorial power while Ben and Carol have none. If the quota is raised to 8, unanimity is required, so clearly all three voters have equal powers.13
But in order to implement Penrose’s rule we must know how voting power is to be measured. Penrose provided a precise answer: a voter’s power is equal to the probability of that voter being in a position to determine the outcome.
Let us illustrate this by looking at the three-member committee – Alice, Ben and Carol – under two alternative simple decision rules. Instead of the unequal weighting we assumed a moment ago, let us now make the simplest possible weight allocation: each of the three members has weight 1. In the first decision rule we shall consider, the quota will be 3; so this is the unanimity rule. In the second rule the quota will be 2; so this is the simple majority rule, under which a bill passes if at least two of the three members vote for it.
In order to calculate Alice’s voting power, we need to consider all the possible configurations of the votes of the other two members, Ben and Carol. There are four such configurations, which we take to be equally probable:
1. Both Ben and Carol vote ‘yes’.
2. Ben votes ‘yes’ and Carol ‘no’.
3. Ben votes ‘no’ and Carol ‘yes’.
12 Penrose (1946). See also Penrose (1952). The ‘federal assembly of nations’ he was thinking of
was of course not the EU but the newly established UN: at the time, it was widely hoped that the UN would evolve into a kind of world government. For a rigorous proof of Penrose’s square root rule, see Felsenthal and Machover (1998). For a less technical, semi-popular explanation, see Felsenthal and Machover (2000, pp. 22–23). The gist of the argument is that within a large population that makes decisions by simple majority, the voting power of each citizen is inversely proportional to the square root of the population size (rather than to the size itself, as might seem plausible at first sight). Penrose’s rule compensates for this by making the voting power of each representative within the Council proportional to the square root of the population s/he represents, thereby equalizing the indirect voting powers of all the citizens in the two-tier system.
13 For some weight allocation blunders committed in the past by EU practitioners, apparently due to failure to appreciate the disparity between relative power and relative weight, see Felsenthal and Machover (2000, pp. 2–4).
29/01/2005 23:01 07-21-3 Felsenthal.doc

580 Homo Oeconomicus 21(3/4): 573–595 (2004)
4. Both Ben and Carol vote ‘no’.
Under the unanimity rule, a bill is passed just in case all three members vote for it; so in configurations (2), (3) and (4) Alice’s vote cannot make any difference: it is a foregone conclusion that the bill is blocked. But in configuration (1) Alice’s vote makes all the difference: it determines the outcome of the division. So Alice’s voting power is 1/4, because she determines the outcome in one out of the four equally probable configurations.14 Of course, a similar argument shows that under the unanimity rule the voting powers of Ben and Carol are also 1/4 each.
Under the simple majority rule, a bill passes just in case at least two members vote for it. Now Alice’s vote makes no difference in configurations (1) and (4): in the former, the passage of the bill is a foregone conclusion, and in the latter the bill is blocked, no matter what Alice does. But in configurations (2) and (3) Alice’s vote is decisive. So now her voting power is 2/4, which is 1/2. And of course the same applies also to Ben and Carol.
These are simple ‘toy’ examples,15 but they are nevertheless very instructive: they illustrate the vital difference between relative and absolute voting power. Under both decision rules, unanimity and simple majority, all three members have equal voting powers, so in both cases their relative voting powers – their shares in the total power – are 1/3 each. But what many people (including, un-fortunately, EU practitioners) do not realize is that the relative position of voters compared to one another is far from being the whole story. This is because total voting power is not a fixed quantity, but depends on the decision rule. In a three-member committee, the majority rule gives each voter twice as much absolute voting power as the unanimity rule.16
More generally, it can be proved mathematically that, for a committee of any given size, the greatest amount of total absolute voting power is achieved under the simple majority decision rule, and the smallest amount is obtained under the
14 All probabilities referred to here are calculated on an a priori basis. This is because we are con-
cerned with voting power in the constitutional sense: the power that voters derive from the decision rule itself, rather than from their various individual preferences and capacities (such as persuasive skill or diplomatic muscle). For example, if Alice has great persuasive skill, she may be able to make sure that the other two members always vote as she tells them to. This would give her additional actual power, derived from her individual capacity. In constitutional design we must ignore such factors, which are extraneous to the decision rule.
15 As a slightly less simple example, you may wish to consider an asymmetric decision rule, giving Alice weight 5 and Ben and Carol 2 each, and setting the quota at 7. You can verify that Alice’s voting power is 3/4 and that of each of the others is 1/4.
16 The relative voting power of a member – obtained by dividing that member’s absolute voting power by the sum of the absolute voting powers of all members – is commonly known as the Banzhaf index of voting power, after the American lawyer John F Banzhaf, who rediscovered some of Penrose’s results independently in the 1960s.
29/01/2005 23:01 07-21-3 Felsenthal.doc29/01/2005 23:01 07-21-3 Felsenthal.doc

D. Felsenthal and M. Machover: Qualified Majority Voting Explained 581
unanimity rule.17 This immediately raises the question as to why anyone should ever want to
use the unanimity rule. The answer has to do with the concept of blocking power, which we shall discuss later on. But now we must return to our examination of the pre-Nice, Nice and proposed QMV rules.
6. How equitable are the various QMV rules?
As we have seen, voting powers are in general not proportional to voting weights. However, when the number of voters is fairly large and the quota is not too near 100% of the total weight, the discrepancy between relative voting power and relative weight (i.e., the ratio of a member’s weight to the total weight) tends to diminish. Therefore, in the previous 15-member CM – and even more so in a CM of 25 or 27 members – the relative weights approximately reflect the relative voting powers.18
According to Penrose’s rule, an equitable implementation of the OPOV prin-ciple in the CM would require allocating voting powers to member-states in pro-portion to the square root of their respective population size.19 It turns out that – in the case of the prospective EU of around 27 members – if the quota is fixed at a reasonable level (in a sense we shall explain in Section 8) then the weights that satisfy Penrose’s rule are approximately also proportional to the square root of population size. Thus, for example, Spain, whose population is about four times as large as that of Belgium or Portugal should be allocated approximately twice – rather than four times – the weight allocated to each of these two smaller coun-tries.
Allocating weights in the CM according to the PWP formula would not im-plement the OPOV principle, but tends to bias the voting-power distribution systematically by making the power differences between member-states consid-erably larger than they ought to be. Each member-state gets relatively too small a share of power compared to member-states larger than it, and too great a share compared to smaller ones. By the yardstick of OPOV, the PWP formula exagger-ates the effect of population on weight. Detailed analysis shows that this formula would give the six largest members of the EU (Germany, France, UK, Italy, Spain
17 For a proof, see Felsenthal and Machover (1998, pp. 56–59). 18 This is only a rough approximation. To find the exact relative voting powers – and to get any
idea at all about absolute voting powers, which depend crucially on the quota – one must perform quite heavy computations. The results of these are reported in Felsenthal and Machover (2001, 2004).
19 Strictly speaking, the rule says ‘the number of people on each nation’s voting list’. But for practical purposes we may take population size as a proxy for this.
29/01/2005 23:01 07-21-3 Felsenthal.doc

582 Homo Oeconomicus 21(3/4): 573–595 (2004)
and Poland) more than their fair share and all other members less than their fair share; and the smaller the country, the worse is it affected by the PWP formula.20
Needless to say, the PWP formula does even worse, much worse, by the yard-stick of OSOV, because the latter implies that population size should have no effect at all on voting weight. Actually, neither the pre-Nice QMV rule, nor the QMV scheme prescribed by the Treaty of Nice (2001), nor that included in the Draft Constitution proposed by the European Convention (2003) is based exclu-sively on the PWP formula. They all mitigate its effect by modifications moti-vated by the OSOV principle. But they do so in different ways and to different degrees.
6.1 How equitable was the pre-Nice QMV rule?
Let us look first at the 1995 QMV rule. As we saw at the end of Section 3, its de-gressive weighting was an attempt to steer a middle course between allocating equal weights to all member-states, according to the OSOV principle; and the PWP formula, which the practitioners mistakenly believe is an implementation of the OPOV principle. In fact, as we have seen, PWP would not implement OPOV, but distort voting-power distribution to the detriment of the smaller member-states (and of their citizens).
Ironically, the 15-member 1995 QMV rule came fairly close to implementing the OPOV principle. In fact, it ‘overshot’ it to some extent, by granting the small member-states a greater share, and the large ones a smaller share, than pre-scribed by Penrose’s rule. The most extreme cases were Luxembourg, which got more than twice its fair share, and Germany, which got about four fifths of its fair share. (Germany is a very special case, because it was still allocated the same weight as France, UK and Italy, although after its unification its population is much larger than theirs.)
A reasonable compromise between the OPOV and OSOV principles would also modify the OPOV allocation, prescribed by Penrose’s rule, in favour of the smaller member-states. But the pre-Nice QMV rule cannot be regarded as such a compromise, because it distorted the OPOV allocation in a very haphazard un-systematic way.21
Seen purely from an OPOV point of view – in other words, if the aim were to implement this principle without any compromise – the pre-Nice QMV rule ought to have been reformed by allocating considerably more relative voting power to Germany; considerably less to Belgium, Portugal and Ireland; much
20 See Tables 1 and 2 in Felsenthal and Machover (2004). 21 For detailed figures, see Table 4 in Felsenthal and Machover (2001).
29/01/2005 23:01 07-21-3 Felsenthal.doc29/01/2005 23:01 07-21-3 Felsenthal.doc

D. Felsenthal and M. Machover: Qualified Majority Voting Explained 583
less to Luxembourg; and leaving the other members’ shares more or less as they were.
But this is not how the practitioners saw it: believing in the fallacy that PWP is a correct implementation of the OPOV principle, the pre-Nice QMV rule seemed to them a very large step from OPOV in the direction of OSOV, much larger than it really was. Therefore they regarded it as a far-reaching concession to the smaller member-states. To politicians of the larger member-states this concession seemed unacceptably over-generous. Because of this mistaken view, pressure had been building up for a number of years – driven mainly by gov-ernments of the larger member-states – to reform the QMV rule in favour of these members. While this pressure was building up, the prospect of major enlargement of the EU was becoming tangible. The two topics came together at the Nice Conference (December 2000).
6.2 How equitable are the Nice QMV rules?
The Treaty of Nice, signed on 26 February 2001, thoroughly redesigned the QMV rule. The new QMV provisions envisaged two alternative scenarios:
A 15-member scenario, which would apply from the beginning of 2005, if the EU would not have been enlarged by then.
A 27-member scenario, which will apply when 12 prospective new members will join the EU. (The treaty also considers, rather briefly and vaguely, possible intermediate stages, in which only some of the 12 prospective new members will have joined.)22
The Nice QMV rules differed from the previous QMV rules in the following three respects.
First, the degressive weighting was redesigned by allocating to the then exist-ing members new weights (which were to apply under both scenarios), and also assigning weights to the then 12 prospective members.
Second, the quota of this weighted decision rule was raised in the 27-member scenario to nearly 74% of the total weight. (For the 15-member scenario the quota was kept at the old level of about 71%.)
Third, in addition to the usual condition – according to which the adoption of a bill by the CM requires the support of member-states whose total weight equals or exceeds the quota – two further conditions were imposed: those supporting the bill must be a majority of the members, and their population must be at least
22 After the Nice Conference, negotiations with ten of the 12 prospective members were con-cluded, and they joined the EU in May 2004. The other two – Romania and Bulgaria – are scheduled to join in 2007.
29/01/2005 23:01 07-21-3 Felsenthal.doc

584 Homo Oeconomicus 21(3/4): 573–595 (2004)
62% of the total population of the EU. This third change – making QMV a triple majority rule – seems to be the
most far-reaching of the three. It certainly does make QMV formally much more complicated and less transparent. It bears the hallmark of a messy compromise. The population clause is clearly a concession to the larger member-states, but primarily to Germany, whose population is by far the largest in the EU, but whose weight in the new degressive weighting is still the same as that of France, UK and Italy. The ordinary-majority clause is clearly a gesture towards OSOV, and thus meant as a concession to the smaller members.
However, detailed computation shows that the effect of the two additional conditions (62% of total population and ordinary majority of the members) on the members’ voting powers is very small indeed. This is because it transpires that out of the huge number of possible voting configurations (divisions of the CM as between ‘yes’ and ‘no’ voters) there are only very few in which a bill would meet the quota of the degressive weighted rule, but fail to satisfy the two addi-tional conditions.23
The second change made at Nice, raising the quota from the traditional 71% to 74% for the 27-member scenario, seems almost trifling. But in fact it is quite momentous. However, its main effect is not on the equitability of the QMV rule but on another important aspect, which we shall discuss later on.
What about the new weighting? Examination of the new weights allocated to the old 15 members suggests that the changes generally favour the larger mem-bers. Among these, Germany is relatively the least favoured, because its weight (29) remains equal to that of France, UK and Italy; and Spain is the most fa-voured, because its weight (27) is much closer to that of the four larger members than it used to be. But on the whole the changes seem quite moderate and gener-ally benign.
Detailed computations confirm this impression. By the yardstick of Penrose’s rule, Germany’s share of voting power is still too small, and that of Luxembourg too large (as are also those of Cyprus and Malta in the 27-member scenario). But these deviations from equitability are less extreme than the pre-Nice ones. Spain (and in the 27-member scenario also Poland) gets a slightly greater share of vot-ing power than it should. But overall the Nice QMV rules, for both 15-member and 27-member scenarios, are more equitable than the pre-Nice rule.24
29/01/2005 23:01 07-21-3 Felsenthal.doc29/01/2005 23:01 07-21-3 Felsenthal.doc
23 In fact, the condition that in order for a bill to pass it must be supported by a majority of the members is otiose as far as the 15-member scenario is concerned. This is because any group of members that meets the quota of the degressive weighting will automatically also contain a majority of the members. The same also holds for the QMV rules that have been in force from 1973 to 1981 and from 1986 to May 2004.
24 For details, see Felsenthal and Machover (2001, 2004). One strange anomaly is worth noting.

D. Felsenthal and M. Machover: Qualified Majority Voting Explained 585
We shall see later that the Nice rule for an enlarged EU has a severe defect; but this is due to another aspect, which has little to do with equitability.
6.3 How equitable is the QMV scheme proposed by the Convention?
The QMV scheme contained in the Draft Constitution proposed by the Euro-pean Convention makes a complete break with the traditional pattern: it scraps the traditional degressive weighting and instead of it prescribes the two subsidi-ary conditions added in the Nice Treaty, but with the population quota reduced from 62% to 60%. Thus the proposed QMV scheme is that in order for a bill to be adopted by the CM it must have the support of a majority of the member-states, whose population is at least 60% of the total population of the EU.
This double majority rule is clearly meant to be a compromise between OPOV and OSOV. But instead of trying to do this by means of degressive weighting, as has been done so far, the Convention’s QMV scheme conjoins a pure PWP rule and a pure ordinary majority rule. The former is widely (but, as we have seen, falsely) believed to implement OPOV; the latter, if used by itself, would certainly implement OSOV.
Indeed, our calculations show that under the proposed QMV scheme, the relative voting powers of all members are intermediate between their respective shares of the total EU population and equal shares for all (that is, 1/25 in a 25-member scenario; or 1/27 in a 27-member scenario). As a result, the larger member-states – Germany, France, UK, Italy, Spain, Poland and in the 27-mem-ber scenario also Romania – would have relative voting power smaller than their respective shares of the EU population; whereas all the remaining members – from the Netherlands down to Malta – would have relative voting powers in ex-cess of their respective shares of EU population.
But by the scientific yardstick of Penrose’s rule the proposed scheme is very unsatisfactory. The distribution of voting power to which it gives rise has the following features.25
(i) The relative voting powers of the four largest members – Germany, France, UK and Italy – are greater, and in the case of Germany much greater, than justified by the OPOV principle.
(ii) The relative voting powers of the six smallest members – Latvia, Slovenia, The Netherlands is in an intermediate position. By the yardstick of Penrose’s rule it was the smallest of the large members, whose pre-Nice share of voting power was slightly smaller than it ought to be. But by the false PWP criterion it was the largest of the smaller members, and had ‘too much’ power. Consequently it got a raw deal at the Nice Conference.
25 For detailed figures, see Tables 3 and 4 in Felsenthal and Machover (2004).
29/01/2005 23:01 07-21-3 Felsenthal.doc

586 Homo Oeconomicus 21(3/4): 573–595 (2004)
Estonia, Cyprus, Luxembourg and Malta – are also greater, and in the case of the last four much greater, than justified by the OPOV principle.
(iii) The relative voting powers of all the members in the intermediate range – from Spain down to Lithuania – fall short of what they ought to get according to OPOV.
Thus, judged purely by the OPOV principle, the proposed scheme is quite bad. Viewed as a would-be compromise between OPOV and OSOV it is even worse. This is because (i) is the exact opposite of what ought to happen under such a compromise. The same applies to (iii), at least as far as most members of this group – say from Romania or the Netherlands down to Lithuania – are con-cerned. Only (ii) goes in the right direction, but possibly undershoots.26 In either case, the proposed scheme is quite unfair, as it assigns too much relative voting power to the four largest members, especially to Germany.
A similar picture emerges if we compare the proposed scheme to what was agreed at Nice rather than measuring it by a theoretical yardstick of fairness: the four largest and six smallest members would get a larger – and in the case of Germany and Malta much larger – relative share of voting power than was de-cided at Nice; whereas all other members would get a smaller share.27
The largest members of this intermediate group are Spain and Poland. This explains their vehement opposition to the Draft Constitution, which was the chief reason for the breakdown of the December 2003 Brussels Summit. How-ever, it must be said that other members of the intermediate groups – especially Greece, Portugal, Belgium, the Czech Republic and Hungary – have considerably greater reason to complain about the proposed scheme, which reduces their relative power (in comparison with the Nice rules) to an even greater extent.
7. Blocking power and resistance
Penrose’s measure of absolute voting power quantifies a voter’s constitutional ability (that is, ability derived solely from the decision rule) to help secure a fa-vourable outcome in a division. This can be resolved into two component parts: the power to help secure a positive outcome, approval of an act that the voter supports; and the power to help secure a negative outcome, blocking of an act that the voter opposes. From a disinterested scientific viewpoint these two com-ponents are equally important. But politicians representing their states at the EU
26 Whether it does undershoot, and if so by how much, depends on the relative importance one
wishes to assign to OSOV. 27 See Tables 7 and 8 in Felsenthal and Machover (2004).
29/01/2005 23:01 07-21-3 Felsenthal.doc29/01/2005 23:01 07-21-3 Felsenthal.doc

D. Felsenthal and M. Machover: Qualified Majority Voting Explained 587
view things quite differently: they tend to attach much greater value to negative (blocking) power than to the positive kind. The main reason for this is that fail-ing to block an act that s/he opposes is for a politician far more embarrassing – and damaging in domestic electoral terms – than failing to push through an act that s/he supports. Insiders’ reports make it abundantly clear that politicians rep-resenting their countries at the EU are very determined in preserving and in-creasing their respective blocking powers. The fact that they have no clear idea as to how to measure this negative power does not make them any less determined. On the contrary: it seems to exacerbate their aversion to the risk of having insufficient blocking power, driving them to greater extremes in pursuing it.
A scientific measure of blocking power is due to Coleman (1971): a member’s blocking power is obtained by assuming as given that a bill is about to be adopted, and then calculating the probability that the member in question is in a position to prevent the bill’s adoption by changing his or her vote at the last moment from ‘yes’ to ‘no’. Let us illustrate this using the toy example of the three-member committee of Alice, Ben and Carol.
Under the unanimity rule, there is just one configuration under which a bill is going to be adopted: that in which all three members vote ‘yes’. Assuming that they are in this position, Alice can with certainty – that is, with probability equal to 1 – prevent adoption of the bill by defecting and voting ‘no’. So her blocking power is 1. (Of course, a similar argument proves that the blocking powers of Ben and Carol are also 1.)
Under the ordinary majority rule, there are four configurations under which a bill is going to be adopted:
1. Alice, Ben and Carol all vote ‘yes’.
2. Alice and Ben vote ‘yes’ and Carol votes ‘no’.
3. Alice and Carol vote ‘yes’ and Ben votes ‘no’.
4. Alice votes ‘no’ and Ben and Carol vote ‘yes’.
In two of these four configuration, namely (2) and (3), Alice is in a position to change the outcome by changing her mind. So her blocking power is 2/4, that is 1/2. (Of course, the same goes for the other two members.)
So under the majority rule Alice has only half as much blocking power as under the unanimity rule; although – as we saw in Section 5 – under the former rule her voting power is double of what she has under the latter.
If Alice is a politician with an acute sense of domestic insecurity, and mistrust of Ben and Carol (perhaps because they are foreigners…), she may well prefer the unanimity rule. Of course, the price she will pay for this is having reduced
29/01/2005 23:01 07-21-3 Felsenthal.doc

588 Homo Oeconomicus 21(3/4): 573–595 (2004)
overall voting power, and a very much smaller ability to secure approval of bills she supports.28
For a three-member committee the choice of decision rules is very limited, but with a larger number of voters, as in the CM, there are a huge number of weighted decision rules. Roughly speaking, the allocation of weights affects mainly the distribution of relative voting powers, whereas the choice of quota affects mainly the absolute level of voting power of each member and the balance between its two components.29
The government of each member-state is of course keen to increase its own relative voting power in the CM. As we have noted, politicians do not calculate voting power in a scientific way, but use voting weights as a rough proxy for comparing voting powers. So each member-state would like to push its weight as high as possible. But its scope for doing so is quite constrained: a firmly estab-lished – and democratically justified – principle of the EU prevents allocating weights in reverse order of population size. Thus, for example, Spain cannot be allocated smaller weight than Poland, nor can it demand greater weight than Italy. This still leaves room for much bickering, but possible achievements are limited, especially because any decision rule, being a constitutional matter, must be approved unanimously by all EU members.
At the same time, governments are generally reluctant to allow any reduction of their blocking powers, and the more Eurosceptic ones attempt to increase theirs. The way they do so is by keeping a high quota and making occasional at-tempts to raise it. Other things being equal, increasing the quota of weights needed to pass a bill tends to increase every member’s blocking powers. Unfor-tunately, this also tends to diminish its absolute voting power, because of a re-duction in the positive component.
The overall effect of a high quota is that it makes it harder for the CM to pass bills. Here it may be objected that the CM rarely if ever blocks a bill in a formal vote. Normally a bill is adopted by apparent consensus, with those who are against it abstaining (which is a face-saving way of having the same real effect as voting ‘no’). But this apparent prevalent consensus is possible only due to a proc-ess that takes place behind the scenes, in which the proposed bill is modified and fine-tuned by the efforts of the European Commission and through diplomatic
28 Coleman defined a measure of the positive component of voting power (‘the power to initiate
action’) in an analogous way to the negative, blocking component. The Penrose measure of a voter’s absolute voting power is a kind of average of these two Coleman measures (it is in fact what mathe-maticians call their harmonic mean).
29 Note the qualification ‘roughly speaking’. To be precise, the allocation of weights and choice of quota interact in a complex way in determining the voting powers of the members. For a study that isolates the effect of the quota, see Leech and Machover (2003).
29/01/2005 23:01 07-21-3 Felsenthal.doc29/01/2005 23:01 07-21-3 Felsenthal.doc

D. Felsenthal and M. Machover: Qualified Majority Voting Explained 589
negotiations between governments. This process, sometimes quite lengthy, amounts in effect to a series of unofficial shadow votes, in which earlier versions of the bill are discarded. A high quota would tend to make this process longer and more arduous. There would be a high resistance to changes in the status quo. A very high quota would tend to create very great resistance: immobility or near-paralysis. All this is a matter of sound common sense.
What is not so obvious to common sense, but requires some mathematical analysis, is the way resistance is affected by enlargement of the EU. Everyone can see that as the number of members increases, unanimity among them is harder to achieve.30 What most people – including EU practitioners – fail to realize is that a similar thing happens if the quota is kept fixed as a percentage of the total weight, at any level above 50%: as the number of members increases, achieving the quota becomes less probable. In betting terms, the odds against achieving the quota become longer. We can use these odds as a measure of the resistance of the decision rule: the degree to which it is biased against passing bills and in favour of blocking them.
As we noted in Section 2, from the beginning of the Union, through its first four successive enlargements, the quota had been kept virtually fixed at ap-proximately 71% of the total weight. This was done in the false belief that peg-ging the quota in this way keeps things steady. In fact, the odds against achieving the 71% quota kept creeping up with each enlargement. But at first it was not noticed, because in the first few years of the Union the QMV rule was not ap-plied in practice and all decisions were taken unanimously. Later, the growing difficulty of achieving the 71% quota was felt, but the reason for it was not un-derstood; and in any case skilful diplomacy often managed to mask it.
An instructive episode is the row that erupted just before the 1995 enlarge-ment. The UK government, headed by Margaret Thatcher, demanded that the blocking threshold – the total weight required to block a bill – be kept at its pre-enlargement level of 23. The UK argued that this would keep things steady, as they were before the enlargement. This was an outrageous argument: the acces-sion of new members was going to increase the total weight of CM members, so keeping the blocking threshold at the old level of 23 would increase the quota from its old level of approximately 71% to nearly 75% of total weight!31 Politi-cians of the other member-states objected to the UK’s demand, and argued that in order to keep things as they were, the quota should be kept at 71% of the total
30 In fact, the odds against unanimity increase exponentially with the number of members. See
footnote 4. 31 Before the 1995 enlargement, the total weight was 76 and the quota was 54. After the enlarge-
ment, with the accession of Sweden, Austria and Finland, the total weight was 87. A blocking threshold of 23 would mean a quota of 65, which is 74.71% of 87.
29/01/2005 23:01 07-21-3 Felsenthal.doc

590 Homo Oeconomicus 21(3/4): 573–595 (2004)
weight.32 But they too were mistaken. In fact, our calculations show that keeping the quota pegged at 71% actually increased the resistance of the QMV rule: from the pre-1995 odds of about 9 to 1 against passing a bill, the odds lengthened to just under 12 to 1 following the enlargement.33 Of course, giving in to the Thatcher government’s demand would have made things even worse.
Now let us turn to the QMV provisions of the Nice Treaty. As we saw in Sub-section 6.2, the QMV rules it prescribed for the 15-member scenario as well as for the 27-member scenario are more equitable than the pre-Nice QMV rule. Our calculations show that the Nice rule for the 15-member scenario is also less resistant than the 1995 rule: it shortens the odds against passage of a bill from 12:1 to about 11:1.34
However, the prospect presented by the Nice QMV rule for the 27-member scenario is very dire: it lengthens the odds against passage of a bill from 12:1 to 49:1. (At the intermediate 25-member stage, the odds will be about 27:1.) This is an unprecedented massive increase in resistance. Even keeping the quota pegged at its previous level of 71% of total weight would result, in a greatly enlarged EU, in increased resistance; but the Nice Treaty actually increased the quota to nearly 74% of the total weight.35 This was no doubt caused by the wish of all EU govern-ments to keep their blocking powers high, and the drive of some governments to increase theirs – coupled with innumerate ignorance. Unable to calculate scien-tifically the consequence of the rules they adopt, they grossly overshot.
We repeat here the warning we voiced in 2001: if the QMV provisions of the Treaty of Nice are not amended before the EU is enlarged, the CM is likely to get bogged down in immobilism, and pose a serious threat to the functioning of the EU. The snag is that amending these provisions now requires consensus among the 25 states. The breakdown of the December 2003 Brussels Summit Conference of these 25 states illustrates the great difficulty of arriving at such a consensus.
Let us now consider the QMV scheme of the Draft Constitution proposed by the European Convention (which failed to be adopted by the Brussels Summit). We saw in Subsection 6.3 that this scheme is quite inequitable. However, in terms of resistance this scheme would reverse the dangerous historical trend,
32 The row was resolved by the Ioannina Compromise, which kept the quota pegged at 71% but
gave the UK some (largely face-saving) concessions. 33 See Felsenthal and Machover (2001, p. 457). 34 For the odds reported here and in the sequel, see Table 9 in Felsenthal and Machover (2004).
The table gives, for each of the rules under consideration, the a priori probability A of a bill being passed. To get the corresponding odds, divide 1 – A by A.
35As noted in footnote 1, the Treaty is ‘ambiguous’ on this point. Another version of the QMV rule for the 27-member scenario – which was left in the final text apparently due to an oversight, despite being superseded by a later version adopted at the last moment – imposes a still higher quota of nearly 75%. This version would lengthen the odds against passing a bill to a staggering 60:1.
29/01/2005 23:01 07-21-3 Felsenthal.doc29/01/2005 23:01 07-21-3 Felsenthal.doc

D. Felsenthal and M. Machover: Qualified Majority Voting Explained 591
followed to excess at Nice, of raising the resistance with each enlargement. The proposed scheme would result in odds of about 17:5 against passage of a bill in the 25-member scenario, and about 7:2 in the 27-member scenario. These odds are shorter than at any previous period of the Union. In this respect the pro-posed scheme goes in the right direction, but may have taken it a little too far.
The far-reaching reduction of resistance (in comparison with the Nice QMV rule) is achieved by a great loss of blocking power by all member-states, but in an extremely uneven way: the middle-sized members lose much more than the four largest and six smallest members. As a result, governments – particularly those of the middle-sized states – may too often be unable to help block a bill that they dislike. This may well lead to resentment and exacerbate hostility to the Union in these countries.
It should also be noted that an excessively low resistance in a federal structure is not desirable from a democratic viewpoint. The status quo should be some-what privileged: changing it should not be made too easy for slim majorities against the wishes of large minorities.
8. What do we propose?
As we observed in Section 2, a rational architecture of EU decision-making would be a bi-cameral arrangement, in which the CM would operate purely on an OSOV basis, leaving the representation of the EU peoples to the European Parliament, elected by a system of proportional representation.
But short of such an arrangement, if the decision rule of the CM must be weighted according to population, then in our opinion a near-ideal decision rule would be something along the following lines: allocate weights to member states in proportion to the square root of their respective populations; and set the quota, for the 27-member scenario, at 60% of the total weight.36 Our calculations show that this decision rule is almost perfectly equitable by the yardstick of Penrose’s rule. Its resistance is quite low, although slightly higher than that of the scheme of the Draft Constitution: the odds against passage of a bill are approxi-mately 4:1. These odds are slightly longer than they were during the first period of the Union (25:7), but somewhat shorter than following the first enlargement, in the period from 1973 to 1980 (approximately 6:1).
36 This is the benchmark Rule B whose details are presented in Felsenthal and Machover (2000,
2001, 2004).
29/01/2005 23:01 07-21-3 Felsenthal.doc

592 Homo Oeconomicus 21(3/4): 573–595 (2004)
Addendum
One of the referees, who identified himself as Mika Widgrén, criticized our pro-posed square-root based rule, and offered a modified solution, which combines the OPOV and OSOV principles:
The variance of square-rooted populations is still considerable. In EU27, [the] seven biggest nations can form an absolute majority and [the] 13 biggest nations have 73 per cent majority if voting weights are proportional to square-rooted populations. In short, a minority of member-states can pass proposals even at rather high quotas.
This drawback has, however, a very straightforward solution. By switching the nature of the proposal from weighted voting into a dual majority scheme, one can prevent minorities of member states to pass proposals. The rule would then define thresholds for the square-rooted populations’ share and the number of member states ….
We have performed the voting power calculations for this compromise pro-posal, using 60% as quota for the square-root based weights, but with an added requirement that a proposed act must be supported by a majority of member-states (that is, 14 in the 27-member scenario). It turns out that – as one would expect – the equitability of this dual-majority rule, as judged purely by the OPOV yardstick, is diminished; however, the change is a minor one. Similarly, the added majority-of-members clause increases the resistance; but again the change is small. So, if the proposed compromise solution would indeed help to win greater support of the small and medium-sized member-states as compared to our purely square-root based solution, we would regard it as reasonable.
While this paper was being revised, the EU’s Inter-Governmental Conference that convened in Brussels adopted on 18 June 2004 a new QMV rule for the CM, effective from 1 November 2009 provided it is ratified by all EU member-states.
This rule stipulates that when the CM is acting on a proposal from the Com-mission or from the Union Minister for Foreign Affairs – which is the normal situation – then:
A qualified majority shall be defined as at least 55% of the members of the Council, comprising at least fifteen of them and representing Member States comprising at least 65% of the population of the Union.
A blocking minority must include at least four Council members, failing which the qualified majority shall be deemed attained.
For the 27-member scenario, this can be stated more simply: a bill proposed by the Commission or the Union Minister for Foreign Affairs will be passed if it is supported by at least 15 member-states whose population comprises at least
29/01/2005 23:01 07-21-3 Felsenthal.doc29/01/2005 23:01 07-21-3 Felsenthal.doc

D. Felsenthal and M. Machover: Qualified Majority Voting Explained 593
Table A1 Summary
Rule Distortion % Odds MMD
EU-15 5.19 12:1 5519 Nice-25 4.47 27:1 7189 Nice-27 4.82 49:1 7937 Convention-25 8.20 17:5 3565 Convention-27 8.71 7:2 3761 Brussels-27 7.56 27:4 5223 B-27 0.25 4:1 3882 B-27+Majority 2.45 21:5 3997
65% of the population of the Union; or by at least 24 member-states (irrespective of population).37
Here we only include a summary of this rule in Table A1. In this table, EU-15 is the decision rule of the CM during the EU’s 15-member period, which ended on 30 April 2004. Nice-25 and Nice-27 are the decision rules prescribed in the Nice Treaty for the 25-member and the prospective 27-member scenarios, respectively. Similarly, Convention-25 and Convention-27 are the decision rules proposed by the Draft Constitution. Brussels-27 is the rule adopted in the June 2004 Brussels IGC, as it applies to the 27-member scenario. B-27 is our benchmark rule (see footnote 36) for the 27-member scenario. B-27+Majority is the same rule with the added majority-of-members requirement.
The column headed ‘Distortion’ gives the values, in percentage terms, of the Loosemore and Hanby index of distortion, which we use to measure the disparity between the distribution of relative voting power among member-states under the decision rule in question and what would have been an equitable distribution (according to Penrose’s square-root rule). The greater the value of this index, the less equitable is the distribution of voting power.
The column headed ‘Odds’ gives the resistance of the rule in question in terms of the a priori odds against a proposed act being approved rather than blocked.
‘MMD’ stands for ‘mean majority deficit’. Under any decision rule for the CM, it is always possible that, although each minister votes according to the majority opinion in his or her country, the outcome goes against the majority opinion of the EU’s citizens at large: the CM may approve an act of which a ma-jority of EU citizens disapproves; or, conversely, an act supported by a majority of EU citizens may be blocked by the CM. When this occurs, the margin by
37 Readers interested in an analysis of this rule should consult our paper, ‘Analysis of QM rules adopted by the EU Inter-Governmental Conference, Brussels, 18 June 2004’. It can be downloaded from http://www.lse.ac.uk/Depts/cpnss/projects/vp.html.
29/01/2005 23:01 07-21-3 Felsenthal.doc

594 Homo Oeconomicus 21(3/4): 573–595 (2004)
which the majority camp of citizens opposing the outcome exceeds the minority camp that supports it is, by definition, the majority deficit of the outcome in question. (In cases where the outcome is supported by a majority of citizens, the majority deficit is 0.) The MMD is the mean value (the statistical average) of the majority deficit. It depends on the decision rule, and is a measure of the disparity between that rule and direct-democracy at-large majority rule.
Acknowledgments
An earlier version of this article was originally published on the Internet as Issue Paper No. 10 of the European Policy Centre (‘an independent, not-for-profit, think-tank, committed to making European integration work’ <http://www.theepc.net/>). As it was written for a non-academic readership, it does not attempt to follow the normal practices of academic papers: it does not contain any novel research results, nor does it present a comprehensive survey of the field, covering the various views that have been expressed by other re-searches. As mentioned in the Introduction, its aim was simply to explain to an interested general reader the topical problems of the decision-making system of the European Union’s Council of Ministers, to outline in non-technical language our own previous research on the subject, and propose what seems to us the best solution. But later, after consulting with one of the editors of Homo Oeconomicus, we decided to publish our article in print in this academic journal, whose readership includes many who are not experts in our field, but may be interested in the hot issues covered by us. We have made no essential changes in the original text, but – in response to suggestions by the reviewers and the editor – we have appended an Addendum as well as a summarizing table, with ex-planatory notes.
References
Coleman, J.S. (1971), ‘Control of collectivities and the power of a collectivity to act’, in: B. Lieberman (ed.), Social Choice, New York: Gordon and Breach.
European Convention (2003), Draft Treaty Establishing a Constitution for Europe, adopted by consensus by the European Convention on 13 June and 10 July 2003, submitted to the President of the European Council in Rome, 18 July 2003; EU document CONV 850/03.
Felsenthal, D.S. and M. Machover (1998), The Measurement of Voting Power: Theory and Practice, Problems and Paradoxes, Cheltenham: Edward Elgar
Felsenthal, D.S. and M. Machover (2000), Enlargement of the EU and Weighted Voting in its Council of Ministers, London: London School of Economics and Political Science,
29/01/2005 23:01 07-21-3 Felsenthal.doc29/01/2005 23:01 07-21-3 Felsenthal.doc

D. Felsenthal and M. Machover: Qualified Majority Voting Explained 595
Centre for Philosophy of Natural and Social Science. Felsenthal, D.S. and M. Machover (2001), ‘The Treaty of Nice and qualified majority vot-
ing’, Social Choice and Welfare, 18, pp. 431–464.* Felsenthal, D.S. and M. Machover (2004), ‘Analysis of QM Rules in the Draft Constitution
for Europe Proposed by the European Convention, 2003’, Social Choice and Welfare, 23, pp. 1–20.
Galloway, D. (2001), The Treaty of Nice and Beyond: Realities and Illusions of Power in the EU, Sheffield: Sheffield Academic Press.
Leech, D. and M. Machover (2003), ‘Qualified majority voting: The effect of the quota’, in: M.J. Holler, H. Kliemt, D. Schmidtchen, and M.E. Streit (eds), European Governance (Jahrbucg für Neue Politische Ökonomie, vol. 22). Mohr Siebeck: Tübingen. pp. 127–143.
Penrose, L.S. (1946), ‘The elementary statistics of majority voting’, Journal of the Royal Statistical Society, 109, pp. 53–57.
Penrose, L.S (1952), On the Objective Study of Crowd Behaviour, London: H. K. Lewis & Co.
Treaty of Nice (2001), Treaty of Nice amending the Treaty on European Union, the Treaties establishing the European Communities and certain related Acts. Signed 26 February 2001. EU document CONFER 4820/00.
29/01/2005 23:01 07-21-3 Felsenthal.doc
View publication statsView publication stats


![Chapter 2 Review Name: Class Pd. Chapter 2 Weighted Voting ... · Chapter 2 Weighted Voting Systems: ... In the weighted voting system [q: 30, 29, 16, 8, 3, 1] a two-thirds majority](https://static.fdocuments.in/doc/165x107/5abfcb967f8b9aa15e8e7214/chapter-2-review-name-class-pd-chapter-2-weighted-voting-2-weighted-voting.jpg)