Qualification of Fiscal Liquid Ultrasonic Meter for ... · Fiscal batch metering of the export to...
21
31 st North Sea Flow Measurement Workshop 2013 Page 1 of 21 Qualification of Fiscal Liquid Ultrasonic Meter for Operation on Extended Viscosity Range Øyvind Nesse and Tore Bratten Statoil
-
Upload
vuongnguyet -
Category
Documents
-
view
225 -
download
2
Transcript of Qualification of Fiscal Liquid Ultrasonic Meter for ... · Fiscal batch metering of the export to...

31st North Sea Flow Measurement Workshop 2013 Page 1 of 21
Qualification of Fiscal Liquid Ultrasonic Meter for
Operation on Extended Viscosity Range
Øyvind Nesse and Tore Bratten
Statoil
Qualification of Fiscal Liquid Ultrasonic Meters for Operation on Extended Viscosity Range
31st North Sea Flow Measurement Workshop 2013 Page 2 of 21
Contents 1 Introduction .................................................................................................................................................... 3
2 Background .................................................................................................................................................... 3
3 Technology Qualification Program in Statoil .............................................................................................. 5
3.1 Introduction to Technology Readiness Level ................................................................................................... 7
3.2 Technology Readiness Level for ultrasonic liquid meter ................................................................................. 7
4 Technology Qualification Activities and Acceptance Criteria ................................................................... 7
5 Semantics ....................................................................................................................................................... 8
6 Test of 12’’ultrasonic 5 paths reduced bore meter................................................................................... 10
7 Test of 8 paths full bore meter ................................................................................................................... 15
8 Test of 6 path full bore meter ..................................................................................................................... 19
9 Summary ...................................................................................................................................................... 20
Qualification of Fiscal Liquid Ultrasonic Meters for Operation on Extended Viscosity Range
31st North Sea Flow Measurement Workshop 2013 Page 3 of 21
1 Introduction
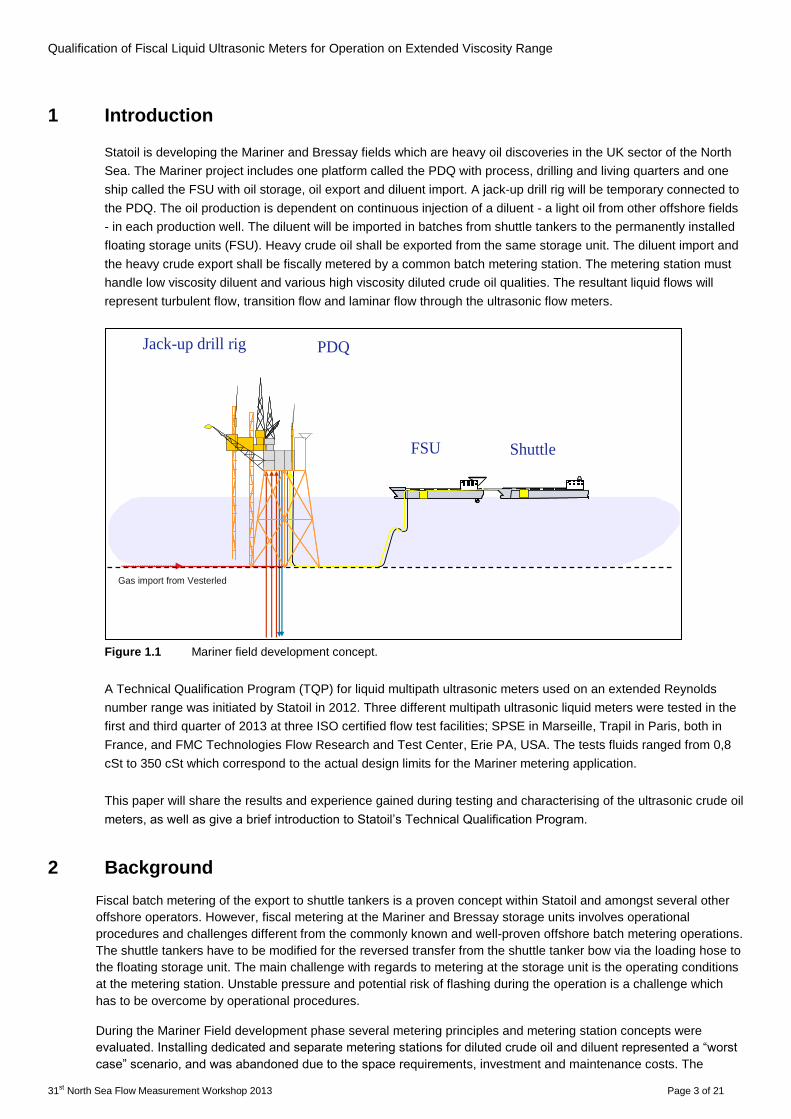
Statoil is developing the Mariner and Bressay fields which are heavy oil discoveries in the UK sector of the North
Sea. The Mariner project includes one platform called the PDQ with process, drilling and living quarters and one
ship called the FSU with oil storage, oil export and diluent import. A jack-up drill rig will be temporary connected to
the PDQ. The oil production is dependent on continuous injection of a diluent - a light oil from other offshore fields
- in each production well. The diluent will be imported in batches from shuttle tankers to the permanently installed
floating storage units (FSU). Heavy crude oil shall be exported from the same storage unit. The diluent import and
the heavy crude export shall be fiscally metered by a common batch metering station. The metering station must
handle low viscosity diluent and various high viscosity diluted crude oil qualities. The resultant liquid flows will
represent turbulent flow, transition flow and laminar flow through the ultrasonic flow meters.
Figure 1.1 Mariner field development concept.
A Technical Qualification Program (TQP) for liquid multipath ultrasonic meters used on an extended Reynolds
number range was initiated by Statoil in 2012. Three different multipath ultrasonic liquid meters were tested in the
first and third quarter of 2013 at three ISO certified flow test facilities; SPSE in Marseille, Trapil in Paris, both in
France, and FMC Technologies Flow Research and Test Center, Erie PA, USA. The tests fluids ranged from 0,8
cSt to 350 cSt which correspond to the actual design limits for the Mariner metering application.
This paper will share the results and experience gained during testing and characterising of the ultrasonic crude oil
meters, as well as give a brief introduction to Statoil’s Technical Qualification Program.
2 Background
Fiscal batch metering of the export to shuttle tankers is a proven concept within Statoil and amongst several other
offshore operators. However, fiscal metering at the Mariner and Bressay storage units involves operational
procedures and challenges different from the commonly known and well-proven offshore batch metering operations.
The shuttle tankers have to be modified for the reversed transfer from the shuttle tanker bow via the loading hose to
the floating storage unit. The main challenge with regards to metering at the storage unit is the operating conditions
at the metering station. Unstable pressure and potential risk of flashing during the operation is a challenge which
has to be overcome by operational procedures.
During the Mariner Field development phase several metering principles and metering station concepts were
evaluated. Installing dedicated and separate metering stations for diluted crude oil and diluent represented a “worst
case” scenario, and was abandoned due to the space requirements, investment and maintenance costs. The
PDQ
FSU Shuttle
Gas import from Vesterled
Jack-up drill rig

Qualification of Fiscal Liquid Ultrasonic Meters for Operation on Extended Viscosity Range
31st North Sea Flow Measurement Workshop 2013 Page 4 of 21
concept chosen was a common fiscal/custody transfer batch metering system for diluted crude and diluent using
ultrasonic flow meters in combination with a bi-directional prover. The flow capacity of the metering system shall be
7000 m3/h for export diluted crude from storage tanks to Shuttle Tanker, and 8000 m3/h for import of diluent from
Shuttle Tanker. The Mariner metering design data are given in Table 2.1 and 2.2
Table 2.1 Mariner export fiscal metering design data per meter run.
Minimum Maximum Units
Requested Flow 300 1750 m3/h
Pressure 10 12 Barg
Temperature 40 50 °C
Density 930 985 kg/m3
Viscosity 200 350 cSt
Reynolds number (12’’ pipe)
1000 10 000
Table 2.2 Mariner import fiscal metering design data per meter run.
Minimum Maximum Units
Requested Flow 300 2000 m3/h
Pressure 4 5 Barg
Temperature 20 55 °C
Density 700 854 kg/m3
Viscosity 0.8 1,5 cSt
Reynolds number (12’’ pipe)
250 000 3000 000
Statoil has gained considerable experience using ultrasonic flow meters in fiscal liquid metering systems, but not on
any application similar to the ones at Mariner Floating Storage Unit (FSU). Furthermore, Statoil has with varying
success experienced the challenge of using ultrasonic meters with velocity profile correction in the transmission
area between laminar and turbulent flow. An example is from the New Oseberg Blend metering station where there
was a large deviation between the K-factors achieved under the calibration at TRAPIL and the first 1.5 years in
operation, see Fig. 2.1.
Figure 2.1 Ultrasonic liquid meter with velocity profile correction.
The calibration in Trapil was performed on a fluid with viscosity of 4.72 cSt, while at operational conditions the
viscosity is approximately 200 cSt. The K-factor achieved in TRAPIL was 5712 [pulses/m3]. The average K-factor
achieved in operation was 6040.8 [pulses/m3]. It is worth noting that if the K-factor achieved under the calibration
at Trapil calibration facility had been used during operation, a systematic error of approximately 5% would have
NOB - USM 1
Before adjusting path weights
-6.00
-4.00
-2.00
0.00
2.00
4.00
6.00
sep. 02 mai. 05 feb. 08 nov. 10
Date
KJ
-fa
cto
r %
Dif
fere
nc
e f
rom
av
era
ge
K-factor Difference from
average
AVG + 2 St dev = +1.63%
AVG - 2 St dev =-1.63%
Profile correction on
Trapil calibration
Qualification of Fiscal Liquid Ultrasonic Meters for Operation on Extended Viscosity Range
31st North Sea Flow Measurement Workshop 2013 Page 5 of 21
been the result. Optimisations of the meters were then performed ref: “Experience with ultrasonic meters on high
viscosity oil” [2] presented by Øyvind Nesse at the North Sea Flow Measurement Workshop in Tønsberg 2007.
However, testing and optimisation in the field shall be minimised because of its inherent risk and cost. The fiscal
liquid meters for Mariner must go through a technology qualification program before installation. The ultrasonic
meters must be tested over an extended Reynolds number range and with different liquids reflecting the design
parameters in Tables 2.1-2.2.
3 Technology Qualification Program in Statoil
Statoil proven technology: Documented track record for a defined environment, operating window and fluid, with
respect to the ability of the technology to meet the specified requirements. In general, a technology shall have a
successful or acceptable track record from Statoil portfolio in order to be classified as proven.
New technology in Statoil is a technology that is not proven according to the definition above. This also implies
that the first application of proven technology in a new environment or an unproven technology in a known
environment, are both by definition new technology, which must go through a technology qualification program
before integration into intended operating system.
All technology elements within the new technical solution shall be classified according to a Technology
Assessment based on:
1. No new technical uncertainties
2. New technical uncertainties
3. New technical challenges
4. Demanding new technical challenges
This classification can be used for the totality of the application of the technical solution, as well as parts of it,
functionality and part systems. Establishment of classification category is based on degree of new technology and
application area, as shown in the following matrix:
Table 3.1 Classification categories
Application area Technology Maturity
Proven Limited field history New or unproven
Previous experience 1 2 3
No experience in Statoil 2 3 4
No industry experience 2 4 4
All new technologies in Statoil shall be approved according to this procedure.
Some ultrasonic flow meter manufacturers would claim their liquid flow meter is ready for accurate measurement
on an extended Reynolds number range. Statoil has yet to verify this statement. In other words, we need to test
ultrasonic liquid flow meter with increasing Reynolds number. Table 3.2 summarizes the Technology Assessment
for Ultrasonic liquid flow meters.

Qualification of Fiscal Liquid Ultrasonic Meters for Operation on Extended Viscosity Range
31st North Sea Flow Measurement Workshop 2013 Page 6 of 21
Table 3.2 Classification of ultrasonic liquid meter
Item
Application Area (AA) Technology Maturity (TM)
Cat
Remark
Prev
exp.
No exp.
Statoil
No
industr.
exp.
Proven Limited
history
New/
Unproven
Design
Manufacture
Installation
X X 1
AA: Ultrasonic liquid flow meters
are widely used in Statoil on oil
flow.
TM: There are several
manufacturers with decades of
experience. The uncertainty of
ultrasonic liquid meters is traceable
to accredited laboratories.
Extended
Reynolds
number
range
X X 3
AA: Ultrasonic liquid meters have
been used to measure oil flow over
a rather limited Reynolds number
range, and mainly in the turbulent
area. TM: Little independent data
available on the performance of
ultrasonic liquid meters applied
over an extended Reynolds
number range. Measurements in
the transition area are known to be
a challenge.
As can be seen from the assessment there is a technical challenge for ultrasonic liquid flow technology. That is to
identify measurement uncertainty and/or systematic error of the meters when applied across the transition area
from laminar flow to turbulent flow. This challenge will be addressed as main part of the technology qualification
program to ensure that the installation will lead to a proven technology.

Qualification of Fiscal Liquid Ultrasonic Meters for Operation on Extended Viscosity Range
31st North Sea Flow Measurement Workshop 2013 Page 7 of 21
3.1 Introduction to Technology Readiness Level
The Technology Readiness Level (TRL) of a technology shall be considered according to Table 3.3.
Table 3.3 Technology Readiness Level
3.2 Technology Readiness Level for ultrasonic liquid meter
Ultrasonic oil meters have been tested at full scale with low and high viscos oil and in laboratory environment by
third part, and Statoil has broad experience with use of these meters on limited Reynolds number applications.
These meters are thus regarded currently to be at TRL 3. Next section describes the required activities to be able
to move the ultrasonic liquid flow meter technology to TRL 5. First step is to test the meters at the intended
environment at a full scale laboratory based on Mariner design parameters (TRL 4) and thereafter install ultrasonic
meters at the import/export metering station at Mariner.
The next step after successful integration and test period at Mariner will be to develop sufficient operating
experience with the ultrasonic meters to reach TRL 6 and further TRL 7.
4 Technology Qualification Activities and Acceptance Criteria
This Chapter describes in general the activities and acceptance criteria found necessary to qualify ultrasonic liquid
meter for fiscal metering on an extended Reynolds number range. The meter must fulfil the general allowable
measurement uncertainty required to satisfy custody transfer liquid metering requirements. In the UK sector, by
consensus the total combined uncertainty is ±0.25% (dry mass) for liquid. On the Norwegian sector oil metering for
sale and allocation purposes has allowable expanded uncertainty of 0.30 % of standard volume. The acceptance
criteria chosen for the current TQP are linearity band 0,3 % and proving repeatability uncertainty of 0,027% .
Table 4.1 summarizes the general technology uncertainties, but also the required qualification activities including
the acceptance criteria, for qualifying ultrasonic liquid meter. Table 4.2 describes how these qualification activities
will lift the technology from TRL 3 and to TRL7. However, this paper covers TRL4.

Qualification of Fiscal Liquid Ultrasonic Meters for Operation on Extended Viscosity Range
31st North Sea Flow Measurement Workshop 2013 Page 8 of 21
Table 4.1 Required qualification activities and acceptance criteria for qualifying fiscal liquid ultrasonic meters for operation
on extended Reynolds number range.
No Technology Uncertainty Qualification Activity (QA) Acceptance Criteria (AC)
TRL 4
1 Key test parameters
Viscosity
Liquid flow rate
Density
Carry out flow tests of ultrasonic
meters at a recognized laboratory.
Test matrix shall be based on
Mariner design parameters.
Working range:
Linearity band 0,3 % (same band as defined
by NPD)
Repeatability uncertainty of 0,027%
o Maximum 20 repeats
2 Ultrasonic design Test ultrasonic meters from
minimum two different
manufacturers.
Verify the performance of the meters
TRL 5
3 Functionality test Factory Acceptance Test (FAT) of
metering control system.
Fulfil standard FAT accept criteria for metering control
system
4 Flow FAT each of ultrasonic flow meter at
accredited test facility
Fulfil DECC’s requirements to oil metering for fiscal
purposes.
TRL 6
5 Batch measurements Install 5 ultrasonic flow meters in
parallel. The import and export
metering station shall comprise ball
prover and redundant
instrumentation.
The meters shall perform within uncertainty
limits required by DECC.
Fulfil the historical limit of 0,3% band for the
last 30 accepted k-factors.
TRL 7:
6 Final evaluation After10% of lifetime an evaluation
of the ultrasonic meters will be
performed. The evaluation shall
consider individual proving results
and long term K-factor stability.
All the above acceptance criteria to be fulfilled
5 Semantics
One of the experiences made during testing of the ultrasonic meters is that the manufacturer and customer do not
speak the same “language”. Before presenting the results there is a need to explain the following concepts:
calibration, verification, characterisation, simulation and optimisation, see Table 5.1. In this paper we use the
concepts of the manufacturer.
Table 5.1 Concepts used by manufacturer and operator
Manufacturer Customer
Calibration Characterisation
Verification Calibration
Simulation Optimisation
Calibration: When the ultrasonic meter leaves the factory it is configured with specific weights per ultrasonic path.
At the calibration site the meter is corrected relative to the reference using a method called Velocity Profile
Correction (VPC). The correction factors are based off of velocities on the inner (A) and outer paths (B) of the

Qualification of Fiscal Liquid Ultrasonic Meters for Operation on Extended Viscosity Range
31st North Sea Flow Measurement Workshop 2013 Page 9 of 21
meter along with the bulk average velocity. Through calibration on multiple liquids a lookup table (A, B, Correction)
is generated for the ultrasonic meter’s intended operating process range. This process is frequently called
Reynolds number correction, but note that the flow profile at a given Reynolds number is not necessarily unique.
The lookup table is stored in the meter. The updated configuration is traceable through a belonging checksum
value.
To our knowledge there are no limitations to how much the meter can deviate from reference before application of
correction. This is in contrast to ultrasonic gas meters which in order to be accepted and considered to be of
acceptable quality the maximum deviation from the reference during flow calibration shall be less than ± 1,5 %
[Norsok I-104]. There are not any standard requirements to the manufacturer’s calibration procedure.
Factory setup
Flow measurement
A/B factors
(Velocity Profile Corrections)
Check sum
Laboratory reference
Figure 5.1 Calibration procedure
Verification: After the meter has been calibrated and the corrections factors have been implemented the meter
performance needs to be verified at an accredited laboratory. From the customers point of view this is the Factory
Acceptance Test (FAT) where the liquid ultrasonic meter shall be tested to verify the accuracy (Linearity) and
repeatability (uncertainty) requirements according to an agreed standard or guideline e.g. API MPMS ch. 5.8. The
FAT is documented by a calibration report and a “COFRAC Certificate of Calibration” showing that the calibration,
hence verification, was performed in compliance to the framework of the accreditation of the laboratory. The meter
is usually tested on a single fluid.
Figure 5.2 Verification procedure
Simulation: It’s all about the mathematics. Additional calibration may be used to improve previous verification. By
using new and old calibration data the manufacturer can optimise path weights and velocity profile corrections to
minimise the deviation between corrected flow measurement and reference. This results in a new configuration of
the meter, hence new checksum.
During verification the manufacturer may propose to further improve the correction factors by simulation to
enhance the performance of the meter. In other words the manufacturer continues his calibration during
verification. The FAT program normally has a tight schedule and there are limited possibilities to do extra flow
tests. The customer may then face a dilemma. Should he accept an improved meter where some flow rates are
not repeated with the new checksum, hence the calibration certificate will cover two different setups, or should he
Checksum
Flow measurementDeviation
(API requirements)Check sum
Laboratory reference
Certificate
Qualification of Fiscal Liquid Ultrasonic Meters for Operation on Extended Viscosity Range
31st North Sea Flow Measurement Workshop 2013 Page 10 of 21
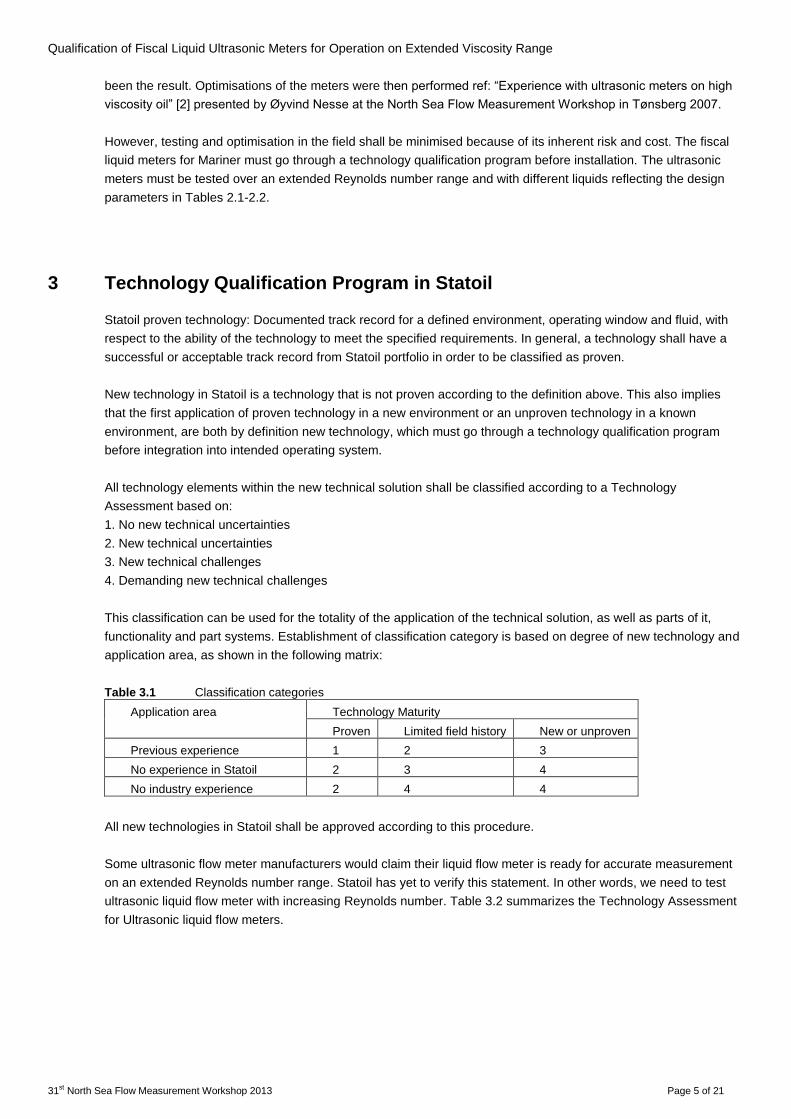
only accept a meter which has gone through a strict verification with fixed checksum throughout the
FAT/verification? Is it acceptable that the manufacturer tampers with the meter during verification? We
recommend simulation only if the meter shall be installed in a system with prover.
Check sum
NewCalibration/verification
New path weights
New checksum
NewA/B factors
Oldcalibration
Simulated verification
Figure 5.3 Simulation procedure
6 Test of 12’’ultrasonic 5 paths reduced bore meter
The first test was carried out at SPSE test site in Fos sur mer in France, where the Krohne Altosonic V flow meter
was calibrated and verified against an uni-directional prover station with a volume of approximately 15m3 between
detector switches. The piping and prover in the test loop had no heat insulation and weather protection. The test
was carried out in early February, week 7, in order to minimize the temperature instability which may cause
problems obtaining good repeatability and reliable results, particularly for high vicious oil.
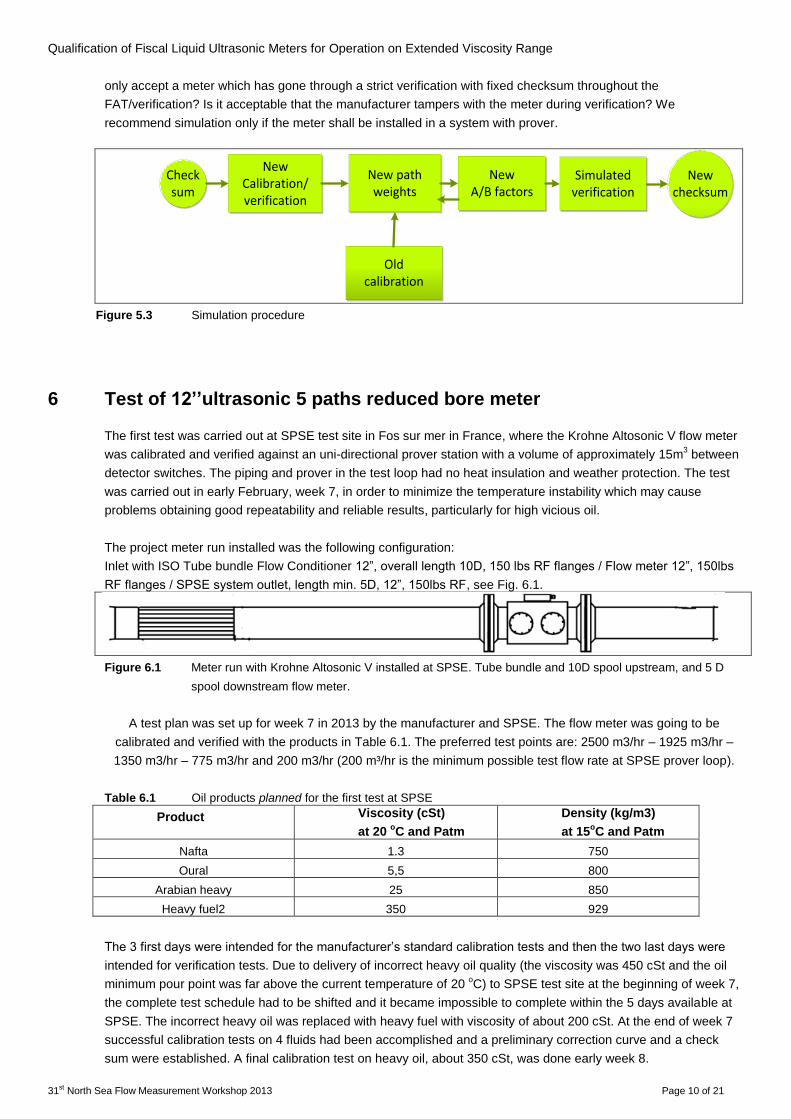
The project meter run installed was the following configuration:
Inlet with ISO Tube bundle Flow Conditioner 12”, overall length 10D, 150 lbs RF flanges / Flow meter 12”, 150lbs
RF flanges / SPSE system outlet, length min. 5D, 12”, 150lbs RF, see Fig. 6.1.
Figure 6.1 Meter run with Krohne Altosonic V installed at SPSE. Tube bundle and 10D spool upstream, and 5 D
spool downstream flow meter.
A test plan was set up for week 7 in 2013 by the manufacturer and SPSE. The flow meter was going to be
calibrated and verified with the products in Table 6.1. The preferred test points are: 2500 m3/hr – 1925 m3/hr –
1350 m3/hr – 775 m3/hr and 200 m3/hr (200 m³/hr is the minimum possible test flow rate at SPSE prover loop).
Table 6.1 Oil products planned for the first test at SPSE
Product Viscosity (cSt)
at 20 oC and Patm
Density (kg/m3)
at 15oC and Patm
Nafta 1.3 750
Oural 5,5 800
Arabian heavy 25 850
Heavy fuel2 350 929
The 3 first days were intended for the manufacturer’s standard calibration tests and then the two last days were
intended for verification tests. Due to delivery of incorrect heavy oil quality (the viscosity was 450 cSt and the oil
minimum pour point was far above the current temperature of 20 oC) to SPSE test site at the beginning of week 7,
the complete test schedule had to be shifted and it became impossible to complete within the 5 days available at
SPSE. The incorrect heavy oil was replaced with heavy fuel with viscosity of about 200 cSt. At the end of week 7
successful calibration tests on 4 fluids had been accomplished and a preliminary correction curve and a check
sum were established. A final calibration test on heavy oil, about 350 cSt, was done early week 8.

Qualification of Fiscal Liquid Ultrasonic Meters for Operation on Extended Viscosity Range
31st North Sea Flow Measurement Workshop 2013 Page 11 of 21
The heavy oil calibration in week 8 resulted in modified calibration factors (in low end of Re-scale) and a new
check sum. A verification test on this heavy oil was done.
Temperature stability is always a challenge during calibration and verification. The viscosity of the heaviest oil
depends strongly on the temperature. Fig. 6.2 shows this relationship for heavy fuel2.
Figure 6.2 Relationship between viscosity and temperature for Heavy fuel2.
The first calibration with original factory setup is shown in Fig. 6.3. Each calibration point is a 3 points calibration
(three repeats) with no requirement to repeatability. The Reynolds number range is from 630 Re to 2.2 MRe, and
deviation span 2.3% relative reference, the SPSE prover. There is overlap between the calibrations on different
liquids for Re > 10 000. This is in agreement with a common understanding that meter performance at a given
Reynolds number is the same no matter the combination of flow, viscosity, and meter size. However, this may not
be the case in the transition area where the flow changes continuously between laminar and turbulent flow. In the
lower Re range, < 10 000 Re, there is a significant deviation between the calibrations, see Fig. 6.3.
Figure 6.3 First SPSE calibration with original weighting factors.
Verification based on the first calibration is shown in Fig. 6.4. The measurements are within the NPD linearity
requirement of 0,3% band. Measurements with different liquids overlap at the same Reynolds number except the
heavy fuel with viscosity of 290 cSt. The manufacturer suggested improving the meter performance by using all
calibration data and introducing new weighting factors to generate a simulated calibration curve, see Fig. 6.5. In
this case measurements with different liquids overlap at the same Reynolds number. Compared to the first

Qualification of Fiscal Liquid Ultrasonic Meters for Operation on Extended Viscosity Range
31st North Sea Flow Measurement Workshop 2013 Page 12 of 21
calibration curve the simulated one takes an opposite shape at Re below 10 000 Re and ending with a correction
of -1,25% at Re equal to 600.
Figure 6.4 Verification with original configuration of the meter, i.e. with the first checksum.
Figure 6.5 Simulated SPSE calibration (correction curve) established by use of modified weighting factors.
A simulated verification of all SPSE data is generated by applying the correction curve in Figure 6.5. The data are
processed through Krohne calibration tool and corrected. The resulting simulated verification is shown in Figure
6.6. The corrected data are within the NPD requirements of +/- 0,15%. Despite a significant improvement of the
correction curve in Fig. 6.5, with Reynolds number overlap, the new weighting factors and correction curve did not
improve the simulated corrected data. The Reynolds number non overlap between different liquids have been
moved from low Re area to about Re 8000. The maximum error span between the different liquids is about of
0,2%.

Qualification of Fiscal Liquid Ultrasonic Meters for Operation on Extended Viscosity Range
31st North Sea Flow Measurement Workshop 2013 Page 13 of 21
Figure 6.6 Simulated verification based on new weighting factors.
The results so far are within the acceptance criteria for this TQP. However, measurements at lower Re are a
challenge and the non-overlap between different liquids called for further testing. A verification with the simulated
correction curve, hence the new checksum, test took place at Trapil, France, in week 35 2013. The calibration
setup and prover volume are equal to the oils used are listed in Table 6.2. The temperature range was 21-31 oC
which resulted in a broad viscosity range per liquid.
All consecutive verification measurements are shown in Fig. 6.7 and are not sorted as a function of increasing Re.
The meter does not fulfil the linearity requirements. It is below the limit at low Re and above at high Re. The result
does not resemble the verification obtained at SPSE.
A new calibration, hence third checksum, was established at Trapil. Calibration curve is not shown, but the
consectutive verification points are shown in Fig. 6.8. There is a single outlier at low Re for the heavy fuel. No
plausible explanation has been found. At higher Re, measurements with gasoline, the meter factor increases
gradually and it continues outside the NPD linearity limits. This is also seen in Fig. 6.9 where each data point is a
result of accepted proving with minimum 5 repeats. Further investigation revealed coating particles in the oil. The
contamination stems from the new coating of the pipeline at Trapil. The coating obviously did not tolerate low
viscous oil. Picture of the tube bundle with coating particles seen at the bottom of each tube is shown in Fig. 6.10.
In week 38 Trapil had installed a filter to filter out the paint particles that were found in week 35. When Krohne
checked what the filter contained after 2 hours of filtering, it was found that there was hardly any residue. This was
mainly due to the fact that the filter had a mesh of approximately 6-7 mm. So the functionality of the filter turned
out negligible. The amount of particles found in the pipe in week 38 was less because the liquid was exchanged,
but estimated at 50% less than in week 35. Krohne will continue the research on the meter.
Table 6.2 Oil products used at Trapil
Oil Viscosity (cSt)
Heavy fuel 151-247
Heavy crude 34-52
Domestic 3.5-4.4
Gasoline 0.7-0.8

Qualification of Fiscal Liquid Ultrasonic Meters for Operation on Extended Viscosity Range
31st North Sea Flow Measurement Workshop 2013 Page 14 of 21
Figure 6.7 Consecutive verification measurements in Trapil with the second checksum, i.e. the correction
curve in Fig. 6.5.
Figure 6.8 Consecutive verification measurements with a third checksum established at Trapil.
Figure 6.9 Verification in Trapil with third checksum

Qualification of Fiscal Liquid Ultrasonic Meters for Operation on Extended Viscosity Range
31st North Sea Flow Measurement Workshop 2013 Page 15 of 21
Figure 6.10 ISO tube bundle with coating particles.
7 Test of 8 paths full bore meter
The second 12’’ meter to go through the technology qualification program is the Smith Meter Ultra8 Liquid
Flowmeter from FMC. The meter has 8 ultrasonic paths as shown in Fig. 7.1. The test setup is identical to the 5
paths meter from Krohne with 10D spool upstream and 5D spool downstream the meter. However, in this case the
ISO tube bundle has been replaced by a high performance flow conditioner shown in Fig.7.2
Figure 7.1 8 paths full bore meter.

Qualification of Fiscal Liquid Ultrasonic Meters for Operation on Extended Viscosity Range
31st North Sea Flow Measurement Workshop 2013 Page 16 of 21
Figure 7.2 High performance flow conditioner.
The flow tests were carried out at FMC Technologies Flow Research and Test Center, Erie, Pa, USA. The
calibration laboratory received ISO/IEC 17025:2005 certification August 2012. Traditional unidirectional ball prover
is not used. Instead the reference is a master meter prover. Its uncertainty is traceable to an unidirectional fixed
piston displacement prover. The latter is calibrated by onsite gravimetric calibration facility. The number of pulses
from the master meter per proving run corresponded to a prover volume of 14.1 m3 (89 bbl). According to earlier
version of API MPMS Ch. 5.8 this should give 0,027%repeatability from 10 runs for an ultrasonic meter, see Table
7.1. Each flow rate was verified according to the acceptance criteria in Table 4.1.
Table 7.1 Prover volume for USMs, with 0,027% uncertainty from repeatability. Table B-2 from API MPMS Ch. 5.8.
A calibration curve, hence a correction lookup table, was established prior the testing witnessed by Statoil. The
calibration curve, shown in Fig. 7.3, has a non-overlap between different liquids at low Re area from 5000-15000.
The manufacturer did not respond to this as nonconformity because the meter correction is based off of velocities
on the inner and outer paths of the meter along with the bulk average velocity. The non-overlap in Fig. 7.3 may
then demonstrate that the velocity profile at a given RE is not unique. The velocity profile correction for the meter
in question is shown in Fig. 7.4. This correction curve is based on the same calibration data. The non-overlaps
between the liquids are not near as apparent and the “gaps” are minimized. The fine black line is a 3rd
order
polynomial fit curve.

Qualification of Fiscal Liquid Ultrasonic Meters for Operation on Extended Viscosity Range
31st North Sea Flow Measurement Workshop 2013 Page 17 of 21
Figure 7.3 Erie calibration of 8 path meter with original weighting factors.
Figure 7.4 Velocity profile correction (VPC) for the 8 paths meter.
Verification of the 8 paths meter was carried out using four different liquids using four liquids with the following
viscosity: 2, 11, 35, and 225 cSt. A functional test was performed at a viscosity of 350 cSt. But due to limited
chilling capacities, and hence temperature instability at the higher viscosities, the calibration and the following
verification with the 350 cSt oil did not fulfil the linearity requirement. A new chiller system is currently being
installed which may provide the opportunity to test to uncertainty at higher viscosities.
The verification in terms of accepted provings and in the sequence the tests were done are shown in Fig. 7.5. At
11 cSt, the second liquid used in the verification, the meter span the whole linearity band. The results was
unexpected because the measurements with the 11 cSt liquid covers a Re range 30 000-300 000 which is
supposed to not be a challenge. The results with the three other liquids are well within the required linearity limits.

Qualification of Fiscal Liquid Ultrasonic Meters for Operation on Extended Viscosity Range
31st North Sea Flow Measurement Workshop 2013 Page 18 of 21
Figure 7.5 Consecutive verification measurements of 8 path meter
Verification of the 8 path meter as function of flow rate and Re are shown in Fig. 7.6 and 7.7 respectively. With respect to
Re the verification extends the calibration range. In this case the extrapolation of the VPC was successful. It is not clear if
it is the black 3rd
order polynomial fit or the red line in Fig. 7.4 that is used at the higher Re.
Figure 7.6 Verification of 8 path meter as function of flow rate

Qualification of Fiscal Liquid Ultrasonic Meters for Operation on Extended Viscosity Range
31st North Sea Flow Measurement Workshop 2013 Page 19 of 21
Figure 7.7 Verification of 8 path meter as function of Re.
Verification with the liquids 222 and 11 cSt were repeated with a transducer pair disconnected. Path 3 being close to
centre of the pipe was chosen. These measurements are just for demonstration and are not subject to the acceptance
criteria in Table 4.1. The meter performance is mainly maintained and follows the trends of the verification. A maximum
change of about 0,1% is found at Re=31 000.
Figure 7.7 Verification of 8 path meter and demonstration of transducer failure, path 3 disconnected.
8 Test of 6 path full bore meter
The Smith Meter Ultra6 Liquid Flowmeter is identical to Ultra8 except that path 6 and 7 are not used, see Fig. 7.1
for path configuration. For this qualification program Ultra6 uses the same calibration (velocity profile correction
lookup table) as established for Ultra8, see Fig. 7.4. As expected the verification of Ultra6 follows the main
characteristics Ultra8, but Ultra6 is outside the NPD linearity limits and thus failed the qualification. Fig. 8.1 shows
Ultra6 and Ultra8 verifications. The results suggest the Ultra6 does not control measurements in the transition
area between laminar and turbulent flow in a linear way. Below 5000 Re the meter factor drops significantly.
However, the meter has acceptable performance at higher Re and is there within the NPD linearity band of 0,3%,

Qualification of Fiscal Liquid Ultrasonic Meters for Operation on Extended Viscosity Range
31st North Sea Flow Measurement Workshop 2013 Page 20 of 21
see Fig. 8.2. Above 5000 Re Ultra6 also has a Re overlap between the different liquids, but the overlaps are not
as close as the ones found for Ultra8.
Figure 8.1 Consecutive verification measurements of Ultra6 and Ultra8 liquid meters.
Figure 8.2 Verification of 6 path meter
9 Summary
To carry out a technical qualification program like this one done for Mariner and Bressay project involves access
to one or several flow test facilities in order to cover predefined test conditions. There is no known accredited test
site which can run continuous and stable testing at the maximum viscosity and flow rates we needed. A common
flow test would be ideal so the different flow meters could be tested under exact same conditions. An ultrasonic
meter intended for a wide Reynolds range, should be calibrated and verified on more than one liquid and on more
than the regular 5 or 6 test flow rates normally required by a customer.
Using a multipath liquid ultrasonic meter in the transient area is possible, but extensive calibration (many test
points) is required in order to fit the flow meters for the operating Reynolds ranges. In this project two 12’’
ultrasonic liquid for use on extended viscosity range are qualified for technology readiness level 5. A third tested
meter did not fulfil the linearity requirement of 0.3% band over the whole operating range.

Qualification of Fiscal Liquid Ultrasonic Meters for Operation on Extended Viscosity Range
31st North Sea Flow Measurement Workshop 2013 Page 21 of 21
The results from this technology qualification program show that a common liquid metering station for heavy crude
oil and diluent on Mariner FSU and Bressay FSU is a feasible metering concept.