Quaderni - earth-prints.org et... · IT1 Italsider 40.8118 14.1912 26 125 IT2 Italsider 40.8132...
20
Site effects at the Campi Flegrei, preliminary results Istituto Nazionale di Geofisica e Vulcanologia Quaderni di ISSN 1590-2595 Anno 2010_Numero 80
Transcript of Quaderni - earth-prints.org et... · IT1 Italsider 40.8118 14.1912 26 125 IT2 Italsider 40.8132...

Site effects at the Campi Flegrei,preliminary results
Istituto Nazionale diGeofisica e Vulcanologia
Quaderni di
ISSN 1590-2595Anno 2010_Numero 80
DirettoreEnzo Boschi
Editorial BoardRaffaele Azzaro (CT)Sara Barsotti (PI)Mario Castellano (NA)Viviana Castelli (BO)Anna Grazia Chiodetti (AC)Rosa Anna Corsaro (CT)Luigi Cucci (RM1)Mauro Di Vito (NA)Marcello Liotta (PA)Lucia Margheriti (CNT)Simona Masina (BO)Nicola Pagliuca (RM1)Salvatore Stramondo (CNT)Andrea Tertulliani - coordinatore (RM1)Aldo Winkler (RM2)Gaetano Zonno (MI)
Segreteria di RedazioneFrancesca Di Stefano - coordinatoreTel. +39 06 51860068Fax +39 06 36915617Rossella CeliTel. +39 06 51860055Fax +39 06 36915617
Quaderni di

Site effects at the Campi Flegrei,preliminary results
Anna Tramelli, Danilo Galluzzo, Mauro A. Di Vito
INGV (Istituto Nazionale di Geofisica e Vulcanologia, Sezione di Napoli - Osservatorio Vesuviano)
ISSN 1590-2595Anno 2010_Numero 80
In copertina Campi Flegrei (particolare)

Site effects at the Campi Flegrei,preliminary results
The Campi Flegrei caldera is a complex structure with a high population density, located west of the city of
Naples. In addition of being an active volcano it is characterized by a high seismic hazard due to both
Appennines regional earthquakes and to local earthquakes occurring during the bradyseismic crises. These
unrest phenomena are characterized by slow ground vertical movements, particularly active in the central part of
the caldera, and by a high number of low-magnitude earthquakes.
In this context, the determination of the site transfer functions of the area has a strong relevance for the Civil
Defense aimed to determine the hazard of the area. We have calculated the site transfer function with different
techniques (H/V and Generalized Inversion technique) and have collected data on the local geology with the aim
of correlating the site transfer functions with lithology and topography. This analysis has been performed on three
areas: the Astroni crater, the Camaldoli hill and the Agnano plain. A future development will be to extend this
analysis to the whole Campi Flegrei area.
La caldera dei Campi Flegrei è una struttura complessa con un elevata densità di popolazione che si trova ad ovest della
città di Napoli. Oltre ad essere un vulcano attivo quest’area risente dei terremoti degli Appennini e dei terremoti dovuti
a fenomeni bradisismici. Il fenomeno del bradisismo consiste in un lento movimento verticale, particolarmente attivo nella
parte centrale della caldera e spesso accompagnato da terremoti di bassa magnitudo.
In questo contesto, la determinazione della funzione di trasferimento di sito dell’area è di fondamentale importanza per il
Dipartimento della Protezione Civile al fine di definire il rischio sismico dell’area. In questo lavoro è stata calcolata la funzione
di trasferimento di sito utilizzando tecniche diverse: H/V e metodo delle inverse generalizzate. Questi risultati sono stati
integrati con le informazioni sulla geologia locale allo scopo di correlare la funzione di amplificazione di sito con la litologia e
la morfologia locali. Quest’analisi è stata applicata a tre aree particolari: il cratere degli Astroni, la collina dei Camaldoli e la
piana di Agnano. In futuro l’analisi verrà estesa a tutta l’area dei Campi Flegrei.
4
Introduction
A critical factor for seismic hazard estimation is a detailedevaluation of the site response. Seismic shaking is highlyinfluenced by the local physical and mechanical properties ofthe rocks underlying a site. Shallow or thick sedimentarydeposits can significantly amplify the earthquake groundmotion. Seismologists and engineers have conducted nume-rous studies to quantify how the seismic energy is modifiedand how structures that overlie vulnerable soils will behaveduring strong ground shaking [Wills et al., 2000].Different methods can be applied to estimate the site respon-se from seismic records. The most frequently used is thespectral ratio method. This approach needs the identifica-tion of a reference site, usually characterized by outcroppinglithoid rocks, and consists in computing the ratio betweenthe spectrum at a site of interest with respect to the referen-
ce site spectrum [Borcherdt and Gibbs, 1976]. Both S waves[Field et al., 1995] and coda waves [Phillips and Aki, 1986]can be used for this application. One of the advantages ofusing the coda waves is that their propagation depends onlyon average regional properties of the medium and is inde-pendent on the source and recording site locations. Othermethods, called inversion method [Andrews, 1986;Boatwright et al., 1991], cast the problem into a formalizedinversion that is based on the assumption that the observedearthquake spectrum can be decomposed into a source, pathand site terms. This method does not make any assumptionon the source spectra and allows to determine the site tran-sfer function with respect to a reference site or to the avera-ge response of all the other sites [Phillips and Aki, 1986].These methods depend on the used reference spectrum. Analternative technique that does not need a reference site isthe so called H/V method, which uses the ratio between the

5
horizontal and vertical spectra of the S-wave (or the codawave) window for each site [Lermo and Chàvez-Garcìa,1993]. The assumption of this method is that the local siteconditions are relatively transparent to the motion that appe-ars on the vertical component, whether they affect the hori-zontal components.In this paper we apply the inversion and H/V method to thedata collected by three networks installed in the area ofCampi Flegrei in different times. The applied methoddepends on the type of data, earthquakes or noise recor-dings. Our results are then compared with the results obtai-ned by Del Pezzo et al. [1993] in the Campi Flegrei areaduring the 1982-84 bradyseismic crises. The results are rela-ted to the local geological properties with the aim of exten-ding the punctual site information (the site transfer fun-ction is calculated for the point where the station lies) to anarea characterized by the same geological properties.
1. The Campi Flegrei caldera structure andevolution
The Campi Flegrei caldera is one of the three active volca-noes of the Neapolitan area [Santacroce et al., 2003]. Thegeology of this caldera has attracted the interest of manyEarth scientists. Orsi et al. [1996] have proposed the mostrecent comprehensive reconstruction of the volcanic anddeformation history of the Campi Flegrei area, as well asdetailed references of previous works. The Campi Flegreicaldera results from two main nested collapses related tothe Campanian Ignimbrite (39 ka) and Neapolitan YellowTuff (NYT, 15 ka) eruptions, respectively. Portions of themargins of both calderas results by reactivation of NE-SWand NW-SE trending regional faults. After each collapse,volcanism has been confined within the collapsed area. Inthe past 15 ka, volcanism has occurred within the NYT cal-dera and has been strictly related to the deformation of thisstructure. It has been concentrated in three epochs of acti-vity, dated 15-9.5, 8.6-8.2 and 4.8-3.8 ka, with the last erup-tion, which generated the Mt Nuovo tuff cone in 1538 AD,after a long quiescence [Di Vito et al., 1999]. The threeepochs of activity were separated by periods of quiescence,marked in the field by two paleosols. During each epocheruptions occurred one after the other with average timeintervals of few tens of years. During the past 10 ka, theNYT caldera floor was affected by resurgence which genera-ted ground uplift and subsidence with consequent emersionand submersion of the caldera floor [Cinque et al.; 1984;Orsi et al., 1996; Di Vito et al., 1999]. During the quiescencebetween the II and III epoch, resurgence acquired its apexand the caldera floor emerged before the beginning of the IIIepoch. Historical ground deformation within the NYT cal-dera has been documented at the Serapeo, a Roman market-
place in Pozzuoli, for at least the past 2 ka [Parascandola,1947]. Two major bradyseismic episodes have generated 170cm of ground uplift in 1969-72 and 180 cm in 1982-84 follo-wed by minor uplift episodes in 1989 (7 cm), 1994 (1 cm),2000 (4 cm), 2004-06 (6 cm) [Barberi et al., 1984; Orsi et al.,1999 and references therein; Del Gaudio et al. 2009]. Allthese uplift episodes were accompanied by low magnitudeseismicity [Orsi et al, 1999].The volcanic and deformation history of the Campi Flegreicaldera, including its magmatic feeding system, as well as itspresent state, demonstrate that the system is active and canerupt again.
2. Data set
The seismic data used for the analysis of the site effects in thearea of Campi Flegrei can be divided into three sets:1) data recorded by the seismic network of the
University of Wisconsin (WN);2) data recorded by the seismic mobile network of the
INGV, Osservatorio Vesuviano (MSN);3) data collected during the active seismic experiment
called SERAPIS (SE).
Figure 1 DTM of the Campi Flegrei area. Purple triangles: Wisconsin Network sta-tions; red stars: the earthquakes recorded during the 1982-84 bradyseismic crisesused for the analysis. UTM coordinates are in meters.Figura 1 DTM dell’area dei Campi Flegrei. Triangoli viola: stazioni appartenential Wisconsin Network; stelline rosse: terremoti registrati durante la crisi bradi-sismica del 1982-84 usati in questa analisi. Le coordinate UTM sono in metri.

Site effects at the Campi Flegrei, preliminary results A. Tramelli et al., Quaderni di Geosifica, No. 80, Aprile 2010
2.1 Wisconsin NetworkThe first set of data was recorded during the 1982-1984 bra-dyseismic crisis that was characterized by a maximum upliftof more than 1.7 m [Aster et al., 1989] recorded in the areaof the 'Accademia' of Pozzuoli. During this crisis thousandsof shallow (depth ≤ 3 km), low-magnitude (up to Md=4.0)earthquakes were recorded. Seismic activity was more inten-se during March and April 1984, with a large swarm on April1st. The seismic events were recorded by a network deployedby the University of Wisconsin, composed by short-period,three-component, high-dynamic range (106 dB) digital sta-tions (blue triangles in Fig. 1) and locally recorded on tapesin PCM format [Del Pezzo et al., 1984].Data were recorded with different sampling rates, someti-mes changed during the survey (table I). To overcome thisproblem we later resampled all records at 100 sps.After a visual inspection of the recordings we decided todiscard station W11 because of the high instrumental noise.For the station W15 we noticed that since 29/02/1984 at10:27 the EW and Vertical components were exchanged,consequently we exchanged them back.The response curve is almost identical for all stations. To getthe amplitude in m/s signals are divided for the instrument
sensitivity 36 V/inch/s and multiplied by the conversion fac-tor 0.0056 m/inch. The data sheet of 1980 reporting thetransfer function of the WN sensors is shown in Fig. 2.To check this procedure, we visually compared the amplitu-
6
Figure 2 Data sheet of the 1984 reporting the transfer function ofthe Wisconsin Network sensors.Figura 2 Appunti del 1984 che riportano la funzione di trasferi-mento dei sensori appartenenti al Wisconsin Network.
Table I Locations and sampling rates of the stations belonging to the Wisconsin Network.Tabella I Localizzazioni e frequenze di campionamento delle stazioni appartenenti alWisconsin Network.
Name Site Latitude N Longitude E Elevation(m a.s.l.)
Sampling(Hz)
W03 Astroni 40.8462 14.1528 35 100
W04 Mt. Nuovo 40.8352 14.0838 70 100
W05 Camaldoli 40.8570 14.1930 457 100
W10 Capo Miseno 40.7782 14.0895 50 100
W11 Darsena 40.8210 14.1208 82 200
W12 Solfatara 40.8267 14.1443 180 100
W13 Castello Baia 40.8097 14.0827 20 200
W14 Nisida 40.7963 14.1650 40 100
W15 Mt. Spina 40.8252 14.1640 150 100
W17 Starza Est 40.8307 14.1297 84 100
W20 Mt. S. Angelo 40.8523 14.0982 306 100-200
W21 Fondi Cigliano 40.8412 14.1278 175 100

7
Site effects at the Campi Flegrei, preliminary results A. Tramelli et al., Quaderni di Geosifica, No. 80, Aprile 2010
de of earthquakes with similar magnitude and hypocentral-station distance recorded during the two different periods(1982-84 and 2006-08). As an example we show two ear-thquakes with magnitude M=1.3 and 1.4 (see table II), thefirst one recorded during the 1982-84 bradyseismic event andthe second recorded in 2006. We selected theW04 (WN) andOMN2 (MN) stations located close to each other, on the Mt.Spina hill, at a distance of 592 m (see Figs. 1 and 4). Therecordings of the two earthquakes are shown in Fig. 3. Themaximum amplitude ratio between the two signals is com-patible taking into account the magnitude difference and theerrors in the magnitude values.We used only events recorded by more than 6 stations.The final data set includes 22 events, shown in Fig. 1,
recorded in SAC format and corrected for the instrumenttransfer function.The coordinates of the used stations are reported in table I.
2.2 Mobile Seismic NetworkThe seismic events occurred in 2006 and 2008 were recordedby the Mobile Seismic Network (MSN) stations. MSN is stillworking in the Campi Flegrei area in continuous acquisitionmodality and is composed by 7 high-dynamic (20 bit) digitalstations, 6 equipped with broadband sensors (LE3D 20s andGURALP CMG40T 60s) and 1 with short-period sensor(LE3Dlite 1Hz) (table III). Timing signal was synchronizedwith external GPS, sampling rates are set to 100 or 125 sps.The stations are located in the central part of Campi Flegrei
Figure 3 Seismograms for the two seismic events of table II. The seismogram of the earthquake 126 recorded by station W04 is inpurple, the seismogram of the earthquake 6019 recorded by station OMN2 is in red.Figura 3 Sismogrammi relativi ai due terremoti riportati in tabella II. Viola: terremoto 126 registrato dalla stazione W04; rosso: ter-remoto 6019 registrato dalla stazione OMN2.
Table II Events used for the comparison between the Wisconsin Network and the Mobile Seismic Network. Geographic coordi-nates are UTM 33.Tabella II Eventi utilizzati per il confronto tra il Wisconsin Network e Mobile Seismic Network. Le coordinate sono UTM33.
Earthquake M Date Latitude N (m) Longitude E (m) Depth (m b.s.l.) Rec. Station
126 1.3 26/01/1984 4518309 424557 3650 W04
6019 1.4 24/12/2006 4521625 427921 1190 OMN2

8
Site effects at the Campi Flegrei, preliminary results A. Tramelli et al., Quaderni di Geosifica, No. 80, Aprile 2010
as shown in Fig. 4. The transfer functions ofthe MSN sensors are reported in Fig. 5.The data set used for the evaluation of thesite response is composed by recordings oflocal earthquakes (red stars in Fig. 4) and sei-smic noise. The amplitude of the waveforms(SAC format) is recorded in microvolt and, toobtain a uniform data set in agreement withthe WN one, we divided for the instrumenttransduction of the sensors (reported in tableIII) to obtain the amplitude in m/s. As shownin Fig. 5 the sensor transfer functions are flatin the frequency window 1-20 Hz used forthe analysis.The final data set includes 27 events.
2.3 SERAPIS NetworkThis temporary network was deployed in thearea of Campi Flegrei during the SERAPISexperiment (SEismic Reflection/RefractionAcquisition Project for Imaging complex vol-canic Structures), carried out in September2001. The source and receiver arrays coveredan area of more than 50 x 50 km², includingthe bays of Napoli and Pozzuoli [Judenhercand Zollo, 2005]. For two weeks the ship LeNadir produced source-shots with an air guninside the bay of Pozzuoli following a grid of
Figure 4 DTM of the Campi Flegrei area with the stations belonging to the MobileSeismic Network (purple triangles) and the earthquakes (red stars) used for theanalysis. The UTM coordinates are in meters.Figura 4 DTM dell’area dei Campi Flegrei. Triangoli viola: stazioni appartenential Mobile Seismic Network; stelline rosse: terremoti utilizzati nell’analisi. Lecoordinate UTM sono in metri.
Figure 5 Amplitude (top) and phase (bottom) of the transfer functions for the three sensors used in the Mobile Seismic Network.Figura 5 Ampiezza (sopra) e fase (sotto) della funzione di trasferimento per i tre diversi sensori utilizzati dal Mobile Seismic Network.

9
Site effects at the Campi Flegrei, preliminary results A. Tramelli et al., Quaderni di Geosifica, No. 80, Aprile 2010
N-S and E-W lines [Gasparini, 1998]. The on-land acquisitionarray was designed to provide a very high density coverageand consisted of 18 vertical and 66 three-component seismo-meters continuously recording during the experiment. Weselected 34 three-component stations and analyzed the sei-smic noise recorded during the experiment; the stations usedfor the site effects analysis are shown in Fig. 6 and their coor-dinate are reported in table V.The data set selected for this analysis is composed by 100minutes of seismic noise for each station (100 files of 60 seach). The original format of the data was Segy, then conver-ted into ASCII.
2.4 Earthquakes locationThe seismic events used for the site transfer function analy-sis recorded by both the WN and MSN were picked manual-ly for P and S first arrivals. Unfortunately, the magnitude ofthe events recorded by the MN between 2005 and 2007 waslow and the signal-to-noise ratio was often unfavorable topick the S wave onset. In these cases we forced the S wavefirst onset at 1.7 times the P wave travel time.We choose ear-thquakes recorded by at least 6 stations for the WN, as men-tioned before, and 3 stations for the MSN. We used theNonLinLoc program [Lomax et al., 2000] that determinesthe location of the hypocenters within a 3D Grid using asystematic grid-search. For the earthquakes recorded only by3 MSN stations we used also the picking of the 1D stationslocated in the Campi Flegrei area to correctly locate the
hypocenters. The velocity model used for the location is theone proposed by Judenherc and Zollo [2005]. The location ofthe earthquakes is reported in Fig. 1 for the WN and in Fig.4 for the MSN (red stars).
3. Method of analysis for site effects estimation
We estimated the site amplification with different techniquesdepending on the available data set.As for the data set collected by theWN and MSN, composedof earthquake records, we analyzed the S and coda waveswhile for the data recorded by the SN we analyzed the sei-smic noise.We calculated the site transfer function using the generali-zed inversion (GI) method [Hartzell, 1992; Bonilla et al.,1997; Parolai et al., 2001; Drouet et al., 2005], the coda inver-sion (CI) technique [Tsujiura, 1978; Bonilla et al., 1997] andthe horizontal to vertical spectral ratio (H/V) applied on theS waves and/or on the coda waves [Langston, 1979]. For theS-wave analysis we considered a time window of 3 s starting0.1 s before the S-wave arrival; for the coda waves we consi-dered a window of 3 s starting at 8 s of lapse time. Only theH/V technique was applied to the seismic noise [Nakamura,1989]. The lack of bedrock sites leads us to consider the ave-rage spectrum between all of the investigated sites as the
Table III Sensors, data loggers and gains of the stations belon-ging to the Mobile Seismic Network.Tabella III Sensori, data logger e Gain delle stazioni appartenen-ti al Mobile Seismic Network.
Name Data Logger Sensor Transduction(V*s/m)
AMS2 Lennarz MARSlite LE-3D/20s 1000
ASB2 Lennarz MARSlite LE-3D/20s 1000
BGNG Lennarz M24 GuralpCMG40T
800
CSI Lennarz PCM5800 LE-3Dlita 1 Hz 400
OMN2 Lennarz MARSlite LE-3D/20s 1000
OVD Lennarz M24 LE-3D/20s 1000
TAGG Taurus GuralpCMG40T
800
Figure 6 DTM of the Campi Flegrei area with the stations belonging to the SERA-PIS Network (purple triangles). The UTM coordinates are in meters.Figura 6 DTM dell’area dei Campi Flegrei con le stazioni appartenenti al SERA-PIS Network (triangoli viola). Le coordinate UTM sono in metri.

10
Site effects at the Campi Flegrei, preliminary results A. Tramelli et al., Quaderni di Geosifica, No. 80, Aprile 2010
reference spectrum. This assumption was made for the GImethod applied on the S-waves and for the CI methodapplied on the coda waves. An extensive description of theused method can be found in Galluzzo et al. [2009].We corrected the amplitude spectra for the geometricalspreading and for the quality factor Q of the S-waves for theGI method and of the coda waves for the CI method. Thepropagation effects of S and coda waves can be respectivelywritten as:
where ω is the angular frequency, D is the hypocenter-sta-tion distance, t is the lapse time and v is the S wave veloci-ty. QS is the S-wave quality factor and QC is the coda-wavequality factor. For the analysis we used the quality factorestimated by Petrosino et al. [2008].The data set available for the application of the GI methodwas limited, due to the difficulty of identifying the S onset.On the contrary, coda waves are particularly suitable tocompute the site transfer function since they are not affec-ted by radiation pattern effects and, in a limited area, havethe same propagation effects of the direct S waves[Tsujiura, 1978; Lachet et al., 1996; Bonilla et al., 1997]. Forthis reason we used the CI method to confirm the resultsobtained with the GI technique.The aim was thus to compare the results of the site-transferfunction for each site obtained with these differentmethods. The comparison was made in terms of peak fre-quencies and relative amplitudes of the evaluated site-tran-sfer functions. To evaluate the differences between the dif-
ferent methods, the uncertainties of each method werealso calculated.
4. Geological characteristics of selected areaswith particular site amplification
The Campi Flegrei area has been investigated for long timedue to the high volcanological, seismological and geother-mal interest [Rosi and Sbrana, 1987; Orsi et al., 1996]. Thuswe benefit of a wide geological information to properly cha-racterize the analyzed sites.The structural features of Campi Flegrei result mostly fromalternating constructive and destructive volcanic events.Effusive eruptions produced small lava domes, medium- andlow-magnitude explosive eruptions generated tuff cones,tuff rings and pumice and scoria cones, high-magnitudeexplosive events generated widespread pyroclastic falloutand pyroclastic current deposits [Di Vito et al., 1999; Orsi etal., 2004]. Furthermore, the high-magnitude events determi-ned the occurrence of tectonic collapses (i.e., theCampanian Ignimbrite and Neapolitan Yellow Tuff calderasand the Agnano volcano-tectonic collapse) [Orsi et al., 1996;de Vita et al., 1999]. After the collapse events the depressedpart of Campi Flegrei was invaded by the sea, with relatederosional and depositional processes. Consequently, theCampi Flegrei area is mostly composed of volcanic rocksand subordinately of palustrine and marine clastic sediments[Orsi et al., 1996]. The geological features of the area aredescribed in Di Vito et al. [1999] who investigated the areathrough geomorphological and geological surveys. The flat
Table IV Locations and sampling rate of the stations belonging to the MobileSeismic Network.Tabella IV Localizzazione e frequenza di campionamento delle stazioni del MobileSeismic Network.
Name Site Latitude N Longitude E Elevation(m a.s.l.)
Sampling(Hz)
AMS2 Mt. Spina 40.8264 14.1604 35 125
ASB2 Astroni 40.8435 14.1459 12 125
BGNG Bagnoli 40.8189 14.1454 4 125
CSI Pozzuoli 40.8340 14.1262 89 125
OMN2 Mt. Nuovo 40.8333 14.0904 40 125
OVD Osservatorio 40.8197 14.1827 14 100
TAGG Terme Agnano 40.8293 14.1736 4 100
11
Site effects at the Campi Flegrei, preliminary results A. Tramelli et al., Quaderni di Geosifica, No. 80, Aprile 2010
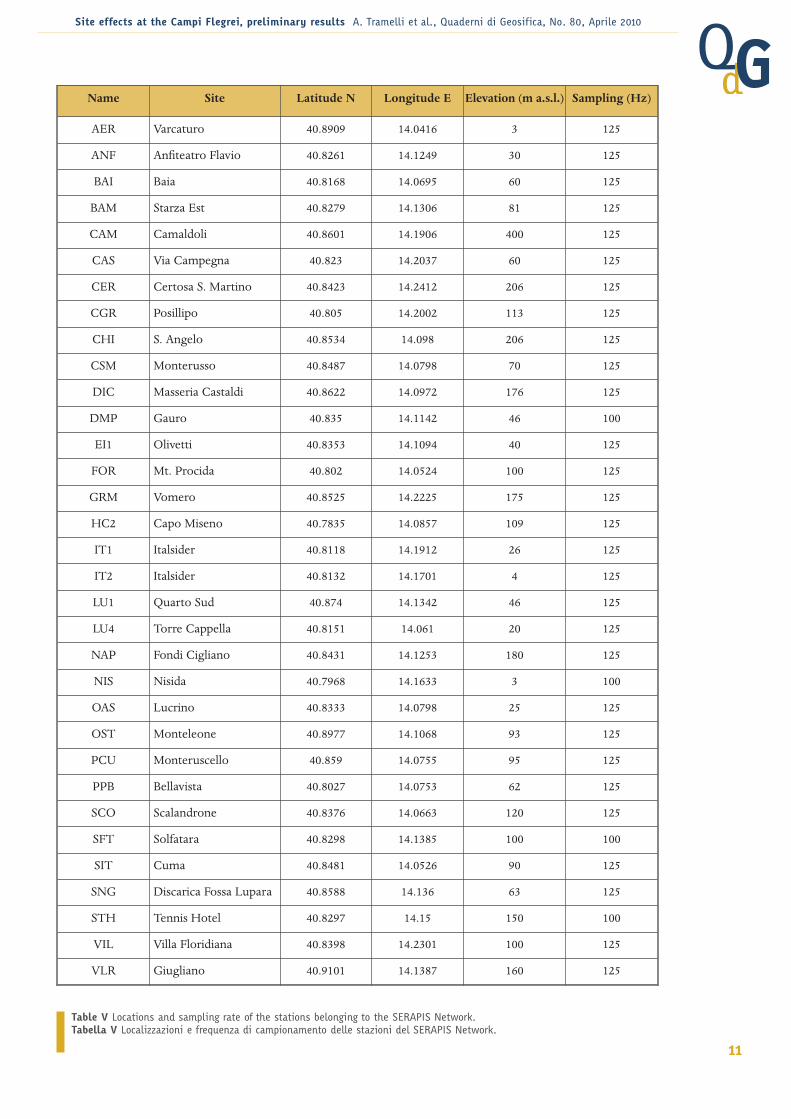
Table V Locations and sampling rate of the stations belonging to the SERAPIS Network.Tabella V Localizzazioni e frequenza di campionamento delle stazioni del SERAPIS Network.
Name Site Latitude N Longitude E Elevation (m a.s.l.) Sampling (Hz)
AER Varcaturo 40.8909 14.0416 3 125
ANF Anfiteatro Flavio 40.8261 14.1249 30 125
BAI Baia 40.8168 14.0695 60 125
BAM Starza Est 40.8279 14.1306 81 125
CAM Camaldoli 40.8601 14.1906 400 125
CAS Via Campegna 40.823 14.2037 60 125
CER Certosa S. Martino 40.8423 14.2412 206 125
CGR Posillipo 40.805 14.2002 113 125
CHI S. Angelo 40.8534 14.098 206 125
CSM Monterusso 40.8487 14.0798 70 125
DIC Masseria Castaldi 40.8622 14.0972 176 125
DMP Gauro 40.835 14.1142 46 100
EI1 Olivetti 40.8353 14.1094 40 125
FOR Mt. Procida 40.802 14.0524 100 125
GRM Vomero 40.8525 14.2225 175 125
HC2 Capo Miseno 40.7835 14.0857 109 125
IT1 Italsider 40.8118 14.1912 26 125
IT2 Italsider 40.8132 14.1701 4 125
LU1 Quarto Sud 40.874 14.1342 46 125
LU4 Torre Cappella 40.8151 14.061 20 125
NAP Fondi Cigliano 40.8431 14.1253 180 125
NIS Nisida 40.7968 14.1633 3 100
OAS Lucrino 40.8333 14.0798 25 125
OST Monteleone 40.8977 14.1068 93 125
PCU Monteruscello 40.859 14.0755 95 125
PPB Bellavista 40.8027 14.0753 62 125
SCO Scalandrone 40.8376 14.0663 120 125
SFT Solfatara 40.8298 14.1385 100 100
SIT Cuma 40.8481 14.0526 90 125
SNG Discarica Fossa Lupara 40.8588 14.136 63 125
STH Tennis Hotel 40.8297 14.15 150 100
VIL Villa Floridiana 40.8398 14.2301 100 125
VLR Giugliano 40.9101 14.1387 160 125
12
Site effects at the Campi Flegrei, preliminary results A. Tramelli et al., Quaderni di Geosifica, No. 80, Aprile 2010
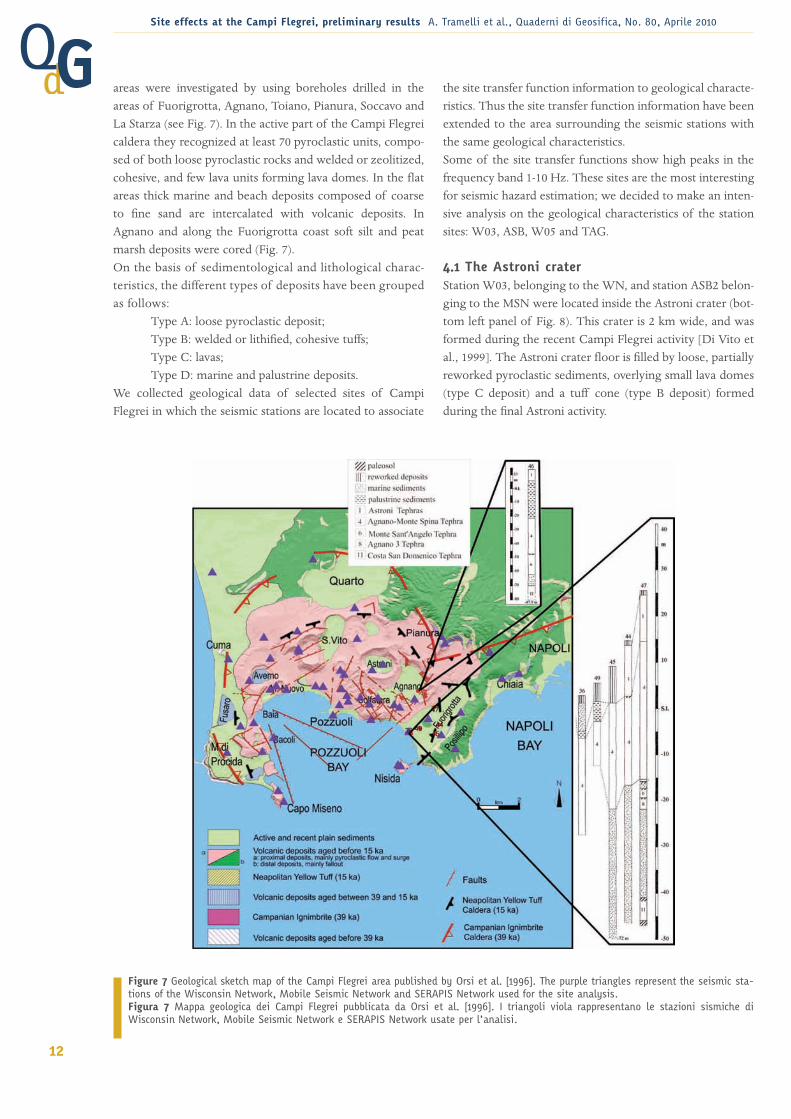
areas were investigated by using boreholes drilled in theareas of Fuorigrotta, Agnano, Toiano, Pianura, Soccavo andLa Starza (see Fig. 7). In the active part of the Campi Flegreicaldera they recognized at least 70 pyroclastic units, compo-sed of both loose pyroclastic rocks and welded or zeolitized,cohesive, and few lava units forming lava domes. In the flatareas thick marine and beach deposits composed of coarseto fine sand are intercalated with volcanic deposits. InAgnano and along the Fuorigrotta coast soft silt and peatmarsh deposits were cored (Fig. 7).On the basis of sedimentological and lithological charac-teristics, the different types of deposits have been groupedas follows:
Type A: loose pyroclastic deposit;Type B: welded or lithified, cohesive tuffs;Type C: lavas;Type D: marine and palustrine deposits.
We collected geological data of selected sites of CampiFlegrei in which the seismic stations are located to associate
the site transfer function information to geological characte-ristics. Thus the site transfer function information have beenextended to the area surrounding the seismic stations withthe same geological characteristics.Some of the site transfer functions show high peaks in thefrequency band 1-10 Hz. These sites are the most interestingfor seismic hazard estimation; we decided to make an inten-sive analysis on the geological characteristics of the stationsites: W03, ASB, W05 and TAG.
4.1 The Astroni craterStation W03, belonging to the WN, and station ASB2 belon-ging to the MSN were located inside the Astroni crater (bot-tom left panel of Fig. 8). This crater is 2 km wide, and wasformed during the recent Campi Flegrei activity [Di Vito etal., 1999]. The Astroni crater floor is filled by loose, partiallyreworked pyroclastic sediments, overlying small lava domes(type C deposit) and a tuff cone (type B deposit) formedduring the final Astroni activity.
Figure 7 Geological sketch map of the Campi Flegrei area published by Orsi et al. [1996]. The purple triangles represent the seismic sta-tions of the Wisconsin Network, Mobile Seismic Network and SERAPIS Network used for the site analysis.Figura 7 Mappa geologica dei Campi Flegrei pubblicata da Orsi et al. [1996]. I triangoli viola rappresentano le stazioni sismiche diWisconsin Network, Mobile Seismic Network e SERAPIS Network usate per l’analisi.
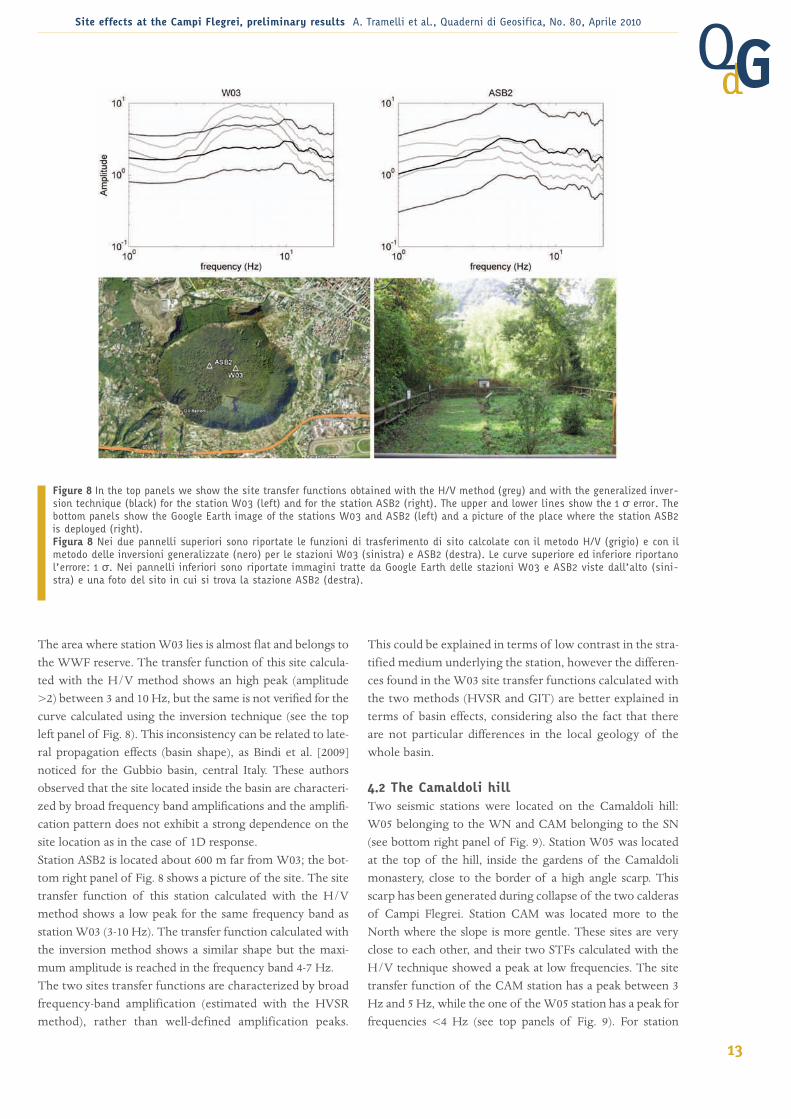
The area where stationW03 lies is almost flat and belongs tothe WWF reserve. The transfer function of this site calcula-ted with the H/V method shows an high peak (amplitude>2) between 3 and 10 Hz, but the same is not verified for thecurve calculated using the inversion technique (see the topleft panel of Fig. 8). This inconsistency can be related to late-ral propagation effects (basin shape), as Bindi et al. [2009]noticed for the Gubbio basin, central Italy. These authorsobserved that the site located inside the basin are characteri-zed by broad frequency band amplifications and the amplifi-cation pattern does not exhibit a strong dependence on thesite location as in the case of 1D response.Station ASB2 is located about 600 m far from W03; the bot-tom right panel of Fig. 8 shows a picture of the site. The sitetransfer function of this station calculated with the H/Vmethod shows a low peak for the same frequency band asstation W03 (3-10 Hz). The transfer function calculated withthe inversion method shows a similar shape but the maxi-mum amplitude is reached in the frequency band 4-7 Hz.The two sites transfer functions are characterized by broadfrequency-band amplification (estimated with the HVSRmethod), rather than well-defined amplification peaks.
This could be explained in terms of low contrast in the stra-tified medium underlying the station, however the differen-ces found in the W03 site transfer functions calculated withthe two methods (HVSR and GIT) are better explained interms of basin effects, considering also the fact that thereare not particular differences in the local geology of thewhole basin.
4.2 The Camaldoli hillTwo seismic stations were located on the Camaldoli hill:W05 belonging to the WN and CAM belonging to the SN(see bottom right panel of Fig. 9). Station W05 was locatedat the top of the hill, inside the gardens of the Camaldolimonastery, close to the border of a high angle scarp. Thisscarp has been generated during collapse of the two calderasof Campi Flegrei. Station CAM was located more to theNorth where the slope is more gentle. These sites are veryclose to each other, and their two STFs calculated with theH/V technique showed a peak at low frequencies. The sitetransfer function of the CAM station has a peak between 3Hz and 5 Hz, while the one of theW05 station has a peak forfrequencies <4 Hz (see top panels of Fig. 9). For station
13
Site effects at the Campi Flegrei, preliminary results A. Tramelli et al., Quaderni di Geosifica, No. 80, Aprile 2010
Figure 8 In the top panels we show the site transfer functions obtained with the H/V method (grey) and with the generalized inver-sion technique (black) for the station W03 (left) and for the station ASB2 (right). The upper and lower lines show the 1 σ error. Thebottom panels show the Google Earth image of the stations W03 and ASB2 (left) and a picture of the place where the station ASB2is deployed (right).Figura 8 Nei due pannelli superiori sono riportate le funzioni di trasferimento di sito calcolate con il metodo H/V (grigio) e con ilmetodo delle inversioni generalizzate (nero) per le stazioni W03 (sinistra) e ASB2 (destra). Le curve superiore ed inferiore riportanol’errore: 1 σ. Nei pannelli inferiori sono riportate immagini tratte da Google Earth delle stazioni W03 e ASB2 viste dall’alto (sini-stra) e una foto del sito in cui si trova la stazione ASB2 (destra).

14
W05, the site transfer function calculated with the inversionmethod shows a peak (up to 3) at low frequencies (2-4 Hz)(see top left panel of Fig. 9). The peak is probably due to thefact that the station was located at the top of a hill borderedby high angle slopes.
The small difference that is present between the two transferfunctions (W05 and CAM) is probably due to the differencein the slope of the hill, as suggested by Lee et al. [2009] thatused spectral element in Yangminshan Region of Taiwan toshow that at mountain top the amplification increases
Site effects at the Campi Flegrei, preliminary results A. Tramelli et al., Quaderni di Geosifica, No. 80, Aprile 2010
Figure 9 In the top left panel we show the site transfer functions obtained with the H/V method (grey) and with the generalizedinversion technique (black) for the station W05. For the station CAM (belonging to the SN) we show the site transfer function obtai-ned with the H/V method (top right). The upper and lower lines show the 1 σ error. The bottom panels show the Google Earth imageof the stations W05 and CAM (right) and a picture of the place where the station W05 was deployed (left).Figura 9 Nel pannello superiore sinistro sono riportate le funzioni di trasferimento di sito calcolate con il metodo H/V (grigio) e con ilmetodo delle inversioni generalizzate (nero) per la stazione W05. La funzione di trasferimento di sito calcolata col metodo H/V per lastazione CAM (appartenente al SN) è rappresentata nel pannello superiore destro. Le curve superiore ed inferiore riportano l’errore: 1 σ.Nei pannelli inferiori sono riportate un’immagine tratta da Google Earth delle stazioni W05 e CAM viste dall’alto (destra) e una foto delsito in cui si trovava la stazione W05 (sinistra).
Figure 10 IIn the left panel we show the site transfer functions obtained with the H/V method (grey) and with the generalized inver-sion technique (black) for the station TAGG. The upper and lower lines show the 1 σ error. The right panel show the Google Earthimage of the station TAGG.Figura 10 Nel pannello di sinistra vengono riportate le funzioni di trasferimento di sito calcolate con il metodo H/V (grigio) e con il meto-do delle inversioni generalizzate (nero) per la stazione TAGG. Le curve superiore ed inferiore riportano l’errore: 1 σ. Nel pannello di sini-stra è riportata un’immagine tratta da Google Earth della stazione TAGG vista dall’alto.

depending on topography gradient and scale.Nevertheless, there are no particular differences in the geo-logical characteristics of the sites where these two stationswere installed. Infact the Camaldoli hill is composed of athick sequence of zeolitized or welded tuffs (type B depo-sit) with almost no differences in the velocity parameters.Only the upper part of the sequence is a 30 m thick succes-sion of non-cohesive ash and pumice lapilli layers interbed-ded to paleosoils (type A deposit). This sequence couldinfluence the site transfer functions but it does not justifythe differences between the site transfer functions of thetwo stations located on the hill.
4.3 The Agnano plainInside the Agnano plain, produced by the volcano-tectoniccollapse occurred during the Agnano - Monte Spina eruption[de Vita et al., 1999], lies the station TAGG. The location isreported in the right panel of Fig. 10.The site transfer function calculated with the H/V methodshows a very high peak at low frequencies (1-3 Hz) then thefunction becomes lower than one. The same shape is obtai-ned with the inversion technique, but in this case the fun-ction is shifted to the bottom of the plot and the peak rea-ches the amplitude of 1.5 (see left panel of Fig. 10).This station has a geologically interesting location as it is pla-ced almost on a wetland. The station lays on the palustrinedeposits (type D deposit) of the Agnano lake characterizedby very low S-wave velocity and low density (ρ≃ 0.9gr/cm³).These deposits cause a high site transfer function at a fre-quency that depends on the thickness of the layer, which,on the basis of the available boreholes, is about 25m thickand overlay denser (ρ≃ 1.5gr/cm³) layers 70 m thick (type Aand B deposit).
Conclusions
The results of the preliminary site response analysis in theCampi Flegrei area seem to indicate that topographic featu-res are sometimes relevant in the seismic wave amplifica-tion. The heterogeneity of the Campi Flegrei structuremakes a detailed study of the site amplification propertiesnecessary. We need to understand when the stratigraphicproperties take the advantage on the topographical onesand vice versa. This objective will be achieved by the deter-mination of all the site transfer functions of the site equip-ped with a seismometer and the integrated analysis of thisinformation with lithological and topographical informa-tion. We wish to determine a relation between this charac-teristics and to elaborate a microzonation map of the enti-re Campi Flegrei area. The successive analysis will dealwith this aim.
Acknowledgements
This work was supported by the Dipartimento di ProtezioneCivile of Italy (DPC) and Istituto Nazionale di Geofisica eVulcanologia (INGV) in the framework of the projects enti-tled “SPeeD”. The authors wish to thank Edoardo DelPezzo, Simona Petrosino, Paola Cusano and Eliana BellucciSessa for their useful suggestion and the referee GiulianoMilana which improved the quality of the paper.
References
Andrews, D. J. (1986). Objective determination of source parame-ters and similarity of earthquakes of different size inEarthquake Source Mechanics, American GeophysicalUnion, Washington.
Aster, R., R. Meyer, G. De Natale, M. Martini, E. Del Pezzo,G. Iannaccone and R. Scarpa (1989). Seismic investi-gation of the Campi Flegrei: a synthesis and summary ofresults. Editors: K. Aki and P. Gasparini and R.Scarpa. In: Volcanic Seismology, Proc. Volc. seriesIII, Springer-Verlag, San Francisco.
Barberi, F., G. Corrado, F. Innocenti and G. Luongo (1984).Phlegraean Fields 1982–1984: Brief chronicle of a vol-cano emergency in a densely populated area. Bull.Volcanol. 47(2):175–185.
Bindi, D., S. Parolai, F. Cara, G. Di Giulio, G. Ferretti, L.Luzi, G. Monachesi, F. Pacor and A. Rovelli (2009).Site Amplifications Observed in the Gubbio Basin,Central Italy: Hints for Lateral Propagation Effects.Bull. Seismol. Soc. Am. 99, 741-760.
Bonilla, L. F., J.H. Steidl, G.T. Lindley, A.G. Tumarkin andR.J. Archuleta (1997). Site amplification in the SanFernando Valley, California: Variability of site effectestimation using the S-wave, coda and H/V methods.Bull. Seismol. Soc. Am. 87 (3), 710–730.
Borcherdt, R. D. and J. F. Gibbs (1976). Effects of local geologi-cal conditions in the San Francisco Bay region on groundmotions and the intensities of the 1906 earthquake.Bull. Seismol. Soc. Am. 66, 467–500.
Boatwright, J. and J. B. Fletcher and T. E. Fumal (1991).General inversion scheme for source, site, and propaga-tion characteristics using multiply recorded sets ofmoderate-sized earthquakes. Bull. Seismol. Soc. Am.81(5), 1754–1762.
Cinque, A. and G. Rolandi and V. Zamparelli (1985).L’estensione dei depositi marini Olocenici nei CampiFlegrei in relazione alla vulcano-tettonica. Boll. Soc.Geol. Ital. 104, 327–348.
Del Gaudio, C., I. Aquino, C. Ricco and C. Serio (2009).Monitoraggio geodetico dell’area vulcanica napoletana:risultati della livellazione geometrica di precisione ese-
15
Site effects at the Campi Flegrei, preliminary results A. Tramelli et al., Quaderni di Geosifica, No. 80, Aprile 2010

16
guita ai Campi Flegrei a settembre 2008. Quaderni diGeofisica, 66.
Del Pezzo, E. and G. De Natale and A. Zollo (1984). Space-time distribution of small earthquakes at PhlegraeanFields. Bull. Volcanol. 47 (1984), pp. 201–207.
Del Pezzo, E., S. De Martino, M.T. Parrinello and C.Sabbarese (1993). Seismic site amplification factors inCampi Flegrei, southern Italy. Phys. Earth. Plan. Int.78, 105-117.
De Vita, S., G. Orsi, L. Civetta, A. Carandente, M.D’Antonio, A. Deino, T. Di Cesare, M.A. Di Vito, R.V. Fisher, R. Isaia, E. Marotta, M. Ort, L.Pappalardo and J. Southon (1999). TheAgnano–Monte Spina eruption (4.1 ka) in the resurgent,nested Campi Flegrei caldera (Italy). J. Volcanol.Geotherm. Res. 91, 269–301.
Di Vito, M., R. Isaia, G. Orsi, J. Southon, S. De Vita, M.D’Antonio, L. Pappalardo and M. Piochi (1999).Volcanism and deformation since 12.000 years at theCampi Flegrei caldera (Italy). J. Volc. Geoth. Res. 91,221–246.
Drouet, S., A. Souriau and F. Cotton (2005). Attenuation, sei-smic moments and site effects for weak motion events:Application to Pyrenees. Bull. Seism. Soc. Am. 95 (5),1731-1748.
Field, E. H. and K. H. Jacob, K. H. (1995). A comparison andtest of various siter esponse estimation techniques, inclu-ding three that are not reference-site dependent. Bull.Seismol. Soc. Am. 85 (4), 1127–1143.
Galluzzo, D., E. Del Pezzo, M. La Rocca, M. Castellano andF. Bianco (2009). Site effects at the Vesuvius volcano: acomparison of techniques and inferences as the scaling oflaw of the seismic spectrum. Bull. Seismol. Soc. Am.99 (3), 1705-1719.
Gasparini, P., (1998). Looking inside Mt. Vesuvius. EOS Trans.,AGU 79, 229–232.
Hartzell, S. H., (1992). Site response estimation from earthquakedata. Bull. Seism. Soc. Am. 82, 2308–2327.
Judenherc, S. and A. Zollo (2005). The bay of Naples (SouthernItaly): Constraints on the volcanic structures inferredfrom a dense seismic survey. J. Geophys. Res. 109,doi:10.129/2003JB002876.
Lachet, C., D. Hatzfeld, P. Bard, N. Theodulidis, C.Papaioannou and A. Savvaidis (1996). Site effect andmicrozonation in the city of Thessaloniky (Greece).Comparison of different approaches. Bull. Seism. Soc.Am. 86 (6), 1692-1703.
Langston C. A. (1979). Structure under Mount Rainier,Washington, inferred from teleseismic body waves. J.Geophys. Res. 84, 4749–4762.
Lee, S.-J., Y. C. Chan, D. Komatitsch, B. S. Huang and J. Tromp(2009). Effects of realistic surface topography on seismicground motion in the Yangminshan region of Taiwan
based upon the spectral-element method and LiDARDTM. Bull. Seismol. Soc. Am. 99 (1), 681–693.
Lermo, J., and F.J. Chavez-Garcia (1993). Site effect evaluationusing spectral ratios with only one station. Bull.Seismol. Soc. Am. 83, 1574–1594.
Lomax, A., J. Virieux, P. Volant and C. Berge (2000).Probabilistic earthquake location in 3D and layeredmodels: Introduction of a Metropolis-Gibbs method andcomparison with linear locations in Advances in SeismicEvent Location. Thurber, C.H., and N. Rabinowitz(eds.). Springer, Kluwer, Amsterdam.
Orsi, G. and S. De Vita and M. Di Vito (1996). The restlessresurgent Campi Flegrei caldera (Italy): constraints onits evolution and configuration. J. Volcanol. Geoth.Res., 74, 179-214
Nakamura, Y. (1989). A method for dynamic characteristics estima-tion of subsurface using microtremor on the ground surface.Quart. Rep. Railway Tech. Res. Inst. (RTRI) 30, 25–33.
Parascandola, A., (1947). I fenomeni bradisismici del Serapeo diPozzuoli. Genovesi, Napoli.
Parolai, S., D. Bindi and L. Troiani (2001). Site response for theRSM Seismic Network and Source Parameters in the cen-tral Appenines (Italy). Pure App. Geophys. 158, 695-715.
Petrosino, S., L. De Siena and E. Del Pezzo (2008). Re-calibra-tion of the magnitude scales at Campi Flegrei, Italy, onthe basis of measured path and site and transfer fun-ctions. Bull. Seismol. Soc. Am. 98 (4), 1964–1974.
Phillips, W. S. and K. Aki (1986). Site amplification of codawaves from local earthquakes in central California. Bull.Seism. Soc. Am. 76, 627-648.
Rosi, M. and A. Sbrana (1987). The Phlegraean Fields. CNR,Quad. de “La ricerca Scientifica”, 114: 1-175.
Santacroce, R., R. Cristofolini, L. La Volpe, G. Orsi and M. Rosi(2003). Italian active volcanoes. Episodes, 26 (3): 227-234.
Tsujiura, M. (1978). Spectral analysis of the coda waves fromlocal earthquakes. Bull. Earthquake Res. Inst.,Tokyo Univ. 53, 1–48.
Wills, C. J., M. Peterson, W. A. Bryant, M. Reichle, G. J.Saucedo, S. Tan, G. Taylor and J. Treiman (2000).A Site-Conditions Map for {California} Based onGeology and Shear-Wave Velocity. Bull. Seism. Soc.Am. 90, S187-S208.
Site effects at the Campi Flegrei, preliminary results A. Tramelli et al., Quaderni di Geosifica, No. 80, Aprile 2010

17
Site effects at the Campi Flegrei, preliminary results A. Tramelli et al., Quaderni di Geosifica, No. 80, Aprile 2010
Introduction 4
1. The Campi Flegrei caldera structure and evolution 5
2. Data set 52.1 Wisconsin Network 62.2 Mobile Seismic Network 72.3 SERAPIS Network 82.4 Earthquakes location 9
3. Method of analysis for site effects estimation 9
4. Geological characteristics of selected areas with particular site amplification 104.1 The Astroni crater 124.2 The Camaldoli hill 134.3 The Agnano plain 15
Conclusions 15
Acknowledgements 15
References 15
Indice


Coordinamento editoriale e impaginazioneCentro Editoriale Nazionale | INGV
Progetto grafico e redazionaleLaboratorio Grafica e Immagini | INGV Roma
© 2010 INGV Istituto Nazionale di Geofisica e VulcanologiaVia di Vigna Murata, 605
00143 RomaTel. +39 06518601 Fax +39 065041181
http://www.ingv.it

Istituto Nazionale di Geofisica e Vulcanologia