QST International Corp. 2019/08/20
18
QST International Corp. 2019/08/20
Transcript of QST International Corp. 2019/08/20

QST International Corp.
2019/08/20

GROUP
QST International Corporation
ABOUT
US
INDUSTRY NUMBER

From A Trader to F.S.P
3
1985 2019
2008 Prompt Direct
Delivery
2014 Goble F.S.P 2006 Local by Local
Strategy

4 4
Global Footprint
Distributors & Auto
OEMs
Auto OEMs & Tiers
20Auto OEMs & Non Auto
30% 30% 40%
Global market by local manufacturing, only but the shares from Taiwan.
5
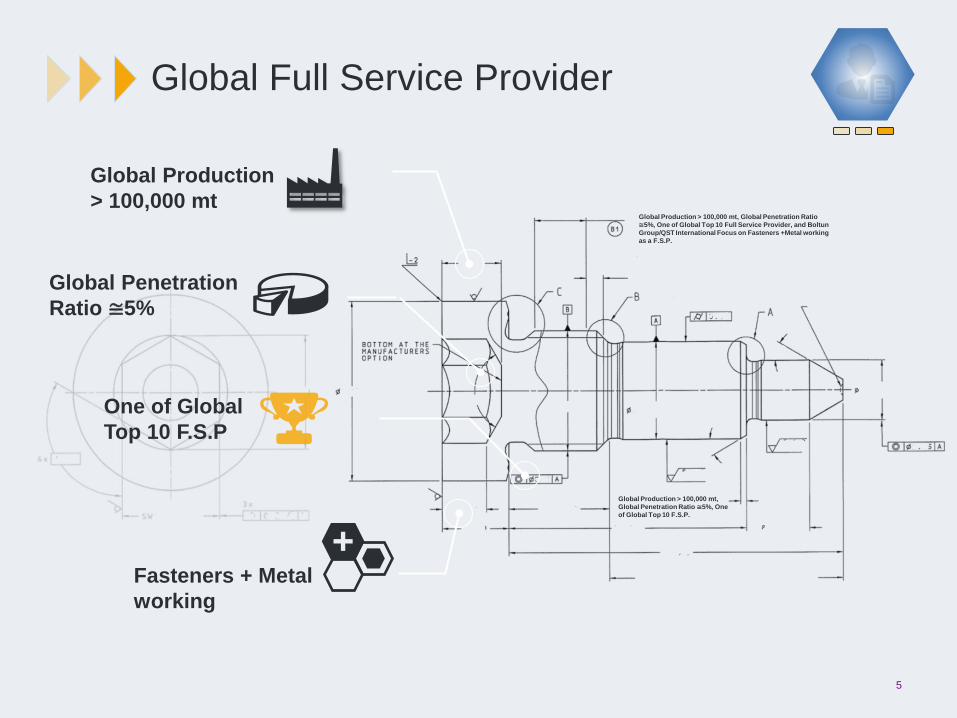
Global Full Service Provider
Global Penetration
Ratio ≅5%
One of Global
Top 10 F.S.P
Global Production
> 100,000 mt
Fasteners + Metal
working
Global Production > 100,000 mt, Global Penetration Ratio
≅5%, One of Global Top 10 Full Service Provider, and Boltun
Group/QST International Focus on Fasteners +Metal working
as a F.S.P.
Global Production > 100,000 mt,
Global Penetration Ratio ≅5%, One
of Global Top 10 F.S.P.

6
Numbers from Operation
20m+ Euro revenue in
European market since M&A
Stable EBITDA margin 15%+
Consolidated YoY 4.8% in 2018
Operating cash flow ≈ 1billion+

7
Operation Results_4 Vessels
(NT mil) (RMB mil)
(EUR mil) (RMB mil)
2,306
2,598 2,570 2,457 2,391
2,668
1,219
2013 2014 2015 2016 2017 2018 2019Q2
Revenue of QST
468
551 545
661
770 823
351
2013 2014 2015 2016 2017 2018 2019Q2
Revenue of Xiamen
76 80 84 88
95 97
48
2013 2014 2015 2016 2017 2018 2019Q2
Revenue of ESKA
332 341 317 327
380
327
144
2013 2014 2015 2016 2017 2018 2019Q2
Revenue of Suzhou

8
Consolidated Numbers
3,841 3,759 3,937
6,839
9,676 10,016
10,345
10,840
4,968
-0.54
1.46
2.06 2.15
3.23
3.98
5.41 5.51
6.98 5.43
-0.60
0.40
1.40
2.40
3.40
4.40
5.40
6.40
7.40
-
2,000
4,000
6,000
8,000
10,000
2009Y 2010Y 2011Y 2012Y 2013Y 2014Y 2015Y 2016Y 2017Y 2018Y 2019Q2
Revenue EPS
359
19
165
437 324
565
1,566 1,511
757
1,721
1,432
Cash inflow from operations

9
Automotive, Future
Share
GROUP
QST International Corporation
Electrical
Connected
Autonomous
Light weight

10
Automotive Segment Attractiveness
Exhaust system Steering
Fuel System
Breaks
Interior
Axles
Suspension
Climate Control
Transmission
Frame
ICE
Body
Seats
Electric Drivetrain
Battery/fuel Cell
Wheels & Tires
Electronics
Infotainment & Com.
ADAS & Sensor
Risky
Attractive
700B
600B
500B
400B
300B
200B
100B
1,200B*
-100B
-200B
Risk Traditional
Content/Vo
lume
AEV
Content/Volu
me
Aftermarke
t/Service
Incremental risks and opportunities
Global automotive volume and content opportunity($B
USD)
*2017 supplier market size projected to be $1,200
B Source: 2017 Global Automotive Supplier Study

11
Autonomous, Connectivity
China
India
Korea
U.S.
Japan
Germany
79%
76%
60%
47%
36%
35%
Consumers who feel that increased vehicle connectivity
will be beneficial
U.S.
Japan
Korea
India
Germany
China
Consumers who agree that AVs will not be safe
50%
47%
74%
50%
57%
79%
49%
54%
81%
48%
47%
64%
47%
45%
72%
25%
26% 62%
2019 2017 2018
12
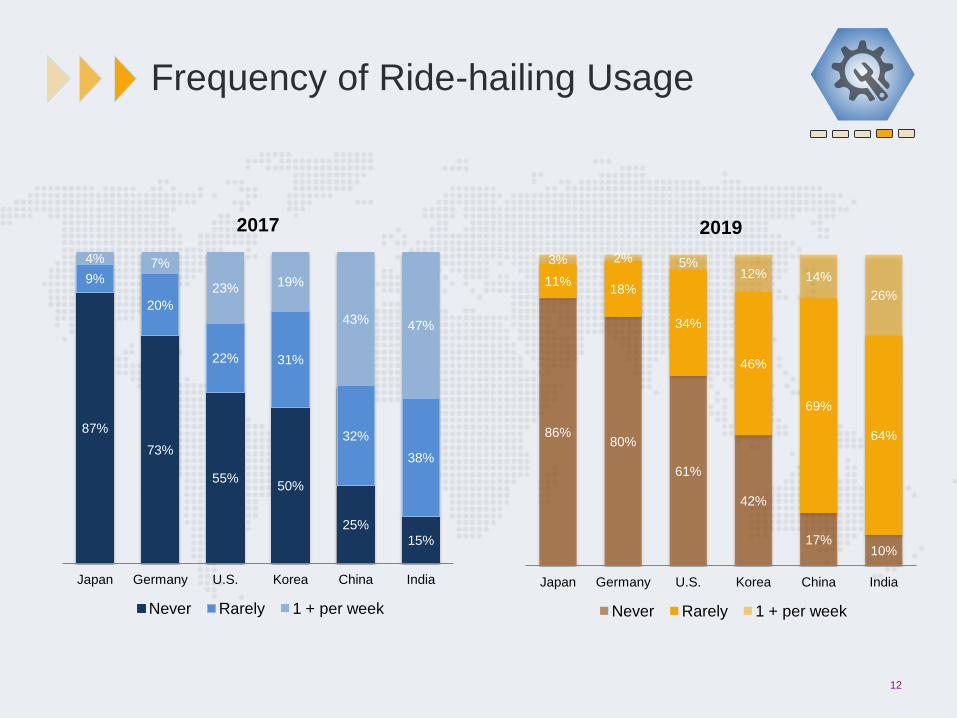
Frequency of Ride-hailing Usage
87%
73%
55% 50%
25%
15%
9%
20%
22% 31%
32%
38%
4% 7%
23% 19%
43% 47%
Japan Germany U.S. Korea China India
2017
Never Rarely 1 + per week
86% 80%
61%
42%
17% 10%
11% 18%
34%
46%
69%
64%
3% 2% 5% 12% 14%
26%
Japan Germany U.S. Korea China India
2019
Never Rarely 1 + per week

13
Emerging
OEM’s
Specialty OEM’s
Tesla
Chinese OEM’s
BAIC, BYD
Tech Giants
Consumer
Electronics
Apple
Software
Mobility
Service
Providers
E-hailing
Uber, Didi
Car Sharing
Zipcar
Tiers
ZF-TRW, Bosch, Denso,
Magna, Continental, etc.
Auto OEM’s
VW, Toyota,
Nissan-Renault, GM,
Ford, Hyundai-Kai,
Honda, FCA, etc.
Conventional Auto Industry
A complex market landscape ever! Re-define & re-invent a car. Multi-fronts competitions. Business model game change.
What’s Happening to Them ?

14
GROUP
QST International Corporation
Invest in Our Future
Accelerating
Complex and
Larger Market
Heading for
Emerging Countries
Anti-
Globalization
Light weight
15
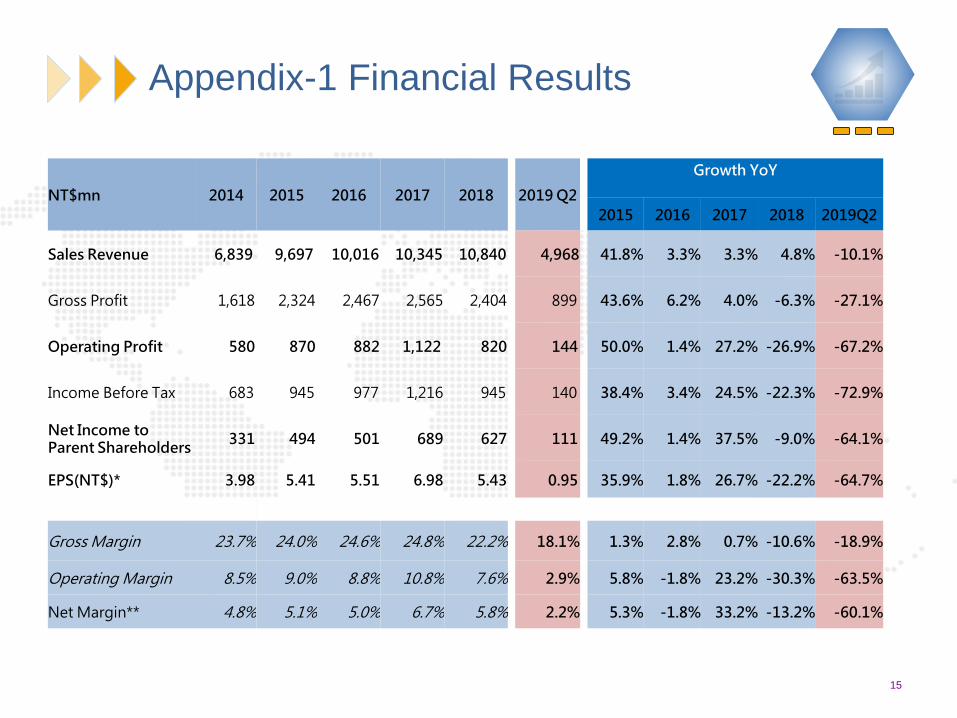
Appendix-1 Financial Results
NT$mn 2014 2015 2016 2017 2018
2019 Q2
Growth YoY
2015 2016 2017 2018 2019Q2
Sales Revenue 6,839 9,697 10,016 10,345 10,840 4,968 41.8% 3.3% 3.3% 4.8% -10.1%
Gross Profit 1,618 2,324 2,467 2,565 2,404 899 43.6% 6.2% 4.0% -6.3% -27.1%
Operating Profit 580 870 882 1,122 820 144 50.0% 1.4% 27.2% -26.9% -67.2%
Income Before Tax 683 945 977 1,216 945 140 38.4% 3.4% 24.5% -22.3% -72.9%
Net Income to Parent Shareholders
331 494 501 689 627 111 49.2% 1.4% 37.5% -9.0% -64.1%
EPS(NT$)* 3.98 5.41 5.51 6.98 5.43 0.95 35.9% 1.8% 26.7% -22.2% -64.7%
Gross Margin 23.7% 24.0% 24.6% 24.8% 22.2% 18.1% 1.3% 2.8% 0.7% -10.6% -18.9%
Operating Margin 8.5% 9.0% 8.8% 10.8% 7.6% 2.9% 5.8% -1.8% 23.2% -30.3% -63.5%
Net Margin** 4.8% 5.1% 5.0% 6.7% 5.8% 2.2% 5.3% -1.8% 33.2% -13.2% -60.1%

16
Appendix-2 Product Mix
16

17
廈門恒耀
Xiamen Boltun Nuts & Machined Parts Plant
廈門同恒
Xiamen Boltec Bolts, Nuts & Auto Parts Plant
台灣欣富山
SFS Industry Small Screws Plant
蘇州友匯
Suzhou Yeswin Bolts & Screws Plant
聯信檢測
Q-Lab Inc. Testing & Calibration Lab
蘇州聯信
Suzhou Q-Lab Inc. Testing & Calibration Lab
廈門安恒
Xiamen Bolwir Wire Processing Plant
廈門民恒
Xiamen Bolmac Fastener Machinery Plant
友匯貿易
Yeswin (Shanghai) VMI & Distribution Provider
蘇州友丰
Suzhou Tech-Form Hydraulic Nut Plant (JV)
Newco Thailand Logistics Warehouse
Clico USA Logistics Warehouse
ESKA Automotive Bolts & Special Parts Plant
F. Sieber Tools Tooling & Dies Plant/Design
保安廠
Pao-An Plant Bolts & Screws Plant
Suzhou Xiamen Germany Taiwan U.S.A.
Thailand
100% 100% 85.71% 100%
USA Boltun USA Real estate
廈門艾司卡
Xiamen ESKA Alu Fastener Plant
Appendix-3
18
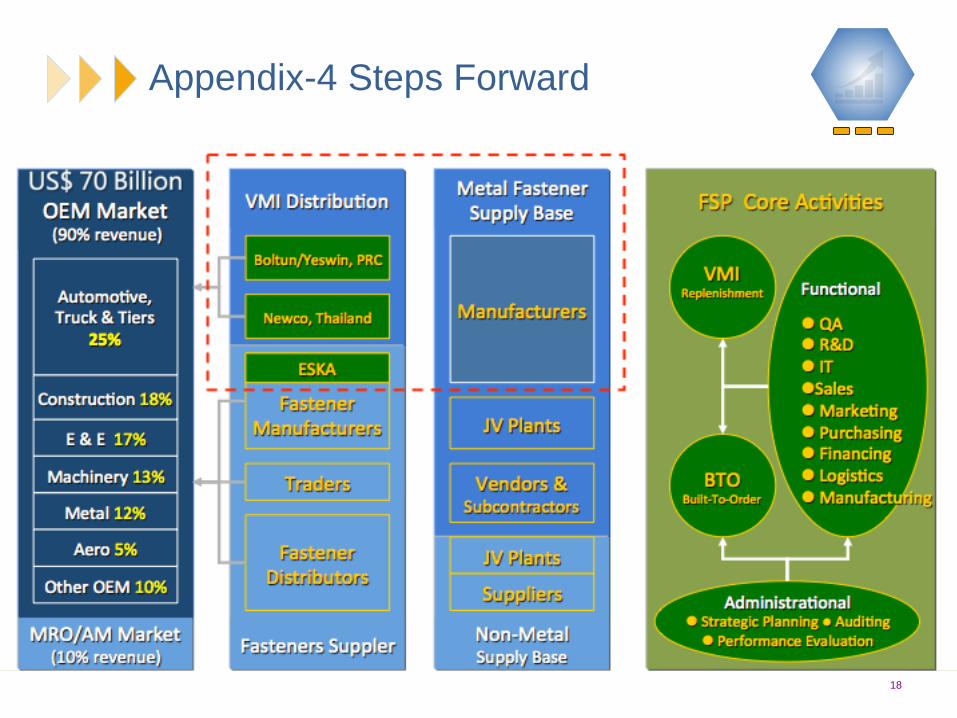
Appendix-4 Steps Forward