QoS Parametric Correlation for Network … Parametric Correlation for Network Management, a Link...
10
QoS Parametric Correlation for Network Management, a Link between Application’s Requests and Network’s Capabilities EMANUEL PUSCHITA, TUDOR PALADE, MIHAI SARLEA, ANCUTA MOLDOVAN, REBECA COLDA, IRINA VERMESAN Communication Department Technical University of Cluj-Napoca 28 Memorandumului Street, 400114, Cluj-Napoca, Cluj ROMANIA {Emanuel.Puschita, Tudor.Palade, Ancuta.Moldovan, Rebeca.Colda, Irina.Vermesan}@com.utcluj.ro http://www.utcluj.ro/ Abstract: - Optimal resources management between application’s requests and network’s capability is determined by a human-device interaction, completing in this way the future architectural concept of developing inherent / integrated resource management capabilities inside the network elements. By aggregating and setting up QoS parametric dependencies between user’s needs and network’s context, resource management represents the guarantee for high performance network. Performing an analysis of application inter-frame delay and frame-size parameters – as the application’s requested parameters – upon the received signal level, retries rate, channel throughput, and loss rate of the RF network – as the network’s capabilities – the paper demonstrates that QoS parametric correlation can prove crucial on network resource management. Key-Words: - QoS parameters, network management, frame-size, inter-frame delay, received signal level, retry rate, channel throughput, loss rate 1 Introduction Deploying, implementing and controlling the parameters of a wireless networks is an elaborated task and even the smallest scenarios request for site survey, a challenging QoS (Quality of Services) resource management task inside the network. Although considered obsolete by some, due to the new types of self-configuring / auto-negotiating / self-managing devices, the network management is far from that simply because a device, although able to analyze and communicate with its peers, can’t understand the future application’s needs, further resources and network possibilities [1], [2]. Optimal application’s request vs. network’s capability will be somehow determined by a human- device interaction, even the future internet concepts developed inherent management capabilities for the network devices. In order to demonstrate that, the paper performs a site survey from a QoS resource management perspective in a WLAN (Wireless Local Area Network) particularly implementing the IEEE 802.11g standard recommendations. Chapter 2 describes some particular and practical aspects on QoS parameters and network resources management, indicating the need for QoS parametric correlation. Aggregating and setting up QoS parametric dependencies between user’s needs and network’s context – through a specific application QoS profile – resource management represents the guarantee for a high performance network services. Chapter 3 introduces the concept of network site survey and its various forms, four alternative types for extracting the QoS network parameters. Chapter 4 presents the design and correlation process of the RF (Radio Frequency) QoS network parameters in order to meet the application’s requests. There is performed an analysis of application inter-frame delay and frame-size parameters – as the application’s requested parameters – upon the received signal level, retries rate, channel throughput, and loss rate of the RF network – as the network’s capabilities. Pre-build theoretical surveys and post-build adjustment surveys were realized by using AirMagnet Survey and AirMagnet Laptop Analyzer, licensed industry-grade software tools. Scenario configuration and detailed results analysis is presented. Chapter 5 of the paper highlights some relevant conclusions invocating the QoS parametric correlation need for a reliable managed network. WSEAS TRANSACTIONS on COMMUNICATIONS Emanuel Puschita, Tudor Palade, Mihai Sarlea, Ancuta Moldovan, Rebeca Colda, Irina Vermesan ISSN: 1109-2742 573 Issue 9, Volume 9, September 2010
Transcript of QoS Parametric Correlation for Network … Parametric Correlation for Network Management, a Link...

QoS Parametric Correlation for Network Management, a Link between
Application’s Requests and Network’s Capabilities
EMANUEL PUSCHITA, TUDOR PALADE, MIHAI SARLEA, ANCUTA MOLDOVAN,
REBECA COLDA, IRINA VERMESAN
Communication Department
Technical University of Cluj-Napoca
28 Memorandumului Street, 400114, Cluj-Napoca, Cluj
ROMANIA
{Emanuel.Puschita, Tudor.Palade, Ancuta.Moldovan, Rebeca.Colda, Irina.Vermesan}@com.utcluj.ro
http://www.utcluj.ro/
Abstract: - Optimal resources management between application’s requests and network’s capability is
determined by a human-device interaction, completing in this way the future architectural concept of
developing inherent / integrated resource management capabilities inside the network elements. By aggregating
and setting up QoS parametric dependencies between user’s needs and network’s context, resource
management represents the guarantee for high performance network. Performing an analysis of application
inter-frame delay and frame-size parameters – as the application’s requested parameters – upon the received
signal level, retries rate, channel throughput, and loss rate of the RF network – as the network’s capabilities –
the paper demonstrates that QoS parametric correlation can prove crucial on network resource management.
Key-Words: - QoS parameters, network management, frame-size, inter-frame delay, received signal level, retry
rate, channel throughput, loss rate
1 Introduction Deploying, implementing and controlling the
parameters of a wireless networks is an elaborated
task and even the smallest scenarios request for site
survey, a challenging QoS (Quality of Services)
resource management task inside the network.
Although considered obsolete by some, due to
the new types of self-configuring / auto-negotiating
/ self-managing devices, the network management is
far from that simply because a device, although able
to analyze and communicate with its peers, can’t
understand the future application’s needs, further
resources and network possibilities [1], [2].
Optimal application’s request vs. network’s
capability will be somehow determined by a human-
device interaction, even the future internet concepts
developed inherent management capabilities for the
network devices.
In order to demonstrate that, the paper performs
a site survey from a QoS resource management
perspective in a WLAN (Wireless Local Area
Network) particularly implementing the IEEE
802.11g standard recommendations.
Chapter 2 describes some particular and practical
aspects on QoS parameters and network resources
management, indicating the need for QoS
parametric correlation.
Aggregating and setting up QoS parametric
dependencies between user’s needs and network’s
context – through a specific application QoS profile
– resource management represents the guarantee for
a high performance network services.
Chapter 3 introduces the concept of network site
survey and its various forms, four alternative types
for extracting the QoS network parameters.
Chapter 4 presents the design and correlation
process of the RF (Radio Frequency) QoS network
parameters in order to meet the application’s
requests.
There is performed an analysis of application
inter-frame delay and frame-size parameters – as the
application’s requested parameters – upon the
received signal level, retries rate, channel
throughput, and loss rate of the RF network – as the
network’s capabilities.
Pre-build theoretical surveys and post-build
adjustment surveys were realized by using
AirMagnet Survey and AirMagnet Laptop Analyzer,
licensed industry-grade software tools. Scenario
configuration and detailed results analysis is
presented.
Chapter 5 of the paper highlights some relevant
conclusions invocating the QoS parametric
correlation need for a reliable managed network.
WSEAS TRANSACTIONS on COMMUNICATIONSEmanuel Puschita, Tudor Palade, Mihai Sarlea, Ancuta Moldovan, Rebeca Colda, Irina Vermesan
ISSN: 1109-2742 573 Issue 9, Volume 9, September 2010
2 QoS Parameters and Network
Resource Management Considering the multitude of traffic types vehicle in
network segments (video on demand, voice over IP,
IPTV, video conference, file transfer etc.), there are
a number of QoS parameters that influences,
determines and affects the application’s
performances [3], hence the quality of the expected
services’ level in the network.
2.1 Quality of Services There is little consensus on the precise definition of
QoS. Researcher groups perceive and interpret QoS
term in different ways [4] [5]. In order to group this
point of views and to illustrate ITU, ETSI, and IETF
perspectives, a general QoS model presented in [6].
There are associated three notions of QoS
approach, defined in the general model:
- intrinsic QoS;
- perceived QoS;
- assessed QoS.
Intrinsic QoS is determined by the transport network
type and provisioning of network access. Perceived
QoS reflects user’s experience of using a particular
service and user’s expectations compared to
observed service performance. The assessed QoS
starts to be seen when the customer decides whether
to continue using the service or not.
The ITU and ETSI perspectives to QoS related
terminology are almost the same. Both
organizations adopted the same definition of QoS
concept, described first in [7] as “the collective
effect of service performance which determine the
degree of satisfaction of a user of the service”. QoS
in the ITU/ETSI vision adheres mainly to perceived
QoS rather than intrinsic QoS. IETF focuses on
intrinsic QoS and does not deal with perceived QoS.
QoS is understood by IETF as “a set of service
requirements to be met by the network while
transporting a flow” [8].
Analyzing the source that generates these factors
and analyzing their effects, we understand that QoS
problem has two distinctive issues:
- the network / infrastructure perspective
evaluated through an objective analysis;
- the service / application point of view
generated by a subjective perception.
From the network / infrastructure perspective, QoS
refers to the service quality or service level that the
network offers to applications or users in terms of
network QoS parameters, including: delay, jitter,
reliability of packet transmission, and channel
throughput.
From the service / application perspective QoS
generally refers to the application quality as
perceived by the client. That is, the presentation
quality of the video, the responsiveness of
interactive voice, and the sound quality of streaming
audio.
2.2 QoS Parameters Different traffic types have different requests for
resources to be allocated in the network segments,
requirements expressed in terms of the QoS
parameters.
The following parameters are relevant when
evaluate an application:
- throughput or channel capacity (BW);
- transmission delay or latency (Delay);
- delay variation (Jitter);
- loss or packet error rate (BER).
Table 1 illustrates some examples of different
application’s request, in a wireless system,
expressed in terms of QoS parameters.
Application
type
BW
(kb/s)
Delay
(ms)
Jitter
(ms)
BER
Broadcast/
Multicast
1-104
<2000 <500 <10-8
VoD 1-104 <2000 <500 <10
-7
VoIP 10-50 <50 <10 <10-6
Video
conference
100-
2·103
<150 <50 <10-7
Web traffic 50-
500
<500 <250 <10-7
File transfer 50-
500
<500 <250 <10-6
FTP 50-
500
<500 <250 <10-7
Table 1. Different application’s requests needed to
be accommodated in a wireless network
The network resources need to be distributed to all
applications in a way that simultaneously satisfies
all QoS requirements [9].
It is up to the application to request for resources
in the network, but it is up to the network to know
better its capabilities. Therefore, in order to better
satisfy the application’s requests for resources in the
network, the resource management system should
include application semantics description through
the QoS parameters and this is a very challenging
task.
WSEAS TRANSACTIONS on COMMUNICATIONSEmanuel Puschita, Tudor Palade, Mihai Sarlea, Ancuta Moldovan, Rebeca Colda, Irina Vermesan
ISSN: 1109-2742 574 Issue 9, Volume 9, September 2010

2.3 Network Resource Management It is a real debated issue whether QoS network
management is needed or no.
One opinion is that the transmission medium will
make bandwidth so abundant and cheap that QoS
support will be automatically delivered. The other
opinion is that no matter how much bandwidth the
networks can provide, new applications will be
designed to consume them; therefore, resource
management will still be needed to provide QoS
support [10].
Recent applications are associated with user
interactions, and the ability to browse different
scenarios at the same time. All these aspects made
the researchers look for other solutions in order to
assure a network resource management [11].
A first approach on provisioning support of
resources placed the QoS mechanism on the end-
system, including (1) source rate control, (2)
transfer rate adaptation, (3) packet error control, and
(4) retransmission [12] [13]. Many of these
mechanisms, from a QoS intrinsic perspective, can
be categorized as adaptive applications [14].
Another approach on provisioning management
of resources is to provide in the network a
mechanism based on QoS parameters monitoring
and correlation. In this approach, the network node
plays an active role in controlling and reporting to
the upper layers the end-to-end service quality. This
requires additional traffic control mechanisms to be
introduced, such as (1) admission control, (2) traffic
policing, (3) classification, and (4) traffic
scheduling.
IETF has proposed several service models and
mechanisms to meet the demand for QoS. As the
QoS parameters are determined and influenced by
each other, there must be identified a correlation
function, or link between application’s requests and
network’s capabilities.
In other words, in order to control the resources
of the network, the QoS resource management must
correlate the application’s QoS requested
parameters to the network context or capabilities.
The paper emphasizes the need for a thorough
site survey, both application perspective and
network point of view, prior to wireless network
deployment in the area to be covered.
Correlating QoS parameters trough a link
between application’s requests and network’s
capabilities, a more efficient QoS network resources
management is obtain.
In this context, performing theoretical, assisted,
and manual network site survey, the paper studies
the influence of the application frame size and inter-
frame delay variation, on received signal level,
retries rate, channel throughput, and loss rate as
network parameters.
These QoS parametric evaluations can prove
crucial when setting up a transmitter and can make
the difference between a working and a faulty
network.
3 Network Site Survey Implementing a new WLAN is an elaborated task
and even the smallest scenarios request for resource
management through the network site survey.
The consistence of a network site survey is a
problem that is more and more present in the minds
of troubled wireless network administrators and, as
speeds go up, so does the need for higher network
capacity or coverage, increase SNRs (Signal-to-
Noise Ratios) and reduce SIRs (Signal-to-
Interference Ratios) in order to support the
necessary modulations transmitting the all-so-
valuable bytes.
This is why, prior to network installation, RF
(Radio Frequency) network management that
performs the survey must ask some preliminary
questions on the following:
- how can the physical and RF environments
cope with the new wireless equipment;
- which are the needs of the organizations
where the wireless network is to be placed;
- what is the site survey location and sources
of interference;
- which are the coverage requirements and
application’s constrains;
- which are wired network characteristics that
is going to integrate the wireless equipment
needed;
- which are the applications characteristics and
corresponding network’s parameter
configuration in order to deliver the
requested services by the user.
3.1 Aspects of Site Surveying While it is more important to implement a WLAN
that meets the beneficiary’s needs than just merely
placing transmitters, the network site survey must be
well documented by listing the requirements and the
expectancies of both the users and the network
infrastructure. In this case, the first step is the
requirement analysis for resources.
The requirement analysis for resources must
correlate the user request for services (voice traffic,
multimedia application, ftp transfer etc.) with the
network’s parameters (transmission range, channel
WSEAS TRANSACTIONS on COMMUNICATIONSEmanuel Puschita, Tudor Palade, Mihai Sarlea, Ancuta Moldovan, Rebeca Colda, Irina Vermesan
ISSN: 1109-2742 575 Issue 9, Volume 9, September 2010
capacity, propagation losses, antenna gain etc). In a
wireless network, cell size could differ inside the
coverage area according to the user constrains. All
these indicate that a specific service request for a
specific network context.
Further, the network site survey analysis has to
move on to investigating the potential environment
context. Business requirements – generally these are
the most hard to meet – and functional requirements
– handles problems like roaming or quality of
services aspects – have to be discussed in parallel to
underlining budgetary, technical and regulatory
constraints [15].
In the mean time, the nature of the present core
network must be well understood and emphasized to
the customer as well as the realistic expectations for
the future wirleless network. The quality of wireless
access network it is strongly correlated with the
quality of the wired network. That is why the site
surveyor had to investigate if the selected equipment
can yield the needed results.
Concluding, the pre-site survey form along with
the collected information on network and users
should provide a good image of the needs and
possibilities.
3.2 Types of Network Site Survey Network site survey must supply enough
information to accurately locate, install, and
configure the RF parameters of the APs (Access
Points) transmitters and antennas, which will have
to provide the required coverage and performance
defined in the wireless network design [16].
Introducing site survey for wireless network
design and resource management, the idea focuses
on one of the four basic types: manual, automated,
assisted and theoretical. Each of these has some
specific goal and, quite naturally its pros and cons.
3.2.1 Manual Site Survey
This is the main and most thorough method and it
requires physically being at the location and taking
actual RF signal level measurements throughout the
site.
Walkabouts on logical paths throughout the site
are performed right after having initially placed an
AP with an attached transmitting antenna. This is
obviously the most accurate method, apart from
requiring a lot of RF signal propagation knowledge
[15], [16].
In the mean time it is the most time consuming
but it can be performed with laptops or handhelds
running specialized for spectral analysis.
3.2.2 Automated Site Survey
Attempting to make wireless networks installation
easier – and more accessible to the RF – the
automated site survey promotes the idea of placing
an AP on the site based strictly on the location and
density of users and having it self-configured and
self-managed [16].
This is a tricky method as it can lead to
redundant APs being placed – resulting in excessive
cost – or poor coverage in case of AP deficit. In the
mean time, not all the RF path to the destination
could be modeled, consequently interference and
channel access retries occurs.
3.2.3 Assisted Site Survey
Assisted site survey is basically consists in a mix of
totally manual and totally automated surveys,
considering only the advantages from each of the
aforementioned. Still, some manual surveying and
minimal RF considerations about antennas and
propagation is required for the initial design.
However this survey type is not always suitable as it
can lead to poor RF coverage, or increase
inexplicably the cost of the survey and gear to be
bought [16].
The idea is to take manual measurements in
selected areas and then, logically extrapolate the
results for the rest of the site under survey. Finally a
walkabout is done alongside a client that will use
the wireless network to be deployed. The obtained
data on overall link performance is passed to the
configuration system that makes the final
adjustments in the APs configuration.
3.2.4 Theoretical Site Survey
In order to avoid time consuming walkabout
surveys, tools that provide theoretical RF coverage
plans for wireless network have been developed.
To use a theoretical tool, input such as an aerial
photo or scaled or scanned blueprints of the site is
required instead of the physical on site activity.
Descriptions of the construction and contents as
well as the attenuation factors entered into the
system are required [16].
Propagation models, types of antennas and
transmitter location further to be used into the
program are also input and the system will
determine theoretical RF patterns to be used in the
site. A graphical representation of the coverage and
capacity can be viewed and analyzed. Tools that
perform such analysis are quite accurate, but very
expensive. It is good to remember that the results
are only estimations.
WSEAS TRANSACTIONS on COMMUNICATIONSEmanuel Puschita, Tudor Palade, Mihai Sarlea, Ancuta Moldovan, Rebeca Colda, Irina Vermesan
ISSN: 1109-2742 576 Issue 9, Volume 9, September 2010

4 Site Survey and Network
Performance Analysis The present paper emphasizes the need for a
thorough network site survey, both network and
application perspective, prior to WLAN deployment
in the area to be covered.
Coverage and performance include some
minimum network value at all defined user locations
and requests application constraints for services
delivery.
In the mean time, a network site survey should
include a report detailing other interference or
competing RF signals.
Recommendation for proper placement,
mounting, and configuration of APs and antennas to
mitigate these competing RF signals is another
requirement of the network site survey.
4.1 Site Survey Tools In order to analyze the influence of inter-frame
delay and frame-size application’s parameters upon
the received signal level, retries rate, channel
throughput, and loss rate network’s parameters, pre-
build theoretical surveys and post-build adjustment
were performed by using license AirMagnet Survey
[17] and AirMagnet Laptop Analyzer [18] tools.
Fig. 1 Passive coverage area for the tested area
AirMagnet mainly supplies two modes for
collecting survey data:
- passive mode;
- active mode.
Passive mode allows the access client to measures
the RSSI (Received Signal Strength Indicator) level
of the radios sent by the AP in the network.
This mode is mostly useful for post-install
operations, measuring parameters like signal levels,
SNR, interference levels and frame delays. Fig. 1
presents the signal level distribution in case of a
passive coverage mode. Active mode allows the
access client to associate to an AP and send round-
trip data packets.
This is the closest simulation to a real wireless
network environment, making it appropriate for
initial AP surveys and alongside the planner a vital
tool for pre-install operations.
The active operation mode offers parameters like
signal strength, channel capacity and SNR when a
station connects to a specific AP or a predefined
SSID (Service Set IDentifier).
For this mode, the client associates to the most
suitable AP detected by the integrated sniffer while
roaming through the scenario facility.
The status panel always displays the SSID and
MAC (Medium Access Control) as identifiers of the
attached AP.
WSEAS TRANSACTIONS on COMMUNICATIONSEmanuel Puschita, Tudor Palade, Mihai Sarlea, Ancuta Moldovan, Rebeca Colda, Irina Vermesan
ISSN: 1109-2742 577 Issue 9, Volume 9, September 2010

4.2 Analyzed QoS Parameters The paper analyses the frame size and the inter-
frame delay as QoS requested parameters by the
application.
The application frame size through the RF
environment can be controlled by the fragmentation
threshold.
The inter-frame delay is set by the application
layer and is actually the transmission rate for new
frames that are going to receive lower network layer
overheads and transmitted through the channel.
4.3 Test Scenario Description The test scenario consists of wireless Cisco AIR-
CB21AG clients linked to Cisco Aironet 1200 Series
access points. The APs are equipped with a Cisco
Aironet 5.2-dBi omnidirectional ceiling mount
antenna – AIR-ANT1728 – and a Cisco Aironet 14-
dBi vertically polarized sector antenna – AIR-
ANT2414S-R. The facility blueprint of the area,
indicated by Fig. 2, presents the location of the APs.
Sector antenna is attached to the AP1 (x=34.9 m,
y=2.25 m), while omnidirectional antenna is attached
to AP2 (x=25.8 m, y=16 m).
Fig. 2 APs placements within the premises
There are defined five measurements points of
analysis used to evaluate the QoS application’s
requests with network performance for each
network site survey type, as presented in Fig. 3.
Fig. 3 Analysis / measurement points
Performing theoretical, assisted and manual
network site survey by using dedicated presented
software tools facilities, the paper studies the
influence of frame size and inter-frame delay
variation for a wireless network implementing IEEE
802.11g standard recommendations.
WSEAS TRANSACTIONS on COMMUNICATIONSEmanuel Puschita, Tudor Palade, Mihai Sarlea, Ancuta Moldovan, Rebeca Colda, Irina Vermesan
ISSN: 1109-2742 578 Issue 9, Volume 9, September 2010
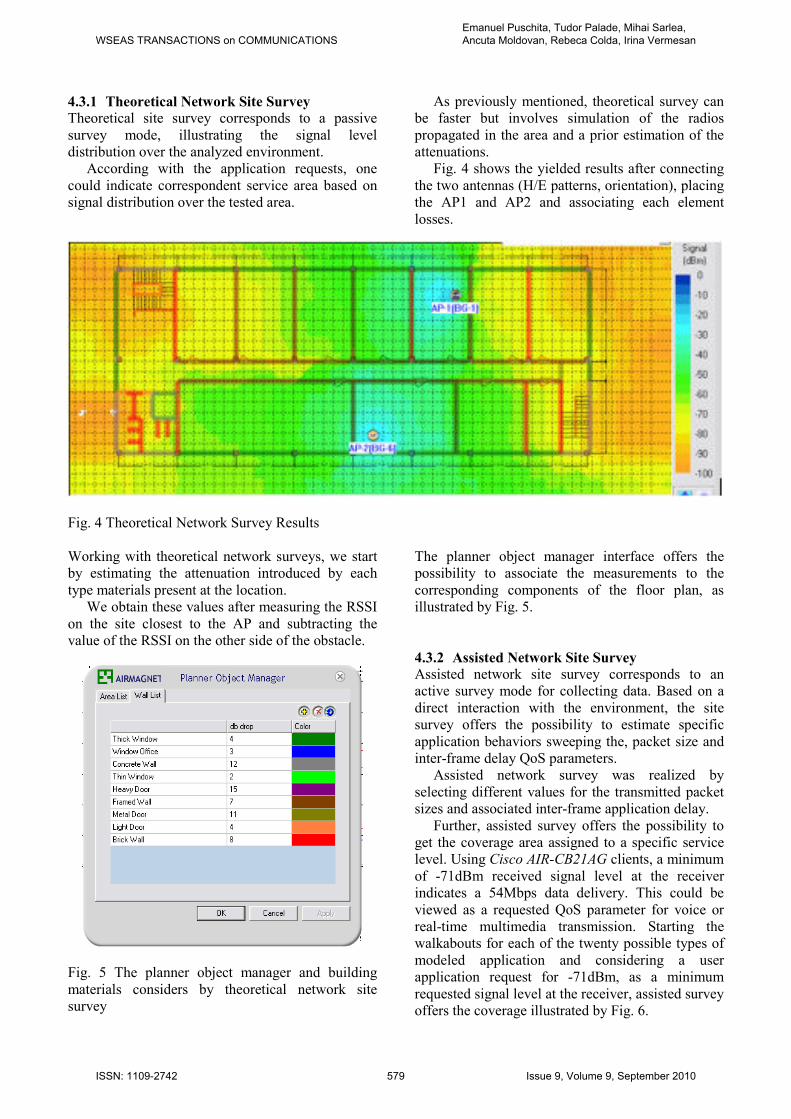
4.3.1 Theoretical Network Site Survey
Theoretical site survey corresponds to a passive
survey mode, illustrating the signal level
distribution over the analyzed environment.
According with the application requests, one
could indicate correspondent service area based on
signal distribution over the tested area.
As previously mentioned, theoretical survey can
be faster but involves simulation of the radios
propagated in the area and a prior estimation of the
attenuations.
Fig. 4 shows the yielded results after connecting
the two antennas (H/E patterns, orientation), placing
the AP1 and AP2 and associating each element
losses.
Fig. 4 Theoretical Network Survey Results
Working with theoretical network surveys, we start
by estimating the attenuation introduced by each
type materials present at the location.
We obtain these values after measuring the RSSI
on the site closest to the AP and subtracting the
value of the RSSI on the other side of the obstacle.
Fig. 5 The planner object manager and building
materials considers by theoretical network site
survey
The planner object manager interface offers the
possibility to associate the measurements to the
corresponding components of the floor plan, as
illustrated by Fig. 5.
4.3.2 Assisted Network Site Survey
Assisted network site survey corresponds to an
active survey mode for collecting data. Based on a
direct interaction with the environment, the site
survey offers the possibility to estimate specific
application behaviors sweeping the, packet size and
inter-frame delay QoS parameters.
Assisted network survey was realized by
selecting different values for the transmitted packet
sizes and associated inter-frame application delay.
Further, assisted survey offers the possibility to
get the coverage area assigned to a specific service
level. Using Cisco AIR-CB21AG clients, a minimum
of -71dBm received signal level at the receiver
indicates a 54Mbps data delivery. This could be
viewed as a requested QoS parameter for voice or
real-time multimedia transmission. Starting the
walkabouts for each of the twenty possible types of
modeled application and considering a user
application request for -71dBm, as a minimum
requested signal level at the receiver, assisted survey
offers the coverage illustrated by Fig. 6.
WSEAS TRANSACTIONS on COMMUNICATIONSEmanuel Puschita, Tudor Palade, Mihai Sarlea, Ancuta Moldovan, Rebeca Colda, Irina Vermesan
ISSN: 1109-2742 579 Issue 9, Volume 9, September 2010
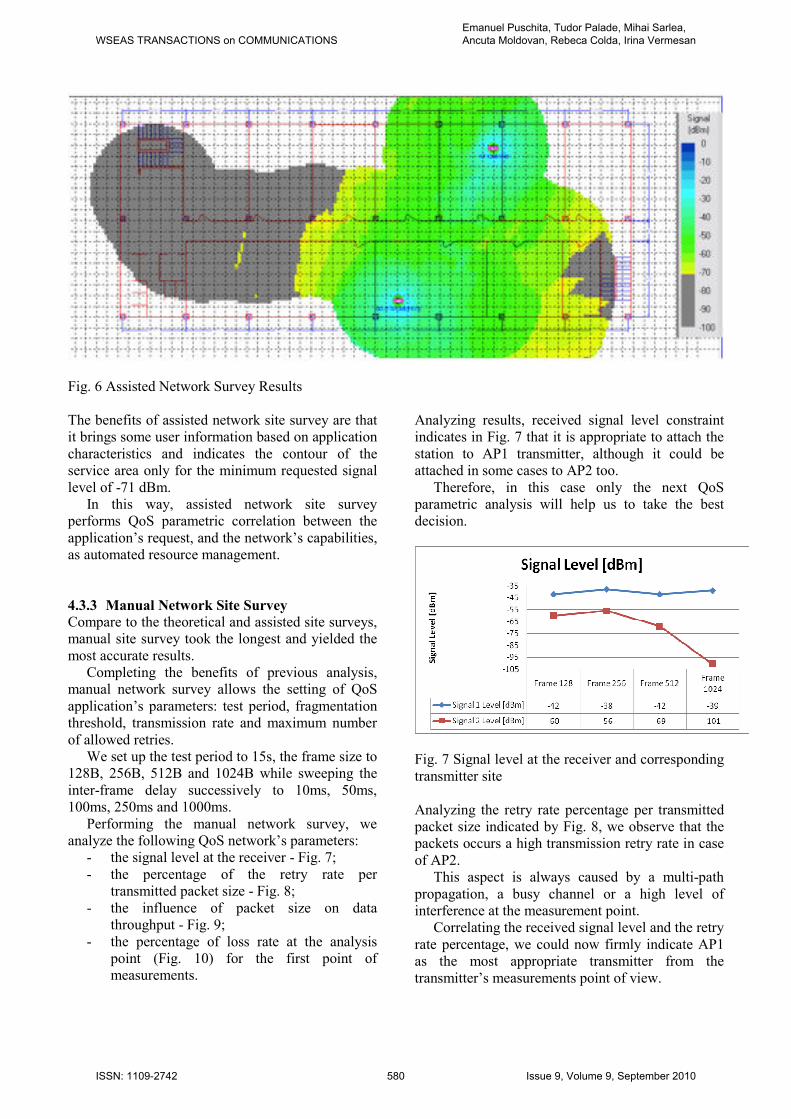
Fig. 6 Assisted Network Survey Results
The benefits of assisted network site survey are that
it brings some user information based on application
characteristics and indicates the contour of the
service area only for the minimum requested signal
level of -71 dBm.
In this way, assisted network site survey
performs QoS parametric correlation between the
application’s request, and the network’s capabilities,
as automated resource management.
4.3.3 Manual Network Site Survey
Compare to the theoretical and assisted site surveys,
manual site survey took the longest and yielded the
most accurate results.
Completing the benefits of previous analysis,
manual network survey allows the setting of QoS
application’s parameters: test period, fragmentation
threshold, transmission rate and maximum number
of allowed retries.
We set up the test period to 15s, the frame size to
128B, 256B, 512B and 1024B while sweeping the
inter-frame delay successively to 10ms, 50ms,
100ms, 250ms and 1000ms.
Performing the manual network survey, we
analyze the following QoS network’s parameters:
- the signal level at the receiver - Fig. 7;
- the percentage of the retry rate per
transmitted packet size - Fig. 8;
- the influence of packet size on data
throughput - Fig. 9;
- the percentage of loss rate at the analysis
point (Fig. 10) for the first point of
measurements.
Analyzing results, received signal level constraint
indicates in Fig. 7 that it is appropriate to attach the
station to AP1 transmitter, although it could be
attached in some cases to AP2 too.
Therefore, in this case only the next QoS
parametric analysis will help us to take the best
decision.
Fig. 7 Signal level at the receiver and corresponding
transmitter site
Analyzing the retry rate percentage per transmitted
packet size indicated by Fig. 8, we observe that the
packets occurs a high transmission retry rate in case
of AP2.
This aspect is always caused by a multi-path
propagation, a busy channel or a high level of
interference at the measurement point.
Correlating the received signal level and the retry
rate percentage, we could now firmly indicate AP1
as the most appropriate transmitter from the
transmitter’s measurements point of view.
WSEAS TRANSACTIONS on COMMUNICATIONSEmanuel Puschita, Tudor Palade, Mihai Sarlea, Ancuta Moldovan, Rebeca Colda, Irina Vermesan
ISSN: 1109-2742 580 Issue 9, Volume 9, September 2010

Fig. 8 Retry rate per transmitted packet size
A parallel analysis of data throughput over the retry
rate percentage reveals the cost for larger fragments
size presented in Fig. 9 – a busy channel mostly
charge with control information and access
transmission requests. Despite of that, one could
assume a higher retry rate for a higher data rate.
Fig. 9 Influence of frame size on data rate
Results analysis of loss rate percentage presented in
Fig. 10 indicate the best fragment size as 256B and
reconfirm the AP1 transmitting site selection.
Fig. 10 Loss rate and corresponding frame sizes
In the mean time, according to our initial imposed
requirements, we could affirm that AP1 is the
selected transmitting site and a 256B packet is the
most appropriate fragment size for our scenario.
Traffic QoS parameter analysis – based on
signal measurements at the receiver, percentage of
the retry rate per transmitted packet size, influence
of packet size on data rate, and percentage of loss
rate at the analysis point – reveals that resource
management must be performed not only form the
network perspective, but from the application point
of view too.
Used network survey analyzing tool permits the
variation of transmitting inter-frame delay as the
QoS application parameter, as presented in Fig. 11.
Fig. 11 Inter-frame application transmitting delay
QoS parametric analysis reveals that the
application’s performances are independent with the
inter-frame transmission delay.
Consequently, the critical problems in our
scenario are the sources of interference and
multipath propagation reflected by a high retry rate
and loss rate.
5 Conclusion Although considered obsolete by some, due to the
new types of self-configuring / auto-negotiating /
self-managing devices, the network management is
far from that, simply because a device, although
able to analyze and communicate with its peers
can’t understand the future user’s needs and further
network possibilities, in terms of allocating
network’s resources and considering application’s
requests
In this context, the paper emphasizes the need for
a thorough QoS resource management, both
application perspective and network point of view,
prior to wireless network deployment in the area to
be covered.
WSEAS TRANSACTIONS on COMMUNICATIONSEmanuel Puschita, Tudor Palade, Mihai Sarlea, Ancuta Moldovan, Rebeca Colda, Irina Vermesan
ISSN: 1109-2742 581 Issue 9, Volume 9, September 2010
Performing theoretical assisted and manual
network site surveys, the paper studies the influence
of the application frame size and inter-frame delay
variation – as the application’s QoS requested
parameters – on received signal level, retries rate,
channel throughput, and loss rate as network
parameters – as the network’s capabilities.
Measured and analyzed parameters confirms the
need for QoS parametric correlation between the
application requests and network capabilities, while
a manual site survey offers the most appropriate
network resource management scenario.
Acknowledgment:
This paper was supported by the project "Develop
and support multidisciplinary postdoctoral programs
in primordial technical areas of national strategy of
the research - development - innovation" 4D-
POSTDOC, contract nr. POSDRU/89/1.5/S/52603,
project co-funded from European Social Fund
through Sectorial Operational Program Human
Resources 2007-2013. In the mean time, the
logistics costs of the work was supported by
CNCSIS-UEFISCSU, project number PN II-RU
613/2010.
References:
[1] S.S. Tata, R. Srinivasa, Network Management
Solution, Proceedings of the 2007 WSEAS
International Conference on Computer
Engineering and Applications, Gold Coast,
Australia, January 17-19, 2007, pp. 331-336.
[2] Z. Bojkovic, B. Bakmaz, Quality of Service
and Security as Frameworks toward Next-
Generation Wireless Networks, WSEAS
Transactions on Communications, vol. 4, no. 4,
Apr. 2005, pp. 147-152.
[3] T. Fencil, J. Bilek, Network Optimisation,
Proceedings of the 7th WSEAS International
Conference on Applied Informatics and
Communications, Athens, Greece, August 24-
26, 2007, pp.92-97
[4] J. Gozdecki, A. Jajszczyk, R. Stankiewicz,
Quality of service terminology in IP networks,
IEEE Communications Magazine, Volume 41,
Number 3, March 2003, pp. 153-159.
[5] ISO 8402, Quality Management and Quality
Assurance - Vocabulary, 1994.
[6] W. C. Hardy, QoS: QoS Measurement and
Evaluation of Telecommunications Quality of
Service, John Wiley & Sons, 2001.
[7] ITU-T Rec. E.800, Terms and Definitions
Related to Quality of Service and Network
Performance Including Dependability, 1993.
[8] E. Crawley, et al., A Framework for QoS-Based
Routing in the Internet, IETF RFC 2386, 1998.
[9] D. Trcek, Managing Trust in Services Oriented
Architectures, Proceedings of the 8th WSEAS
International Conference on APPLIED
INFORMATICS AND COMMUNICATIONS
(AIC’08), Rhodes, Greece, August 20-22, 2008,
pp. 23-28.
[10] R. Join, Myths about Congestion Management
in High Speed Networks, Internetworking
Research, Volume 3, 1992, pp. 101-13.
[11] Z. Bojkovic, B. Bakmaz, M. Backmaz,
Multimedia Traffic in New Generation
Networks: Requirements, Control and
Modeling, Proceedings of the 13th WSEAS
International Conference on
COMMUNICATIONS, pp.124-130.
[12] J-C. Bolot, T. Turletti, Experience with rate
control mechanisms for packet video in the
Internet, Computer Communication Review,
Volume 28, Number 1, September 1998.
[13] R. Rejaie, M. Handley, D. Estrin, RAP: An
end-to-end rate-based congestion control
mechanism for real-time streams in the
Internet, IEEE INFOCOMM, March 1999.
[14] S. Shenker, Fundamental design issues for the
future Internet, IEEE Journal on Selected
Areas in Communications, Volume 13, Number
7, September 1995, pp. 1176–1188.
[15] A. E. Bruce, 802.11 Wireless Network Site
Surveying and Installation, Cisco Press,
November 2004.
[16] T. Carpenter, CWNA Certified Wireless
Network Administrator Official Study Guide,
4th Edition, McGraw-Hill, August 2007.
[17] ***AirMagnet, AirMagnet Survey/Planner
User Guide, AirMagnet Inc., 2007.
[18] ***AirMagnet, AirMagent Laptop Wireless
LAN Analyzer User Guide, AirMagnet, Inc.,
2007.
WSEAS TRANSACTIONS on COMMUNICATIONSEmanuel Puschita, Tudor Palade, Mihai Sarlea, Ancuta Moldovan, Rebeca Colda, Irina Vermesan
ISSN: 1109-2742 582 Issue 9, Volume 9, September 2010