Dynamic routing – QoS routing Load sensitive routing QoS routing.
Upload
priyanka-bhardwajCategory
view
218download
0
8/4/2019 Qos Assgnmt_syndicate No.8
http://slidepdf.com/reader/full/qos-assgnmtsyndicate-no8 1/18
QUALITY OF SERVICEASSIGNMENT
QOS PARAMETERSFOR
MADHYA PRADESH AND CHATTISGARH CIRCLE
SUBMITTED BY:SYNDICATE NO.8
Hemant Mawar-10020541086
Mayank-10020541087
Neeraj Kumar-10020541091
Sunil Padma-10020541097
Priyanka Bharadwaj-10020541098
Sandeep Patil-10020541106

8/4/2019 Qos Assgnmt_syndicate No.8
http://slidepdf.com/reader/full/qos-assgnmtsyndicate-no8 2/18
QUALITY OF SERVICE
Page 2
Introduction
In the Third quarter (1st July to 30th September) of 2009, we have carried out thecustomer satisfaction survey in Madhya Pradesh circle.
Four basic telephone service providers present in the circle as on May 2009 date have
been covered. Across 37 cities of Madhya Pradesh circle, a sample of 2,888 basic wire>linecustomers has been covered. Of this sample, 2,775 were postpaid customers and 113 wereprepaid customers.
Seven cellular mobile telephone service providers present in the circle as on May 2009have been covered. Across 7 cities of Madhya Pradesh circle, a sample of 4,825 cellular mobilephone customers was covered. Of this, 3,141 were prepaid customers and 1,684 were postpaidcustomers.
Five broadband service providers present in the circle as on May 2009 have beencovered. Across various points of presence of the Madhya Pradesh circle, a sample of 2,741broadband customers was covered. Of this, 2,337 were postpaid customers and 404 were
prepaid customers.
Satisfaction on the Quality of Service parameters as laid down by TRAI, namely…
Provision of service (activation/ reactivation) Billing performance Help services including customer grievance redressal Network performance, reliability and availability Maintainability Supplementary and value added service Overall service quality
Survey Objectives
The objective of this customer satisfaction survey is to measure the level of satisfaction amongcustomers with respect to:
Provision of service Billing performance Help services including customer grievance redressal Network performance, reliability and availability Maintainability Supplementary and value added service Overall service quality
8/4/2019 Qos Assgnmt_syndicate No.8
http://slidepdf.com/reader/full/qos-assgnmtsyndicate-no8 3/18
QUALITY OF SERVICE
Page 3
Survey Methodology
The survey was conducted through personal, telephonic and Internet based interviews.
In the survey of basic telephone service and cellular mobile service customers, 75% of thesample was covered with the help of personal interviews while the balance interviews weredone on telephone.
The identity of respondents was recorded in the questionnaires and the signatures of thecustomers who were surveyed through personal interviews were taken on the surveyquestionnaires. The questionnaires were filled up using a ballpoint pen.
In the broadband service survey, 50% of the sample was covered through face>to>faceinterviews and upto 50% through a web>based survey. We used our proprietary web>basedsurvey editor to host the survey on the Internet. After sending these invitations, follow upphone calls were made to drive respondents to the survey.
Coverage of the Survey
In the Third quarter (1st July to 30th September) of 2009, we conducted the Customer SatisfactionSurvey (CSS) in Madhya Pradesh circle. The following service providers have been covered in theMadhya Pradesh circle.
Basic Telephone (Wire+line) Service1. Bharti Airtel Limited2. Bharat Sanchar Nigam Limited3. Reliance Communications4. Tata Teleservices Limited
Cellular (including FWP) Service1. Bharti Airtel Limited2. Bharat Sanchar Nigam Limited3. Reliance Communications
4. Tata Teleservices Limited5. Reliance Telecom Limited6. Idea Cellular Limited7. Vodafone Essar Mobile Services Limited
Broadband Service1. Bharat Sanchar Nigam Limited
8/4/2019 Qos Assgnmt_syndicate No.8
http://slidepdf.com/reader/full/qos-assgnmtsyndicate-no8 4/18
QUALITY OF SERVICE
Page 4
2. Tata Communications3. Bharti Airtel Limited4. Reliance Communications5. Sify Technologies Limited
Respondent Profile
The random sample included both prepaid & postpaid customers in the household andcommercial segments.
Individual/ Household users
Only those above the age of 18 years were interviewed.Actual users of basic telephone service, mobile or broadband services were interviewed
Commercial usersIn case of the basic telephone service survey, the administration or accounts executive/manager or whoever takes care of basic telephone service related issues was interviewed. Incase of the broadband survey, the head/manager of the IT/MIS Department or theadministration or accounts executive/ manager was covered. In case, there was no such person,then the CEO/ MD/ owner of the firm were interviewed.
Sampling Methodology & Coverage
A set of residential and commercial areas were identified for this survey. Random sampling was done inthe selected areas to select the respondents.
Basic Telephone (Wire+line) Service:Database obtained from the service providers was used in case of private operators,while for BSNL, door to door (in residential areas) and office>to>office (in commercial areas)survey was carried out.
The sample for basic service customers was evenly spread across 5% of the exchanges of eachBSO in the circle. These exchanges were covered in urban and rural areas. The stated 5%exchanges were evenly spread over 10% of SDCAs for each BSO
Methodology for Calculating Percentage of Customer SatisfiedTo measure the percentage of customer satisfied, we have taken into account the total
percentage of satisfied customer’s i.e. very satisfied and satisfied customers on variousparameters of customer perception of service.

8/4/2019 Qos Assgnmt_syndicate No.8
http://slidepdf.com/reader/full/qos-assgnmtsyndicate-no8 5/18
QUALITY OF SERVICE
Page 5
Explanation of Benchmarks
TRAI has laid down benchmarks on Customer Perception of Service for the service providers of Basic Telephone, Cellular Mobile and Broadband service.
The purpose of laying down these benchmarks was to protect the interest of consumersof telecommunication services and to create conditions for consumer satisfaction by makingknown the quality of service that the service providers are required to provide and the user hasa right to expect.
All service providers have to follow these benchmarks. The following are the benchmarks laiddown by TRAI.
Basic Telephone Service
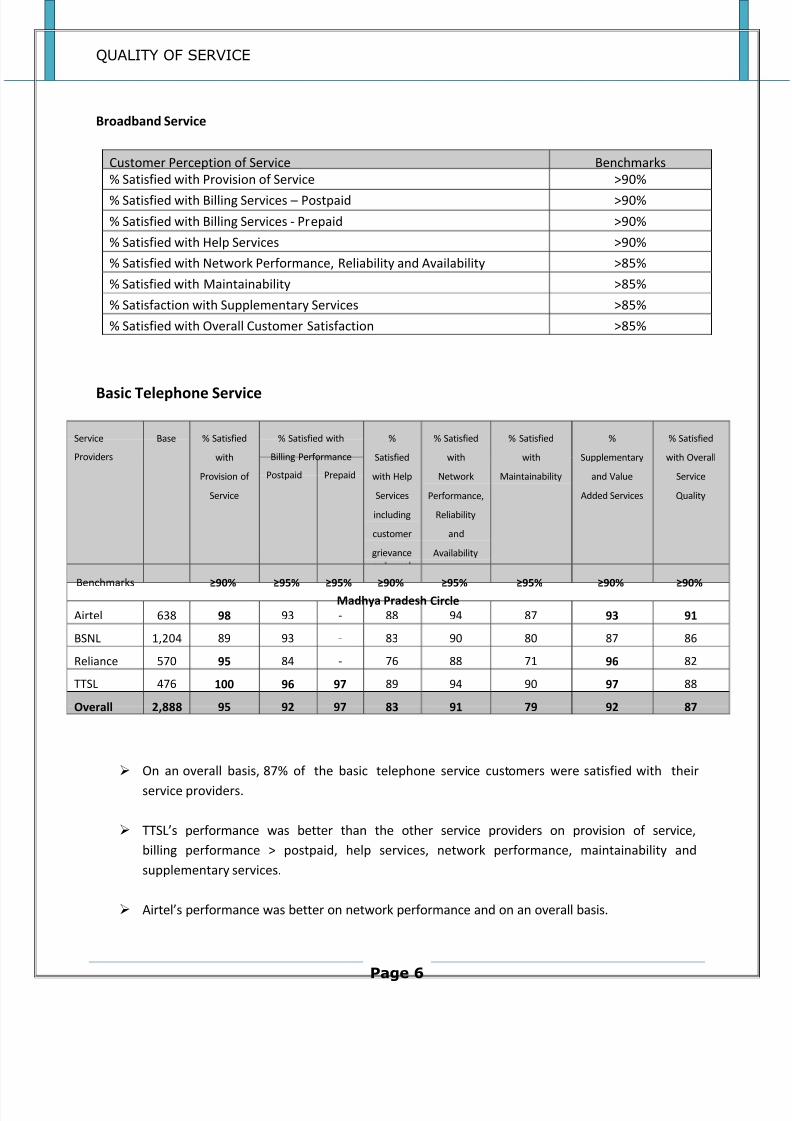
Customer Perception of Service Benchmarks % Satisfied with Provision of Service >90% % Satisfied with Billing Services – Postpaid >95% % Satisfied with Billing Services - Prepaid >95% % Satisfied with Help Services including customer grievance redressal >90% % Satisfied with Network Performance, Reliability and Availability >95% % Satisfied with Maintainability >90%
% Satisfaction with Supplementary and Value Added Services >95% % Satisfied with Overall Service Quality >90%
Cellular Mobile Service
Customer Perception of Service Benchmarks % Satisfied with Provision of Service >90% % Satisfied with Billing Services – Postpaid >95%
% Satisfied with Billing Services - Prepaid >95% % Satisfied with Help Services including customer grievance redressal >90% % Satisfied with Network Performance, Reliability and Availability >95% % Satisfied with Maintainability >90% % Satisfaction with Supplementary and Value Added Services >95% % Satisfied with Overall Service Quality >90%
8/4/2019 Qos Assgnmt_syndicate No.8
http://slidepdf.com/reader/full/qos-assgnmtsyndicate-no8 6/18
QUALITY OF SERVICE
Page 6
Broadband Service
Customer Perception of Service Benchmarks % Satisfied with Provision of Service >90%
% Satisfied with Billing Services – Postpaid >90% % Satisfied with Billing Services - Prepaid >90% % Satisfied with Help Services >90% % Satisfied with Network Performance, Reliability and Availability >85% % Satisfied with Maintainability >85% % Satisfaction with Supplementary Services >85% % Satisfied with Overall Customer Satisfaction >85%
Basic Telephone Service
Service
Providers Base % Satisfied
with
Provision of
Service
% Satisfied with
Billing Performance %
Satisfied
with Help
Services
including
customer
grievance
% Satisfied
with
Network
Performance,
Reliability
and
Availability
% Satisfied
with
Maintainability
%
Supplementary
and Value
Added Services
% Satisfied
with Overall
Service
Quality Postpaid Prepaid
Benchmarks ≥90% ≥95% ≥95% ≥90% ≥95% ≥95% ≥90% ≥90% Madhya Pradesh Circle
Airtel 638 98 93 - 88 94 87 93 91
BSNL 1,204 89 93 - 83 90 80 87 86
Reliance 570 95 84 - 76 88 71 96 82
TTSL 476 100 96 97 89 94 90 97 88
Overall 2,888 95 92 97 83 91 79 92 87
On an overall basis, 87% of the basic telephone service customers were satisfied with their
service providers.
TTSL’s performance was better than the other service providers on provision of service,billing performance > postpaid, help services, network performance, maintainability andsupplementary services.
Airtel’s performance was better on network performance and on an overall basis.
8/4/2019 Qos Assgnmt_syndicate No.8
http://slidepdf.com/reader/full/qos-assgnmtsyndicate-no8 7/18
QUALITY OF SERVICE
Page 7
All the service providers had a lower score with respect to maintainability.
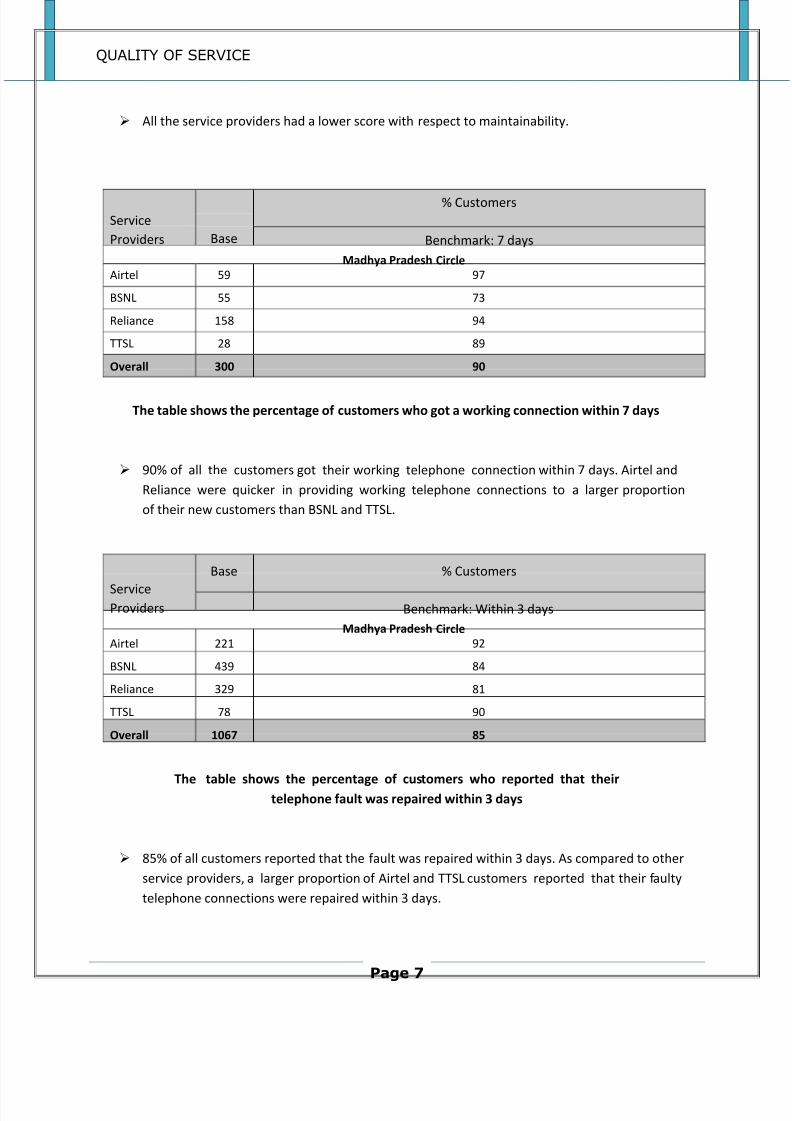
ServiceProviders Base
% Customers
Benchmark: 7 days Madhya Pradesh Circle
Airtel 59 97
BSNL 55 73
Reliance 158 94
TTSL 28 89
Overall 300 90
The table shows the percentage of customers who got a working connection within 7 days
90% of all the customers got their working telephone connection within 7 days. Airtel andReliance were quicker in providing working telephone connections to a larger proportionof their new customers than BSNL and TTSL.
ServiceProviders
Base % Customers
Benchmark: Within 3 days Madhya Pradesh Circle
Airtel 221 92
BSNL 439 84
Reliance 329 81
TTSL 78 90
Overall 1067 85
The table shows the percentage of customers who reported that theirtelephone fault was repaired within 3 days
85% of all customers reported that the fault was repaired within 3 days. As compared to otherservice providers, a larger proportion of Airtel and TTSL customers reported that their faultytelephone connections were repaired within 3 days.

8/4/2019 Qos Assgnmt_syndicate No.8
http://slidepdf.com/reader/full/qos-assgnmtsyndicate-no8 8/18
QUALITY OF SERVICE
Page 8
ServiceProviders
Base % Customers
Benchmark: Within 7 day Madhya Pradesh Circle
Airtel 36 56
BSNL 7 43
Reliance 44 70
TTSL 13 85
Overall 100 65
The table shows the percentage of customers who reported that theirtelephone service was terminated within 7 days on request
65% of customers reported that their telephone connection was terminated within 7 days afterthey request for termination. 85% of the TTSL customers got their telephone connectionterminated within the benchmark duration.
ServiceProviders
Base % Customers
Benchmark: Within 4 weeks
Madhya Pradesh Circle Airtel 56 48
BSNL 126 69
Reliance 82 37
TTSL 14 64
Overall 278 55
The table shows the percentage of customers who reported that their billingcomplaints were resolved by call centre within four weeks
Only 55% of all customers reported that their complaints were resolved within 4 weeks afterthey lodged their complaints.
Only 37% of the Reliance’s customer complaints were resolved with 4 weeks.
8/4/2019 Qos Assgnmt_syndicate No.8
http://slidepdf.com/reader/full/qos-assgnmtsyndicate-no8 9/18
QUALITY OF SERVICE
Page 9
Cellular Mobile Service
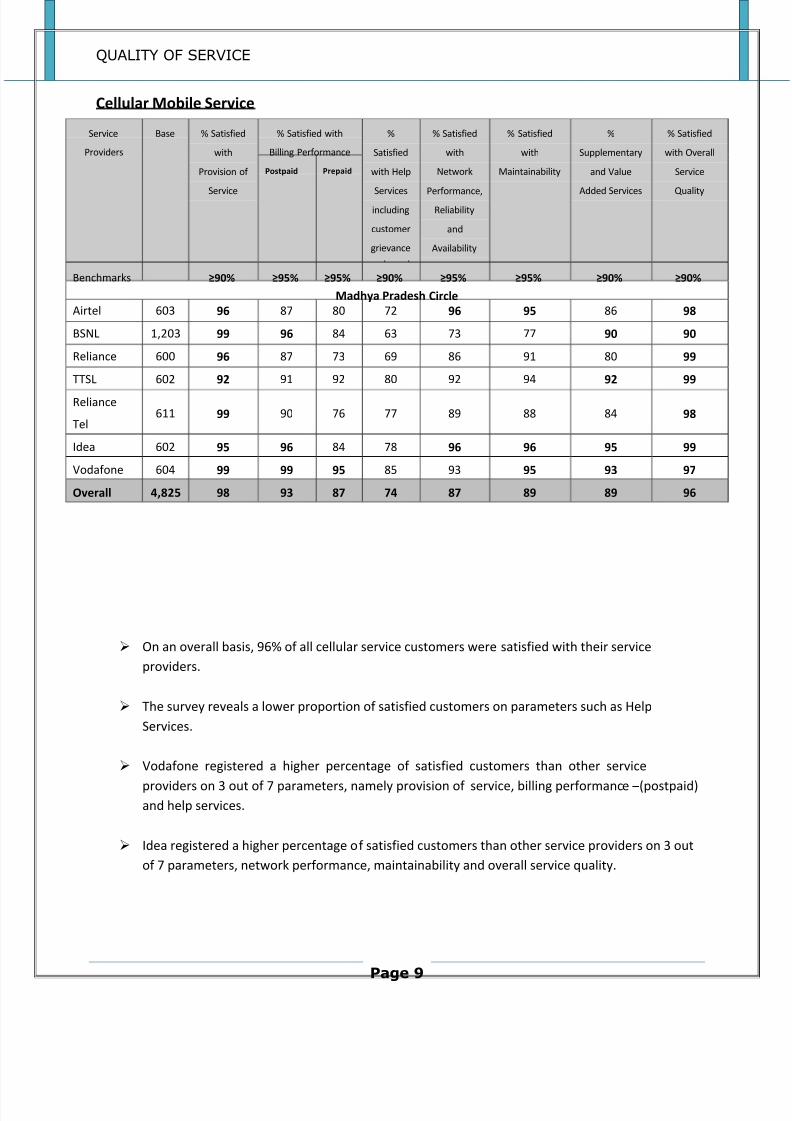
On an overall basis, 96% of all cellular service customers were satisfied with their serviceproviders.
The survey reveals a lower proportion of satisfied customers on parameters such as HelpServices.
Vodafone registered a higher percentage of satisfied customers than other service
providers on 3 out of 7 parameters, namely provision of service, billing performance –(postpaid)and help services.
Idea registered a higher percentage of satisfied customers than other service providers on 3 outof 7 parameters, network performance, maintainability and overall service quality.
Service
Providers Base % Satisfied
with
Provision of
Service
% Satisfied with
Billing Performance %
Satisfied
with Help
Services
including
customer
grievance
% Satisfied
with
Network
Performance,
Reliability
and
Availability
% Satisfied
with
Maintainability
%
Supplementary
and Value
Added Services
% Satisfied
with Overall
Service
Quality
Postpaid Prepaid
Benchmarks ≥90% ≥95% ≥95% ≥90% ≥95% ≥95% ≥90% ≥90% Madhya Pradesh Circle
Airtel 603 96 87 80 72 96 95 86 98
BSNL 1,203 99 96 84 63 73 77 90 90
Reliance 600 96 87 73 69 86 91 80 99
TTSL 602 92 91 92 80 92 94 92 99
Reliance
Tel 611 99 90 76 77 89 88 84 98
Idea 602 95 96 84 78 96 96 95 99
Vodafone 604 99 99 95 85 93 95 93 97
Overall 4,825 98 93 87 74 87 89 89 96

8/4/2019 Qos Assgnmt_syndicate No.8
http://slidepdf.com/reader/full/qos-assgnmtsyndicate-no8 10/18
QUALITY OF SERVICE
Page
10
ServiceProviders
Base % Customer
Benchmark: Four Weeks Madhya Pradesh Circle
Airtel 69 41
BSNL 27 41 Reliance 34 44
TTSL 25 68
Reliance Tel 10 100
Idea 13 69
Vodafone 16 0
Overall 194 46
The table shows the percentage of customers who reported that their billingcomplaints were resolved by call centre within four weeks
56% of the cellular customers who made billing complaints to the call centre reported thattheir complaints were resolved within 4 weeks after they lodged their complaints. Theworst performer on this parameter was Vodafone.
Broadband Service
Service
Providers
Base % Satisfied
withProvision of
Service
% Satisfied with
Billing Performance
%
Satisfiedwith Help
Services
% Satisfied
withNetwork
Performance,
Reliability
and
% Satisfied
withMaintainability
%
SupplementaryServices
% Satisfied
with OverallService
Quality Postpaid Prepaid
Benchmarks ≥90% ≥90% ≥90% ≥90% ≥85% ≥85% ≥85% ≥85% Madhya Pradesh Circle
BSNL 651 96 94 - 83 89 53 96 93
Tata 600 100 94 99 81 90 54 89 89
Airtel 602 97 97 - 91 91 66 98 92 Reliance 606 92 95 - 86 91 43 95 90
Sify 281 100 - 98 83 93 55 92 95
Overall 2,741 97 95 98 85 91 54 94 91
All the service providers registered a lower proportion of satisfied customers on account of Maintainability.
8/4/2019 Qos Assgnmt_syndicate No.8
http://slidepdf.com/reader/full/qos-assgnmtsyndicate-no8 11/18
QUALITY OF SERVICE
Page
11
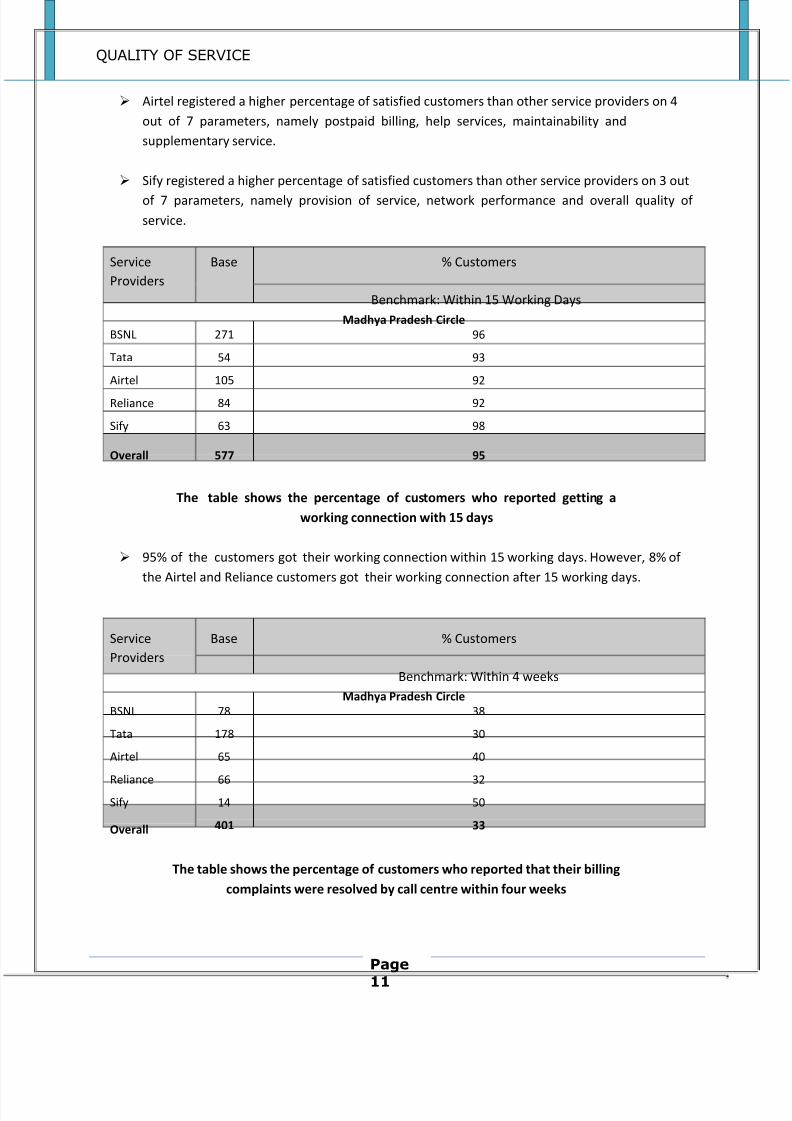
Airtel registered a higher percentage of satisfied customers than other service providers on 4out of 7 parameters, namely postpaid billing, help services, maintainability andsupplementary service.
Sify registered a higher percentage of satisfied customers than other service providers on 3 out
of 7 parameters, namely provision of service, network performance and overall quality of service.
ServiceProviders
Base % Customers
Benchmark: Within 15 Working Days Madhya Pradesh Circle
BSNL 271 96
Tata 54 93
Airtel 105 92
Reliance 84 92
Sify 63 98
Overall 577 95
The table shows the percentage of customers who reported getting aworking connection with 15 days
95% of the customers got their working connection within 15 working days. However, 8% of the Airtel and Reliance customers got their working connection after 15 working days.
ServiceProviders
Base % Customers
Benchmark: Within 4 weeks Madhya Pradesh Circle
BSNL 78 38
Tata 178 30
Airtel 65 40
Reliance
66
32
Sify 14 50
Overall 401 33
The table shows the percentage of customers who reported that their billingcomplaints were resolved by call centre within four weeks
8/4/2019 Qos Assgnmt_syndicate No.8
http://slidepdf.com/reader/full/qos-assgnmtsyndicate-no8 12/18
QUALITY OF SERVICE
Page
12
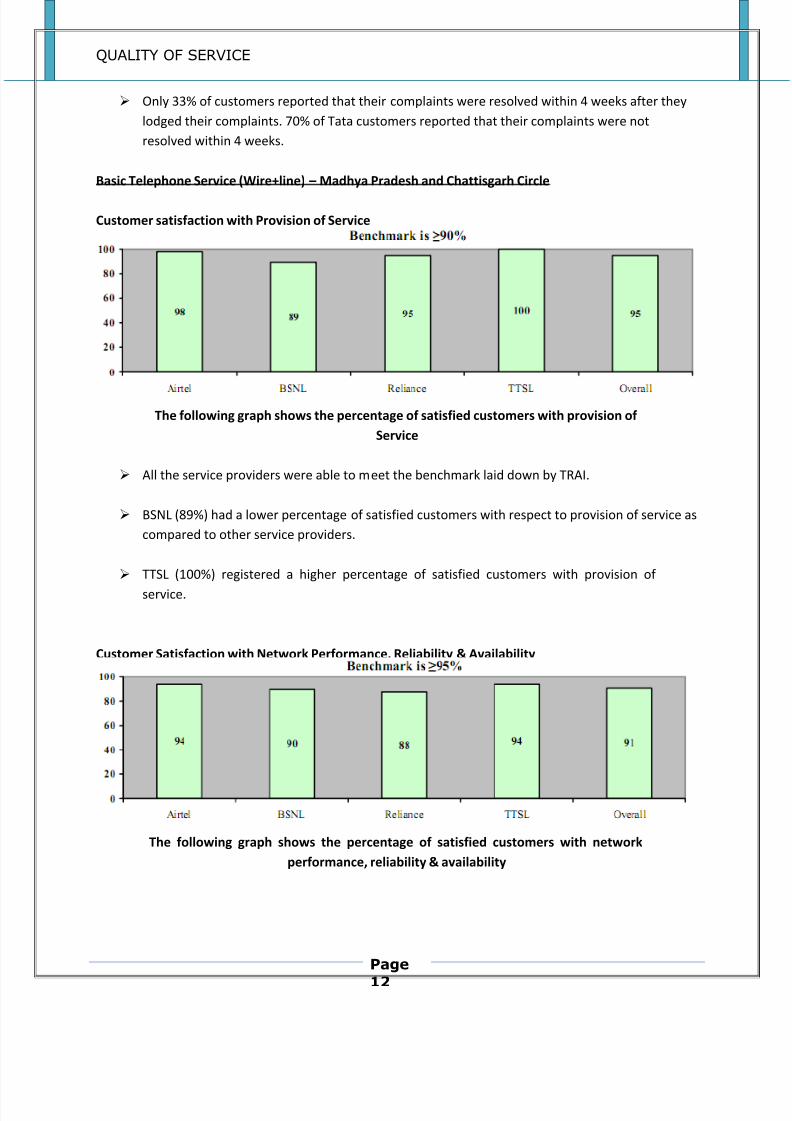
Only 33% of customers reported that their complaints were resolved within 4 weeks after theylodged their complaints. 70% of Tata customers reported that their complaints were notresolved within 4 weeks.
Basic Telephone Service (Wire+line) – Madhya Pradesh and Chattisgarh Circle
Customer satisfaction with Provision of Service
The following graph shows the percentage of satisfied customers with provision of Service
All the service providers were able to meet the benchmark laid down by TRAI.
BSNL (89%) had a lower percentage of satisfied customers with respect to provision of service ascompared to other service providers.
TTSL (100%) registered a higher percentage of satisfied customers with provision of
service.
Customer Satisfaction with Network Performance, Reliability & Availability
The following graph shows the percentage of satisfied customers with networkperformance, reliability & availability

8/4/2019 Qos Assgnmt_syndicate No.8
http://slidepdf.com/reader/full/qos-assgnmtsyndicate-no8 13/18
QUALITY OF SERVICE
Page
13
None of the service providers met the benchmark laid down by TRAI. Reliance (88%) scored less on this parameter.
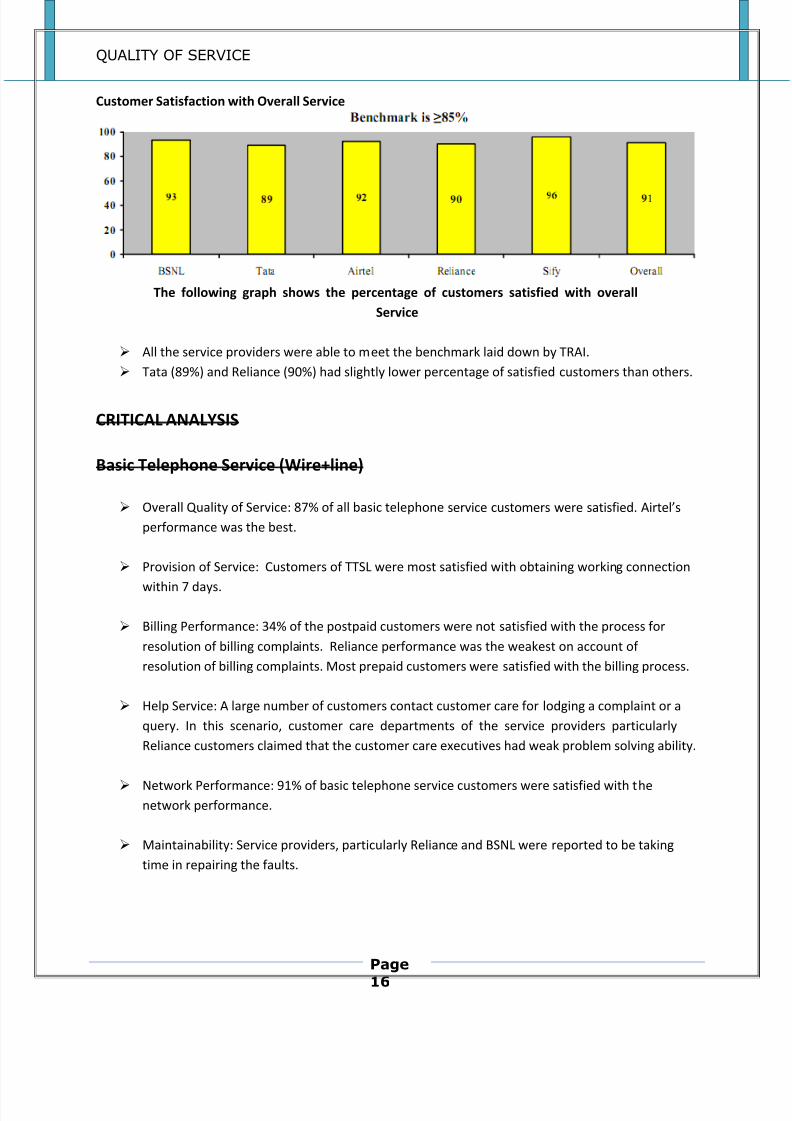
Customer Satisfaction with Overall Service Quality
The following graph shows the percentage of customers satisfied with overall serviceQuality
Only Airtel (91%) was able to meet the benchmark laid down by TRAI. Reliance, BSNL and TTSL were less satisfied on account of overall service quality.
Cellular Mobile Service – Madhya Pradesh circle
Customer Satisfaction with Provision of Service
The following graph shows the percentage of customers satisfied with the provisionof service.
All the service providers met the benchmark laid down by TRAI. TTSL customers were less satisfied with the provision of service.

8/4/2019 Qos Assgnmt_syndicate No.8
http://slidepdf.com/reader/full/qos-assgnmtsyndicate-no8 14/18
QUALITY OF SERVICE
Page
14
Customer Satisfaction with Network Performance, Reliability & Availability
The following graph shows the percentage of satisfied customers with networkperformance, reliability & availability
Only Airtel & Idea were able to meet the benchmark laid down by TRAI.
BSNL (73%) customers were less satisfied on account of network performance, reliabilityand availability.
Customer Satisfaction with Overall Service Quality
The following graph shows the percentage of customers satisfied with overall serviceQuality
All service providers were able to meet the benchmark laid down by TRAI.
BSNL (90%) had the lowest percentage of satisfied customers with overall service quality.

8/4/2019 Qos Assgnmt_syndicate No.8
http://slidepdf.com/reader/full/qos-assgnmtsyndicate-no8 15/18
QUALITY OF SERVICE
Page
15
Broadband Service – Madhya Pradesh circle
Customer Satisfaction with Provision of Service
The following graph shows the percentage of satisfied customers with respect toprovision of service
All the service providers met the benchmark laid down by TRAI. All customers of Tata and Sify were satisfied on account of Provision of Service. Reliance (92%) had a slightly lower proportion of satisfied customers.
Customer Satisfaction with Network Performance, Reliability & Availability
The following graph shows the percentage of customers satisfied with networkperformance, reliability & availability
All the service providers were able to meet the benchmark laid down by TRAI.
Sify (93%) had a slightly higher percentage of satisfied customers with respect to networkperformance, reliability & availability than other service providers.
BSNL (89%) had a slightly lower percentage of satisfied customers with respect tonetwork performance, reliability & availability than other service providers
8/4/2019 Qos Assgnmt_syndicate No.8
http://slidepdf.com/reader/full/qos-assgnmtsyndicate-no8 16/18
QUALITY OF SERVICE
Page
16
Customer Satisfaction with Overall Service
The following graph shows the percentage of customers satisfied with overallService
All the service providers were able to meet the benchmark laid down by TRAI. Tata (89%) and Reliance (90%) had slightly lower percentage of satisfied customers than others.
CRITICAL ANALYSIS
Basic Telephone Service (Wire+line)
Overall Quality of Service: 87% of all basic telephone service customers were satisfied. Airtel’sperformance was the best.
Provision of Service: Customers of TTSL were most satisfied with obtaining working connection
within 7 days.
Billing Performance: 34% of the postpaid customers were not satisfied with the process forresolution of billing complaints. Reliance performance was the weakest on account of resolution of billing complaints. Most prepaid customers were satisfied with the billing process.
Help Service: A large number of customers contact customer care for lodging a complaint or aquery. In this scenario, customer care departments of the service providers particularlyReliance customers claimed that the customer care executives had weak problem solving ability.
Network Performance: 91% of basic telephone service customers were satisfied with thenetwork performance.
Maintainability: Service providers, particularly Reliance and BSNL were reported to be takingtime in repairing the faults.

8/4/2019 Qos Assgnmt_syndicate No.8
http://slidepdf.com/reader/full/qos-assgnmtsyndicate-no8 17/18
QUALITY OF SERVICE
Page
17
Supplementary Services: Basic telephone service providers have shown adequate performanceon this parameter. BSNL performance was lower than other service providers.
Grievance Redressal: 90% were aware about the call centre’s toll free number. 5% and 1% of the customers were aware about the contact details of the nodal officer and Appellate
Authority.
Cellular Mobile Service
Overall Quality of Service: 96% of the cellular mobile service customers were satisfied withoverall quality of service. BSNL registered a lower percentage of satisfied customers at 90%.
Provision of Service: 98% of customers were satisfied with provision of service.
Billing Performance: A large proportion of postpaid and prepaid customers were notsatisfied with the process of resolution of billing complaints. Reliance and Airtel had the weakestperformance.
Help Services: A large number of customers contact customer care for lodging a complaint or aquery. Customers of BSNL were more dissatisfied with the help services.
Network Performance: 87% of the cellular mobile customers were satisfied. BSNL performancewas weakest.
Maintainability: 89% of cellular mobile customers were satisfied with maintainability, thoughBSNL shows the weakest performance.
Supplementary Services: 94% of the customers were satisfied with this parameter.
Grievance Redressal Mechanism: 91% were aware about the call centre’s toll freenumber. 4% and 3% of the customers were aware about the contact details of the nodal officerand Appellate authority.
Broadband Service
Overall Quality of Service: 91% of all broadband customers were satisfied. Sify performancewas the best.
Provision of Service: 97% of customers were satisfied with the provision of service.

8/4/2019 Qos Assgnmt_syndicate No.8
http://slidepdf.com/reader/full/qos-assgnmtsyndicate-no8 18/18
QUALITY OF SERVICE
Page
Billing Performance: 80% of the postpaid customers were satisfied with the resolution of billingcomplaints. BSNL performance was the weakest.
Help Services: A large number of customers contact customer care for lodging a complaint or aquery. In this scenario, only 85% of the customers were satisfied with the Help Services.
Network Performance: 91% of all broadband customers were satisfied.
Maintainability: While most customers of the broadband customers were dissatisfied on thisservice parameter, a significant number of customers stated that the problem was related to thebroadband connection and modem provided by the service provider.
Supplementary Services: Service providers have shown adequate performance on thisparameter.
Grievance Redressal: 91% were aware about the call centre’s toll free number. 4% and 3% of the customers were aware about the contact details of the nodal officer and appellateauthority.
Reference:
MadhyaPradeshSurveyReport2010.pdf