QEPAS spectrophones: design, optimization, and performance · e-mail: [email protected] pressure...
9
Appl Phys B (2010) 100: 627–635 DOI 10.1007/s00340-010-4072-0 QEPAS spectrophones: design, optimization, and performance L. Dong · A.A. Kosterev · D. Thomazy · F.K. Tittel Received: 26 April 2010 / Published online: 21 May 2010 © Springer-Verlag 2010 Abstract The impact of design parameters of a spectro- phone for quartz-enhanced photoacoustic spectroscopy on its performance was investigated. The microresonator of spectrophone is optimized based on an experimental study. The results show that a 4.4 mm-long tube with 0.6 mm in- ner diameter yields the highest signal-to-noise ratio, which is ∼30 times higher than that of a bare QTF at gas pres- sures between 400 and 800 Torr. The optimized configura- tion demonstrates a normalized noise-equivalent absorption coefficient (1σ ) of 3.3 × 10 −9 cm −1 W/Hz 1/2 for C 2 H 2 de- tection at atmospheric pressure. The effect of the changing carrier gas composition is studied. A side-by-side sensitiv- ity comparison between QEPAS and conventional photoa- coustic spectroscopy technique is reported. 1 Introduction The development of gas detection techniques and the de- sign of rugged and compact gas sensors for environmental monitoring, industrial process control applications and med- ical diagnostics are of considerable interest [1–7]. In this paper we report a detailed study to improve a gas detec- tion technology called quartz-enhanced photoacoustic spec- troscopy (QEPAS), which was developed by Kosterev et al. [8, 9]. QEPAS sensor technology is based on a novel ap- proach to photoacoustic detection which employs a quartz tuning fork (QTF) [10] as a resonant acoustic transducer. A QEPAS sensor detects a weak acoustic wave that is gen- erated when optical radiation interacts with a trace gas. The L. Dong ( ) · A.A. Kosterev · D. Thomazy · F.K. Tittel Electrical and Computer Engineering Department, Rice University, 6100 Main St., Houston, TX 77005, USA e-mail: [email protected] pressure wave excites a resonant vibration of the QTF which is then converted into an electric signal due to the piezoelec- tric effect. Subsequently, the electric signal, which is pro- portional to the concentration of the gas, is measured by a transimpedance amplifier. QEPAS sensors have been used with various laser sources including near-infrared (NIR) and mid-infrared (MIR) semiconductor lasers (both distributed feedback and external cavity), optical parametric oscilla- tors (OPO), and fiber amplifiers, and was applied to the detection of different chemical species including molecules with unresolved vibrational absorption bands [11–22]. Mer- its of QEPAS compared to conventional photoacoustic spec- troscopy (PAS) include better QEPAS sensor immunity to environmental acoustic noise, a simple spectrophone design, and its capability to analyze trace-gas samples of ∼1 mm 3 in volume. These advantages make the QEPAS technology competitive with and in many cases preferred to other trace- gas sensing methods. A commonly used QEPAS-based spectrophone consists of a QTF and a so-called microresonator (mR). The mR is formed by one or two thin tubes, and a QTF is positioned between or beside the tube(s) to probe the acoustic vibra- tion excited in the gas contained inside the tubes. It was ob- served in initial studies that the use of a mR increases the QEPAS sensitivity 10 times or more. Furthermore, the mR isolates the QTF from accidental acoustic resonances in the sensor enclosure, which can otherwise distort the QEPAS signal. The mR in certain conditions such as low gas pres- sure or non-matched length acts simply as a confinement to the sound wave and does not exhibit a pronounced reso- nant behavior. However, at the practically important condi- tions of atmospheric gas pressure and carefully chosen di- mensions the acoustic resonance in the mR tubes can sig- nificantly improve the sensor performance. In this paper we present an experimental investigation of the QEPAS sensor
Transcript of QEPAS spectrophones: design, optimization, and performance · e-mail: [email protected] pressure...

Appl Phys B (2010) 100: 627–635DOI 10.1007/s00340-010-4072-0
QEPAS spectrophones: design, optimization, and performance
L. Dong · A.A. Kosterev · D. Thomazy · F.K. Tittel
Received: 26 April 2010 / Published online: 21 May 2010© Springer-Verlag 2010
Abstract The impact of design parameters of a spectro-phone for quartz-enhanced photoacoustic spectroscopy onits performance was investigated. The microresonator ofspectrophone is optimized based on an experimental study.The results show that a 4.4 mm-long tube with 0.6 mm in-ner diameter yields the highest signal-to-noise ratio, whichis ∼30 times higher than that of a bare QTF at gas pres-sures between 400 and 800 Torr. The optimized configura-tion demonstrates a normalized noise-equivalent absorptioncoefficient (1σ ) of 3.3 × 10⁻⁹ cm−1W/Hz1/2 for C2H2 de-tection at atmospheric pressure. The effect of the changingcarrier gas composition is studied. A side-by-side sensitiv-ity comparison between QEPAS and conventional photoa-coustic spectroscopy technique is reported.
1 Introduction
The development of gas detection techniques and the de-sign of rugged and compact gas sensors for environmentalmonitoring, industrial process control applications and med-ical diagnostics are of considerable interest [1–7]. In thispaper we report a detailed study to improve a gas detec-tion technology called quartz-enhanced photoacoustic spec-troscopy (QEPAS), which was developed by Kosterev et al.[8, 9]. QEPAS sensor technology is based on a novel ap-proach to photoacoustic detection which employs a quartztuning fork (QTF) [10] as a resonant acoustic transducer.A QEPAS sensor detects a weak acoustic wave that is gen-erated when optical radiation interacts with a trace gas. The
L. Dong (�) · A.A. Kosterev · D. Thomazy · F.K. TittelElectrical and Computer Engineering Department,Rice University, 6100 Main St., Houston, TX 77005, USAe-mail: [email protected]
pressure wave excites a resonant vibration of the QTF whichis then converted into an electric signal due to the piezoelec-tric effect. Subsequently, the electric signal, which is pro-portional to the concentration of the gas, is measured by atransimpedance amplifier. QEPAS sensors have been usedwith various laser sources including near-infrared (NIR) andmid-infrared (MIR) semiconductor lasers (both distributedfeedback and external cavity), optical parametric oscilla-tors (OPO), and fiber amplifiers, and was applied to thedetection of different chemical species including moleculeswith unresolved vibrational absorption bands [11–22]. Mer-its of QEPAS compared to conventional photoacoustic spec-troscopy (PAS) include better QEPAS sensor immunity toenvironmental acoustic noise, a simple spectrophone design,and its capability to analyze trace-gas samples of ∼1 mm3
in volume. These advantages make the QEPAS technologycompetitive with and in many cases preferred to other trace-gas sensing methods.
A commonly used QEPAS-based spectrophone consistsof a QTF and a so-called microresonator (mR). The mR isformed by one or two thin tubes, and a QTF is positionedbetween or beside the tube(s) to probe the acoustic vibra-tion excited in the gas contained inside the tubes. It was ob-served in initial studies that the use of a mR increases theQEPAS sensitivity 10 times or more. Furthermore, the mRisolates the QTF from accidental acoustic resonances in thesensor enclosure, which can otherwise distort the QEPASsignal. The mR in certain conditions such as low gas pres-sure or non-matched length acts simply as a confinementto the sound wave and does not exhibit a pronounced reso-nant behavior. However, at the practically important condi-tions of atmospheric gas pressure and carefully chosen di-mensions the acoustic resonance in the mR tubes can sig-nificantly improve the sensor performance. In this paper wepresent an experimental investigation of the QEPAS sensor
628 L. Dong et al.
operation as a function of the geometrical mR parametersand derive conclusions regarding the optimum mR config-uration depending on a specific application. We also per-formed a side-by-side comparison of QEPAS with a QTFonly, QEPAS with an optimized mR, and conventional PASusing a state-of-the-art differential acoustic cell.
2 QEPAS spectrophones
In conventional PAS, the acoustic resonator plays an impor-tant role [23]. The absorbed laser energy is accumulatedin the acoustic mode of the resonator. The amplitude ofthe acoustic wave is scaled by the quality factor Q that isequal to the ratio between the energy accumulated in theresonator and the energy loss per cycle [24]. Typically theQ-factor of an acoustic resonator is 20–200, thus provid-ing an essential gain in sensitivity. The microphone is cou-pled to the resonator through a small hole in a sidewall ofthe acoustic resonator. It can be usually considered as abroadband acoustic detector not exhibiting pronounced fre-quency selectivity. Hence, the acoustic resonator is the onlyfrequency-selective element in the sensor. Its resonance canbe tuned to any desired frequency within the wide micro-phone band (often, 20–20 000 Hz). Unlike a microphone, theQTF is a high-Q element with a narrow passband. A typi-cal watch QTF has a Q ≈ 80,000 or higher in vacuum anda Q ≈ 10,000 at normal atmospheric pressure. The resonantfrequencies of the mR and the QTF must match for the mostefficient sensor operation. Such a frequency-matching de-sign is not straightforward, because the air-filled mR tubeand the QTF are acoustically coupled and affect the reso-nant properties of each other.
To date, two configurations of a QEPAS spectrophonehave been reported, both exploiting a longitudinal acousticresonance in an organ pipe type mR. The first of them shownin Fig. 1a was originally proposed by Kosterev et al. [8, 9]and used in most of the reported QEPAS sensors. The secondwas recently reported [25] and called by the authors “Off-Beam (OB) QEPAS”. In this second configuration the mRis a single tube with a small opening in the middle, and aQTF is coupled to the mR by putting it outside the mR tubenear the opening (Fig. 1b). The acoustic coupling is muchweaker in this case. This OB-QEPAS configuration will notbe considered in this paper.
In the QEPAS review paper [8] published in 2005 the au-thors assumed that the two parts of the mR (left and righttubes) can be considered in a first approximation as a singletube, neglecting the gap and the QTF between them. Basedon such an assumption, each tube was cut to the l ≈ λs/4length, where λs is the sound wavelength, to form a half-wave resonator (Fig. 2a). Subsequent research, however, re-vealed that the detected signal in a mR of such a geome-try is much stronger when l ≈ λs/2 [26]. This fact suggests
Fig. 1 Two configurations of a QEPAS spectrophone: the most widelyused two-tube configuration (a) and an OB-QEPAS single-tube config-uration (b)
that the gap between the tubes is big enough to make themalmost independent (Fig. 2b). More detailed studies [27]showed that the optimum length is actually between λs/4and λs/2 (Fig. 2c) because of the interaction of two res-onator tubes and acoustic coupling to the QTF. It was alsoshown in Ref. [27] that variations in l as small as 0.2 mmhave a significant impact on the spectrophone properties.The authors of Ref. [27] varied only the length of the mi-croresonator tubes. In the following section an experimentalstudy of the spectrophone geometry impact on the spectro-phone properties and operation is reported, which includesvariations of the tube diameter and gaps between the QTFsurface and tubes facets. The quartz tuning forks used in thisstudy are identical to those described in [28].
3 Experimental optimization of the microresonatorfor nitrogen as a carrier gas
The experimental setup for optimization of the mR parame-ters is shown in Fig. 3. A near-infrared fiber-coupled dis-tributed feedback (DFB) diode laser (JDS Uniphase modelCQF935/908-19600) was used as the QEPAS excitationsource. The diode laser output was divided in a 1:99 ra-tio by means of a fiber coupler (ThorLabs 10202A-99-APC). A small fraction of the laser light was sent to a com-

QEPAS spectrophones: design, optimization, and performance 629
Fig. 2 Acoustic resonance intwo tubes: stuck togetherwithout gap (a); separated by alarge gap so that there is noacoustic coupling (b);intermediate case—twoacoustically coupled tubes witha quartz tuning fork betweenthem (c); l is the lengthcorresponding to acousticresonance in the system, andP is the acoustic pressure
Fig. 3 Schematic diagram of the experimental setup. SPh: spectro-phone; BS: 1:99 beam splitter; TA: transimpedance amplifier; DL:diode laser with a temperature controller and current driver; CEU:control electronics unit; f : laser current modulation frequency; DC,2f , 3f : the corresponding components of the electrical signals; ADC:analog-to-digital converter; DAC: digital-to-analog converter; PC: per-sonal computer
mercial fiber-coupled reference module (Wavelength Refer-ences, Mulino, OR) containing a sealed cell filled with amixture of 5 Torr C2H2 and 145 Torr N2, a fiber collima-tor, and a photodiode. The remaining laser power, 46 mW,was directed to a spectrophone consisting of the QTF andtwo tubes forming the acoustic mR. The spectrophone wasplaced into a vacuum-tight enclosure (the inner gas volumeis V ∼ 1 cm3 when the spectrophone is installed) equipped
with gas inlet and outlet and two BK7 windows with anti-reflection (AR) coatings. A calibrated 10 ppmv C2H2 in N2
was used to study the spectrophone photoacoustic sensitiv-ity. The gas flow was set to 100 sccm. A C2H2 absorptionline at 6529.17 cm−1 [29] with 6.31 × 10⁻⁷ cm−1 peakabsorption for 1 ppmv concentration at atmospheric pres-sure was selected. A control electronics unit (CEU) was em-ployed to measure the resonant frequency fQTF, quality fac-tor Q and resistance R of the QTF, to modulate the lasercurrent at fL = 1/2fQTF, to lock the laser wavelength to thetarget absorption line and to measure the current generatedby the QTF in response to the photoacoustic signal. A pres-sure controller (MKS Type 649) was used to maintain thedesired pressure in the spectrophone cell.
Both signal and noise should be considered for the cor-rect assessment of the sensor performance. It is theoreti-cally predicted and verified in many experiments that theQEPAS spectrophone noise is primarily determined by thethermal noise of QTF. The QTF noise measured at the tran-simpedance amplifier output at the resonant frequency fQTF
is equal to the thermal noise of the equivalent resistor R [30]
√⟨V 2
N
⟩ = Rg
√4kBT �f
R, (1)
where√
〈V 2N 〉 is the noise rms voltage, �f is the detec-
tion bandwidth (assuming �f � π2
fQTFQ
, the QTF band-width), and T is the QTF temperature. The gain resistorRg = 10 M� also introduces noise with a spectral density√
4kBTRg , added to the QTF noise in quadrature. However,it is
√Rg/R times lower than the QTF noise and can be
usually neglected for typical values of R ∼ 10 to 200 k�.R represents QTF oscillator losses and is related to other

630 L. Dong et al.
QTF parameters as R = 1Q
√LC
, where L is an equivalentinductance representing the QTF oscillator equivalent mass,and C represents the inverse force constant. Both L and C
do not change more than 0.1% due to interaction with gas.Therefore, when a QTF is integrated into different spectro-phones, the signal-to-noise ratio (SNR) can be estimated asthe ratio of the signal to
√Q.
Figure 4 displays the SNR comparison for several mRconfigurations. The scaling factor K for a fixed T is constantfor a given QTF. The gaps between a QTF and mR tubes areconsistently 50 µm. The distance from the QTF tips to themR tubes’ axis is 0.7–0.9 mm. Such a variation in this pa-rameter does not noticeably impact the signal [28, 31]. Thebest SNR is achieved with l = 4.4 mm tubes. This lengthis significantly shorter than the half-wavelength of sound,λs/2 = 5.2 mm, calculated based on the speed of sound of340 m/s in pure nitrogen at 20°C. Such a deviation qualita-tively agrees with an assumed pressure distribution in Fig. 2.With tubes of l = 5.1 mm which are detuned furthest fromresonance the SNR increases upon reducing the tube diam-eter. The resonant effects in the mR of this configuration arenot strongly pronounced. Therefore, the volume of the ex-cited gas becomes the primary factor and causes the signalto increase when the absorbed optical energy is distributedover a smaller amount of gas. For the optimum tube lengthof l = 4.4 mm the effects of acoustic resonance dominate.The Q factor of the gas-filled organ pipe resonator increaseswith its diameter, resulting in a higher acoustic pressure andSNR.
Figure 5 presents the changes in the measured QTF pa-rameters when it is coupled to the mR. The decrease of Q
provides a measure of acoustic coupling between the QTFand the mR, because the high-Q QTF is losing energy pri-marily via coupling to the low-Q mR oscillator. Changesof the resonant frequency are less reliable because of someinitial scatter among QTFs. However, a general trend existsthat a QTF integrated into a mR has a higher natural fre-quency. This observation indicates that an additional forceconstant is added due to acoustic coupling. This plot alsoindicates that thicker mR tubes provide stronger acousticcoupling (lower Q). The tubes with larger inner diametermatch the QTF frequency when cut to a shorter length.This result qualitatively agrees with Fig. 2, because with alarger tube diameter the gap between two mR tubes becomesless important and the system moves closer to the case de-picted in Fig. 2a. The largest drop in Q-factor is observedfor l = 3.9 mm and ID = 0.84 mm, the largest tested innerdiameter. This configuration has advantages of easier opti-cal alignment of the excitation radiation through wider andshorter tubes, and faster sensor response time τ = Q/πf0.An advantage of the fast response with a matched mR wasused in [32]. On the other hand, spectrophones with stronglyacoustically coupled mR and QTF are more sensitive to
Fig. 4 Signal-to-noise ratio as a function of the pressures in differentQEPAS spectrophone configurations. l: length of each spectrophonetube; ID, OD: inner and outer diameter of the tube in mm. (a) 3.9 mmlong tubes, (b) 4.4 mm long tubes and bare QTF, (c) 5.1 mm long tubes

QEPAS spectrophones: design, optimization, and performance 631
Fig. 5 Q-factor and frequencyof the QTF as a function of thepressure for different tubelengths and diameters. ID,l: inner diameter and length ofthe tubes in mm
Fig. 6 Gain in the SNR due to the microresonator with respectto the bare QTF. The microresonator dimensions are: l = 4.4 mm,ID = 0.6 mm, OD = 0.9 mm, gap between the tubes facets and theQTF surface 50 µm
environmental acoustic noise. Instead of a QTF, which isacoustically a quadrupole, the acoustic background is re-ceived by the mR which is an acoustic dipole, and the accep-tance bandwidth is higher because of the reduced Q-factor.
In Fig. 4b, in addition to the mR data, we present the SNRmeasured with only a QTF (no mR), and Fig. 6 shows theimprovement in SNR achieved due to the mR when the gapsbetween the QTF and the tubes are 50 µm each, l = 4.4 mm,and ID = 0.60 mm. This gain is ∼30 in the 500–700 Torrpressure range. A normalized noise-equivalent absorptioncoefficient at atmospheric pressure for the used C2H2 linewas found to be 3.3 × 10⁻⁹ cm−1 W/Hz1/2 for these mRgeometrical parameters. The same sensitivity was reportedin [27] for the 6528.8 cm−1 NH3 absorption peak.
Fig. 7 Signal-to-noise ratio as a function of gas pressure for 25 µm,30 µm and 50 µm gaps between the tube facets and the QTF surface.ID, l: inner diameter and length of the tubes in mm
The gaps size between the QTF and the mR tubes is aparameter which is difficult to control during the spectro-phone assembly, but it has a significant effect on the spec-trophone performance. With a large gap, the diverging flowfrom the mR cannot efficiently push against the QTF prong.Figure 7 shows the SNR comparison for different gaps. Witha 4.4 mm-long 0.5 mm-inner-diameter tube, the SNR is im-proved 13% for pressure 200–800 Torr when the gap is re-duced from 50 to 25 µm. With the 3.9 mm-long 0.5 mm-inner-diameter tube, the SNR is improved 27% for pressuresfrom 100 Torr to 800 Torr when the gap is reduced from 50to 30 µm.

632 L. Dong et al.
4 Effects of the changing carrier gas
Interaction between the QTF and the mR is dependant uponthe mismatch between their natural resonant frequencies.The resonant frequency of the QTF is primarily determinedby the mechanical properties of the quartz crystal and doesnot significantly change in the presence of a gas. To the con-trary, the mR resonant frequency is directly proportional tothe speed of sound in the gas and therefore is affected bythe bulk gas composition. To observe this effect, we mixedgases from two cylinders, the first containing 5% CO2 in N2,and the second with pure CH4. The QEPAS signal from CO2
was monitored. For that purpose, a near-infrared DFB diodelaser (FITEL model FOL 15 DCWD-A82-19070) and CO2
reference gas module (Wavelength References, Mulino, OR)were used instead of the laser and the reference gas modulefor C2H2 in Fig. 3. A CO2 absorption line at 6361.25 cm−1
[29] with 1.39 × 10⁻⁵ cm−1 peak absorption for 1% con-centration at atmospheric pressure was employed to exciteCO2. The speed of sound in pure CH4 is ∼430 m/s at 20°C.Therefore, its addition to N2 increases the speed of sound inthe gas and shifts the mR resonance to a higher frequency.
The measurements were carried out at atmospheric pres-sure with two different microresonators. The first resonatorwith l = 4.4 mm and ID = 0.5 mm was believed to be ofthe optimum length in the nitrogen carrier gas, its frequencymatching the 32,760 Hz resonant frequency of the QTF. Thesecond mR with l = 5.1 mm and ID = 0.76 mm was pre-sumably detuned from 32,760 Hz to a lower frequency inN2 carrier (Fig. 8). Figure 9a shows the measured Q-factorof the QTF. When the CH4 concentration increases, the res-onant frequency of the l = 4.4 mm mR is detuned from theQTF, as shown in Fig. 8. As a result, the transfer of vibra-tional energy from the QTF to a high-loss mR becomes lessefficient, and the measured Q-factor of the QTF increases.The situation is just the opposite for the l = 5.1 mm mR, inwhich case the resonances of mR and QTF get closer withincreasing CH4 concentration. Figure 9b shows the QEPAS
Fig. 8 A qualitative representation of the mR and QTF resonances.Solid curves show the mR resonances in nitrogen. Initially, thel = 4.4 mm mR has a resonant frequency coinciding with the QTFfrequency. The arrows show the direction of the resonant frequencyshift when CH4 is added, increasing the speed of sound
signal normalized to the QTF Q-factor and CO2 concen-tration. The resulting number reflects the force acting onthe QTF (at a fixed CO2 concentration), which is in turnproportional to the acoustic pressure. The rising part (0 to5% CH4) is due to the vibrational–translational (V–T) re-laxation kinetics. The V–T relaxation of CO2 in dry N2 isknown to be slow. The translational gas temperature cannotfollow fast changes in the laser induced molecular excita-tion rate. Thus the generated photoacoustic wave is weakerthan it would be in case of instantaneous V–T relaxation.The addition of CH4 to a nitrogen carrier gas increases theenergy transfer rate from the initially excited ro-vibrationalstate of CO2 into translational motion of gas molecules, in-creasing the magnitude of acoustic signal, until the ωτ < 1condition is met (where ω = 2πfQTF and τ is a character-istic V–T relaxation time). With more CH4 added, the ef-
Fig. 9 (a) Q-factor of the QTF as a function of CH4 concentrationfor the 4.4 mm-long tubes and the 5.1 mm-long mR tubes. (b) QEPASsignal detected from CO2 normalized to the CO2 concentration and theQTF Q-factor as a function of CH4 concentration for the same tubes

QEPAS spectrophones: design, optimization, and performance 633
ficiency of the acoustic excitation of the l = 4.4 mm mRdecreases as the optical excitation frequency (kept equal tothe resonant frequency of the QTF) is detuned from the mRnatural frequency. The opposite situation is observed for thel = 5.1 mm mR. These experiments demonstrate that chang-ing the gas composition is an efficient technique of vali-dating the frequency match between mR and QTF in theQEPAS spectrophone.
5 Side-by-side comparison of QEPAS and conventionalPAS spectrophones
A comparison of QEPAS and conventional PAS based onpublished data is difficult because of variations in experi-mental conditions, incomplete reports, and different criteriaused to assess the sensor performance. Therefore, we per-formed a side-by-side comparison of the QEPAS spectro-phone and a state-of-the-art conventional PAS (CPAS) dif-ferential detector.
For this comparison we used a QEPAS spectrophone as-sembled by Achray Photonics, Inc. in a telecom-style pack-age, with the near-IR laser radiation delivered via a singlemode optical fiber and subsequently focused by means of aGRIN lens (Fig. 10). The mR consisted of two l = 4.4 mm,ID = 0.51 mm hypodermic tubes, positioned 0.6 mm belowthe QTF tips. The CPAS sensor design and its performanceas evaluated with a pulsed CO2 laser were reported in [33].Dimensions and other relevant parameters of the QEPAS
and CPAS spectrophones are summarized in Table 1. Weused two gases to evaluate the PAS sensors: (1) 10 ppmvC2H2 in N2 (6529.17 cm−1 absorption line), and (2) pureCO2 (6493.42 cm−1 absorption line). Based on our previ-ous experience, C2H2 has a fast V–T relaxation rate, whichcan be considered instantaneous on the 1/f0 time scale. TheV–T relaxation of the initially excited 3ν3 + ν1 state of CO2
is slow or incomplete, as indicated by the measured QEPASsensitivity.
The measurements were performed at atmospheric pres-sure with 100 sccm gas flow, using 2f wavelength modula-tion technique. The results are summarized in Table 2. ForC2H2, the QEPAS detection sensitivity is 1.3 times higherthan the CPAS sensitivity; for CO2, the QEPAS sensitiv-
Fig. 10 Fiber-coupled QEPAS spectrophone for near-IR spectralrange
Table 1 Parameters of theQEPAS and CPASspectrophones
QEPAS CPAS
Spectrophone dimensions 21 × 12.7 × 8.5 mm l = 136 mm, ø56.5 mm
Resonator volume 2 mm3 4500 mm3
Optical path length 9 mm 90 mm
Resonant frequency 32,735 Hz in N2 1787 Hz in N2
32,733 Hz in CO2 1367 Hz in CO2
Q-factor 3630 in N2 49 in N2
7930 in CO2 56 in CO2
Maximum flow rate 400 sccm 1200 sccm
Table 2 Sensitivity comparisonbetween QEPAS and CPAS
NNEAC: normalizednoise-equivalent absorptioncoefficientEquivalent noise detectionbandwidth is 0.833 Hz
10 ppm C2H2 in N2 Pure CO2
QEPAS CPAS QEPAS CPAS
Signal, µV 6280 46 13880 413
Noise, µV 53 0.49 74 0.91
SNR 119 94 188 455
Laser power, mW 37.2 39.0 21.1 24.3
NNEAC, cm−1W/Hz1/2 4.1 × 10⁻⁹ 5.4 × 10⁻⁹ 16.0 × 10⁻⁹ 7.6 × 10⁻⁹
634 L. Dong et al.
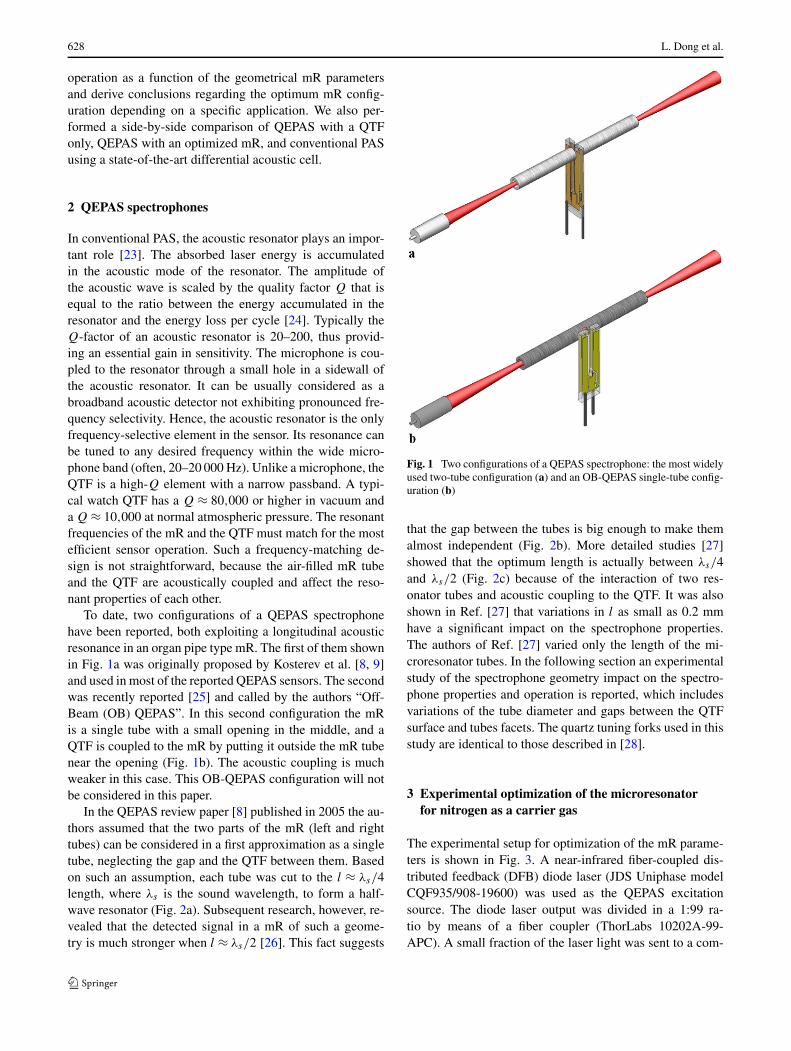
Fig. 11 Curves summarizing the results on sensitivity as a function ofpressure acquired in this study for different spectrophones. The mea-surements were performed for 10 ppm C2H2 in N2. Vertical axis isthe measured SNR divided to the peak absorption of C2H2 that wascalculated based on HITRAN data. Each curve is normalized to itsmaximum value
ity is 2.1 times lower than the CPAS sensitivity. The rea-son for a sharper sensitivity drop of QEPAS sensitivity fora slower relaxing CO2 is a 24 times higher modulation fre-quency compared to CPAS.
We also studied the SNR for 10 ppm C2H2 as a functionof the total gas pressure using three spectrophones: (1) con-figuration of Fig. 1a, (2) CPAS cell, and (3) QTF withoutmR. Smoothed values of the SNR divided to the peak ab-sorption coefficient of C2H2 at 6529.17 cm−1 at each pres-sure are shown in Fig. 11. Each curve is normalized to itsmaximum value. The Q-factor of the gas-filled CPAS res-onator increases with the total gas pressure, while the Q-factor of a QTF without mR decreases, resulting in the ob-served behavior of the SNR. A QEPAS spectrophone with amR combines the properties of these two elements, the in-creasing Q of the mR partially compensating the decreasingQ of the QTF. The drop of the QTF sensitivity below 100Torr is probably associated with the V–T relaxation dynam-ics.
6 Conclusions
It follows from our study that the sensitivity (signal-to-noise ratio) of QEPAS can be increased 1.5–2 times at at-mospheric pressure when the mR tubes are cut to the correctlength to match the QTF resonant frequency in a particularcarrier gas. Another advantage of the QEPAS spectrophonewith matched resonances of the QTF and mR is the up to 8–10 times shorter response time, corresponding to the reducedQ-factor of the spectrophone. The reduced Q-factor is also
responsible for the lower spectrophone noise level, which isthe main factor in improving the SNR. Thus, the practicalrealization of the matched-resonances spectrophone sensi-tivity advantages requires careful EMI shielding and elec-tronics design. The matched-resonances spectrophone para-meters (resonant frequency, quality factor, and responsivity)are sensitive to the speed of sound, which in turn can be af-fected by the gas temperature and bulk composition. There-fore, in a changing environment the use of spectrophoneswith intentionally detuned mR and QTF frequencies maybe advantageous, regardless of the reduced sensitivity. Be-sides, the matched-resonances spectrophone is expected tobe more sensitive to environmental acoustic noise becausethe mR acts as an acoustic antenna, although we did not ob-serve excess noise in laboratory experiments.
Acknowledgements The Rice University group acknowledges fi-nancial support from a National Science Foundation ERC MIRTHEaward, a grant C-0586 from The Welch Foundation and a grant fromthe National Aeronautics and Space Administration.
References
1. R.F. Curl, F. Capasso, C. Gmachl, A.A. Kosterev, B. McManus,R. Lewicki, M. Pusharsky, G. Wysocki, F.K. Tittel, Chem. Phys.Lett. 487, 1 (2010)
2. M. Troccoli, L. Diehl, D.P. Bour, S.W. Corzine, N. Yu, C.Y. Wang,M.A. Belkin, G. Hofler, R. Lewicki, G. Wysocki, F.K. Tittel, F. Ca-passo, J. Lightwave Technol. 26, 3534 (2008)
3. A.A. Kosterev, G. Wysocki, Y.A. Bakhirkin, S. So, R. Lewicki,F.K. Tittel, R.F. Curl, Appl. Phys. B 90, 165 (2008)
4. A.A. Kosterev, F.K. Tittel, G. Bearman, in Proceedings of the2008 Int. Conference on Environmental Systems, Published bySAE as MS 08ICES-0031 (2008)
5. J.S. Pilgrim, J. Kutzner, W.R. Wood, in Proceedings of the 2007Int. Conference on Environmental Systems, Published by SAE asMS 2007-01-3152 (2007)
6. M.R. McCurdy, Y.A. Bakhirkin, G. Wysocki, R. Lewicki, F.K. Tit-tel, J. Breath Res. 1, 014001 (2007)
7. G. Wysocki, Y.A. Bakhirkin, S. So, F.K. Tittel, C.J. Hill,R.Q. Yang, M.P. Fraser, Appl. Opt. 46, 8202 (2007)
8. A.A. Kosterev, F.K. Tittel, D. Serebryakov, A.L. Malinovsky,I. Morozov, Rev. Sci. Instrum. 76, 1 (2005)
9. A.A. Kosterev, Y.A. Bakhirkin, R.F. Curl, F.K. Tittel, Opt. Lett.27, 1902 (2002) ()
10. J.-M. Friedt, E. Carry, Am. J. Phys. 75, 415 (2007)11. K. Liu, J. Li, L. Wang, T. Tang, W. Zhang, X. Gao, W. Chen,
F.K. Tittel, Appl. Phys. B 94, 527 (2009)12. A.A. Kosterev, Y.A. Bakhirkin, F.K. Tittel, S. McWhorter,
B. Ashcraft, Appl. Phys. B 92, 103 (2008)13. C.W. Van Neste, L.R. Senesac, T. Thundat, Appl. Phys. Lett. 92,
234102 (2008)14. R. Lewicki, G. Wysocki, A.A. Kosterev, F.K. Tittel, Appl. Phys. B
87, 157 (2007)15. R. Lewicki, G. Wysocki, A.A. Kosterev, F.K. Tittel, Opt. Express
15, 7357 (2007)16. A.K. Ngai, S.T. Persijni, D. Lindsay, A.A. Kosterev, P. Groß,
C.J. Lee, C.M. Cristescu, F.K. Tittel, K.J. Boller, F.J. Harren,Appl. Phys. B 89, 123 (2007)
17. Y.A. Bakhirkin, A.A. Kosterev, R.F. Curl, F.K. Tittel,D.A. Yarekha, L. Hvozdara, M. Giovannini, J. Faist, Appl.Phys. B 82, 149 (2006)

QEPAS spectrophones: design, optimization, and performance 635
18. A.A. Kosterev, T.S. Moseley, F.K. Tittel, Appl. Phys. B 85, 295(2006)
19. G. Wysocki, A.A. Kosterev, F.K. Tittel, Appl. Phys. B 85, 301(2006)
20. A.A. Kosterev, Y.A. Bakhirkin, F.K. Tittel, Appl. Phys. B 80, 133(2005)
21. A.A. Kosterev, F.K. Tittel, Appl. Opt. 43, 6213 (2004)22. D. Weidmann, A.A. Kosterev, F.K. Tittel, N. Ryan, D. McDonald,
Opt. Lett. 29, 1837 (2004)23. A. Miklós, P. Hess, Z. Bozóki, Rev. Sci. Instrum. 72, 1937 (2001)24. T. Schmid, Anal. Bioanal. Chem. 384, 1071 (2006)25. K. Liu, X.Y. Guo, H.M. Yi, W.D. Chen, W.J. Zhang, X.M. Gao,
Opt. Lett. 34, 1594 (2009)26. S. Schilt, A.A. Kosterev, F.K. Tittel, Appl. Phys. B 95, 813 (2009)27. D.V. Serebryakov, I.V. Morozov, A.A. Kosterev, V.S. Letokhov,
Quantum Electron. 40, 167 (2010)28. N. Petra, J. Zweck, A.A. Kosterev, S. Minkoff, D. Thomazy, Appl.
Phys. B 94, 673 (2009)
29. L.S. Rothman, A. Barbe, D.C. Benner, L.R. Brown, C. Camy-Peyret, M.R. Carleer, K. Chance, C. Clerbaux, V. Dana,V.M. Devi, A. Fayt, J.M. Flaud, R.R. Gamache, A. Gold-man, D. Jacquemart, K.W. Jucks, W.J. Lafferty, J.Y. Mandin,S.T. Massie, V. Nemtchinov, D.A. Newnham, A. Perrin, C.P. Rins-land, J. Schroeder, K.M. Smith, M.A.H. Smith, K. Tang,R.A. Toth, J. Vander Auwera, P. Varanasi, K. Yoshino, J. Quant.Spectrosc. Radiat. Transf. 82, 5 (2003)
30. R.D. Grober, J. Acimovic, J. Schuck, D. Hessman, P.J. Kindle-mann, J. Hespanha, A.S. Morse, K. Karrai, I. Tiemann, S. Manus,Rev. Sci. Instrum. 71, 2776 (2000)
31. S.L. Firebaugh, F. Roignant, E.A. Terray, in Proceedings ComsolConf., Boston, October 8–10, 2009
32. A.A. Kosterev, P. Buerke, L. Dong, M. Reed, T. Day, F.K. Tittel,Appl. Phys. B (2010). doi:10.1007/s00340-010-3975-0
33. C.-M. Lee, K.V. Bychkov, V.A. Kapitanov, A.I. Karapuzikov,Y.N. Ponomarev, I.V. Sherstov, V.A. Vasiliev, Opt. Eng. 46,064302 (2007)