QCD and Top backgrounds in W+jets and Rjets
28
QCD and Top backgrounds in W+jets and Rjets Alessandro Tricoli (CERN) on behalf of W+jets and Rjets groups 3 rd May 2013 W+jets and Rjets EB Meeting
-
Upload
hop-gibson -
Category
Documents
-
view
25 -
download
0
description
QCD and Top backgrounds in W+jets and Rjets. Alessandro Tricoli (CERN) o n behalf of W+jets and Rjets groups. W+jets and Rjets EB Meeting. 3 rd May 2013. Overview. P rogress made in understanding QCD multi- jet and Top backgrounds - PowerPoint PPT Presentation
Transcript of QCD and Top backgrounds in W+jets and Rjets

QCD and Top backgrounds in W+jets and Rjets
Alessandro Tricoli (CERN)
on behalf of
W+jets and Rjets groups
3rd May 2013 W+jets and Rjets EB Meeting

A. Tricoli 23rd May 2013
Overview
Progress made in understanding QCD multi-jet and Top backgrounds Better understanding of QCD background in W m and e channels, e.g.
pileup, trigger and template dependencies Systematics available for QCD in electron channel Top background estimations available in both m and e channels with
most of systematics included To do list getting smaller and smaller
big effects already addressed, remaining sub-leading effects to be considered
A. Tricoli 33rd May 2013
QCD Methods recap
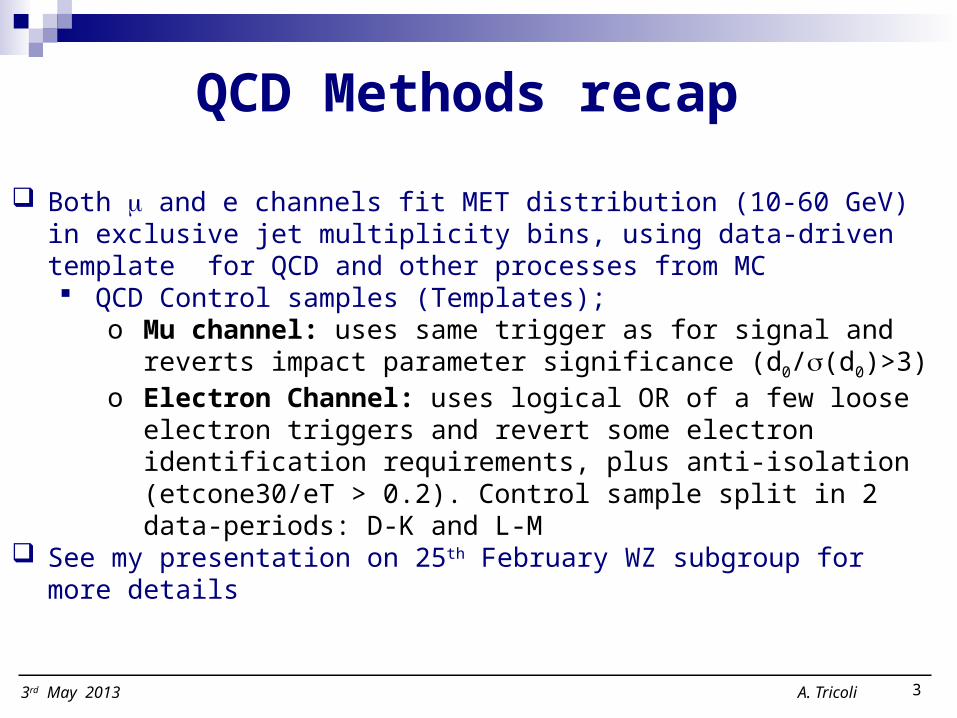
Both m and e channels fit MET distribution (10-60 GeV) in exclusive jet multiplicity bins, using data-driven template for QCD and other processes from MC QCD Control samples (Templates);
o Mu channel: uses same trigger as for signal and reverts impact parameter significance (d0/s(d0)>3)
o Electron Channel: uses logical OR of a few loose electron triggers and revert some electron identification requirements, plus anti-isolation (etcone30/eT > 0.2). Control sample split in 2 data-periods: D-K and L-M
See my presentation on 25th February WZ subgroup for more details

A. Tricoli 43rd May 2013
Investigation of reasons for increase of QCD background wrt 2010 Is difference of 3x-5x between 2010 and 2011 due to the broadening
of the MET distribution with more pile-up? Previous results were inconclusive
Study QCD fractions in different sampleso Low/Medium/High Pileup o D-K and L-M Periodso Low/Medium/High jet pT
QCD – W->mn +jetsPileup

A. Tricoli 53rd May 2013
Sample Njej==0 [%]
Njej==1 [%] Njej==2 [%] Njej==3 [%] Njej==4 [%] Njej==5 [%]
Reference 4.91±0.18 14.23±0.23 13.23±0.43 12.5±0.9 9.4±1.5 11±10
m=0-4 3.8±1.1 7.5±1.3 8.3±2.9 5.4±3.3 5.7±5.4 1.4±5.0
m=4-8 3.87±0.21 10.91±0.30 10.31±0.58 10.8±1.2 7.7±2.0 10±12
m=8+ 5.88±0.29 16.67±0.31 15.54±0.63 13.7±1.2 10.6±2.1 12±14
D-K 3.99±0.21 11.04±0.28 10.47±0.56 10.8±1.2 7.5±1.9 10±13
L-M 5.81±0.29 16.70±0.32 15.49±0.64 13.5±1.2 10.9±2.2 12±14
jet pT>45 GeV 5.33±0.12 14.67±0.28 10.64±0.64 8.3±1.4 8.0±3.3 3.5±7.7
jet pT>60 GeV 5.55±0.11 12.77±0.35 9.64±0.96 7.3±2.2 3.3±2.3 0.3±3.2
QCD Fractions increases when pileup increases, in all three tests QCD Fractions for m=0-4 close to 2010 values (pileup conditions rather similar) Pileup is cause of increased pileup in 2011 wrt 2010
QCD – W->mn +jetsPileup

A. Tricoli 63rd May 2013
QCD – W->mn +jetsComparison with W inclusive
W inclusive group uses different definition of QCD control sample 0.1 < ptcone20/pT<0.5
Good agreement on QCD fraction between our results and theirs when same selection is used
Reason for different strategy is bias on jet kinematics by reversing relative isolation
Reversed D0 Reversed Iso
Jet pT biased in all templates tested except our nominal (reversed d0)
A. Tricoli 73rd May 2013
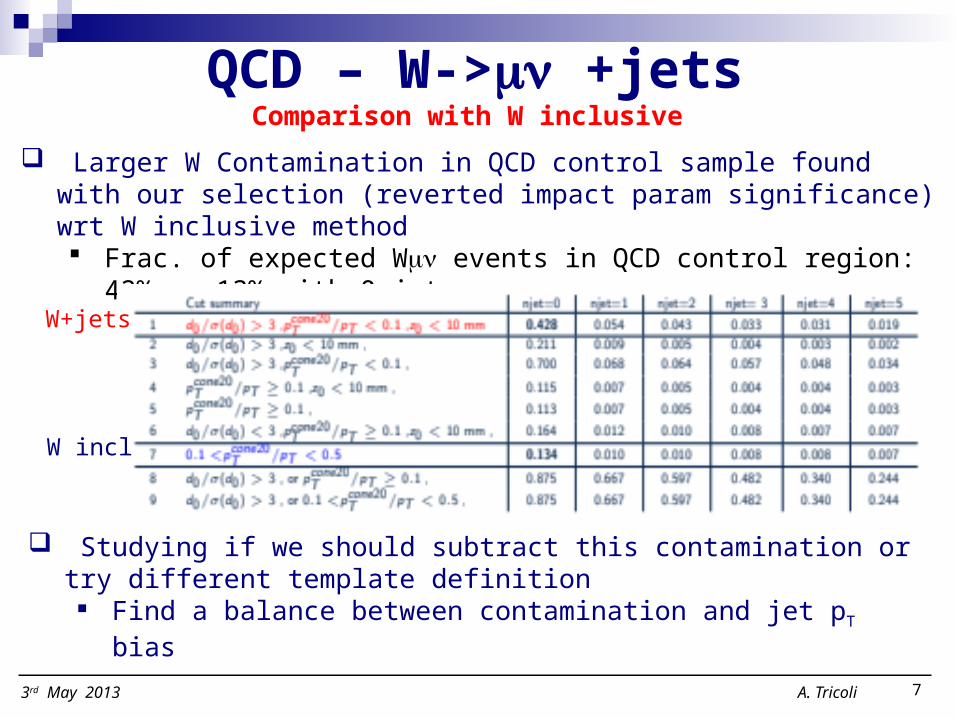
QCD – W->mn +jetsComparison with W inclusive
Larger W Contamination in QCD control sample found with our selection (reverted impact param significance) wrt W inclusive method Frac. of expected Wmn events in QCD control region: 42% vs 13%
with 0 jets
W+jets
W incl
Studying if we should subtract this contamination or try different template definition Find a balance between contamination and jet pT bias

A. Tricoli 83rd May 2013
QCD – W->mn +jetsTemplate shape bias
Our method assumes no change of shape in moving QCD events fromthe control region to the signal region
Test this hypothesis by comparing the shape of QCD MC in the signal selection to the data templates
The heavily signal contaminated templates (i.e. 1 & 3) show large differences in the zero jet bin, others are all more similar
Clear trend: templates have harder met spectrum than MC Is this a real bias or more general MC-data discrepancy for QCD?
A. Tricoli 93rd May 2013
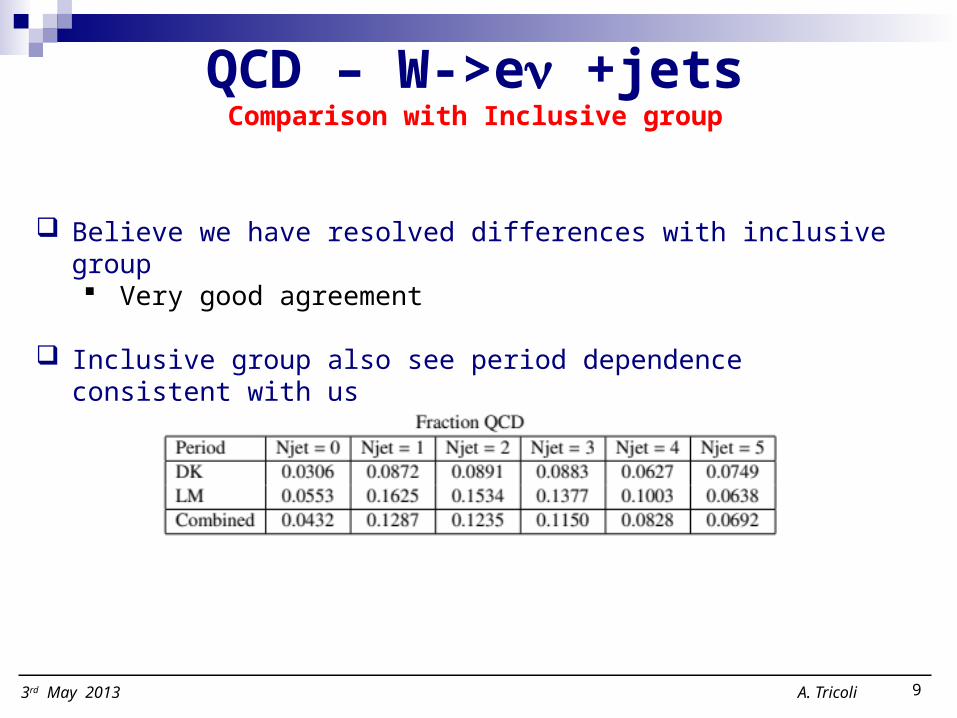
QCD – W->en +jetsComparison with Inclusive group
Believe we have resolved differences with inclusive group Very good agreement
Inclusive group also see period dependence consistent with us
A. Tricoli 103rd May 2013
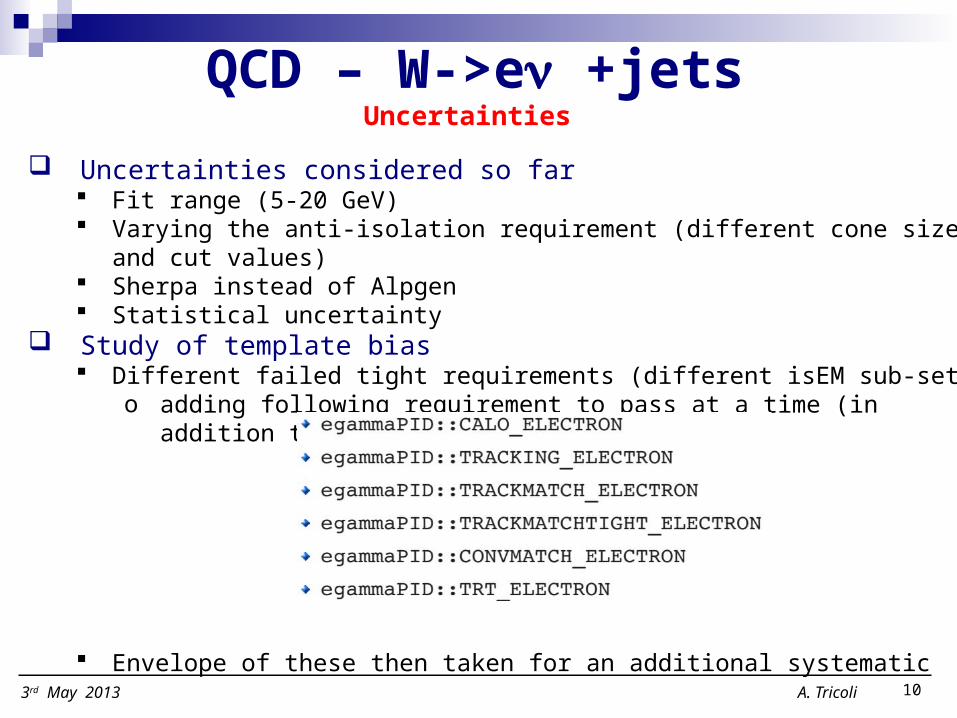
QCD – W->en +jetsUncertainties
Uncertainties considered so far Fit range (5-20 GeV) Varying the anti-isolation requirement (different cone sizes and cut values) Sherpa instead of Alpgen Statistical uncertainty
Study of template bias Different failed tight requirements (different isEM sub-sets)
o adding following requirement to pass at a time (in addition to loose+track quality):
Envelope of these then taken for an additional systematic

A. Tricoli 113rd May 2013
QCD – W->en +jetsUncertainties
Due to significantly reduced stats in the QCD template for TRACKMATCH bit reversalo Either we increase
stat. or eliminate stat fluctuations from sys.

A. Tricoli 123rd May 2013
Statistical fluctuations dominate systematics at high Njets From period L5 new triggers were introduced specifically for QCD
background estimations in the electron channel EF_e22vh_loose_4j15_a4tc_EFFS EF_e22vh_loose_3j20_a4tc_EFFS Loosely-identified electrons + 2 and 3 jets respectively (beware of e/j overlap)
with 15,20 GeV thresholds on HLT jets (Full Scan) Increase statistics of QCD Control Sample for 2 and more jets
Statistics increase of factor 2 to 5• 2.0x (Njets =2)• 3.4x (Njets =3)• 3.6x (Njets =4)• 4.1x (Njets =5)• 5.0x (Njets ≥6)
Need to check bias on distributions as 30 GeV cut offline on jet threshold is not at jet trigger efficiency plateau
QCD – W->en +jetsTrigger Statistics
A. Tricoli 133rd May 2013
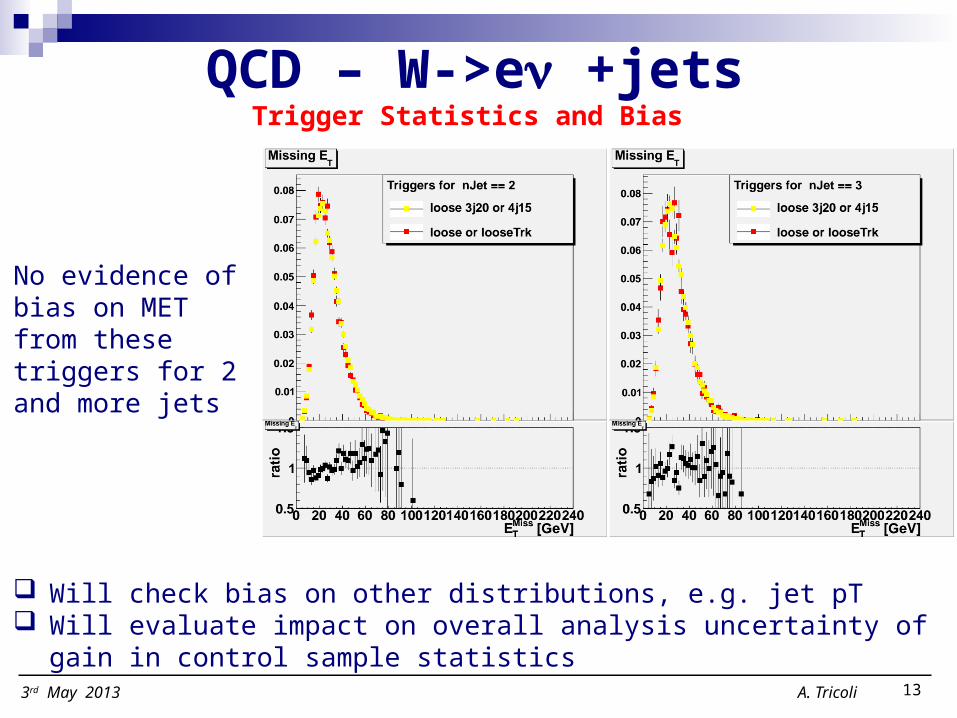
QCD – W->en +jetsTrigger Statistics and Bias
No evidence of bias on MET from these triggers for 2 and more jets
Will check bias on other distributions, e.g. jet pT Will evaluate impact on overall analysis uncertainty of gain in control
sample statistics
A. Tricoli 143rd May 2013
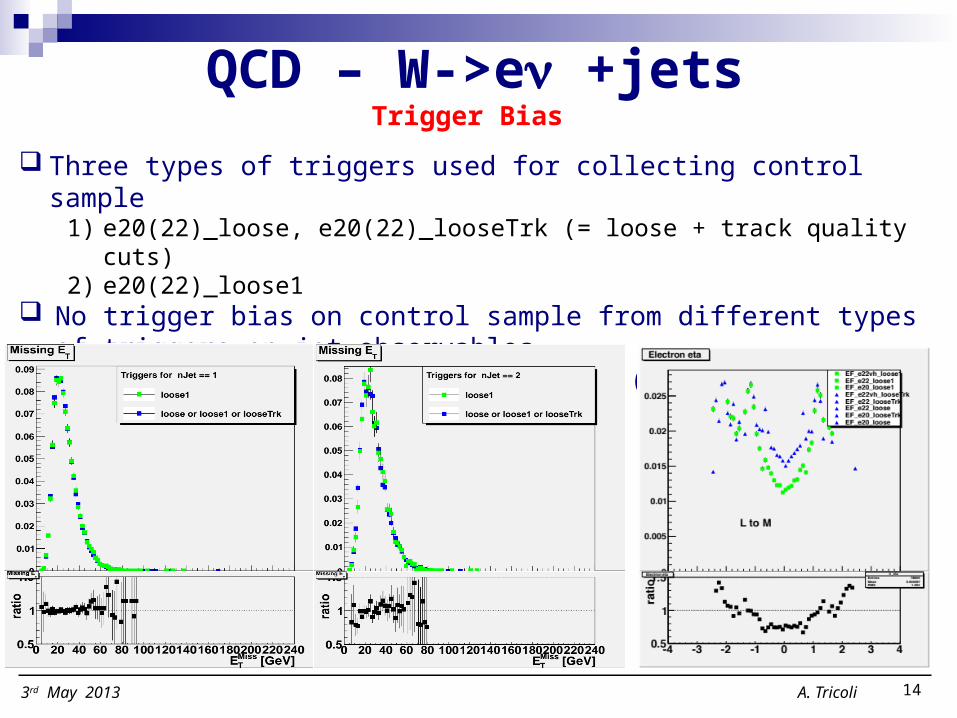
QCD – W->en +jetsTrigger Bias
Three types of triggers used for collecting control sample1) e20(22)_loose, e20(22)_looseTrk (= loose + track quality cuts)2) e20(22)_loose1
No trigger bias on control sample from different types of triggers on jet observables
However bias on electron kinematics (as expected)

A. Tricoli 15
Top Background Summary
Have fits from 3-jet to 7-jets for both electron and muon channel Have evaluated all major systematic uncertainties
But still have several cross checks to do with R+jets code Remaining outstanding items
Understanding fits using MET and Top mass Correlations between the QCD fit and top fit
3rd May 2013
A. Tricoli 16
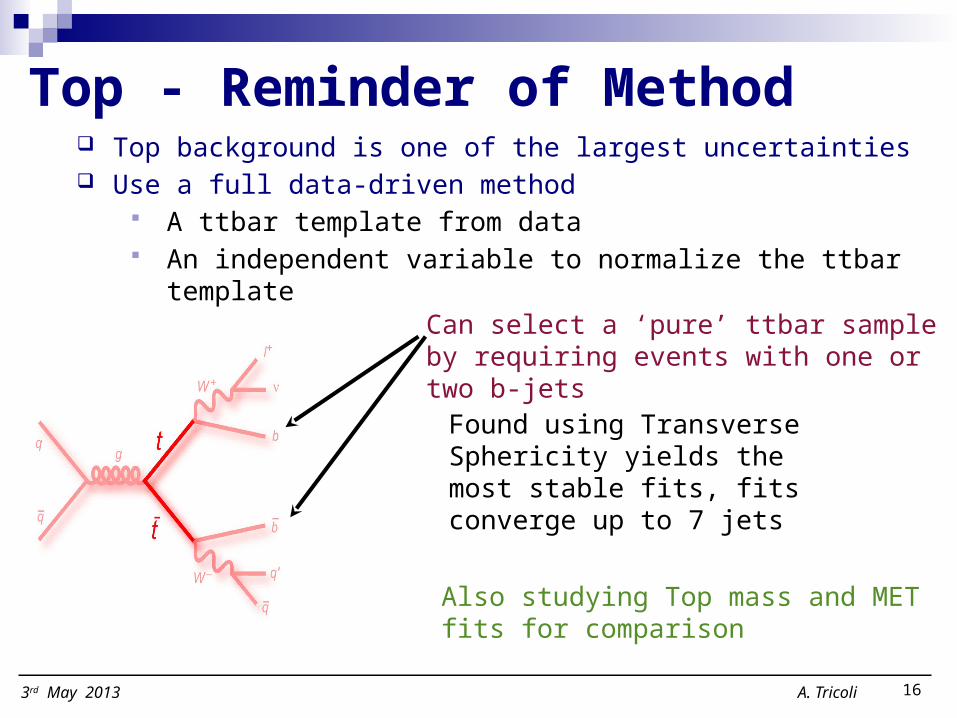
Top - Reminder of Method Top background is one of the largest uncertainties Use a full data-driven method
A ttbar template from data An independent variable to normalize the ttbar template
Can select a ‘pure’ ttbar sample by requiring events with one or two b-jets
Found using Transverse Sphericity yields the most stable fits, fits converge up to 7 jets
Also studying Top mass and MET fits for comparison
3rd May 2013
A. Tricoli 17
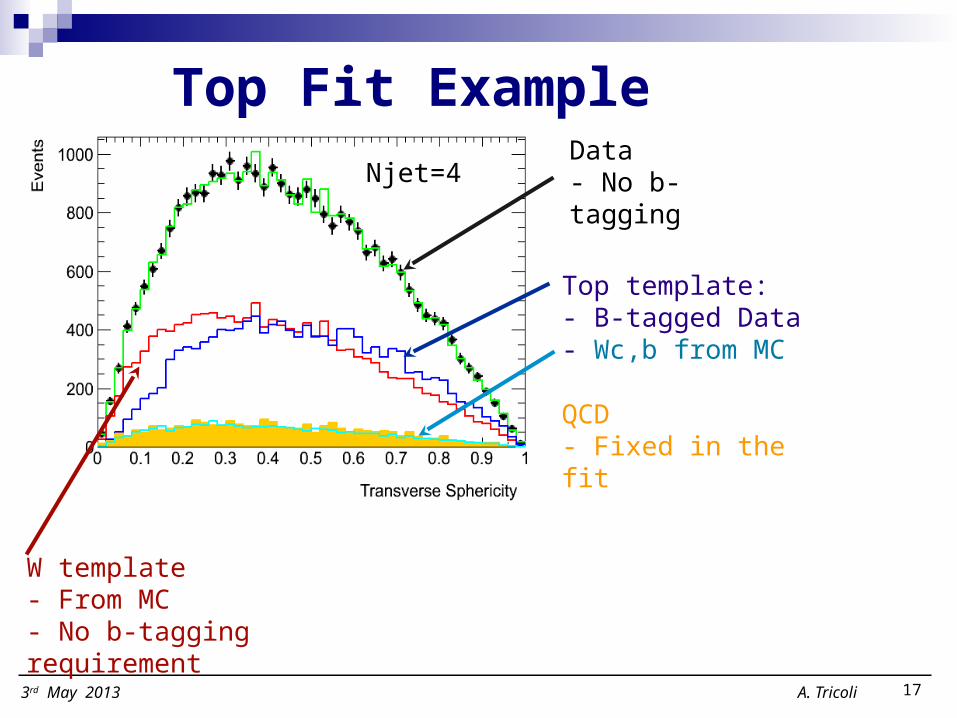
Top Fit Example
Top template: - B-tagged Data- Wc,b from MC
W template- From MC- No b-tagging requirement
Data- No b-tagging
QCD- Fixed in the fit
Njet=4
3rd May 2013
A. Tricoli 18
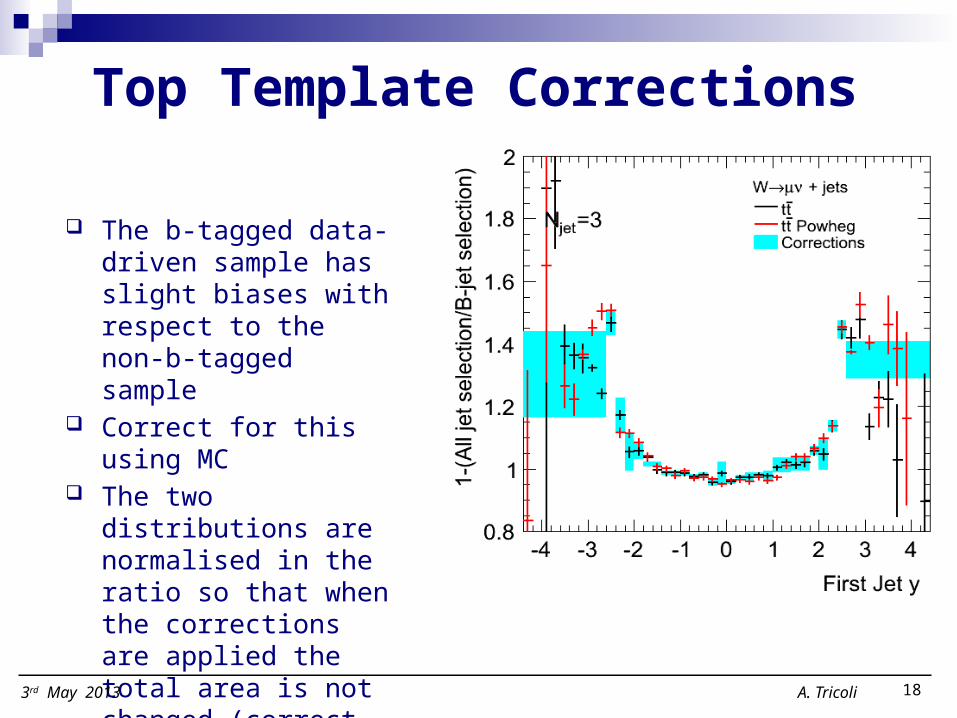
Top Template Corrections
The b-tagged data-driven sample has slight biases with respect to the non-b-tagged sample
Correct for this using MC The two distributions are
normalised in the ratio so that when the corrections are applied the total area is not changed (correct for bias on shape only)
3rd May 2013

A. Tricoli 19
Top - Wcc, Wbb Contamination Question was raised in EdBoard about
what k-factors to apply to the Wbb and Wcc samples
Estimate of the k-factor in the 1-jet and 2-jet bin where top contribution is small
Has small effect on the fit <4% at 3-jet (compared to 8% statistical uncertainty)
Use K-factor of 1.18 as systematic uncertainty
1-jet 2-jet
Wcc, Wbb Alpgen 1.11 1.18
Sherpa 0.95 1.02
3rd May 2013

A. Tricoli 20
Top - Uncertainties
Statistical uncertainties from the fit W signal model
Fit using W Sherpa sample Btagging bias correction
Use largest of statistical errors on Alpgen, or difference between Powheg vs Alpgen
Fit range, template shape dependence Compare the pseudo-data sets to truth as a function of fit range
Wcc, Wbb contamination subtraction Redo fits using K-factor of 1.18
Standard MC-based uncertainties on W template including B-tagging efficiency uncertainties (on b, c, and light) JES, JER, lepton energy scale, etc
3rd May 2013
A. Tricoli 21
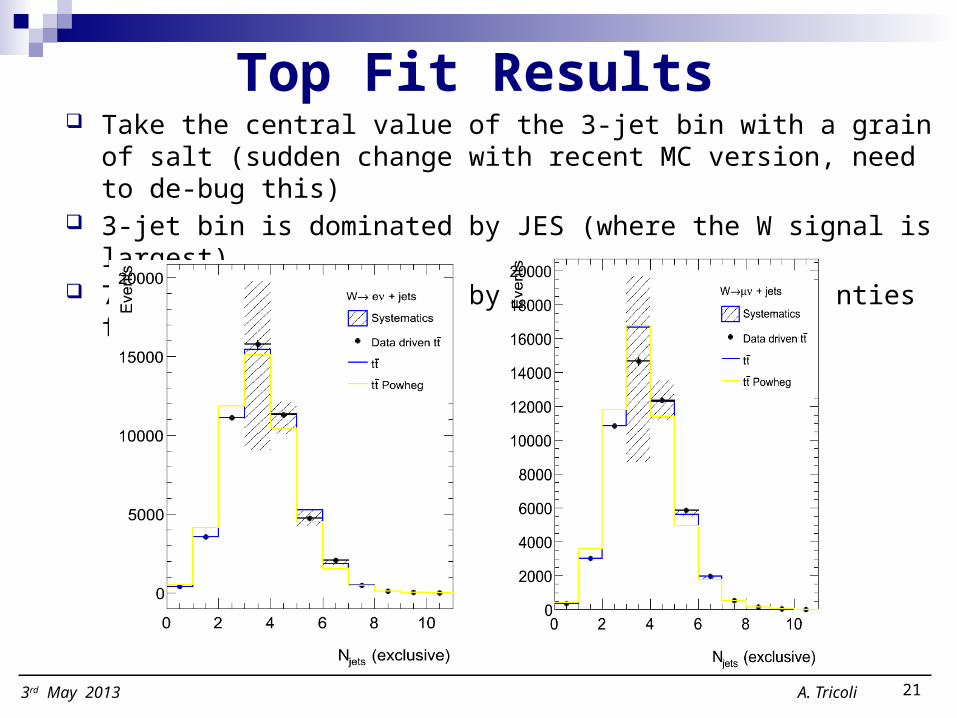
Top Fit Results Take the central value of the 3-jet bin with a grain of salt (sudden
change with recent MC version, need to de-bug this) 3-jet bin is dominated by JES (where the W signal is largest) 7-jet bin is dominated by statistical uncertainties from the fit
3rd May 2013

A. Tricoli 22
Top Fit Results Detector level distributions look good
MC Data-driven
3rd May 2013
A. Tricoli 23
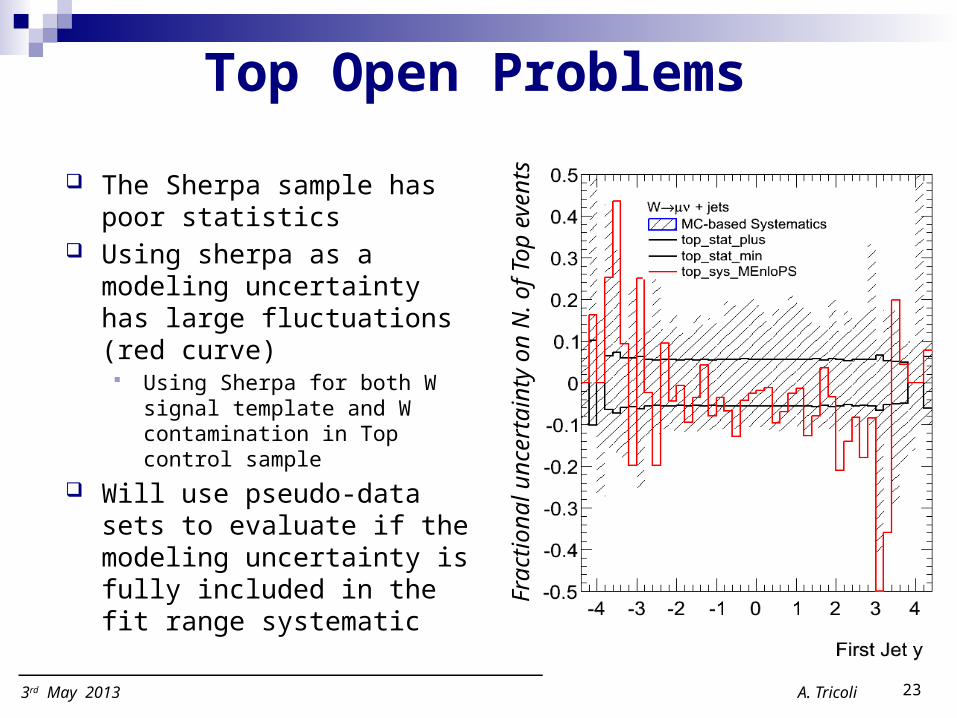
Top Open Problems
The Sherpa sample has poor statistics
Using sherpa as a modeling uncertainty has large fluctuations (red curve) Using Sherpa for both W signal
template and W contamination in Top control sample
Will use pseudo-data sets to evaluate if the modeling uncertainty is fully included in the fit range systematic
Fra
ctio
nal u
ncer
tain
ty o
n N
. of
Top
eve
nts
3rd May 2013
A. Tricoli 24
Top Open Problems
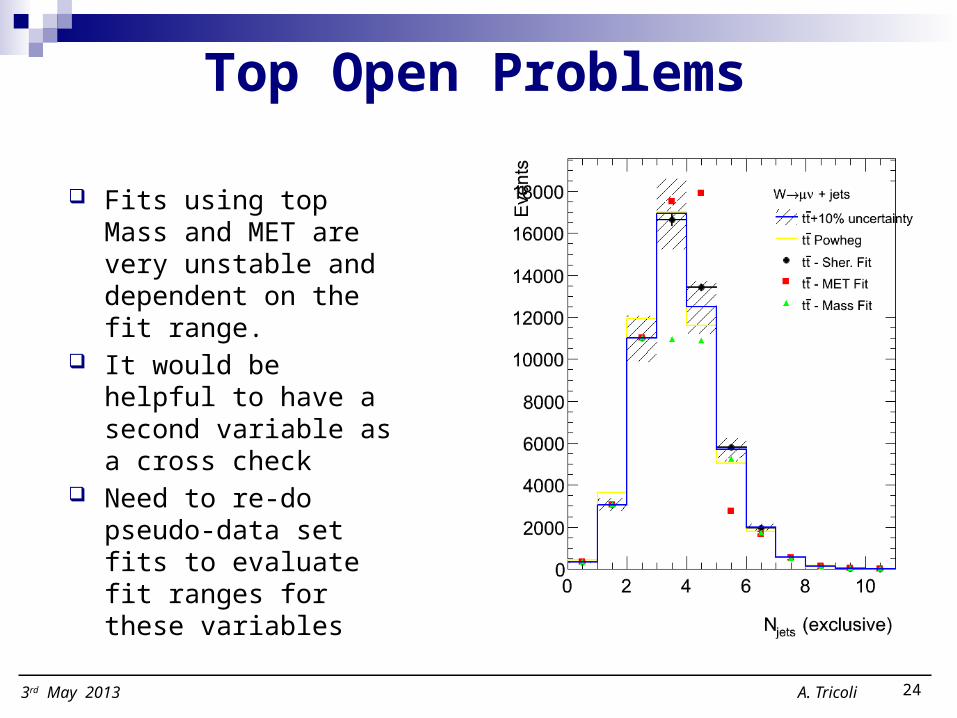
Fits using top Mass and MET are very unstable and dependent on the fit range.
It would be helpful to have a second variable as a cross check
Need to re-do pseudo-data set fits to evaluate fit ranges for these variables
3rd May 2013

A. Tricoli 25
QCD and Top - To Do List
QCD multi-jet background Re-evaluate systematics in W->mn channel Study W contamination in QCD control region and alternative control
samples (with no kinematic bias) in W->mn channel Study alternative method, e.g. isolation, in both channels Cross check strategy of systematics with W inclusive group
Top background Cross check all JES uncertainties, cutflow on MC with R+jets Add electron, muon systematics Cross check results with alternative fit methods, i.e. MET and Top
Mass, including their systematics Adding fit range systematic uncertainty and closure tests Correlation between QCD and Top data-driven estimations Evaluate Top background on Z (follow Z+jets/CMS method)
3rd May 2013
A. Tricoli 26
Backup
3rd May 2013

A. Tricoli 27
Pileup – muons
No need of period dependence fit in Muon Channel since same trigger used for signal and background samples pileup effects (e.g. broadening of MET
distribution) in signal sample is well reproduced by background sample
Oppositely to electron channel, QCD fraction seems to go down in L-M, by a factor ˜3 wrt D-K Is this because isolation becomes tighter with more pileup?
QCD control sample
Signal sample
Clear period-dependence of isolation distribution(D-K,L-M)
25th February 2013
Slide from 25 February

A. Tricoli 283rd May 2013
QCD – W->en +jetsSystematics – 5th jet