QBM117 Business Statistics Statistical Inference Sampling Distribution of the Sample Mean 1.
39
QBM117 Business Statistics Statistical Inference Sampling Distribution of the Sample Mean 1
-
date post
21-Dec-2015 -
Category
Documents
-
view
220 -
download
3
Transcript of QBM117 Business Statistics Statistical Inference Sampling Distribution of the Sample Mean 1.

QBM117Business Statistics
Statistical Inference
Sampling Distribution of the Sample Mean
1
Objectives
• To revise the differences between sample statistics and population parameters
• To introduce the sampling distribution of a sample statistic.
• To understand the central limit theorem.
2

Populations and Samples
• A population is the entire collection of items bout which information is desired.
• A sample is a subset of the population that we collect data from.
3

Parameters and Statistics
• A parameter is number that describes a population.- A parameter is a fixed number.
• A statistic is a number that describes a sample.- A statistic is a random variable whose value
changes from sample to sample.
4

Statistical Inference
• Population parameters are almost always unknown.
• We take a random sample from the population of interest and calculate the sample statistic.
• We then use the sample statistic as an estimate of the population parameter.
• Statistical Inference involves drawing conclusions about a population based on sample information.
5

Example 1
Electronics Associates Industry (EAI) is an international company that manufactures a diverse line of products. The firm’s Director of Personnel has been assigned the task of developing a profile of the company’s 2500 managers. One of the characteristics to be identified is the mean annual salary for the managers.
The population is the 2500 managers.
The population parameter is the mean annual salary of the 2500 managers. It is unknown.

The Director of Personnel does not have the time or the money required to develop a profile for all 2500 managers. He selects a simple random sample of 30 managers and finds that the mean annual salary for the sample is $69616.48.
The sample is the 30 managers randomly selected.
The sample statistic is the mean annual salary of the 30 managers in the sample, $69616.48.
The Director of Personnel then uses the mean annual salary of the sample of 30 managers to estimate the mean annual salary of all 2500 managers.
The process of using the mean annual salary of the sample of 30 managers as an estimate of the mean annual salary of all 2500 managers is known as statistical inference.

How do we know that the mean annual salary of the sample of 30 managers is a good estimate of the mean annual salary of all 2500 managers?
Suppose we select another simple random sample of 30 managers and find that this sample has a mean annual salary of $71374.35.70.
The sample mean annual salary will vary from sample to sample.

Sampling Distributions
• Sample statistics are random variables.
• The probability distribution of a sample statistic is called its sampling distribution.
• We us the sampling distribution to make inferences about the population parameters.
10

Sampling Distribution of the Sample Mean
• One of the most common statistical procedures involves using a sample mean to make inferences about an unknown population mean .
• We expect different samples to have different means.
• If we use random sampling, each possible sample of size n has the same probability of being selected.
• If we were to take every possible sample of size n from a population and calculate the mean for each sample, we would be able to find the probability distribution of the sample mean. 11
x
Example 1
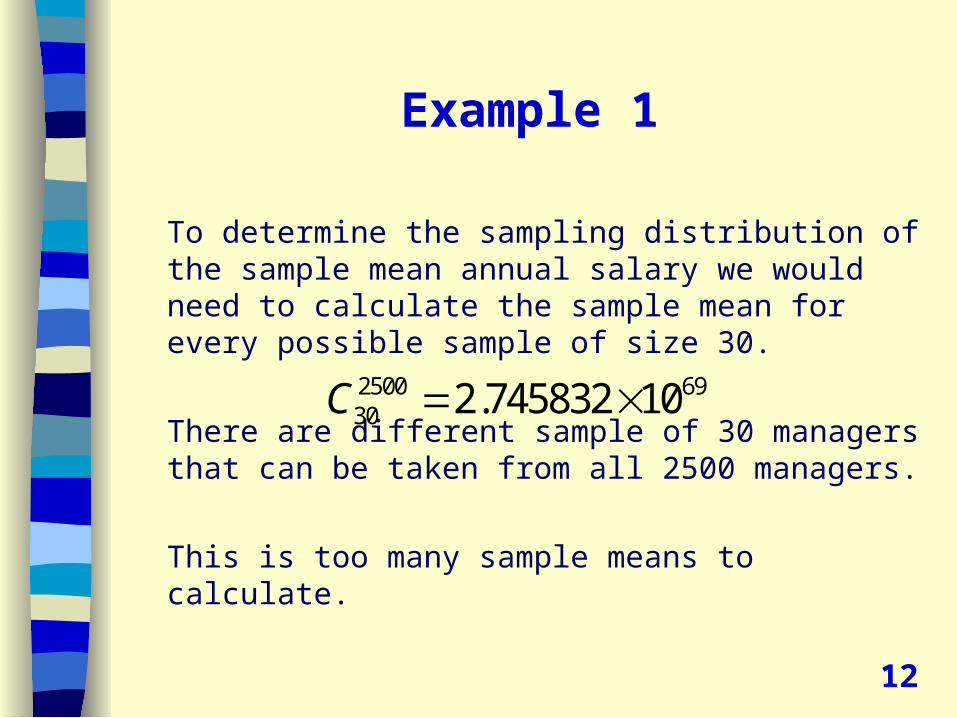
To determine the sampling distribution of the sample mean annual salary we would need to calculate the sample mean for every possible sample of size 30.
There are different sample of 30 managers that can be taken from all 2500 managers.
This is too many sample means to calculate.
2500 6930 2.745832 10C
12
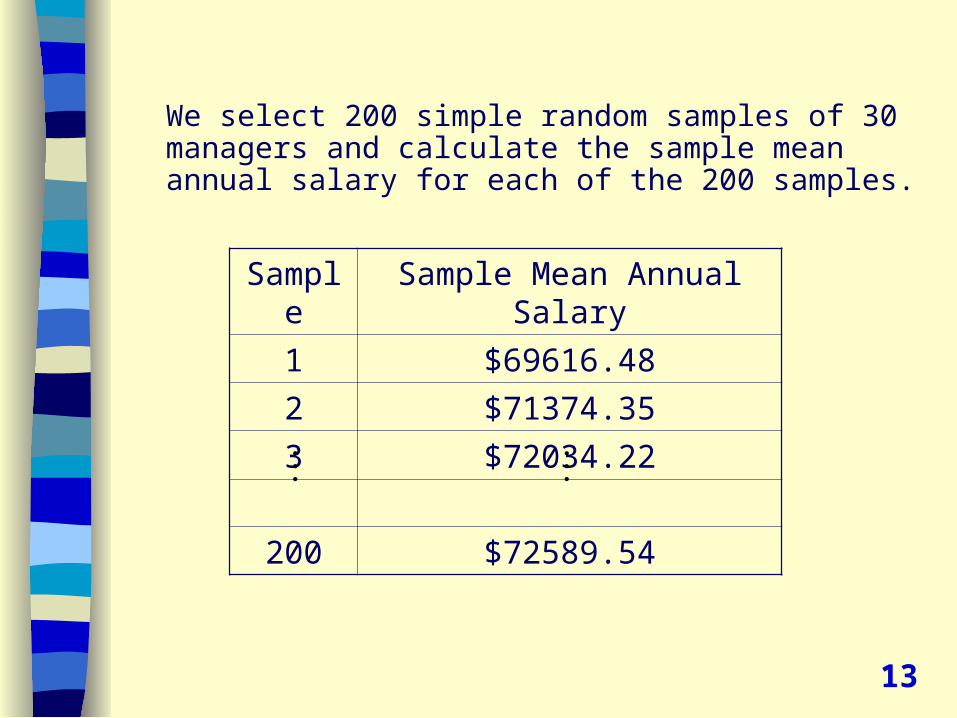
We select 200 simple random samples of 30 managers and calculate the sample mean annual salary for each of the 200 samples.
Sample Sample Mean Annual Salary
1 $69616.48
2 $71374.35
3 $72034.22
200 $72589.54
13

The histogram of the 200 sample mean annual salaries will give an approximation of the sampling distribution.
Histogram of the Sample Mean Annual Salaries of 200 Simple Random Samples of
Size 30
0
10
20
30
40
50
60
70000 70500 71000 71500 72000 72500 73000 73500 74000
Sample Mean Annual Salary
Fre
qu
en
cy
14

We can calculate the mean and the standard deviation of the sample mean annual salaries for the 200 samples.
The mean of the 200 sample mean annual salaries is $71842.13.
The standard deviation of the 200 sample mean annual salaries is $680.01.
15
The sampling distribution of the mean annual salary appears to be approximately normal with a mean of $71842.13 and a standard deviation of $680.01.
If we were to take all possible samples of 30 managers from all 2500 managers we would be able to find the exact sampling distribution.
692.745832 10
16
Sampling Distribution of the Sample Mean
• In practice we only take a single sample from a population and hence use a single sample meanto make inferences about the population parameter
• So how do we find the probability distribution of the sample mean finding that means of all possible samples?
• We use some general results.
17
x

Mean and Standard Deviation of the Sampling Distribution of the Sample Mean
• If is the mean of a random sample of size from a population with mean and standard deviation , then the mean and standard deviation of the sampling distribution of the sample mean are given by
• Note that is called the standard error of the mean.
18
x
n
x
xn
x

Example 1
Suppose that information has been obtained from all 2500 managers.
The population mean annual salary is
The population standard deviation is
A sample of 30 managers is to be taken. What is the mean and the standard deviation of the sampling distribution of the sample mean annual salary?
$71800
$4000
19

The mean of the sampling distribution of the sample mean annual salary is
The standard deviation of the sampling distribution of the sample mean annual salary is
$71800x
4000
30$730.30
xn
20

Shape of the Sampling Distribution of the Sample Mean
• We have described the centre and the spread of the sampling distribution of the sample mean, but what about the shape?
• The shape depends on the shape of the population distribution.
• If the population is normally distributed, then the sampling distribution of the sample mean is also normally distributed.
21

Example 1
Suppose that the annual salary of all 2500 managers is normally distributed with a mean of $61800 and a standard deviation of $4000.
A sample of 30 managers is to be taken. What is the sampling distribution of the mean annual salary of the sample?
22

Let = the annual salary
Let = the mean annual salary of a sample of size 30
We have already determined that the mean of the distribution of is $61800 and the standard deviation is $730.
Since the population from which the sample is being drawn is normally distributed, then the sampling distribution of the sample mean will be normally distributed.
2~ (71800,4000 )X N
X
X
X
2~ (61800,730.30 )X N23
Shape of the Sampling Distribution of the Sample Mean
• What happens when the population distribution is not normal?
• It turns out that as the sample size increases, the distribution of gets closer to a normal distribution, no matter what the shape the population distribution has.
24
X

Central Limit Theorem
If a random sample is draw from any population, the sampling distribution of the sample mean is approximately normal for a sufficiently large sample size.
The larger the sample size, the more closely the sampling distribution of will resemble a normal distribution.
25
X
Large Sample Size
• How large does a sample need to be to be considered sufficiently large?
• Generally a sample size of is large enough to ensure that the sampling distribution of is approximately normal.
• However if a population is extremely non-normal, the sampling distribution will also be non-normal, even for moderately large values of
26
30nX
n

Sampling Distribution of the Sample Mean
If is normally distributed, then is normally distributed.
If is non-normal, then is approximately normally distributed for sufficiently large sample sizes.
x
xn
X X
X X
27
Using the Sampling Distribution for Inference
• Recall from Topic 2 that if is normally distributed with mean and standard deviation then
has a standard normal distribution with mean 0 and standard deviation 1.
XZ
X
28
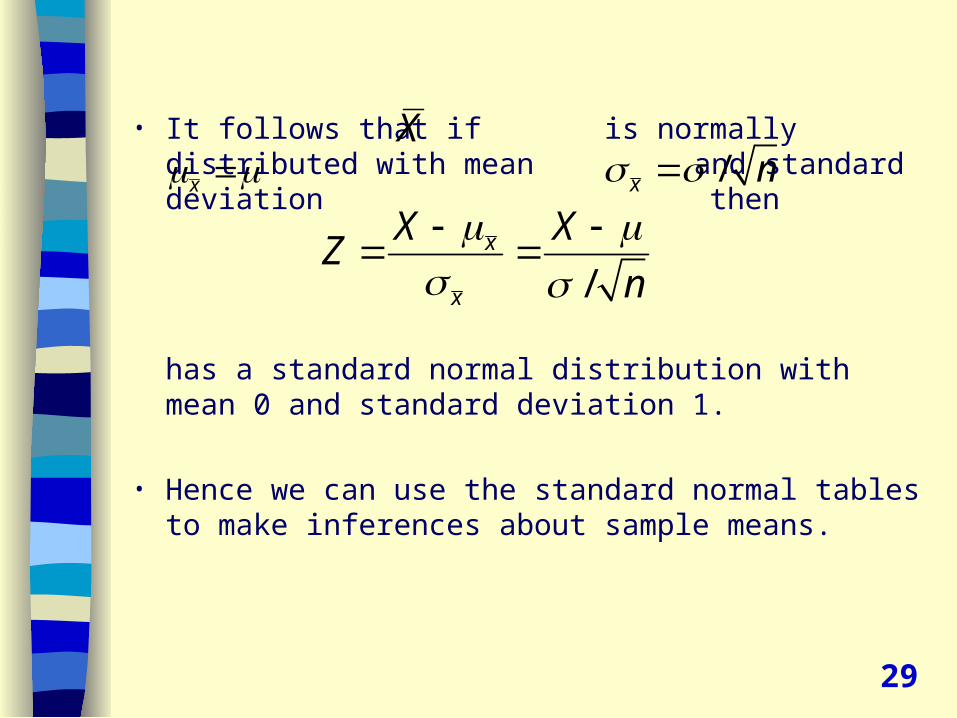
• It follows that if is normally distributed with mean and standard deviation then
has a standard normal distribution with mean 0 and standard deviation 1.
• Hence we can use the standard normal tables to make inferences about sample means.
/x
x
X XZ
n
Xx /x n
29

Example 2
A federal inspector for weights and measures, visits a packaging plant to check that the net weight if packages is as indicated on the packages. The manager assures the inspector that the packaging process results in a mean weight of 750g with a standard deviation of 14g. The inspector selects 100 packages at random and finds their mean weight to be 748.5g.
If the managers claim is correct, how likely is a sample mean of 748.g or less?
30

Let X = weight of package
The manager claims that
The inspector has taken a sample of size 100.
Let = mean weight of a sample of 100 packages
Using the Central Limit Theorem we know that will be approximately normally distributed with a mean and standard deviation of
2~ (750,14 )X N
750g
141.4
100
x
xn
X
X
31

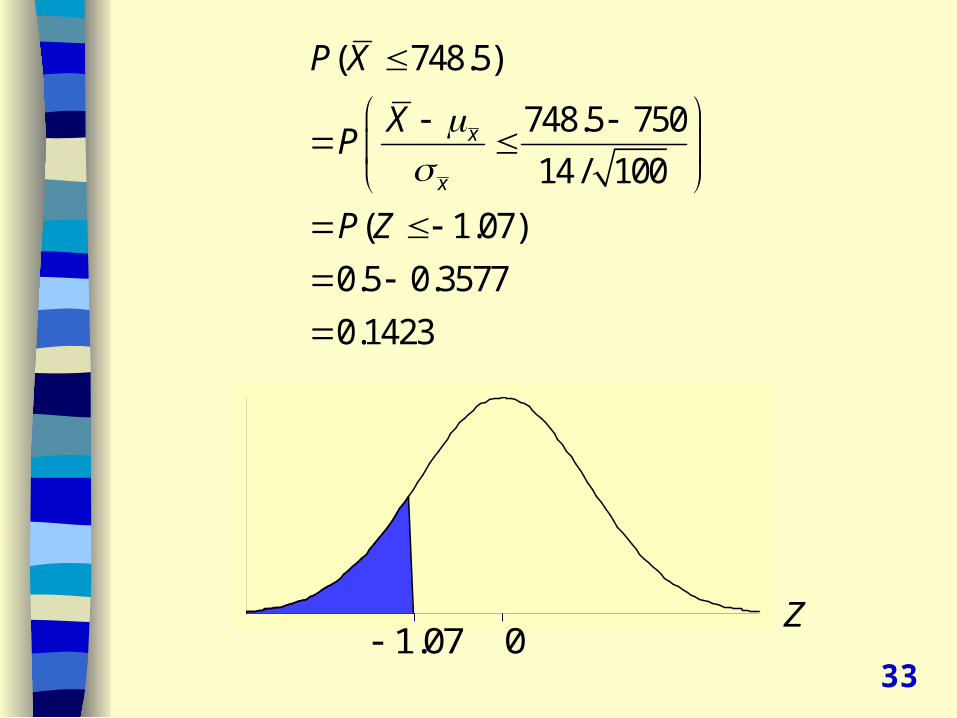
If the managers claim is correct, how likely is a sample mean of 748.5g or less?
We want to find ( 748.5)P X
X750748.5
32
Z01.07
( 748.5)
748.5 750
14 / 100
( 1.07)
0.5 0.3577
0.1423
x
x
P X
XP
P Z
33

Example 3
The weight of a ’32g’ chocolate bar is normally distributed with a mean of 32.2g and a standard deviation of 0.3g.
a. If a customer buys one chocolate bar, what is the probability that the bar will weigh less than 32g?
b. If a customer buys a pack of 4 bars, what is the probability that the mean weight of the 4 bars will be less than 32g?
34

a. X = weight of a chocolate bar
If a customer buys one chocolate bar, the probability that the bar will weight less than 32g:
2~ (32.2,0.3 )X N
( 32)
32 32.2
0.3
( 0.67)
0.5 0.2486
0.2514
P X
XP
P Z
X
Z00.67
32 32.2

b. = mean weight of a sample of 4 chocolate bars
We know that
therefore
We want to find the probability that if a customer buys a pack of 4 chocolate bars, the mean weight of the 4 bars will be less than 32g.
Hence we want to find
X
20.3
~ 32.2,4
X N
2~ (32.2,0.3 )X N
( 32)P X
36

( 32)
32 32.2
0.3/ 4
( 1.33)
0.5 0.4082
0.0918
x
x
P X
XP
P Z
X32 32.2
Z1.33 0
37
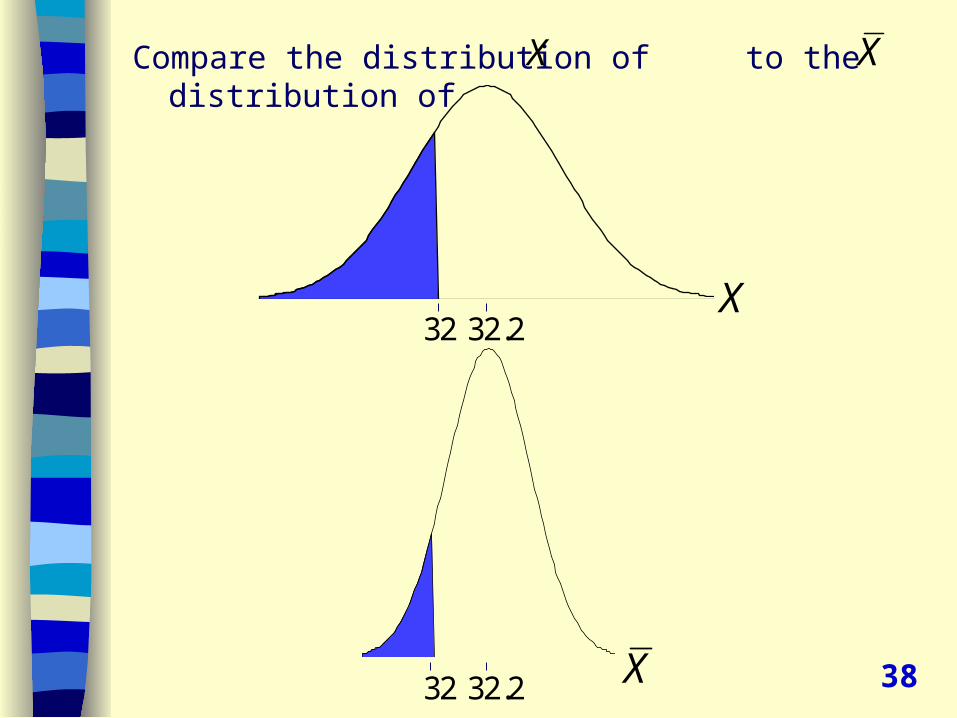
Compare the distribution of to the distribution of X X
X
X
32.232
32.232 38
Reading for next lecture
• Chapter 8, Sections 8.1-8.3
Exercises
• 7.9• 7.21• 7.22• 7.23
39