QB1. SHOWCARD Which of the following do you, or does ... · SHOWCARD Which, if any, of these do you...
26
OFCOM NATIONS & REGIONS TRACKER - MAIN SET - QUARTER 1 2015. 3rd January to 28th February 2015. Prepared by Saville Rossiter-Base : 01727 899 399 QB1. SHOWCARD Which of the following do you, or does anyone in your household, have in your home at the moment? (MULTI CODE) ......................................................................................................................................................................................................... 42 Base : All QB1 respondents QB2. SHOWCARD And do you personally use...? (MULTI CODE) ............................................................................................................................................................................................................................................................................................................................ 48 Base : All QB1 respondents QB3 (QB4). SHOWCARD Which games console/s do you or does anyone in your household have at the moment? (MULTI CODE) ................................................................................................................................................................................................................... 54 Base : Those who have access to a games console at home QB4 (QB5). SHOWCARD Which, if any, of these do you use your games console for? (MULTI CODE) ................................................................................................................................................................................................................................................................. 59 Base : Those who have access to a games console at home QB5 (QB6) Does your household's e-reader (digital book reader) have built-in 3G or 4G access to a mobile network? This means that books can be purchased online and downloaded from anywhere with a signal, without the need for a Wi-Fi connection? .............. 65 Base : Those who personally use an e-reader/ digital book reader
Transcript of QB1. SHOWCARD Which of the following do you, or does ... · SHOWCARD Which, if any, of these do you...

OFCOM NATIONS & REGIONS TRACKER - MAIN SET - QUARTER 1 2015. 3rd January to 28th February 2015.
Prepared by Saville Rossiter-Base : 01727 899 399
QB1. SHOWCARD Which of the following do you, or does anyone in your household, have in your home at the moment? (MULTI CODE) .........................................................................................................................................................................................................42Base : All QB1 respondents
QB2. SHOWCARD And do you personally use...? (MULTI CODE)............................................................................................................................................................................................................................................................................................................................48Base : All QB1 respondents
QB3 (QB4). SHOWCARD Which games console/s do you or does anyone in your household have at the moment? (MULTI CODE) ...................................................................................................................................................................................................................54Base : Those who have access to a games console at home
QB4 (QB5). SHOWCARD Which, if any, of these do you use your games console for? (MULTI CODE) .................................................................................................................................................................................................................................................................59Base : Those who have access to a games console at home
QB5 (QB6) Does your household's e-reader (digital book reader) have built-in 3G or 4G access to a mobile network? This means that books can be purchased online and downloaded from anywhere with a signal, without the need for a Wi-Fi connection? ..............65Base : Those who personally use an e-reader/ digital book reader
Prepared by Saville Rossiter-Base : 01727 899 399
OFCOM NATIONS & REGIONS TRACKER - MAIN SET - QUARTER 1 2015. 3rd January to 28th February 2015. Table 16
All data have been weighted to ensure they are representative of the UK adult population. Ofcom does not quota or weight by household income, so it may not be representative of the UK population, but it is included for reasons of interest. Any break column with abase size lower than 100 has been removed as margins of error become too great. Data is tested at the 95% confidence level.
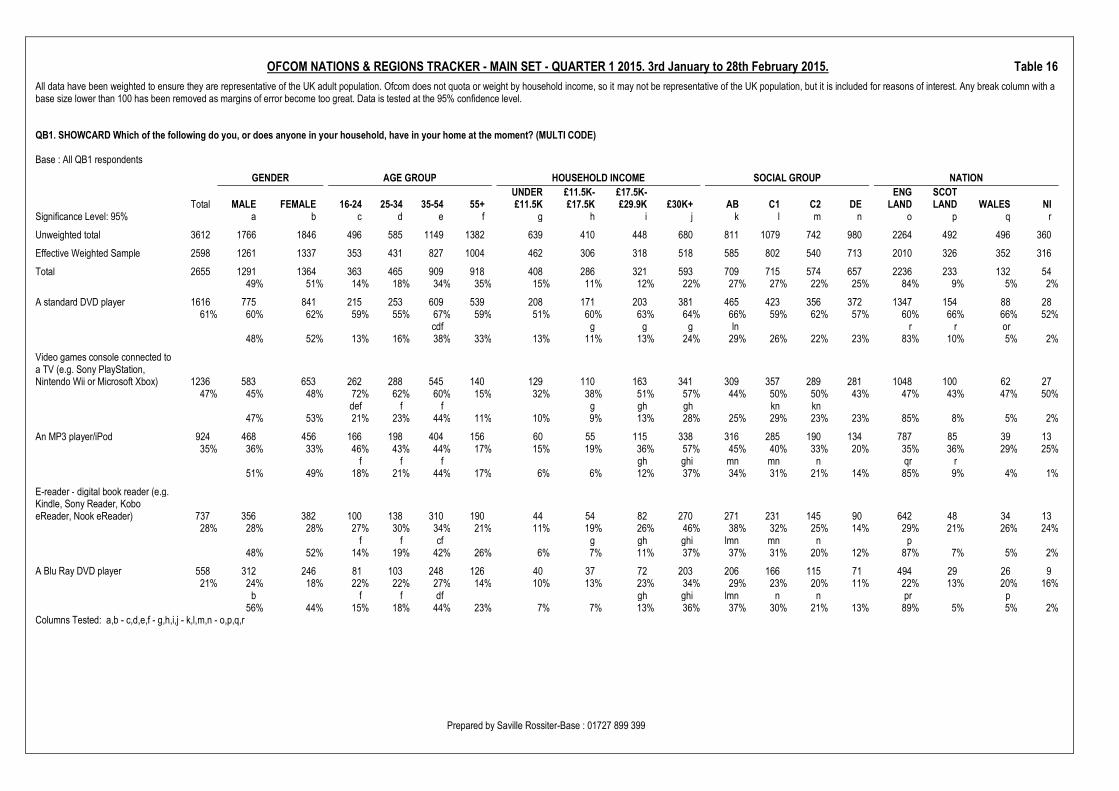
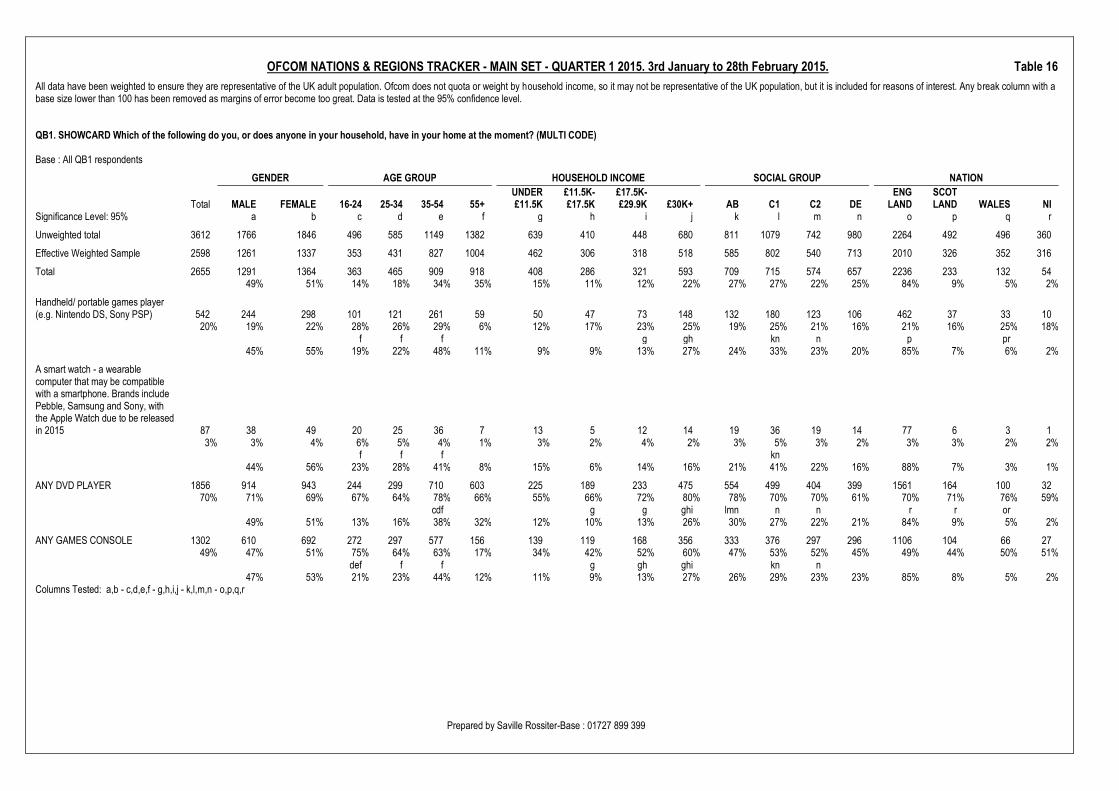
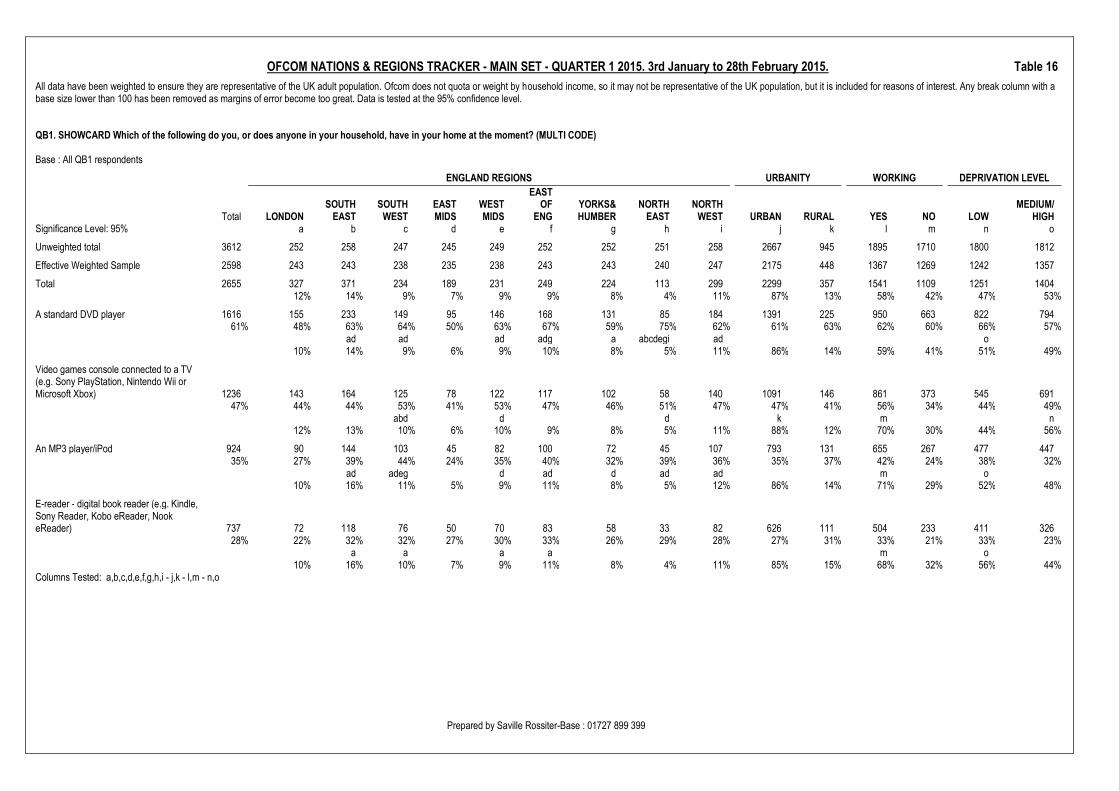
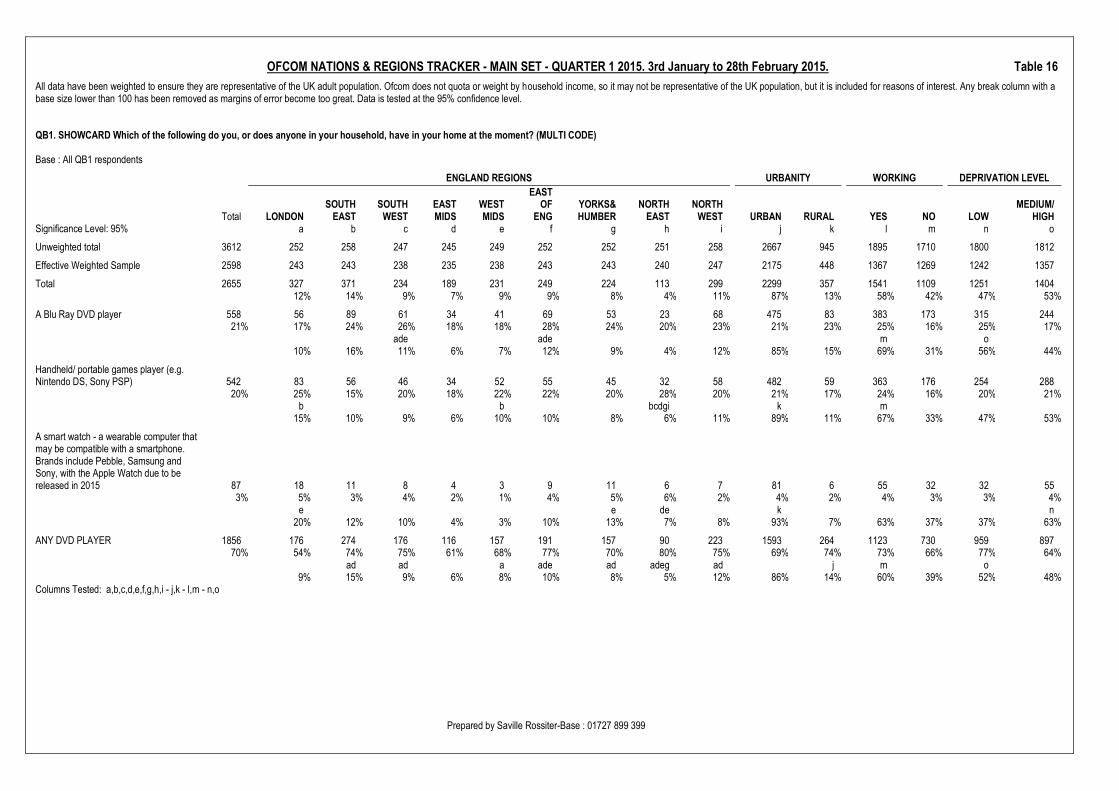
QB1. SHOWCARD Which of the following do you, or does anyone in your household, have in your home at the moment? (MULTI CODE)
Base : All QB1 respondents
GENDER AGE GROUP HOUSEHOLD INCOME SOCIAL GROUP NATION
Total MALE FEMALE 16-24 25-34 35-54 55+UNDER£11.5K
£11.5K-£17.5K
£17.5K-£29.9K £30K+ AB C1 C2 DE
ENGLAND
SCOTLAND WALES NI
Significance Level: 95% a b c d e f g h i j k l m n o p q r
Unweighted total 3612 1766 1846 496 585 1149 1382 639 410 448 680 811 1079 742 980 2264 492 496 360
Effective Weighted Sample 2598 1261 1337 353 431 827 1004 462 306 318 518 585 802 540 713 2010 326 352 316
Total 2655 1291 1364 363 465 909 918 408 286 321 593 709 715 574 657 2236 233 132 5449% 51% 14% 18% 34% 35% 15% 11% 12% 22% 27% 27% 22% 25% 84% 9% 5% 2%
A standard DVD player 1616 775 841 215 253 609 539 208 171 203 381 465 423 356 372 1347 154 88 2861% 60% 62% 59% 55% 67% 59% 51% 60% 63% 64% 66% 59% 62% 57% 60% 66% 66% 52%
cdf g g g ln r r or48% 52% 13% 16% 38% 33% 13% 11% 13% 24% 29% 26% 22% 23% 83% 10% 5% 2%
Video games console connected toa TV (e.g. Sony PlayStation,Nintendo Wii or Microsoft Xbox) 1236 583 653 262 288 545 140 129 110 163 341 309 357 289 281 1048 100 62 27
47% 45% 48% 72% 62% 60% 15% 32% 38% 51% 57% 44% 50% 50% 43% 47% 43% 47% 50%def f f g gh gh kn kn
47% 53% 21% 23% 44% 11% 10% 9% 13% 28% 25% 29% 23% 23% 85% 8% 5% 2%
An MP3 player/iPod 924 468 456 166 198 404 156 60 55 115 338 316 285 190 134 787 85 39 1335% 36% 33% 46% 43% 44% 17% 15% 19% 36% 57% 45% 40% 33% 20% 35% 36% 29% 25%
f f f gh ghi mn mn n qr r51% 49% 18% 21% 44% 17% 6% 6% 12% 37% 34% 31% 21% 14% 85% 9% 4% 1%
E-reader - digital book reader (e.g.Kindle, Sony Reader, KoboeReader, Nook eReader) 737 356 382 100 138 310 190 44 54 82 270 271 231 145 90 642 48 34 13
28% 28% 28% 27% 30% 34% 21% 11% 19% 26% 46% 38% 32% 25% 14% 29% 21% 26% 24%f f cf g gh ghi lmn mn n p
48% 52% 14% 19% 42% 26% 6% 7% 11% 37% 37% 31% 20% 12% 87% 7% 5% 2%
A Blu Ray DVD player 558 312 246 81 103 248 126 40 37 72 203 206 166 115 71 494 29 26 921% 24% 18% 22% 22% 27% 14% 10% 13% 23% 34% 29% 23% 20% 11% 22% 13% 20% 16%
b f f df gh ghi lmn n n pr p56% 44% 15% 18% 44% 23% 7% 7% 13% 36% 37% 30% 21% 13% 89% 5% 5% 2%
Columns Tested: a,b - c,d,e,f - g,h,i,j - k,l,m,n - o,p,q,r
Prepared by Saville Rossiter-Base : 01727 899 399
OFCOM NATIONS & REGIONS TRACKER - MAIN SET - QUARTER 1 2015. 3rd January to 28th February 2015. Table 16
All data have been weighted to ensure they are representative of the UK adult population. Ofcom does not quota or weight by household income, so it may not be representative of the UK population, but it is included for reasons of interest. Any break column with abase size lower than 100 has been removed as margins of error become too great. Data is tested at the 95% confidence level.
QB1. SHOWCARD Which of the following do you, or does anyone in your household, have in your home at the moment? (MULTI CODE)
Base : All QB1 respondents
GENDER AGE GROUP HOUSEHOLD INCOME SOCIAL GROUP NATION
Total MALE FEMALE 16-24 25-34 35-54 55+UNDER£11.5K
£11.5K-£17.5K
£17.5K-£29.9K £30K+ AB C1 C2 DE
ENGLAND
SCOTLAND WALES NI
Significance Level: 95% a b c d e f g h i j k l m n o p q r
Unweighted total 3612 1766 1846 496 585 1149 1382 639 410 448 680 811 1079 742 980 2264 492 496 360
Effective Weighted Sample 2598 1261 1337 353 431 827 1004 462 306 318 518 585 802 540 713 2010 326 352 316
Total 2655 1291 1364 363 465 909 918 408 286 321 593 709 715 574 657 2236 233 132 5449% 51% 14% 18% 34% 35% 15% 11% 12% 22% 27% 27% 22% 25% 84% 9% 5% 2%
Handheld/ portable games player(e.g. Nintendo DS, Sony PSP) 542 244 298 101 121 261 59 50 47 73 148 132 180 123 106 462 37 33 10
20% 19% 22% 28% 26% 29% 6% 12% 17% 23% 25% 19% 25% 21% 16% 21% 16% 25% 18%f f f g gh kn n p pr
45% 55% 19% 22% 48% 11% 9% 9% 13% 27% 24% 33% 23% 20% 85% 7% 6% 2%
A smart watch - a wearablecomputer that may be compatiblewith a smartphone. Brands includePebble, Samsung and Sony, withthe Apple Watch due to be releasedin 2015 87 38 49 20 25 36 7 13 5 12 14 19 36 19 14 77 6 3 1
3% 3% 4% 6% 5% 4% 1% 3% 2% 4% 2% 3% 5% 3% 2% 3% 3% 2% 2%f f f kn
44% 56% 23% 28% 41% 8% 15% 6% 14% 16% 21% 41% 22% 16% 88% 7% 3% 1%
ANY DVD PLAYER 1856 914 943 244 299 710 603 225 189 233 475 554 499 404 399 1561 164 100 3270% 71% 69% 67% 64% 78% 66% 55% 66% 72% 80% 78% 70% 70% 61% 70% 71% 76% 59%
cdf g g ghi lmn n n r r or49% 51% 13% 16% 38% 32% 12% 10% 13% 26% 30% 27% 22% 21% 84% 9% 5% 2%
ANY GAMES CONSOLE 1302 610 692 272 297 577 156 139 119 168 356 333 376 297 296 1106 104 66 2749% 47% 51% 75% 64% 63% 17% 34% 42% 52% 60% 47% 53% 52% 45% 49% 44% 50% 51%
def f f g gh ghi kn n47% 53% 21% 23% 44% 12% 11% 9% 13% 27% 26% 29% 23% 23% 85% 8% 5% 2%
Columns Tested: a,b - c,d,e,f - g,h,i,j - k,l,m,n - o,p,q,r

Prepared by Saville Rossiter-Base : 01727 899 399
OFCOM NATIONS & REGIONS TRACKER - MAIN SET - QUARTER 1 2015. 3rd January to 28th February 2015. Table 16
All data have been weighted to ensure they are representative of the UK adult population. Ofcom does not quota or weight by household income, so it may not be representative of the UK population, but it is included for reasons of interest. Any break column with abase size lower than 100 has been removed as margins of error become too great. Data is tested at the 95% confidence level.
QB1. SHOWCARD Which of the following do you, or does anyone in your household, have in your home at the moment? (MULTI CODE)
Base : All QB1 respondents
GENDER AGE GROUP HOUSEHOLD INCOME SOCIAL GROUP NATION
Total MALE FEMALE 16-24 25-34 35-54 55+UNDER£11.5K
£11.5K-£17.5K
£17.5K-£29.9K £30K+ AB C1 C2 DE
ENGLAND
SCOTLAND WALES NI
Significance Level: 95% a b c d e f g h i j k l m n o p q r
Unweighted total 3612 1766 1846 496 585 1149 1382 639 410 448 680 811 1079 742 980 2264 492 496 360
Effective Weighted Sample 2598 1261 1337 353 431 827 1004 462 306 318 518 585 802 540 713 2010 326 352 316
Total 2655 1291 1364 363 465 909 918 408 286 321 593 709 715 574 657 2236 233 132 5449% 51% 14% 18% 34% 35% 15% 11% 12% 22% 27% 27% 22% 25% 84% 9% 5% 2%
None of these 431 194 237 32 66 84 249 127 52 41 39 77 100 90 163 372 39 12 816% 15% 17% 9% 14% 9% 27% 31% 18% 13% 7% 11% 14% 16% 25% 17% 17% 9% 15%
ce cde hij j j k klm q q q45% 55% 7% 15% 19% 58% 30% 12% 10% 9% 18% 23% 21% 38% 86% 9% 3% 2%
Don't know 6 4 1 - 3 - 2 - 1 2 - 3 - 1 1 6 - - -*% *% *% -% 1% -% *% -% *% 1% -% *% -% *% *% *% -% -% -%
e74% 26% -% 59% -% 41% -% 20% 33% -% 53% -% 26% 21% 100% -% -% -%
Columns Tested: a,b - c,d,e,f - g,h,i,j - k,l,m,n - o,p,q,r
Prepared by Saville Rossiter-Base : 01727 899 399
OFCOM NATIONS & REGIONS TRACKER - MAIN SET - QUARTER 1 2015. 3rd January to 28th February 2015. Table 16
All data have been weighted to ensure they are representative of the UK adult population. Ofcom does not quota or weight by household income, so it may not be representative of the UK population, but it is included for reasons of interest. Any break column with abase size lower than 100 has been removed as margins of error become too great. Data is tested at the 95% confidence level.
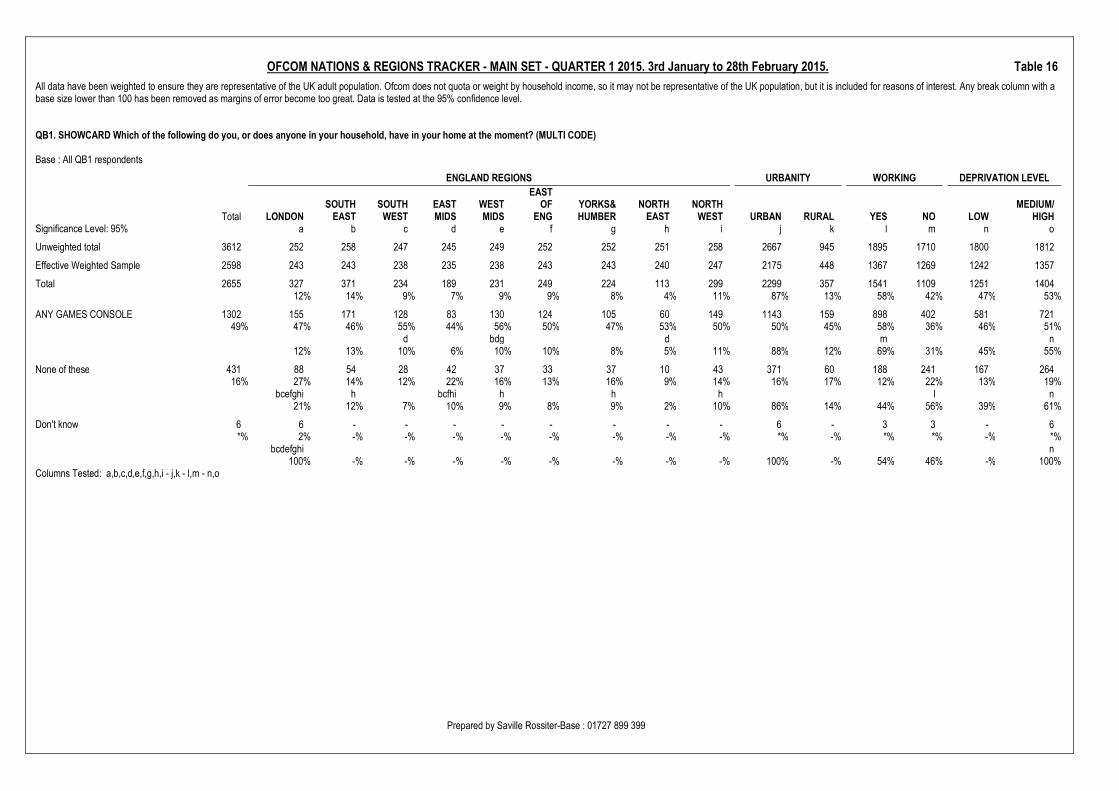
QB1. SHOWCARD Which of the following do you, or does anyone in your household, have in your home at the moment? (MULTI CODE)
Base : All QB1 respondents
ENGLAND REGIONS URBANITY WORKING DEPRIVATION LEVEL
Total LONDONSOUTH
EASTSOUTH
WESTEASTMIDS
WESTMIDS
EASTOF
ENGYORKS&HUMBER
NORTHEAST
NORTHWEST URBAN RURAL YES NO LOW
MEDIUM/HIGH
Significance Level: 95% a b c d e f g h i j k l m n o
Unweighted total 3612 252 258 247 245 249 252 252 251 258 2667 945 1895 1710 1800 1812
Effective Weighted Sample 2598 243 243 238 235 238 243 243 240 247 2175 448 1367 1269 1242 1357
Total 2655 327 371 234 189 231 249 224 113 299 2299 357 1541 1109 1251 140412% 14% 9% 7% 9% 9% 8% 4% 11% 87% 13% 58% 42% 47% 53%
A standard DVD player 1616 155 233 149 95 146 168 131 85 184 1391 225 950 663 822 79461% 48% 63% 64% 50% 63% 67% 59% 75% 62% 61% 63% 62% 60% 66% 57%
ad ad ad adg a abcdegi ad o10% 14% 9% 6% 9% 10% 8% 5% 11% 86% 14% 59% 41% 51% 49%
Video games console connected to a TV(e.g. Sony PlayStation, Nintendo Wii orMicrosoft Xbox) 1236 143 164 125 78 122 117 102 58 140 1091 146 861 373 545 691
47% 44% 44% 53% 41% 53% 47% 46% 51% 47% 47% 41% 56% 34% 44% 49%abd d d k m n
12% 13% 10% 6% 10% 9% 8% 5% 11% 88% 12% 70% 30% 44% 56%
An MP3 player/iPod 924 90 144 103 45 82 100 72 45 107 793 131 655 267 477 44735% 27% 39% 44% 24% 35% 40% 32% 39% 36% 35% 37% 42% 24% 38% 32%
ad adeg d ad d ad ad m o10% 16% 11% 5% 9% 11% 8% 5% 12% 86% 14% 71% 29% 52% 48%
E-reader - digital book reader (e.g. Kindle,Sony Reader, Kobo eReader, NookeReader) 737 72 118 76 50 70 83 58 33 82 626 111 504 233 411 326
28% 22% 32% 32% 27% 30% 33% 26% 29% 28% 27% 31% 33% 21% 33% 23%a a a a m o
10% 16% 10% 7% 9% 11% 8% 4% 11% 85% 15% 68% 32% 56% 44%Columns Tested: a,b,c,d,e,f,g,h,i - j,k - l,m - n,o
Prepared by Saville Rossiter-Base : 01727 899 399
OFCOM NATIONS & REGIONS TRACKER - MAIN SET - QUARTER 1 2015. 3rd January to 28th February 2015. Table 16
All data have been weighted to ensure they are representative of the UK adult population. Ofcom does not quota or weight by household income, so it may not be representative of the UK population, but it is included for reasons of interest. Any break column with abase size lower than 100 has been removed as margins of error become too great. Data is tested at the 95% confidence level.
QB1. SHOWCARD Which of the following do you, or does anyone in your household, have in your home at the moment? (MULTI CODE)
Base : All QB1 respondents
ENGLAND REGIONS URBANITY WORKING DEPRIVATION LEVEL
Total LONDONSOUTH
EASTSOUTH
WESTEASTMIDS
WESTMIDS
EASTOF
ENGYORKS&HUMBER
NORTHEAST
NORTHWEST URBAN RURAL YES NO LOW
MEDIUM/HIGH
Significance Level: 95% a b c d e f g h i j k l m n o
Unweighted total 3612 252 258 247 245 249 252 252 251 258 2667 945 1895 1710 1800 1812
Effective Weighted Sample 2598 243 243 238 235 238 243 243 240 247 2175 448 1367 1269 1242 1357
Total 2655 327 371 234 189 231 249 224 113 299 2299 357 1541 1109 1251 140412% 14% 9% 7% 9% 9% 8% 4% 11% 87% 13% 58% 42% 47% 53%
A Blu Ray DVD player 558 56 89 61 34 41 69 53 23 68 475 83 383 173 315 24421% 17% 24% 26% 18% 18% 28% 24% 20% 23% 21% 23% 25% 16% 25% 17%
ade ade m o10% 16% 11% 6% 7% 12% 9% 4% 12% 85% 15% 69% 31% 56% 44%
Handheld/ portable games player (e.g.Nintendo DS, Sony PSP) 542 83 56 46 34 52 55 45 32 58 482 59 363 176 254 288
20% 25% 15% 20% 18% 22% 22% 20% 28% 20% 21% 17% 24% 16% 20% 21%b b bcdgi k m
15% 10% 9% 6% 10% 10% 8% 6% 11% 89% 11% 67% 33% 47% 53%
A smart watch - a wearable computer thatmay be compatible with a smartphone.Brands include Pebble, Samsung andSony, with the Apple Watch due to bereleased in 2015 87 18 11 8 4 3 9 11 6 7 81 6 55 32 32 55
3% 5% 3% 4% 2% 1% 4% 5% 6% 2% 4% 2% 4% 3% 3% 4%e e de k n
20% 12% 10% 4% 3% 10% 13% 7% 8% 93% 7% 63% 37% 37% 63%
ANY DVD PLAYER 1856 176 274 176 116 157 191 157 90 223 1593 264 1123 730 959 89770% 54% 74% 75% 61% 68% 77% 70% 80% 75% 69% 74% 73% 66% 77% 64%
ad ad a ade ad adeg ad j m o9% 15% 9% 6% 8% 10% 8% 5% 12% 86% 14% 60% 39% 52% 48%
Columns Tested: a,b,c,d,e,f,g,h,i - j,k - l,m - n,o
Prepared by Saville Rossiter-Base : 01727 899 399
OFCOM NATIONS & REGIONS TRACKER - MAIN SET - QUARTER 1 2015. 3rd January to 28th February 2015. Table 16
All data have been weighted to ensure they are representative of the UK adult population. Ofcom does not quota or weight by household income, so it may not be representative of the UK population, but it is included for reasons of interest. Any break column with abase size lower than 100 has been removed as margins of error become too great. Data is tested at the 95% confidence level.
QB1. SHOWCARD Which of the following do you, or does anyone in your household, have in your home at the moment? (MULTI CODE)
Base : All QB1 respondents
ENGLAND REGIONS URBANITY WORKING DEPRIVATION LEVEL
Total LONDONSOUTH
EASTSOUTH
WESTEASTMIDS
WESTMIDS
EASTOF
ENGYORKS&HUMBER
NORTHEAST
NORTHWEST URBAN RURAL YES NO LOW
MEDIUM/HIGH
Significance Level: 95% a b c d e f g h i j k l m n o
Unweighted total 3612 252 258 247 245 249 252 252 251 258 2667 945 1895 1710 1800 1812
Effective Weighted Sample 2598 243 243 238 235 238 243 243 240 247 2175 448 1367 1269 1242 1357
Total 2655 327 371 234 189 231 249 224 113 299 2299 357 1541 1109 1251 140412% 14% 9% 7% 9% 9% 8% 4% 11% 87% 13% 58% 42% 47% 53%
ANY GAMES CONSOLE 1302 155 171 128 83 130 124 105 60 149 1143 159 898 402 581 72149% 47% 46% 55% 44% 56% 50% 47% 53% 50% 50% 45% 58% 36% 46% 51%
d bdg d m n12% 13% 10% 6% 10% 10% 8% 5% 11% 88% 12% 69% 31% 45% 55%
None of these 431 88 54 28 42 37 33 37 10 43 371 60 188 241 167 26416% 27% 14% 12% 22% 16% 13% 16% 9% 14% 16% 17% 12% 22% 13% 19%
bcefghi h bcfhi h h h l n21% 12% 7% 10% 9% 8% 9% 2% 10% 86% 14% 44% 56% 39% 61%
Don't know 6 6 - - - - - - - - 6 - 3 3 - 6*% 2% -% -% -% -% -% -% -% -% *% -% *% *% -% *%
bcdefghi n100% -% -% -% -% -% -% -% -% 100% -% 54% 46% -% 100%
Columns Tested: a,b,c,d,e,f,g,h,i - j,k - l,m - n,o
Prepared by Saville Rossiter-Base : 01727 899 399
OFCOM NATIONS & REGIONS TRACKER - MAIN SET - QUARTER 1 2015. 3rd January to 28th February 2015. Table 17
All data have been weighted to ensure they are representative of the UK adult population. Ofcom does not quota or weight by household income, so it may not be representative of the UK population, but it is included for reasons of interest. Any break column with abase size lower than 100 has been removed as margins of error become too great. Data is tested at the 95% confidence level.
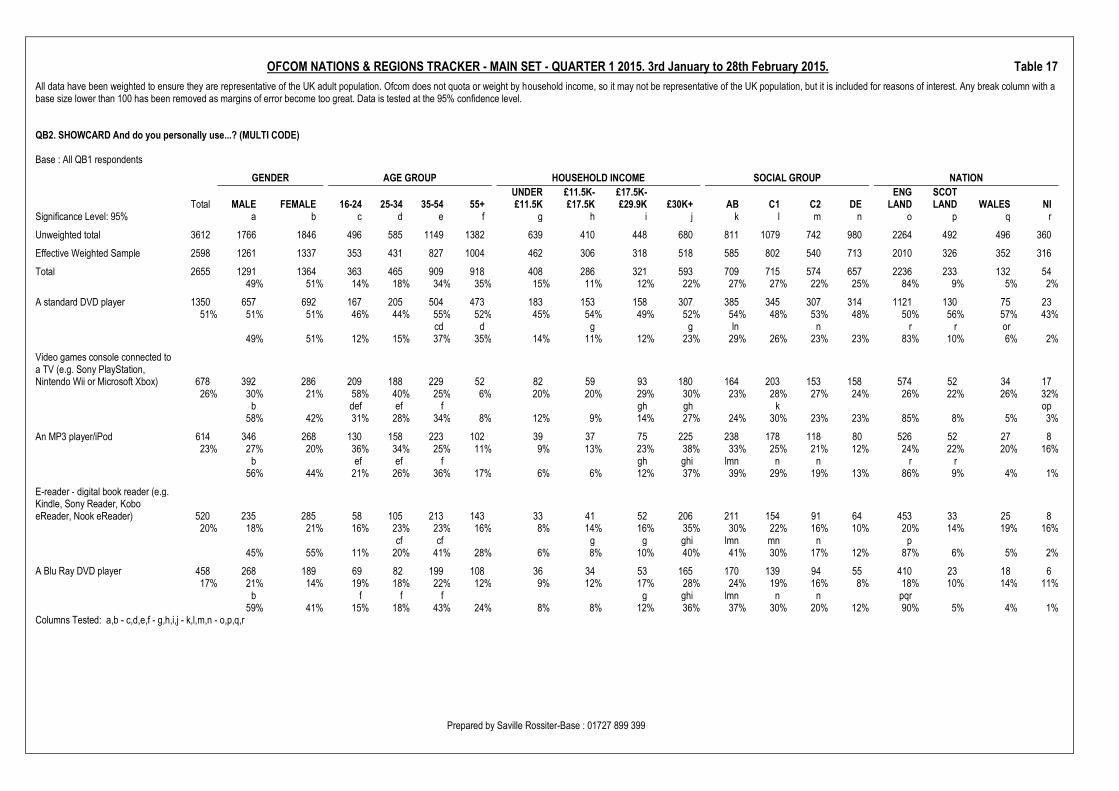
QB2. SHOWCARD And do you personally use...? (MULTI CODE)
Base : All QB1 respondents
GENDER AGE GROUP HOUSEHOLD INCOME SOCIAL GROUP NATION
Total MALE FEMALE 16-24 25-34 35-54 55+UNDER£11.5K
£11.5K-£17.5K
£17.5K-£29.9K £30K+ AB C1 C2 DE
ENGLAND
SCOTLAND WALES NI
Significance Level: 95% a b c d e f g h i j k l m n o p q r
Unweighted total 3612 1766 1846 496 585 1149 1382 639 410 448 680 811 1079 742 980 2264 492 496 360
Effective Weighted Sample 2598 1261 1337 353 431 827 1004 462 306 318 518 585 802 540 713 2010 326 352 316
Total 2655 1291 1364 363 465 909 918 408 286 321 593 709 715 574 657 2236 233 132 5449% 51% 14% 18% 34% 35% 15% 11% 12% 22% 27% 27% 22% 25% 84% 9% 5% 2%
A standard DVD player 1350 657 692 167 205 504 473 183 153 158 307 385 345 307 314 1121 130 75 2351% 51% 51% 46% 44% 55% 52% 45% 54% 49% 52% 54% 48% 53% 48% 50% 56% 57% 43%
cd d g g ln n r r or49% 51% 12% 15% 37% 35% 14% 11% 12% 23% 29% 26% 23% 23% 83% 10% 6% 2%
Video games console connected toa TV (e.g. Sony PlayStation,Nintendo Wii or Microsoft Xbox) 678 392 286 209 188 229 52 82 59 93 180 164 203 153 158 574 52 34 17
26% 30% 21% 58% 40% 25% 6% 20% 20% 29% 30% 23% 28% 27% 24% 26% 22% 26% 32%b def ef f gh gh k op
58% 42% 31% 28% 34% 8% 12% 9% 14% 27% 24% 30% 23% 23% 85% 8% 5% 3%
An MP3 player/iPod 614 346 268 130 158 223 102 39 37 75 225 238 178 118 80 526 52 27 823% 27% 20% 36% 34% 25% 11% 9% 13% 23% 38% 33% 25% 21% 12% 24% 22% 20% 16%
b ef ef f gh ghi lmn n n r r56% 44% 21% 26% 36% 17% 6% 6% 12% 37% 39% 29% 19% 13% 86% 9% 4% 1%
E-reader - digital book reader (e.g.Kindle, Sony Reader, KoboeReader, Nook eReader) 520 235 285 58 105 213 143 33 41 52 206 211 154 91 64 453 33 25 8
20% 18% 21% 16% 23% 23% 16% 8% 14% 16% 35% 30% 22% 16% 10% 20% 14% 19% 16%cf cf g g ghi lmn mn n p
45% 55% 11% 20% 41% 28% 6% 8% 10% 40% 41% 30% 17% 12% 87% 6% 5% 2%
A Blu Ray DVD player 458 268 189 69 82 199 108 36 34 53 165 170 139 94 55 410 23 18 617% 21% 14% 19% 18% 22% 12% 9% 12% 17% 28% 24% 19% 16% 8% 18% 10% 14% 11%
b f f f g ghi lmn n n pqr59% 41% 15% 18% 43% 24% 8% 8% 12% 36% 37% 30% 20% 12% 90% 5% 4% 1%
Columns Tested: a,b - c,d,e,f - g,h,i,j - k,l,m,n - o,p,q,r
Prepared by Saville Rossiter-Base : 01727 899 399
OFCOM NATIONS & REGIONS TRACKER - MAIN SET - QUARTER 1 2015. 3rd January to 28th February 2015. Table 17
All data have been weighted to ensure they are representative of the UK adult population. Ofcom does not quota or weight by household income, so it may not be representative of the UK population, but it is included for reasons of interest. Any break column with abase size lower than 100 has been removed as margins of error become too great. Data is tested at the 95% confidence level.
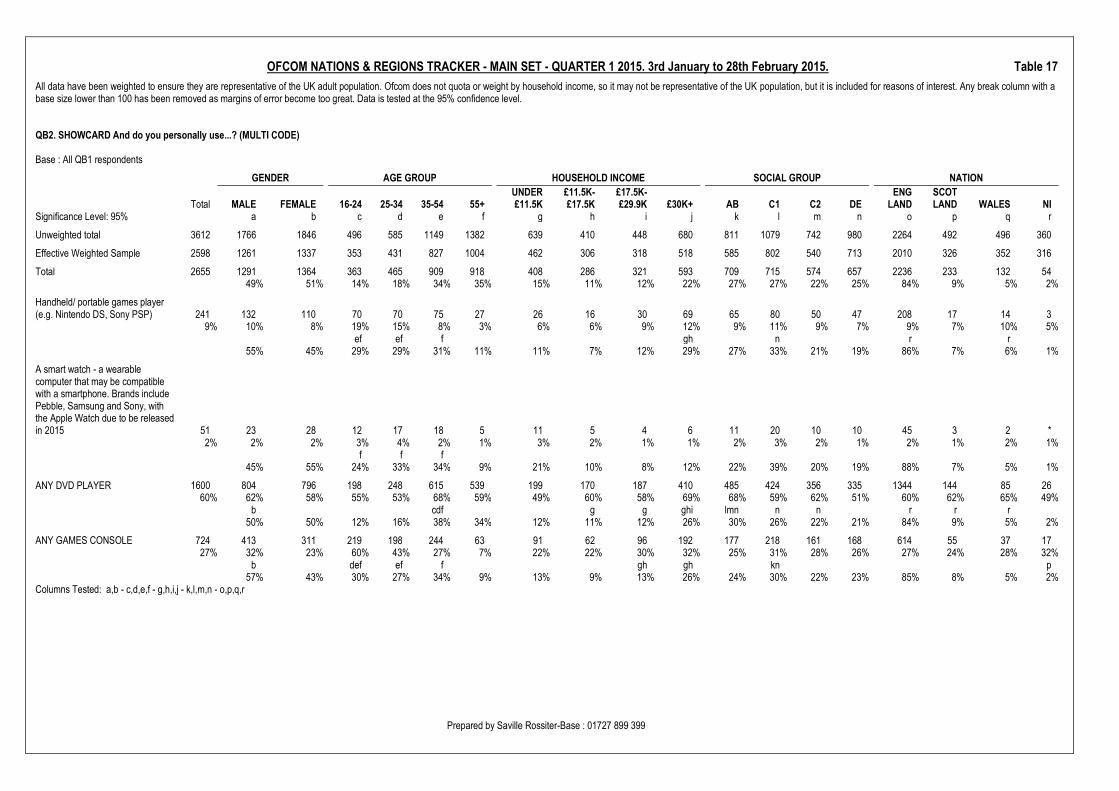
QB2. SHOWCARD And do you personally use...? (MULTI CODE)
Base : All QB1 respondents
GENDER AGE GROUP HOUSEHOLD INCOME SOCIAL GROUP NATION
Total MALE FEMALE 16-24 25-34 35-54 55+UNDER£11.5K
£11.5K-£17.5K
£17.5K-£29.9K £30K+ AB C1 C2 DE
ENGLAND
SCOTLAND WALES NI
Significance Level: 95% a b c d e f g h i j k l m n o p q r
Unweighted total 3612 1766 1846 496 585 1149 1382 639 410 448 680 811 1079 742 980 2264 492 496 360
Effective Weighted Sample 2598 1261 1337 353 431 827 1004 462 306 318 518 585 802 540 713 2010 326 352 316
Total 2655 1291 1364 363 465 909 918 408 286 321 593 709 715 574 657 2236 233 132 5449% 51% 14% 18% 34% 35% 15% 11% 12% 22% 27% 27% 22% 25% 84% 9% 5% 2%
Handheld/ portable games player(e.g. Nintendo DS, Sony PSP) 241 132 110 70 70 75 27 26 16 30 69 65 80 50 47 208 17 14 3
9% 10% 8% 19% 15% 8% 3% 6% 6% 9% 12% 9% 11% 9% 7% 9% 7% 10% 5%ef ef f gh n r r
55% 45% 29% 29% 31% 11% 11% 7% 12% 29% 27% 33% 21% 19% 86% 7% 6% 1%
A smart watch - a wearablecomputer that may be compatiblewith a smartphone. Brands includePebble, Samsung and Sony, withthe Apple Watch due to be releasedin 2015 51 23 28 12 17 18 5 11 5 4 6 11 20 10 10 45 3 2 *
2% 2% 2% 3% 4% 2% 1% 3% 2% 1% 1% 2% 3% 2% 1% 2% 1% 2% 1%f f f
45% 55% 24% 33% 34% 9% 21% 10% 8% 12% 22% 39% 20% 19% 88% 7% 5% 1%
ANY DVD PLAYER 1600 804 796 198 248 615 539 199 170 187 410 485 424 356 335 1344 144 85 2660% 62% 58% 55% 53% 68% 59% 49% 60% 58% 69% 68% 59% 62% 51% 60% 62% 65% 49%
b cdf g g ghi lmn n n r r r50% 50% 12% 16% 38% 34% 12% 11% 12% 26% 30% 26% 22% 21% 84% 9% 5% 2%
ANY GAMES CONSOLE 724 413 311 219 198 244 63 91 62 96 192 177 218 161 168 614 55 37 1727% 32% 23% 60% 43% 27% 7% 22% 22% 30% 32% 25% 31% 28% 26% 27% 24% 28% 32%
b def ef f gh gh kn p57% 43% 30% 27% 34% 9% 13% 9% 13% 26% 24% 30% 22% 23% 85% 8% 5% 2%
Columns Tested: a,b - c,d,e,f - g,h,i,j - k,l,m,n - o,p,q,r
Prepared by Saville Rossiter-Base : 01727 899 399
OFCOM NATIONS & REGIONS TRACKER - MAIN SET - QUARTER 1 2015. 3rd January to 28th February 2015. Table 17
All data have been weighted to ensure they are representative of the UK adult population. Ofcom does not quota or weight by household income, so it may not be representative of the UK population, but it is included for reasons of interest. Any break column with abase size lower than 100 has been removed as margins of error become too great. Data is tested at the 95% confidence level.
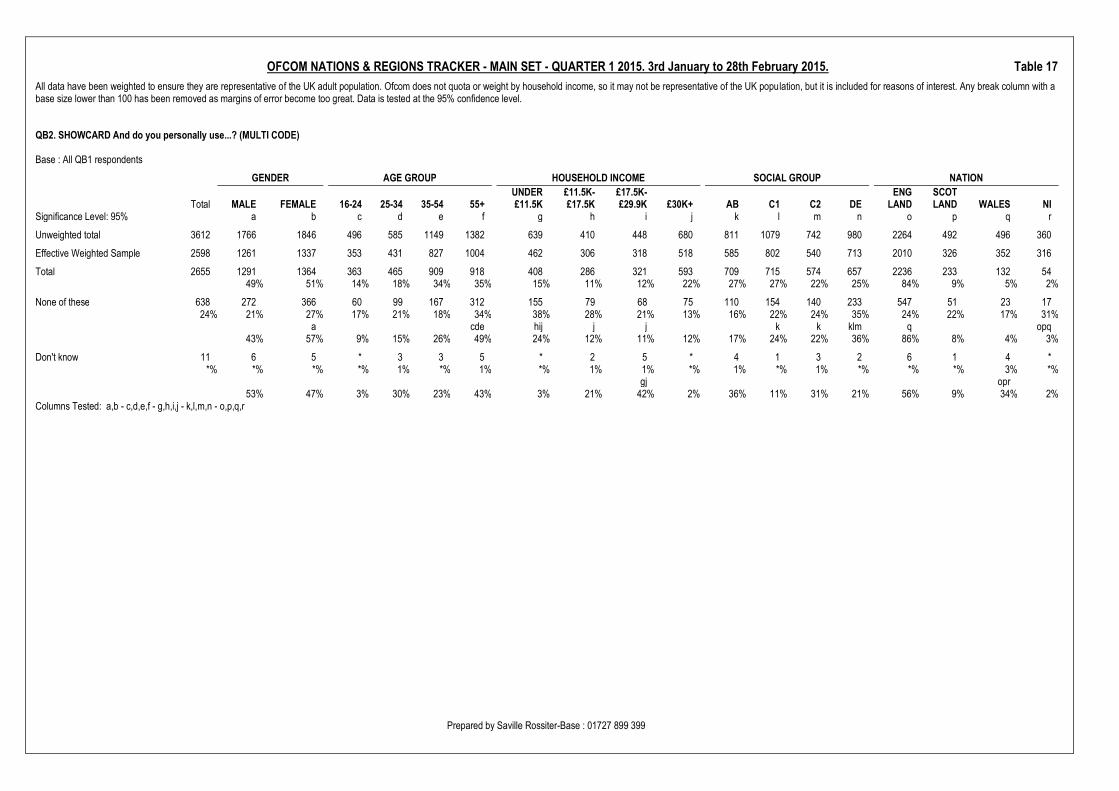
QB2. SHOWCARD And do you personally use...? (MULTI CODE)
Base : All QB1 respondents
GENDER AGE GROUP HOUSEHOLD INCOME SOCIAL GROUP NATION
Total MALE FEMALE 16-24 25-34 35-54 55+UNDER£11.5K
£11.5K-£17.5K
£17.5K-£29.9K £30K+ AB C1 C2 DE
ENGLAND
SCOTLAND WALES NI
Significance Level: 95% a b c d e f g h i j k l m n o p q r
Unweighted total 3612 1766 1846 496 585 1149 1382 639 410 448 680 811 1079 742 980 2264 492 496 360
Effective Weighted Sample 2598 1261 1337 353 431 827 1004 462 306 318 518 585 802 540 713 2010 326 352 316
Total 2655 1291 1364 363 465 909 918 408 286 321 593 709 715 574 657 2236 233 132 5449% 51% 14% 18% 34% 35% 15% 11% 12% 22% 27% 27% 22% 25% 84% 9% 5% 2%
None of these 638 272 366 60 99 167 312 155 79 68 75 110 154 140 233 547 51 23 1724% 21% 27% 17% 21% 18% 34% 38% 28% 21% 13% 16% 22% 24% 35% 24% 22% 17% 31%
a cde hij j j k k klm q opq43% 57% 9% 15% 26% 49% 24% 12% 11% 12% 17% 24% 22% 36% 86% 8% 4% 3%
Don't know 11 6 5 * 3 3 5 * 2 5 * 4 1 3 2 6 1 4 **% *% *% *% 1% *% 1% *% 1% 1% *% 1% *% 1% *% *% *% 3% *%
gj opr53% 47% 3% 30% 23% 43% 3% 21% 42% 2% 36% 11% 31% 21% 56% 9% 34% 2%
Columns Tested: a,b - c,d,e,f - g,h,i,j - k,l,m,n - o,p,q,r

Prepared by Saville Rossiter-Base : 01727 899 399
OFCOM NATIONS & REGIONS TRACKER - MAIN SET - QUARTER 1 2015. 3rd January to 28th February 2015. Table 17
All data have been weighted to ensure they are representative of the UK adult population. Ofcom does not quota or weight by household income, so it may not be representative of the UK population, but it is included for reasons of interest. Any break column with abase size lower than 100 has been removed as margins of error become too great. Data is tested at the 95% confidence level.
QB2. SHOWCARD And do you personally use...? (MULTI CODE)
Base : All QB1 respondents
ENGLAND REGIONS URBANITY WORKING DEPRIVATION LEVEL
Total LONDONSOUTH
EASTSOUTH
WESTEASTMIDS
WESTMIDS
EASTOF
ENGYORKS&HUMBER
NORTHEAST
NORTHWEST URBAN RURAL YES NO LOW
MEDIUM/HIGH
Significance Level: 95% a b c d e f g h i j k l m n o
Unweighted total 3612 252 258 247 245 249 252 252 251 258 2667 945 1895 1710 1800 1812
Effective Weighted Sample 2598 243 243 238 235 238 243 243 240 247 2175 448 1367 1269 1242 1357
Total 2655 327 371 234 189 231 249 224 113 299 2299 357 1541 1109 1251 140412% 14% 9% 7% 9% 9% 8% 4% 11% 87% 13% 58% 42% 47% 53%
A standard DVD player 1350 122 190 122 85 114 140 118 70 160 1155 195 775 571 705 64551% 37% 51% 52% 45% 49% 57% 53% 62% 53% 50% 55% 50% 52% 56% 46%
a a a ad a abcdeg a o9% 14% 9% 6% 8% 10% 9% 5% 12% 86% 14% 57% 42% 52% 48%
Video games console connected to a TV(e.g. Sony PlayStation, Nintendo Wii orMicrosoft Xbox) 678 74 91 64 52 53 66 70 35 70 602 76 465 210 277 401
26% 22% 25% 27% 27% 23% 27% 31% 31% 24% 26% 21% 30% 19% 22% 29%ae ae k m n
11% 13% 9% 8% 8% 10% 10% 5% 10% 89% 11% 69% 31% 41% 59%
An MP3 player/iPod 614 55 103 68 33 56 71 48 33 59 526 88 436 176 314 30023% 17% 28% 29% 18% 24% 29% 21% 29% 20% 23% 25% 28% 16% 25% 21%
adi adgi adi adgi m o9% 17% 11% 5% 9% 12% 8% 5% 10% 86% 14% 71% 29% 51% 49%
E-reader - digital book reader (e.g. Kindle,Sony Reader, Kobo eReader, NookeReader) 520 47 85 55 40 41 67 40 22 58 440 80 356 164 297 223
20% 14% 23% 23% 21% 18% 27% 18% 19% 19% 19% 22% 23% 15% 24% 16%a a a aegh m o
9% 16% 11% 8% 8% 13% 8% 4% 11% 85% 15% 69% 31% 57% 43%
A Blu Ray DVD player 458 38 84 51 28 32 54 47 20 57 390 68 314 141 266 19117% 12% 23% 22% 15% 14% 22% 21% 17% 19% 17% 19% 20% 13% 21% 14%
ade ae ae ae a m o8% 18% 11% 6% 7% 12% 10% 4% 12% 85% 15% 69% 31% 58% 42%
Columns Tested: a,b,c,d,e,f,g,h,i - j,k - l,m - n,o

Prepared by Saville Rossiter-Base : 01727 899 399
OFCOM NATIONS & REGIONS TRACKER - MAIN SET - QUARTER 1 2015. 3rd January to 28th February 2015. Table 17
All data have been weighted to ensure they are representative of the UK adult population. Ofcom does not quota or weight by household income, so it may not be representative of the UK population, but it is included for reasons of interest. Any break column with abase size lower than 100 has been removed as margins of error become too great. Data is tested at the 95% confidence level.
QB2. SHOWCARD And do you personally use...? (MULTI CODE)
Base : All QB1 respondents
ENGLAND REGIONS URBANITY WORKING DEPRIVATION LEVEL
Total LONDONSOUTH
EASTSOUTH
WESTEASTMIDS
WESTMIDS
EASTOF
ENGYORKS&HUMBER
NORTHEAST
NORTHWEST URBAN RURAL YES NO LOW
MEDIUM/HIGH
Significance Level: 95% a b c d e f g h i j k l m n o
Unweighted total 3612 252 258 247 245 249 252 252 251 258 2667 945 1895 1710 1800 1812
Effective Weighted Sample 2598 243 243 238 235 238 243 243 240 247 2175 448 1367 1269 1242 1357
Total 2655 327 371 234 189 231 249 224 113 299 2299 357 1541 1109 1251 140412% 14% 9% 7% 9% 9% 8% 4% 11% 87% 13% 58% 42% 47% 53%
Handheld/ portable games player (e.g.Nintendo DS, Sony PSP) 241 36 32 21 16 22 31 16 14 21 217 25 153 86 107 134
9% 11% 9% 9% 9% 10% 12% 7% 12% 7% 9% 7% 10% 8% 9% 10%gi m
15% 13% 9% 7% 9% 13% 6% 6% 9% 90% 10% 63% 36% 44% 56%
A smart watch - a wearable computer thatmay be compatible with a smartphone.Brands include Pebble, Samsung andSony, with the Apple Watch due to bereleased in 2015 51 8 6 5 4 2 5 10 4 2 49 2 34 17 19 32
2% 2% 2% 2% 2% 1% 2% 5% 4% 1% 2% 1% 2% 2% 2% 2%ei ei k
16% 11% 9% 8% 3% 10% 20% 8% 3% 95% 5% 66% 34% 37% 63%
ANY DVD PLAYER 1600 141 233 152 106 128 165 147 78 194 1364 235 956 640 853 74760% 43% 63% 65% 56% 55% 66% 66% 69% 65% 59% 66% 62% 58% 68% 53%
a ae a a ade ade ade ade j m o9% 15% 9% 7% 8% 10% 9% 5% 12% 85% 15% 60% 40% 53% 47%
ANY GAMES CONSOLE 724 83 100 67 55 56 71 72 38 73 640 85 490 232 302 42227% 25% 27% 29% 29% 24% 28% 32% 34% 24% 28% 24% 32% 21% 24% 30%
aei m n11% 14% 9% 8% 8% 10% 10% 5% 10% 88% 12% 68% 32% 42% 58%
Columns Tested: a,b,c,d,e,f,g,h,i - j,k - l,m - n,o

Prepared by Saville Rossiter-Base : 01727 899 399
OFCOM NATIONS & REGIONS TRACKER - MAIN SET - QUARTER 1 2015. 3rd January to 28th February 2015. Table 17
All data have been weighted to ensure they are representative of the UK adult population. Ofcom does not quota or weight by household income, so it may not be representative of the UK population, but it is included for reasons of interest. Any break column with abase size lower than 100 has been removed as margins of error become too great. Data is tested at the 95% confidence level.
QB2. SHOWCARD And do you personally use...? (MULTI CODE)
Base : All QB1 respondents
ENGLAND REGIONS URBANITY WORKING DEPRIVATION LEVEL
Total LONDONSOUTH
EASTSOUTH
WESTEASTMIDS
WESTMIDS
EASTOF
ENGYORKS&HUMBER
NORTHEAST
NORTHWEST URBAN RURAL YES NO LOW
MEDIUM/HIGH
Significance Level: 95% a b c d e f g h i j k l m n o
Unweighted total 3612 252 258 247 245 249 252 252 251 258 2667 945 1895 1710 1800 1812
Effective Weighted Sample 2598 243 243 238 235 238 243 243 240 247 2175 448 1367 1269 1242 1357
Total 2655 327 371 234 189 231 249 224 113 299 2299 357 1541 1109 1251 140412% 14% 9% 7% 9% 9% 8% 4% 11% 87% 13% 58% 42% 47% 53%
None of these 638 117 78 45 49 72 47 48 19 72 558 80 299 337 247 39124% 36% 21% 19% 26% 31% 19% 21% 17% 24% 24% 22% 19% 30% 20% 28%
bcdfghi h bcfgh h l n18% 12% 7% 8% 11% 7% 8% 3% 11% 87% 13% 47% 53% 39% 61%
Don't know 11 4 - 1 - - - - - 1 10 1 6 5 2 9*% 1% -% *% -% -% -% -% -% *% *% *% *% *% *% 1%
n40% -% 10% -% -% -% -% -% 6% 91% 9% 54% 46% 15% 85%
Columns Tested: a,b,c,d,e,f,g,h,i - j,k - l,m - n,o

Prepared by Saville Rossiter-Base : 01727 899 399
OFCOM NATIONS & REGIONS TRACKER - MAIN SET - QUARTER 1 2015. 3rd January to 28th February 2015. Table 18
All data have been weighted to ensure they are representative of the UK adult population. Ofcom does not quota or weight by household income, so it may not be representative of the UK population, but it is included for reasons of interest. Any break column with abase size lower than 100 has been removed as margins of error become too great. Data is tested at the 95% confidence level.
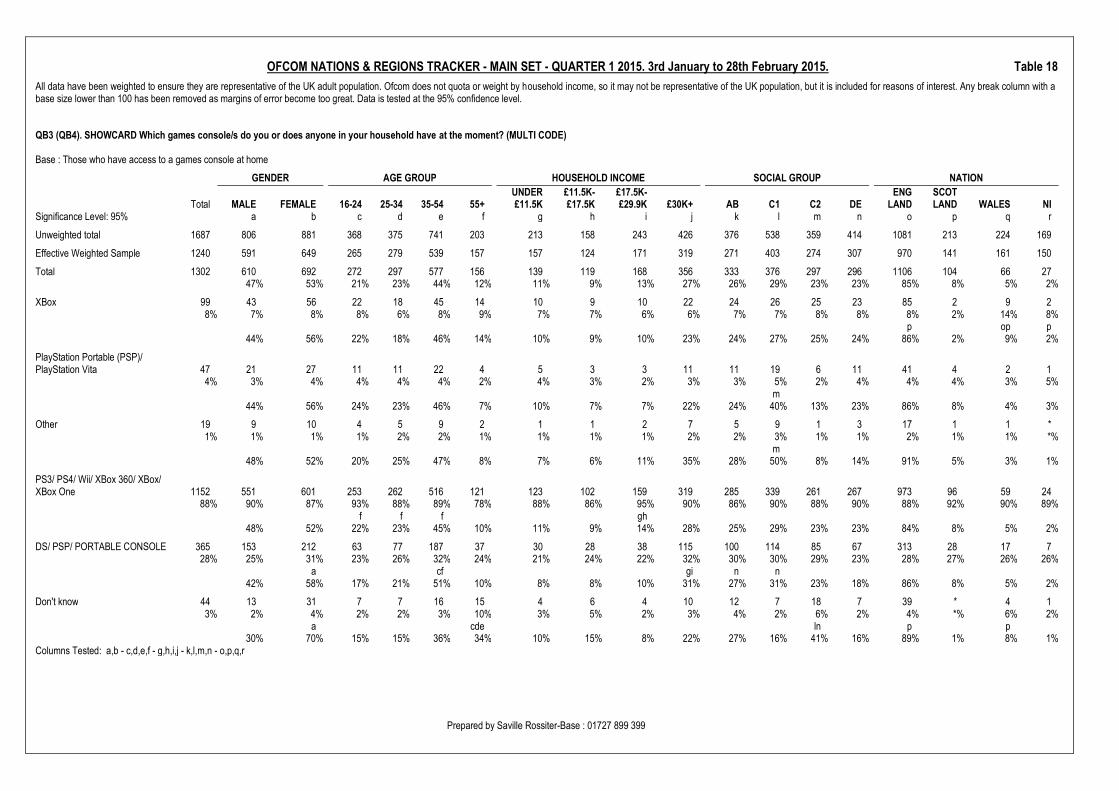
QB3 (QB4). SHOWCARD Which games console/s do you or does anyone in your household have at the moment? (MULTI CODE)
Base : Those who have access to a games console at home
GENDER AGE GROUP HOUSEHOLD INCOME SOCIAL GROUP NATION
Total MALE FEMALE 16-24 25-34 35-54 55+UNDER£11.5K
£11.5K-£17.5K
£17.5K-£29.9K £30K+ AB C1 C2 DE
ENGLAND
SCOTLAND WALES NI
Significance Level: 95% a b c d e f g h i j k l m n o p q r
Unweighted total 1687 806 881 368 375 741 203 213 158 243 426 376 538 359 414 1081 213 224 169
Effective Weighted Sample 1240 591 649 265 279 539 157 157 124 171 319 271 403 274 307 970 141 161 150
Total 1302 610 692 272 297 577 156 139 119 168 356 333 376 297 296 1106 104 66 2747% 53% 21% 23% 44% 12% 11% 9% 13% 27% 26% 29% 23% 23% 85% 8% 5% 2%
Nintendo Wii/ Wii U 455 179 276 82 86 238 50 31 35 62 138 131 141 103 80 385 34 28 935% 29% 40% 30% 29% 41% 32% 22% 29% 37% 39% 39% 38% 35% 27% 35% 33% 42% 33%
a cdf g g n n39% 61% 18% 19% 52% 11% 7% 8% 14% 30% 29% 31% 23% 18% 84% 8% 6% 2%
XBox 360 393 200 192 91 88 187 27 50 27 48 114 101 111 91 90 323 35 27 730% 33% 28% 34% 29% 32% 17% 36% 23% 28% 32% 30% 29% 30% 30% 29% 34% 42% 27%
f f f h or51% 49% 23% 22% 48% 7% 13% 7% 12% 29% 26% 28% 23% 23% 82% 9% 7% 2%
Nintendo DS/ DSi/ DS Lite/ 3DS 345 142 202 60 74 176 34 27 27 37 107 95 106 82 62 296 25 17 726% 23% 29% 22% 25% 31% 22% 19% 23% 22% 30% 29% 28% 28% 21% 27% 24% 25% 26%
a cf g n n41% 59% 18% 22% 51% 10% 8% 8% 11% 31% 28% 31% 24% 18% 86% 7% 5% 2%
PlayStation 3 332 155 177 69 93 141 29 40 32 44 80 78 97 70 88 285 26 14 725% 25% 26% 25% 31% 24% 18% 29% 27% 26% 23% 23% 26% 24% 30% 26% 25% 21% 27%
ef47% 53% 21% 28% 42% 9% 12% 10% 13% 24% 23% 29% 21% 26% 86% 8% 4% 2%
PlayStation 4 158 82 77 35 27 82 13 11 11 29 47 34 53 37 34 126 19 8 612% 13% 11% 13% 9% 14% 9% 8% 9% 17% 13% 10% 14% 12% 11% 11% 18% 12% 20%
d g o oq52% 48% 22% 17% 52% 8% 7% 7% 18% 30% 22% 34% 23% 21% 80% 12% 5% 3%
PlayStation 2 139 68 71 30 24 70 15 20 9 17 33 32 47 25 35 118 9 9 311% 11% 10% 11% 8% 12% 10% 14% 7% 10% 9% 10% 12% 9% 12% 11% 9% 13% 10%
49% 51% 21% 17% 50% 11% 14% 6% 12% 23% 23% 34% 18% 25% 85% 6% 6% 2%
XBox One 107 60 47 37 22 43 6 12 7 10 34 22 32 26 27 91 6 7 38% 10% 7% 14% 7% 7% 4% 9% 6% 6% 10% 7% 9% 9% 9% 8% 6% 11% 12%
b def p56% 44% 34% 20% 40% 5% 12% 6% 10% 32% 21% 30% 24% 25% 84% 6% 7% 3%
Columns Tested: a,b - c,d,e,f - g,h,i,j - k,l,m,n - o,p,q,r
Prepared by Saville Rossiter-Base : 01727 899 399
OFCOM NATIONS & REGIONS TRACKER - MAIN SET - QUARTER 1 2015. 3rd January to 28th February 2015. Table 18
All data have been weighted to ensure they are representative of the UK adult population. Ofcom does not quota or weight by household income, so it may not be representative of the UK population, but it is included for reasons of interest. Any break column with abase size lower than 100 has been removed as margins of error become too great. Data is tested at the 95% confidence level.
QB3 (QB4). SHOWCARD Which games console/s do you or does anyone in your household have at the moment? (MULTI CODE)
Base : Those who have access to a games console at home
GENDER AGE GROUP HOUSEHOLD INCOME SOCIAL GROUP NATION
Total MALE FEMALE 16-24 25-34 35-54 55+UNDER£11.5K
£11.5K-£17.5K
£17.5K-£29.9K £30K+ AB C1 C2 DE
ENGLAND
SCOTLAND WALES NI
Significance Level: 95% a b c d e f g h i j k l m n o p q r
Unweighted total 1687 806 881 368 375 741 203 213 158 243 426 376 538 359 414 1081 213 224 169
Effective Weighted Sample 1240 591 649 265 279 539 157 157 124 171 319 271 403 274 307 970 141 161 150
Total 1302 610 692 272 297 577 156 139 119 168 356 333 376 297 296 1106 104 66 2747% 53% 21% 23% 44% 12% 11% 9% 13% 27% 26% 29% 23% 23% 85% 8% 5% 2%
XBox 99 43 56 22 18 45 14 10 9 10 22 24 26 25 23 85 2 9 28% 7% 8% 8% 6% 8% 9% 7% 7% 6% 6% 7% 7% 8% 8% 8% 2% 14% 8%
p op p44% 56% 22% 18% 46% 14% 10% 9% 10% 23% 24% 27% 25% 24% 86% 2% 9% 2%
PlayStation Portable (PSP)/PlayStation Vita 47 21 27 11 11 22 4 5 3 3 11 11 19 6 11 41 4 2 1
4% 3% 4% 4% 4% 4% 2% 4% 3% 2% 3% 3% 5% 2% 4% 4% 4% 3% 5%m
44% 56% 24% 23% 46% 7% 10% 7% 7% 22% 24% 40% 13% 23% 86% 8% 4% 3%
Other 19 9 10 4 5 9 2 1 1 2 7 5 9 1 3 17 1 1 *1% 1% 1% 1% 2% 2% 1% 1% 1% 1% 2% 2% 3% 1% 1% 2% 1% 1% *%
m48% 52% 20% 25% 47% 8% 7% 6% 11% 35% 28% 50% 8% 14% 91% 5% 3% 1%
PS3/ PS4/ Wii/ XBox 360/ XBox/XBox One 1152 551 601 253 262 516 121 123 102 159 319 285 339 261 267 973 96 59 24
88% 90% 87% 93% 88% 89% 78% 88% 86% 95% 90% 86% 90% 88% 90% 88% 92% 90% 89%f f f gh
48% 52% 22% 23% 45% 10% 11% 9% 14% 28% 25% 29% 23% 23% 84% 8% 5% 2%
DS/ PSP/ PORTABLE CONSOLE 365 153 212 63 77 187 37 30 28 38 115 100 114 85 67 313 28 17 728% 25% 31% 23% 26% 32% 24% 21% 24% 22% 32% 30% 30% 29% 23% 28% 27% 26% 26%
a cf gi n n42% 58% 17% 21% 51% 10% 8% 8% 10% 31% 27% 31% 23% 18% 86% 8% 5% 2%
Don't know 44 13 31 7 7 16 15 4 6 4 10 12 7 18 7 39 * 4 13% 2% 4% 2% 2% 3% 10% 3% 5% 2% 3% 4% 2% 6% 2% 4% *% 6% 2%
a cde ln p p30% 70% 15% 15% 36% 34% 10% 15% 8% 22% 27% 16% 41% 16% 89% 1% 8% 1%
Columns Tested: a,b - c,d,e,f - g,h,i,j - k,l,m,n - o,p,q,r
Prepared by Saville Rossiter-Base : 01727 899 399
OFCOM NATIONS & REGIONS TRACKER - MAIN SET - QUARTER 1 2015. 3rd January to 28th February 2015. Table 18
All data have been weighted to ensure they are representative of the UK adult population. Ofcom does not quota or weight by household income, so it may not be representative of the UK population, but it is included for reasons of interest. Any break column with abase size lower than 100 has been removed as margins of error become too great. Data is tested at the 95% confidence level.
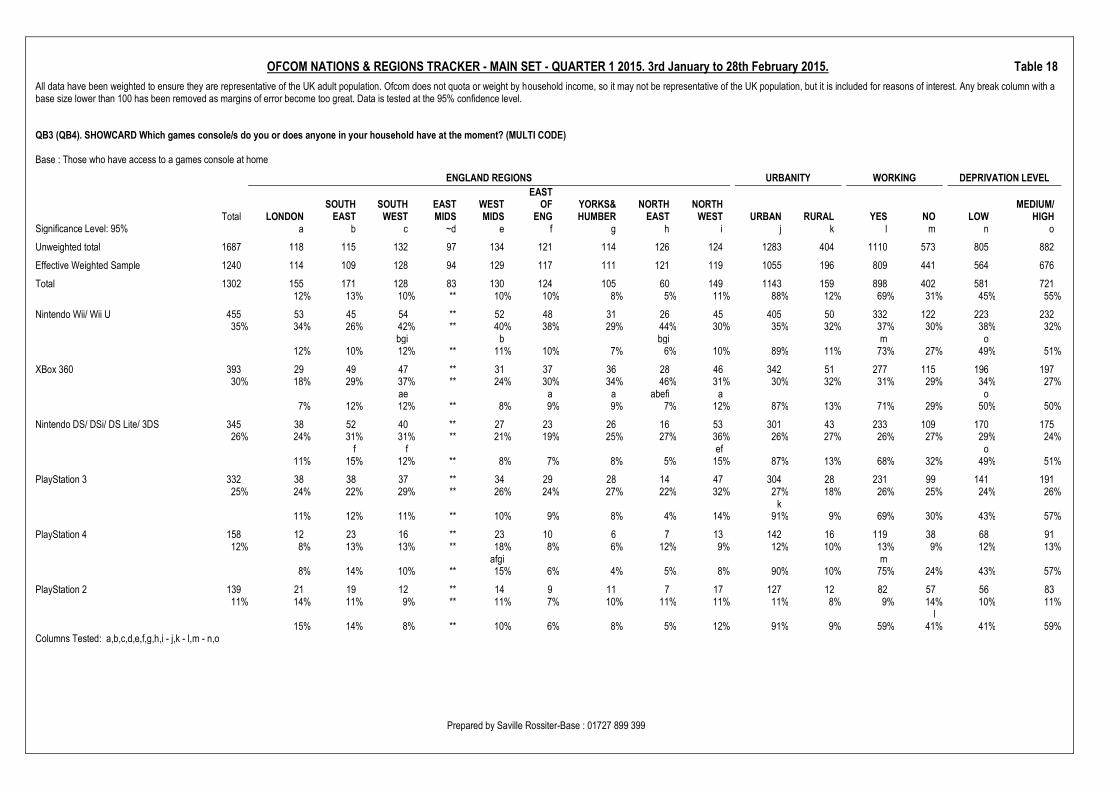
QB3 (QB4). SHOWCARD Which games console/s do you or does anyone in your household have at the moment? (MULTI CODE)
Base : Those who have access to a games console at home
ENGLAND REGIONS URBANITY WORKING DEPRIVATION LEVEL
Total LONDONSOUTH
EASTSOUTH
WESTEASTMIDS
WESTMIDS
EASTOF
ENGYORKS&HUMBER
NORTHEAST
NORTHWEST URBAN RURAL YES NO LOW
MEDIUM/HIGH
Significance Level: 95% a b c ~d e f g h i j k l m n o
Unweighted total 1687 118 115 132 97 134 121 114 126 124 1283 404 1110 573 805 882
Effective Weighted Sample 1240 114 109 128 94 129 117 111 121 119 1055 196 809 441 564 676
Total 1302 155 171 128 83 130 124 105 60 149 1143 159 898 402 581 72112% 13% 10% ** 10% 10% 8% 5% 11% 88% 12% 69% 31% 45% 55%
Nintendo Wii/ Wii U 455 53 45 54 ** 52 48 31 26 45 405 50 332 122 223 23235% 34% 26% 42% ** 40% 38% 29% 44% 30% 35% 32% 37% 30% 38% 32%
bgi b bgi m o12% 10% 12% ** 11% 10% 7% 6% 10% 89% 11% 73% 27% 49% 51%
XBox 360 393 29 49 47 ** 31 37 36 28 46 342 51 277 115 196 19730% 18% 29% 37% ** 24% 30% 34% 46% 31% 30% 32% 31% 29% 34% 27%
ae a a abefi a o7% 12% 12% ** 8% 9% 9% 7% 12% 87% 13% 71% 29% 50% 50%
Nintendo DS/ DSi/ DS Lite/ 3DS 345 38 52 40 ** 27 23 26 16 53 301 43 233 109 170 17526% 24% 31% 31% ** 21% 19% 25% 27% 36% 26% 27% 26% 27% 29% 24%
f f ef o11% 15% 12% ** 8% 7% 8% 5% 15% 87% 13% 68% 32% 49% 51%
PlayStation 3 332 38 38 37 ** 34 29 28 14 47 304 28 231 99 141 19125% 24% 22% 29% ** 26% 24% 27% 22% 32% 27% 18% 26% 25% 24% 26%
k11% 12% 11% ** 10% 9% 8% 4% 14% 91% 9% 69% 30% 43% 57%
PlayStation 4 158 12 23 16 ** 23 10 6 7 13 142 16 119 38 68 9112% 8% 13% 13% ** 18% 8% 6% 12% 9% 12% 10% 13% 9% 12% 13%
afgi m8% 14% 10% ** 15% 6% 4% 5% 8% 90% 10% 75% 24% 43% 57%
PlayStation 2 139 21 19 12 ** 14 9 11 7 17 127 12 82 57 56 8311% 14% 11% 9% ** 11% 7% 10% 11% 11% 11% 8% 9% 14% 10% 11%
l15% 14% 8% ** 10% 6% 8% 5% 12% 91% 9% 59% 41% 41% 59%
Columns Tested: a,b,c,d,e,f,g,h,i - j,k - l,m - n,o
Prepared by Saville Rossiter-Base : 01727 899 399
OFCOM NATIONS & REGIONS TRACKER - MAIN SET - QUARTER 1 2015. 3rd January to 28th February 2015. Table 18
All data have been weighted to ensure they are representative of the UK adult population. Ofcom does not quota or weight by household income, so it may not be representative of the UK population, but it is included for reasons of interest. Any break column with abase size lower than 100 has been removed as margins of error become too great. Data is tested at the 95% confidence level.
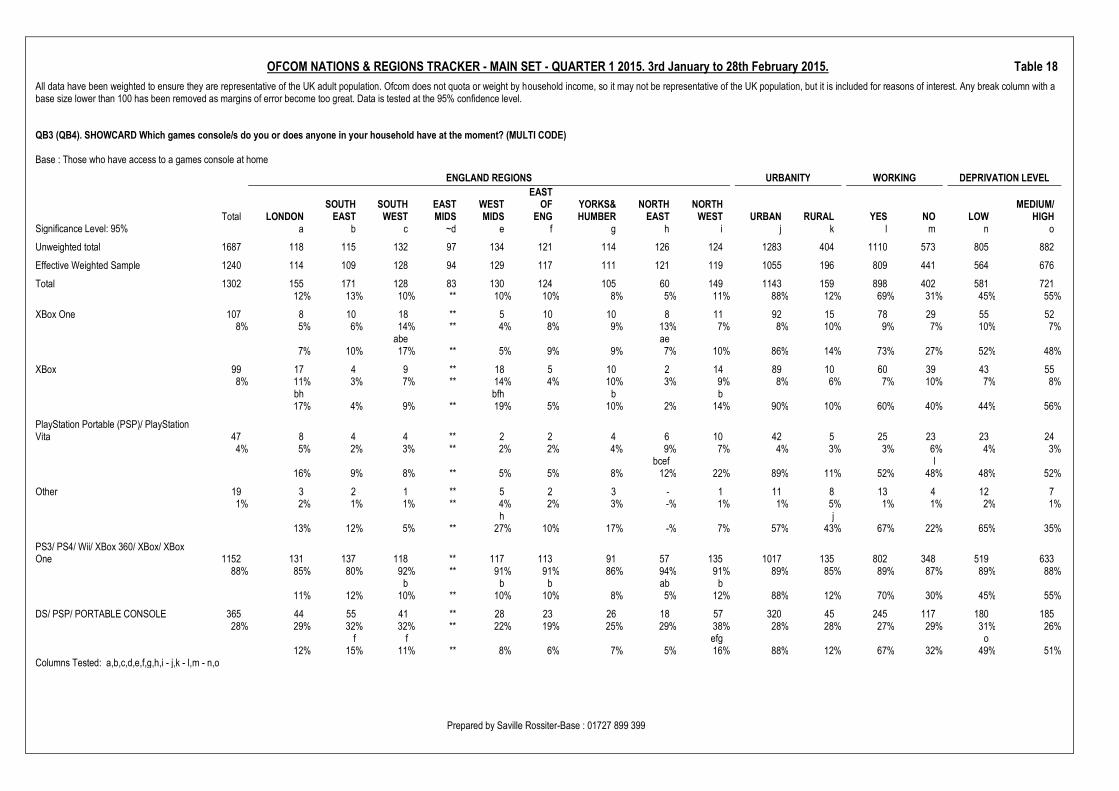
QB3 (QB4). SHOWCARD Which games console/s do you or does anyone in your household have at the moment? (MULTI CODE)
Base : Those who have access to a games console at home
ENGLAND REGIONS URBANITY WORKING DEPRIVATION LEVEL
Total LONDONSOUTH
EASTSOUTH
WESTEASTMIDS
WESTMIDS
EASTOF
ENGYORKS&HUMBER
NORTHEAST
NORTHWEST URBAN RURAL YES NO LOW
MEDIUM/HIGH
Significance Level: 95% a b c ~d e f g h i j k l m n o
Unweighted total 1687 118 115 132 97 134 121 114 126 124 1283 404 1110 573 805 882
Effective Weighted Sample 1240 114 109 128 94 129 117 111 121 119 1055 196 809 441 564 676
Total 1302 155 171 128 83 130 124 105 60 149 1143 159 898 402 581 72112% 13% 10% ** 10% 10% 8% 5% 11% 88% 12% 69% 31% 45% 55%
XBox One 107 8 10 18 ** 5 10 10 8 11 92 15 78 29 55 528% 5% 6% 14% ** 4% 8% 9% 13% 7% 8% 10% 9% 7% 10% 7%
abe ae7% 10% 17% ** 5% 9% 9% 7% 10% 86% 14% 73% 27% 52% 48%
XBox 99 17 4 9 ** 18 5 10 2 14 89 10 60 39 43 558% 11% 3% 7% ** 14% 4% 10% 3% 9% 8% 6% 7% 10% 7% 8%
bh bfh b b17% 4% 9% ** 19% 5% 10% 2% 14% 90% 10% 60% 40% 44% 56%
PlayStation Portable (PSP)/ PlayStationVita 47 8 4 4 ** 2 2 4 6 10 42 5 25 23 23 24
4% 5% 2% 3% ** 2% 2% 4% 9% 7% 4% 3% 3% 6% 4% 3%bcef l
16% 9% 8% ** 5% 5% 8% 12% 22% 89% 11% 52% 48% 48% 52%
Other 19 3 2 1 ** 5 2 3 - 1 11 8 13 4 12 71% 2% 1% 1% ** 4% 2% 3% -% 1% 1% 5% 1% 1% 2% 1%
h j13% 12% 5% ** 27% 10% 17% -% 7% 57% 43% 67% 22% 65% 35%
PS3/ PS4/ Wii/ XBox 360/ XBox/ XBoxOne 1152 131 137 118 ** 117 113 91 57 135 1017 135 802 348 519 633
88% 85% 80% 92% ** 91% 91% 86% 94% 91% 89% 85% 89% 87% 89% 88%b b b ab b
11% 12% 10% ** 10% 10% 8% 5% 12% 88% 12% 70% 30% 45% 55%
DS/ PSP/ PORTABLE CONSOLE 365 44 55 41 ** 28 23 26 18 57 320 45 245 117 180 18528% 29% 32% 32% ** 22% 19% 25% 29% 38% 28% 28% 27% 29% 31% 26%
f f efg o12% 15% 11% ** 8% 6% 7% 5% 16% 88% 12% 67% 32% 49% 51%
Columns Tested: a,b,c,d,e,f,g,h,i - j,k - l,m - n,o

Prepared by Saville Rossiter-Base : 01727 899 399
OFCOM NATIONS & REGIONS TRACKER - MAIN SET - QUARTER 1 2015. 3rd January to 28th February 2015. Table 18
All data have been weighted to ensure they are representative of the UK adult population. Ofcom does not quota or weight by household income, so it may not be representative of the UK population, but it is included for reasons of interest. Any break column with abase size lower than 100 has been removed as margins of error become too great. Data is tested at the 95% confidence level.
QB3 (QB4). SHOWCARD Which games console/s do you or does anyone in your household have at the moment? (MULTI CODE)
Base : Those who have access to a games console at home
ENGLAND REGIONS URBANITY WORKING DEPRIVATION LEVEL
Total LONDONSOUTH
EASTSOUTH
WESTEASTMIDS
WESTMIDS
EASTOF
ENGYORKS&HUMBER
NORTHEAST
NORTHWEST URBAN RURAL YES NO LOW
MEDIUM/HIGH
Significance Level: 95% a b c ~d e f g h i j k l m n o
Unweighted total 1687 118 115 132 97 134 121 114 126 124 1283 404 1110 573 805 882
Effective Weighted Sample 1240 114 109 128 94 129 117 111 121 119 1055 196 809 441 564 676
Total 1302 155 171 128 83 130 124 105 60 149 1143 159 898 402 581 72112% 13% 10% ** 10% 10% 8% 5% 11% 88% 12% 69% 31% 45% 55%
Don't know 44 5 13 - ** 4 4 8 1 1 38 6 30 15 14 303% 3% 7% -% ** 3% 3% 8% 2% 1% 3% 4% 3% 4% 2% 4%
c ci c c ci11% 29% -% ** 10% 8% 19% 3% 2% 86% 14% 67% 33% 32% 68%
Columns Tested: a,b,c,d,e,f,g,h,i - j,k - l,m - n,o
Prepared by Saville Rossiter-Base : 01727 899 399
OFCOM NATIONS & REGIONS TRACKER - MAIN SET - QUARTER 1 2015. 3rd January to 28th February 2015. Table 19
All data have been weighted to ensure they are representative of the UK adult population. Ofcom does not quota or weight by household income, so it may not be representative of the UK population, but it is included for reasons of interest. Any break column with abase size lower than 100 has been removed as margins of error become too great. Data is tested at the 95% confidence level.
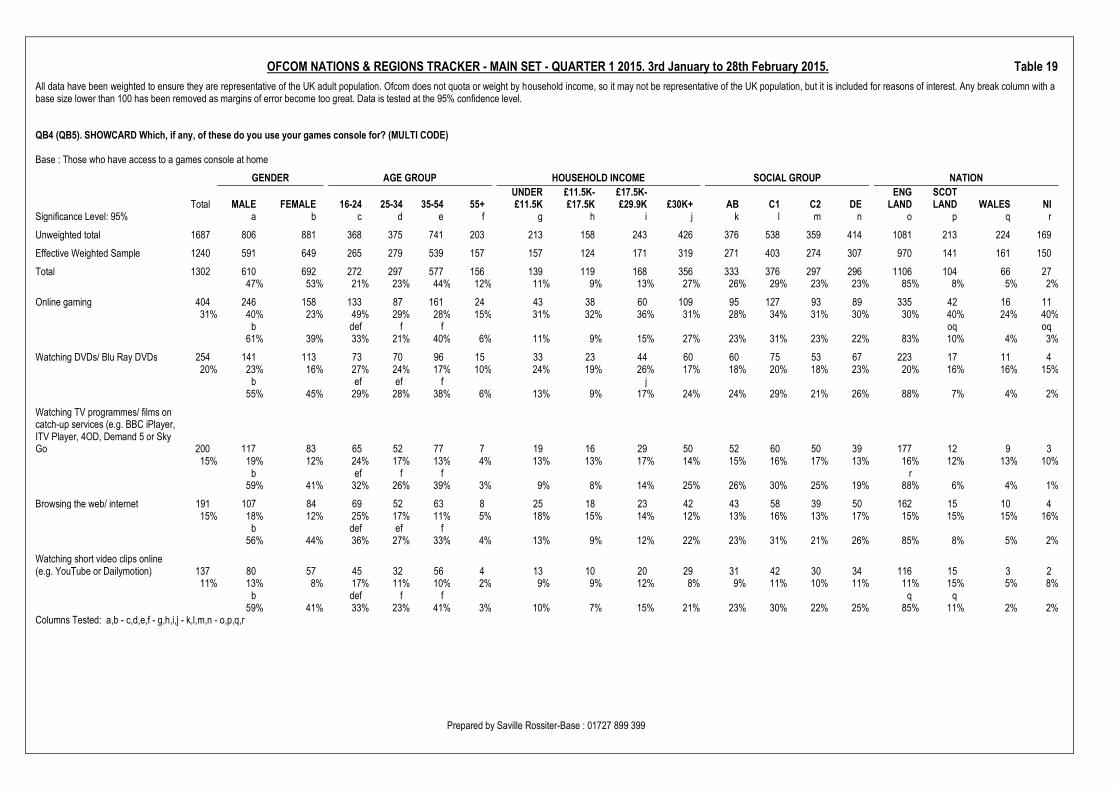
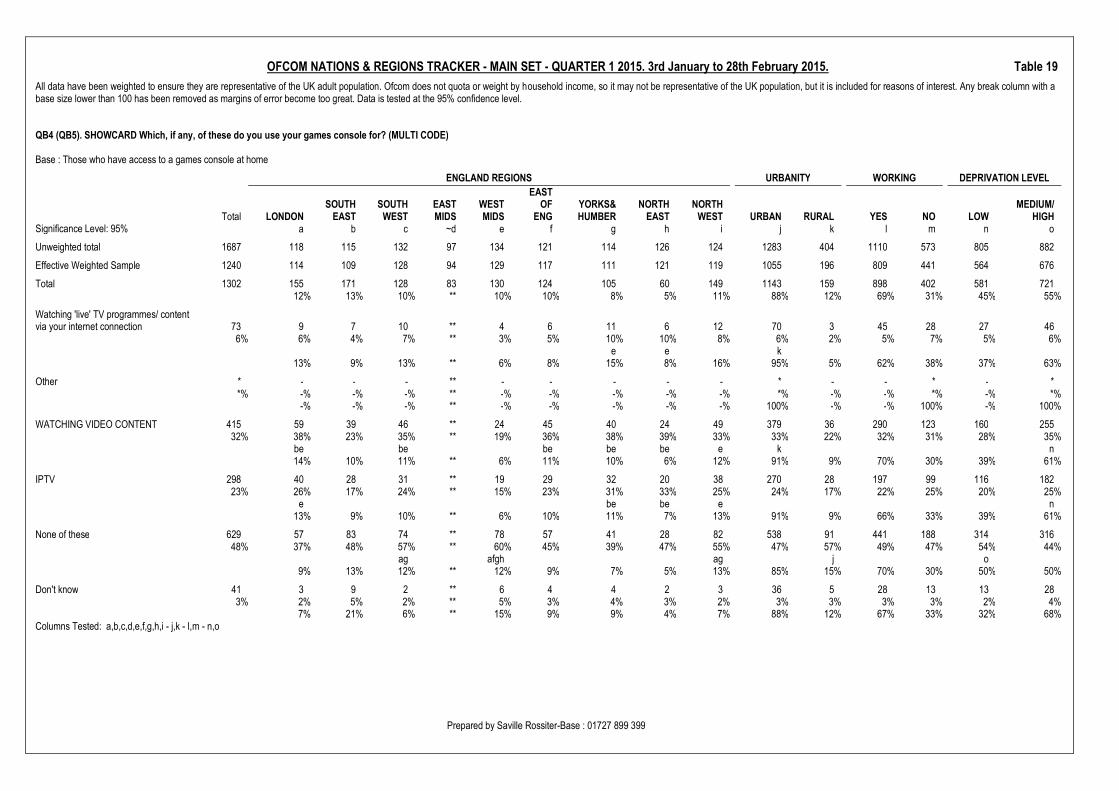
QB4 (QB5). SHOWCARD Which, if any, of these do you use your games console for? (MULTI CODE)
Base : Those who have access to a games console at home
GENDER AGE GROUP HOUSEHOLD INCOME SOCIAL GROUP NATION
Total MALE FEMALE 16-24 25-34 35-54 55+UNDER£11.5K
£11.5K-£17.5K
£17.5K-£29.9K £30K+ AB C1 C2 DE
ENGLAND
SCOTLAND WALES NI
Significance Level: 95% a b c d e f g h i j k l m n o p q r
Unweighted total 1687 806 881 368 375 741 203 213 158 243 426 376 538 359 414 1081 213 224 169
Effective Weighted Sample 1240 591 649 265 279 539 157 157 124 171 319 271 403 274 307 970 141 161 150
Total 1302 610 692 272 297 577 156 139 119 168 356 333 376 297 296 1106 104 66 2747% 53% 21% 23% 44% 12% 11% 9% 13% 27% 26% 29% 23% 23% 85% 8% 5% 2%
Online gaming 404 246 158 133 87 161 24 43 38 60 109 95 127 93 89 335 42 16 1131% 40% 23% 49% 29% 28% 15% 31% 32% 36% 31% 28% 34% 31% 30% 30% 40% 24% 40%
b def f f oq oq61% 39% 33% 21% 40% 6% 11% 9% 15% 27% 23% 31% 23% 22% 83% 10% 4% 3%
Watching DVDs/ Blu Ray DVDs 254 141 113 73 70 96 15 33 23 44 60 60 75 53 67 223 17 11 420% 23% 16% 27% 24% 17% 10% 24% 19% 26% 17% 18% 20% 18% 23% 20% 16% 16% 15%
b ef ef f j55% 45% 29% 28% 38% 6% 13% 9% 17% 24% 24% 29% 21% 26% 88% 7% 4% 2%
Watching TV programmes/ films oncatch-up services (e.g. BBC iPlayer,ITV Player, 4OD, Demand 5 or SkyGo 200 117 83 65 52 77 7 19 16 29 50 52 60 50 39 177 12 9 3
15% 19% 12% 24% 17% 13% 4% 13% 13% 17% 14% 15% 16% 17% 13% 16% 12% 13% 10%b ef f f r
59% 41% 32% 26% 39% 3% 9% 8% 14% 25% 26% 30% 25% 19% 88% 6% 4% 1%
Browsing the web/ internet 191 107 84 69 52 63 8 25 18 23 42 43 58 39 50 162 15 10 415% 18% 12% 25% 17% 11% 5% 18% 15% 14% 12% 13% 16% 13% 17% 15% 15% 15% 16%
b def ef f56% 44% 36% 27% 33% 4% 13% 9% 12% 22% 23% 31% 21% 26% 85% 8% 5% 2%
Watching short video clips online(e.g. YouTube or Dailymotion) 137 80 57 45 32 56 4 13 10 20 29 31 42 30 34 116 15 3 2
11% 13% 8% 17% 11% 10% 2% 9% 9% 12% 8% 9% 11% 10% 11% 11% 15% 5% 8%b def f f q q
59% 41% 33% 23% 41% 3% 10% 7% 15% 21% 23% 30% 22% 25% 85% 11% 2% 2%Columns Tested: a,b - c,d,e,f - g,h,i,j - k,l,m,n - o,p,q,r

Prepared by Saville Rossiter-Base : 01727 899 399
OFCOM NATIONS & REGIONS TRACKER - MAIN SET - QUARTER 1 2015. 3rd January to 28th February 2015. Table 19
All data have been weighted to ensure they are representative of the UK adult population. Ofcom does not quota or weight by household income, so it may not be representative of the UK population, but it is included for reasons of interest. Any break column with abase size lower than 100 has been removed as margins of error become too great. Data is tested at the 95% confidence level.
QB4 (QB5). SHOWCARD Which, if any, of these do you use your games console for? (MULTI CODE)
Base : Those who have access to a games console at home
GENDER AGE GROUP HOUSEHOLD INCOME SOCIAL GROUP NATION
Total MALE FEMALE 16-24 25-34 35-54 55+UNDER£11.5K
£11.5K-£17.5K
£17.5K-£29.9K £30K+ AB C1 C2 DE
ENGLAND
SCOTLAND WALES NI
Significance Level: 95% a b c d e f g h i j k l m n o p q r
Unweighted total 1687 806 881 368 375 741 203 213 158 243 426 376 538 359 414 1081 213 224 169
Effective Weighted Sample 1240 591 649 265 279 539 157 157 124 171 319 271 403 274 307 970 141 161 150
Total 1302 610 692 272 297 577 156 139 119 168 356 333 376 297 296 1106 104 66 2747% 53% 21% 23% 44% 12% 11% 9% 13% 27% 26% 29% 23% 23% 85% 8% 5% 2%
Watching purchased TVprogrammes/ films online ordownloads, either via pay per viewservices (e.g. Playstation Movies,Blinkbox) or via a 'standalone'subscription service (e.g. LoveFilmInstant, Netflix) 124 67 58 42 31 50 1 12 12 16 29 31 33 28 32 106 11 5 3
10% 11% 8% 16% 10% 9% 1% 9% 10% 9% 8% 9% 9% 9% 11% 10% 11% 7% 10%ef f f
54% 46% 34% 25% 40% 1% 10% 10% 13% 23% 25% 27% 22% 26% 85% 9% 4% 2%
Watching other free professional TVprogrammes/ films or videochannels online (e.g. on YouTubechannels such as Channel 4, JamieOliver's Foodtube or on other sitese.g. Vimeo, South Park Studios) 113 63 49 41 29 38 5 11 7 16 25 23 34 32 24 100 6 5 2
9% 10% 7% 15% 10% 7% 3% 8% 6% 10% 7% 7% 9% 11% 8% 9% 5% 7% 7%b def f
56% 44% 37% 25% 34% 4% 10% 6% 14% 22% 20% 30% 28% 21% 89% 5% 4% 2%Columns Tested: a,b - c,d,e,f - g,h,i,j - k,l,m,n - o,p,q,r

Prepared by Saville Rossiter-Base : 01727 899 399
OFCOM NATIONS & REGIONS TRACKER - MAIN SET - QUARTER 1 2015. 3rd January to 28th February 2015. Table 19
All data have been weighted to ensure they are representative of the UK adult population. Ofcom does not quota or weight by household income, so it may not be representative of the UK population, but it is included for reasons of interest. Any break column with abase size lower than 100 has been removed as margins of error become too great. Data is tested at the 95% confidence level.
QB4 (QB5). SHOWCARD Which, if any, of these do you use your games console for? (MULTI CODE)
Base : Those who have access to a games console at home
GENDER AGE GROUP HOUSEHOLD INCOME SOCIAL GROUP NATION
Total MALE FEMALE 16-24 25-34 35-54 55+UNDER£11.5K
£11.5K-£17.5K
£17.5K-£29.9K £30K+ AB C1 C2 DE
ENGLAND
SCOTLAND WALES NI
Significance Level: 95% a b c d e f g h i j k l m n o p q r
Unweighted total 1687 806 881 368 375 741 203 213 158 243 426 376 538 359 414 1081 213 224 169
Effective Weighted Sample 1240 591 649 265 279 539 157 157 124 171 319 271 403 274 307 970 141 161 150
Total 1302 610 692 272 297 577 156 139 119 168 356 333 376 297 296 1106 104 66 2747% 53% 21% 23% 44% 12% 11% 9% 13% 27% 26% 29% 23% 23% 85% 8% 5% 2%
Watching 'live' TV programmes/content via your internet connection 73 43 30 25 21 25 2 5 5 12 17 17 20 20 16 66 5 1 1
6% 7% 4% 9% 7% 4% 1% 4% 4% 7% 5% 5% 5% 7% 5% 6% 5% 1% 4%b ef f q
59% 41% 34% 28% 35% 3% 7% 6% 17% 23% 23% 28% 27% 22% 90% 7% 1% 2%
Other * * - * - - - * - - - - * - - - - * -*% *% -% *% -% -% -% *% -% -% -% -% *% -% -% -% -% *% -%
100% -% 100% -% -% -% 100% -% -% -% -% 100% -% -% -% -% 100% -%
WATCHING VIDEO CONTENT 415 221 194 125 110 160 20 51 35 61 98 101 130 88 96 356 32 20 632% 36% 28% 46% 37% 28% 13% 36% 29% 36% 28% 30% 35% 30% 32% 32% 31% 30% 24%
b def ef f j r53% 47% 30% 27% 38% 5% 12% 8% 15% 24% 24% 31% 21% 23% 86% 8% 5% 2%
IPTV 298 164 134 100 71 117 10 31 22 41 74 72 93 67 67 255 25 14 423% 27% 19% 37% 24% 20% 6% 22% 19% 24% 21% 22% 25% 22% 23% 23% 24% 22% 15%
b def f f r55% 45% 34% 24% 39% 3% 10% 7% 14% 25% 24% 31% 22% 22% 86% 8% 5% 1%
None of these 629 255 374 81 133 308 107 65 58 72 180 165 165 156 144 538 45 34 1248% 42% 54% 30% 45% 53% 69% 47% 48% 43% 51% 50% 44% 52% 49% 49% 44% 52% 43%
a c cd cde l41% 59% 13% 21% 49% 17% 10% 9% 11% 29% 26% 26% 25% 23% 85% 7% 5% 2%
Don't know 41 14 28 6 3 21 11 2 6 3 11 11 13 6 11 34 4 2 13% 2% 4% 2% 1% 4% 7% 2% 5% 2% 3% 3% 3% 2% 4% 3% 4% 3% 4%
d cd33% 67% 15% 7% 50% 27% 6% 14% 8% 27% 27% 31% 15% 27% 83% 9% 5% 3%
Columns Tested: a,b - c,d,e,f - g,h,i,j - k,l,m,n - o,p,q,r

Prepared by Saville Rossiter-Base : 01727 899 399
OFCOM NATIONS & REGIONS TRACKER - MAIN SET - QUARTER 1 2015. 3rd January to 28th February 2015. Table 19
All data have been weighted to ensure they are representative of the UK adult population. Ofcom does not quota or weight by household income, so it may not be representative of the UK population, but it is included for reasons of interest. Any break column with abase size lower than 100 has been removed as margins of error become too great. Data is tested at the 95% confidence level.
QB4 (QB5). SHOWCARD Which, if any, of these do you use your games console for? (MULTI CODE)
Base : Those who have access to a games console at home
ENGLAND REGIONS URBANITY WORKING DEPRIVATION LEVEL
Total LONDONSOUTH
EASTSOUTH
WESTEASTMIDS
WESTMIDS
EASTOF
ENGYORKS&HUMBER
NORTHEAST
NORTHWEST URBAN RURAL YES NO LOW
MEDIUM/HIGH
Significance Level: 95% a b c ~d e f g h i j k l m n o
Unweighted total 1687 118 115 132 97 134 121 114 126 124 1283 404 1110 573 805 882
Effective Weighted Sample 1240 114 109 128 94 129 117 111 121 119 1055 196 809 441 564 676
Total 1302 155 171 128 83 130 124 105 60 149 1143 159 898 402 581 72112% 13% 10% ** 10% 10% 8% 5% 11% 88% 12% 69% 31% 45% 55%
Online gaming 404 52 48 33 ** 32 42 43 19 39 358 46 266 136 168 23531% 34% 28% 26% ** 24% 34% 41% 31% 26% 31% 29% 30% 34% 29% 33%
bcei13% 12% 8% ** 8% 10% 11% 5% 10% 89% 11% 66% 34% 42% 58%
Watching DVDs/ Blu Ray DVDs 254 32 23 34 ** 14 30 27 13 29 234 21 185 67 103 15220% 20% 14% 26% ** 11% 24% 25% 22% 20% 20% 13% 21% 17% 18% 21%
e be be be e k12% 9% 13% ** 6% 12% 10% 5% 12% 92% 8% 73% 26% 40% 60%
Watching TV programmes/ films on catch-up services (e.g. BBC iPlayer, ITV Player,4OD, Demand 5 or Sky Go 200 23 22 19 ** 17 12 26 17 27 182 19 137 61 80 120
15% 15% 13% 15% ** 13% 10% 25% 28% 18% 16% 12% 15% 15% 14% 17%bef abcef
11% 11% 10% ** 8% 6% 13% 8% 14% 91% 9% 69% 30% 40% 60%
Browsing the web/ internet 191 24 28 16 ** 16 17 21 13 15 174 17 120 69 76 11515% 16% 16% 13% ** 13% 14% 20% 21% 10% 15% 11% 13% 17% 13% 16%
i i13% 14% 8% ** 8% 9% 11% 7% 8% 91% 9% 63% 36% 40% 60%
Watching short video clips online (e.g.YouTube or Dailymotion) 137 20 13 20 ** 6 11 13 9 15 125 12 96 39 48 89
11% 13% 8% 16% ** 5% 9% 12% 15% 10% 11% 7% 11% 10% 8% 12%e e e e n
15% 10% 15% ** 4% 8% 9% 7% 11% 91% 9% 70% 28% 35% 65%Columns Tested: a,b,c,d,e,f,g,h,i - j,k - l,m - n,o

Prepared by Saville Rossiter-Base : 01727 899 399
OFCOM NATIONS & REGIONS TRACKER - MAIN SET - QUARTER 1 2015. 3rd January to 28th February 2015. Table 19
All data have been weighted to ensure they are representative of the UK adult population. Ofcom does not quota or weight by household income, so it may not be representative of the UK population, but it is included for reasons of interest. Any break column with abase size lower than 100 has been removed as margins of error become too great. Data is tested at the 95% confidence level.
QB4 (QB5). SHOWCARD Which, if any, of these do you use your games console for? (MULTI CODE)
Base : Those who have access to a games console at home
ENGLAND REGIONS URBANITY WORKING DEPRIVATION LEVEL
Total LONDONSOUTH
EASTSOUTH
WESTEASTMIDS
WESTMIDS
EASTOF
ENGYORKS&HUMBER
NORTHEAST
NORTHWEST URBAN RURAL YES NO LOW
MEDIUM/HIGH
Significance Level: 95% a b c ~d e f g h i j k l m n o
Unweighted total 1687 118 115 132 97 134 121 114 126 124 1283 404 1110 573 805 882
Effective Weighted Sample 1240 114 109 128 94 129 117 111 121 119 1055 196 809 441 564 676
Total 1302 155 171 128 83 130 124 105 60 149 1143 159 898 402 581 72112% 13% 10% ** 10% 10% 8% 5% 11% 88% 12% 69% 31% 45% 55%
Watching purchased TV programmes/films online or downloads, either via payper view services (e.g. Playstation Movies,Blinkbox) or via a 'standalone' subscriptionservice (e.g. LoveFilm Instant, Netflix) 124 9 11 14 ** 10 9 16 9 21 114 10 86 35 50 74
10% 6% 6% 11% ** 8% 7% 15% 15% 14% 10% 7% 10% 9% 9% 10%ab ab
8% 9% 11% ** 8% 7% 13% 8% 17% 92% 8% 70% 29% 40% 60%
Watching other free professional TVprogrammes/ films or video channelsonline (e.g. on YouTube channels such asChannel 4, Jamie Oliver's Foodtube or onother sites e.g. Vimeo, South ParkStudios) 113 20 14 6 ** 12 9 13 9 13 104 9 76 34 37 76
9% 13% 8% 5% ** 9% 7% 12% 14% 8% 9% 5% 9% 9% 6% 11%c c c n
18% 12% 6% ** 10% 8% 12% 8% 11% 92% 8% 68% 30% 33% 67%Columns Tested: a,b,c,d,e,f,g,h,i - j,k - l,m - n,o
Prepared by Saville Rossiter-Base : 01727 899 399
OFCOM NATIONS & REGIONS TRACKER - MAIN SET - QUARTER 1 2015. 3rd January to 28th February 2015. Table 19
All data have been weighted to ensure they are representative of the UK adult population. Ofcom does not quota or weight by household income, so it may not be representative of the UK population, but it is included for reasons of interest. Any break column with abase size lower than 100 has been removed as margins of error become too great. Data is tested at the 95% confidence level.
QB4 (QB5). SHOWCARD Which, if any, of these do you use your games console for? (MULTI CODE)
Base : Those who have access to a games console at home
ENGLAND REGIONS URBANITY WORKING DEPRIVATION LEVEL
Total LONDONSOUTH
EASTSOUTH
WESTEASTMIDS
WESTMIDS
EASTOF
ENGYORKS&HUMBER
NORTHEAST
NORTHWEST URBAN RURAL YES NO LOW
MEDIUM/HIGH
Significance Level: 95% a b c ~d e f g h i j k l m n o
Unweighted total 1687 118 115 132 97 134 121 114 126 124 1283 404 1110 573 805 882
Effective Weighted Sample 1240 114 109 128 94 129 117 111 121 119 1055 196 809 441 564 676
Total 1302 155 171 128 83 130 124 105 60 149 1143 159 898 402 581 72112% 13% 10% ** 10% 10% 8% 5% 11% 88% 12% 69% 31% 45% 55%
Watching 'live' TV programmes/ contentvia your internet connection 73 9 7 10 ** 4 6 11 6 12 70 3 45 28 27 46
6% 6% 4% 7% ** 3% 5% 10% 10% 8% 6% 2% 5% 7% 5% 6%e e k
13% 9% 13% ** 6% 8% 15% 8% 16% 95% 5% 62% 38% 37% 63%
Other * - - - ** - - - - - * - - * - **% -% -% -% ** -% -% -% -% -% *% -% -% *% -% *%
-% -% -% ** -% -% -% -% -% 100% -% -% 100% -% 100%
WATCHING VIDEO CONTENT 415 59 39 46 ** 24 45 40 24 49 379 36 290 123 160 25532% 38% 23% 35% ** 19% 36% 38% 39% 33% 33% 22% 32% 31% 28% 35%
be be be be be e k n14% 10% 11% ** 6% 11% 10% 6% 12% 91% 9% 70% 30% 39% 61%
IPTV 298 40 28 31 ** 19 29 32 20 38 270 28 197 99 116 18223% 26% 17% 24% ** 15% 23% 31% 33% 25% 24% 17% 22% 25% 20% 25%
e be be e n13% 9% 10% ** 6% 10% 11% 7% 13% 91% 9% 66% 33% 39% 61%
None of these 629 57 83 74 ** 78 57 41 28 82 538 91 441 188 314 31648% 37% 48% 57% ** 60% 45% 39% 47% 55% 47% 57% 49% 47% 54% 44%
ag afgh ag j o9% 13% 12% ** 12% 9% 7% 5% 13% 85% 15% 70% 30% 50% 50%
Don't know 41 3 9 2 ** 6 4 4 2 3 36 5 28 13 13 283% 2% 5% 2% ** 5% 3% 4% 3% 2% 3% 3% 3% 3% 2% 4%
7% 21% 6% ** 15% 9% 9% 4% 7% 88% 12% 67% 33% 32% 68%Columns Tested: a,b,c,d,e,f,g,h,i - j,k - l,m - n,o
Prepared by Saville Rossiter-Base : 01727 899 399
OFCOM NATIONS & REGIONS TRACKER - MAIN SET - QUARTER 1 2015. 3rd January to 28th February 2015. Table 20
All data have been weighted to ensure they are representative of the UK adult population. Ofcom does not quota or weight by household income, so it may not be representative of the UK population, but it is included for reasons of interest. Any break column with abase size lower than 100 has been removed as margins of error become too great. Data is tested at the 95% confidence level.
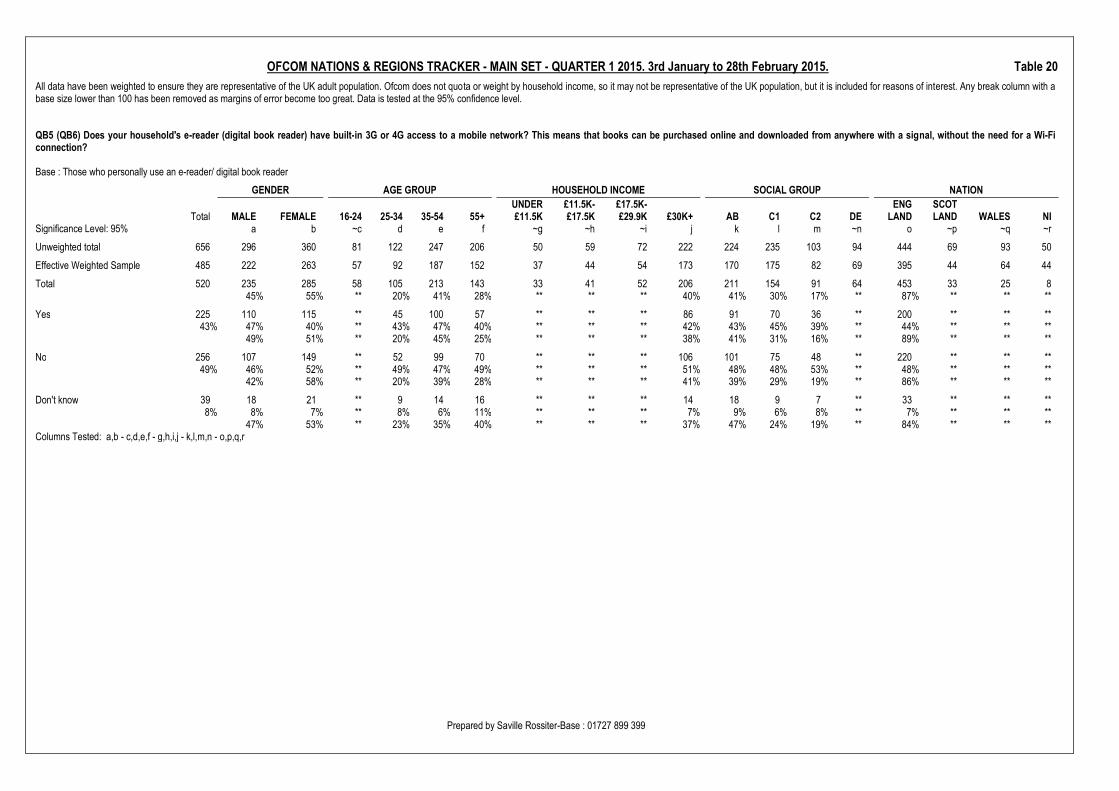
QB5 (QB6) Does your household's e-reader (digital book reader) have built-in 3G or 4G access to a mobile network? This means that books can be purchased online and downloaded from anywhere with a signal, without the need for a Wi-Ficonnection?
Base : Those who personally use an e-reader/ digital book reader
GENDER AGE GROUP HOUSEHOLD INCOME SOCIAL GROUP NATION
Total MALE FEMALE 16-24 25-34 35-54 55+UNDER£11.5K
£11.5K-£17.5K
£17.5K-£29.9K £30K+ AB C1 C2 DE
ENGLAND
SCOTLAND WALES NI
Significance Level: 95% a b ~c d e f ~g ~h ~i j k l m ~n o ~p ~q ~r
Unweighted total 656 296 360 81 122 247 206 50 59 72 222 224 235 103 94 444 69 93 50
Effective Weighted Sample 485 222 263 57 92 187 152 37 44 54 173 170 175 82 69 395 44 64 44
Total 520 235 285 58 105 213 143 33 41 52 206 211 154 91 64 453 33 25 845% 55% ** 20% 41% 28% ** ** ** 40% 41% 30% 17% ** 87% ** ** **
Yes 225 110 115 ** 45 100 57 ** ** ** 86 91 70 36 ** 200 ** ** **43% 47% 40% ** 43% 47% 40% ** ** ** 42% 43% 45% 39% ** 44% ** ** **
49% 51% ** 20% 45% 25% ** ** ** 38% 41% 31% 16% ** 89% ** ** **
No 256 107 149 ** 52 99 70 ** ** ** 106 101 75 48 ** 220 ** ** **49% 46% 52% ** 49% 47% 49% ** ** ** 51% 48% 48% 53% ** 48% ** ** **
42% 58% ** 20% 39% 28% ** ** ** 41% 39% 29% 19% ** 86% ** ** **
Don't know 39 18 21 ** 9 14 16 ** ** ** 14 18 9 7 ** 33 ** ** **8% 8% 7% ** 8% 6% 11% ** ** ** 7% 9% 6% 8% ** 7% ** ** **
47% 53% ** 23% 35% 40% ** ** ** 37% 47% 24% 19% ** 84% ** ** **Columns Tested: a,b - c,d,e,f - g,h,i,j - k,l,m,n - o,p,q,r

Prepared by Saville Rossiter-Base : 01727 899 399
OFCOM NATIONS & REGIONS TRACKER - MAIN SET - QUARTER 1 2015. 3rd January to 28th February 2015. Table 20
All data have been weighted to ensure they are representative of the UK adult population. Ofcom does not quota or weight by household income, so it may not be representative of the UK population, but it is included for reasons of interest. Any break column with abase size lower than 100 has been removed as margins of error become too great. Data is tested at the 95% confidence level.
QB5 (QB6) Does your household's e-reader (digital book reader) have built-in 3G or 4G access to a mobile network? This means that books can be purchased online and downloaded from anywhere with a signal, without the need for a Wi-Ficonnection?
Base : Those who personally use an e-reader/ digital book reader
ENGLAND REGIONS URBANITY WORKING DEPRIVATION LEVEL
Total LONDONSOUTH
EASTSOUTH
WESTEASTMIDS
WESTMIDS
EASTOF
ENGYORKS&HUMBER
NORTHEAST
NORTHWEST URBAN RURAL YES NO LOW
MEDIUM/HIGH
Significance Level: 95% ~a ~b ~c ~d ~e ~f ~g ~h ~i j k l m n o
Unweighted total 656 35 56 58 49 40 64 45 47 50 490 166 411 244 366 290
Effective Weighted Sample 485 34 53 56 47 39 62 43 45 47 400 87 307 187 276 209
Total 520 47 85 55 40 41 67 40 22 58 440 80 356 164 297 223** ** ** ** ** ** ** ** ** 85% 15% 69% 31% 57% 43%
Yes 225 ** ** ** ** ** ** ** ** ** 200 24 153 72 120 10543% ** ** ** ** ** ** ** ** ** 46% 30% 43% 44% 40% 47%
k** ** ** ** ** ** ** ** ** 89% 11% 68% 32% 53% 47%
No 256 ** ** ** ** ** ** ** ** ** 210 46 181 75 149 10749% ** ** ** ** ** ** ** ** ** 48% 58% 51% 46% 50% 48%
** ** ** ** ** ** ** ** ** 82% 18% 71% 29% 58% 42%
Don't know 39 ** ** ** ** ** ** ** ** ** 30 10 22 17 29 118% ** ** ** ** ** ** ** ** ** 7% 12% 6% 11% 10% 5%
o** ** ** ** ** ** ** ** ** 75% 25% 56% 44% 73% 27%
Columns Tested: a,b,c,d,e,f,g,h,i - j,k - l,m - n,o
![NOTE: To appreciate this presentation [and ensure that it is not a mess ], you need Microsoft fonts: Showcard Gothic, Ravie, Chiller and Verdana.](https://static.fdocuments.in/doc/165x107/551466cd550346b0158b4b8e/note-to-appreciate-this-presentation-and-ensure-that-it-is-not-a-mess-you-need-microsoft-fonts-showcard-gothic-ravie-chiller-and-verdana.jpg)


![New PP stuff. Tom Peters. 20.August.2010.. NOTE: To appreciate this presentation [and insure that it is not a mess ], you need Microsoft fonts: “Showcard.](https://static.fdocuments.in/doc/165x107/56649dcf5503460f94ac4590/new-pp-stuff-tom-peters-20august2010-note-to-appreciate-this-presentation.jpg)


![Before we begin …. NOTE: To appreciate this presentation [and insure that it is not a mess ], you need Microsoft fonts: “Showcard Gothic,” “Ravie,” “Chiller”](https://static.fdocuments.in/doc/165x107/5a4d1ad97f8b9ab059974056/before-we-begin-note-to-appreciate-this-presentation-and-insure.jpg)


