QB Report - PredictionMachine.com Report There is a limited supply of top shelf NFL starting Q ’s,...
20
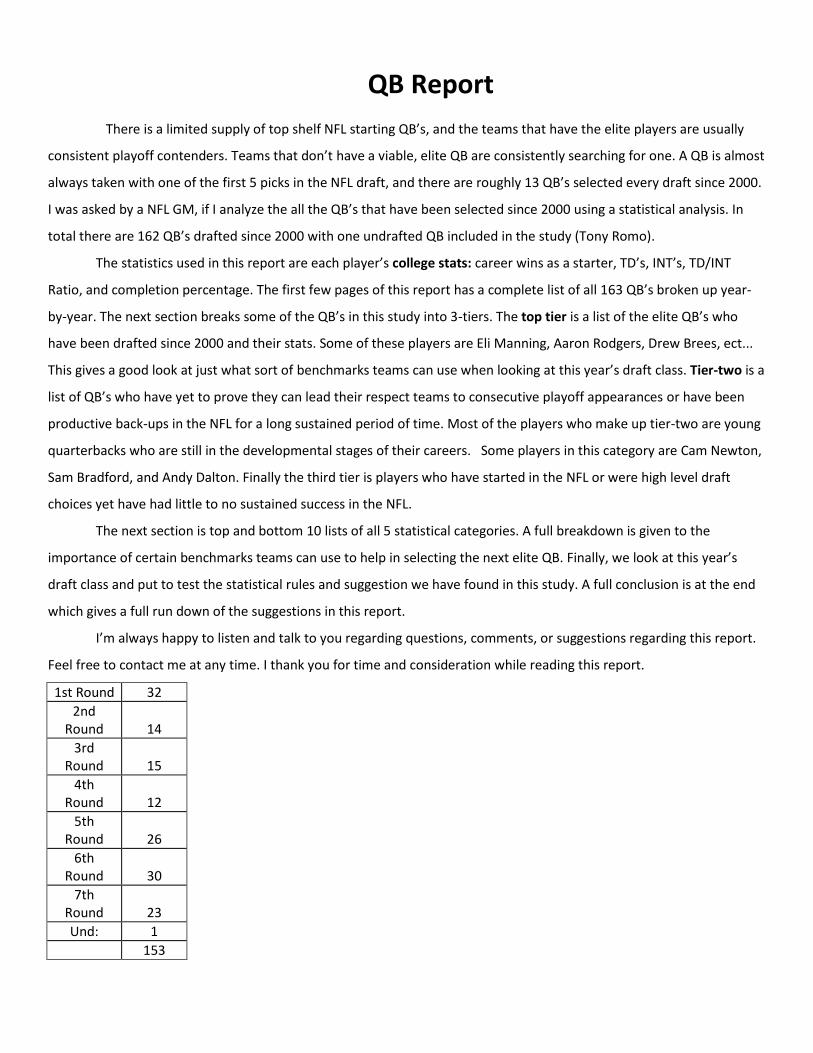
QB Report There is a limited supply of top shelf NFL starting QB’s, and the teams that have the elite players are usually consistent playoff contenders. Teams that don’t have a viable, elite QB are consistently searching for one. A QB is almost always taken with one of the first 5 picks in the NFL draft, and there are roughly 13 QB’s selected every draft since 2000. I was asked by a NFL GM, if I analyze the all the QB’s that have been selected since 2000 using a statistical analysis. In total there are 162 QB’s drafted since 2000 with one undrafted QB included in the study (Tony Romo). The statistics used in this report are each player’s college stats: career wins as a starter, TD’s, INT’s, TD/INT Ratio, and completion percentage. The first few pages of this report has a complete list of all 163 QB’s broken up year- by-year. The next section breaks some of the QB’s in this study into 3-tiers. The top tier is a list of the elite QB’s who have been drafted since 2000 and their stats. Some of these players are Eli Manning, Aaron Rodgers, Drew Brees, ect... This gives a good look at just what sort of benchmarks teams can use when looking at this year’s draft class. Tier-two is a list of QB’s who have yet to prove they can lead their respect teams to consecutive playoff appearances or have been productive back-ups in the NFL for a long sustained period of time. Most of the players who make up tier-two are young quarterbacks who are still in the developmental stages of their careers. Some players in this category are Cam Newton, Sam Bradford, and Andy Dalton. Finally the third tier is players who have started in the NFL or were high level draft choices yet have had little to no sustained success in the NFL. The next section is top and bottom 10 lists of all 5 statistical categories. A full breakdown is given to the importance of certain benchmarks teams can use to help in selecting the next elite QB. Finally, we look at this year’s draft class and put to test the statistical rules and suggestion we have found in this study. A full conclusion is at the end which gives a full run down of the suggestions in this report. I’m always happy to listen and talk to you regarding questions, comments, or suggestions regarding this report. Feel free to contact me at any time. I thank you for time and consideration while reading this report. 1st Round 32 2nd Round 14 3rd Round 15 4th Round 12 5th Round 26 6th Round 30 7th Round 23 Und: 1 153
Transcript of QB Report - PredictionMachine.com Report There is a limited supply of top shelf NFL starting Q ’s,...
QB Report
There is a limited supply of top shelf NFL starting QB’s, and the teams that have the elite players are usually
consistent playoff contenders. Teams that don’t have a viable, elite QB are consistently searching for one. A QB is almost
always taken with one of the first 5 picks in the NFL draft, and there are roughly 13 QB’s selected every draft since 2000.
I was asked by a NFL GM, if I analyze the all the QB’s that have been selected since 2000 using a statistical analysis. In
total there are 162 QB’s drafted since 2000 with one undrafted QB included in the study (Tony Romo).
The statistics used in this report are each player’s college stats: career wins as a starter, TD’s, INT’s, TD/INT
Ratio, and completion percentage. The first few pages of this report has a complete list of all 163 QB’s broken up year-
by-year. The next section breaks some of the QB’s in this study into 3-tiers. The top tier is a list of the elite QB’s who
have been drafted since 2000 and their stats. Some of these players are Eli Manning, Aaron Rodgers, Drew Brees, ect...
This gives a good look at just what sort of benchmarks teams can use when looking at this year’s draft class. Tier-two is a
list of QB’s who have yet to prove they can lead their respect teams to consecutive playoff appearances or have been
productive back-ups in the NFL for a long sustained period of time. Most of the players who make up tier-two are young
quarterbacks who are still in the developmental stages of their careers. Some players in this category are Cam Newton,
Sam Bradford, and Andy Dalton. Finally the third tier is players who have started in the NFL or were high level draft
choices yet have had little to no sustained success in the NFL.
The next section is top and bottom 10 lists of all 5 statistical categories. A full breakdown is given to the
importance of certain benchmarks teams can use to help in selecting the next elite QB. Finally, we look at this year’s
draft class and put to test the statistical rules and suggestion we have found in this study. A full conclusion is at the end
which gives a full run down of the suggestions in this report.
I’m always happy to listen and talk to you regarding questions, comments, or suggestions regarding this report.
Feel free to contact me at any time. I thank you for time and consideration while reading this report.
1st Round 32
2nd Round 14
3rd Round 15
4th Round 12
5th Round 26
6th Round 30
7th Round 23
Und: 1
153

Section One:
Quarterbacks Drafted
2000-2012

Year Player Round School Wins TD INT TD/INT Ratio
Comp: %
2000 Chad Pennington 1st Marshall 45 115 45 2.56 63.37%
2000 Giovanni Carmazzi 3rd Hofstra 33 71 32 2.22 64.36%
2000 Chris Redman 3rd Louisville 84 51 1.65 61.40%
2000 Tee Martin 5th Tennessee 21 32 15 2.13 55.44%
2000 Marc Bulger 6th West Virginia 22 59 34 1.74 61.58%
2000 Spergon Wynn 6th SW Texas State 7 24 19 1.26 55.02%
2000 Tom Brady 6th Michigan 20 35 19 1.84 62.30%
2000 Todd Husak 6th Stanford 11 41 21 1.95 53.30%
2000 JaJuan Sneider 6th Florida A&M
2000 Tim Rattay 7th La. Tech 22 117 35 3.34 65.39%
2000 Jarious Jackson 7th Notre Dame 14 34 21 1.62 57.08%
2000 Joe Hamilton 7th Georgia Tech 30 65 39 1.67 61.70%
2001 Mike Vick 1st Va. Tech 21 21 13 1.62 56.32%
2001 Drew Brees 2nd Purdue 24 90 45 2.00 61.14%
2001 Quincy Carter 2nd Georgia 22 35 25 1.40 56.62%
2001 Marques
Tuiasosopo 2nd UW 20 33 29 1.14 55.90%
2001 Chris Weinke 4th Florida State 32 33 11 3.00 58.71%
2001 Sage Rosenfels 4th Iowa State 13 19 26 0.73 52.10%
2001 Jesse Palmer 4th Florida 11 31 17 1.82 53.00%
2001 Mike McMahon 5th Rutgers 8 18 17 1.06 49.70%
2001 A.J. Feely 5th Oregon 7 15 6 2.50 52.83%
2001 Josh Booty 6th LSU 8 24 15 1.60 49.30%
2001 Josh Heupel 6th Oklahoma 20 53 14 3.79 64.66%
2002 David Carr 1st Fresno State 28 70 23 3.04 62.80%
2002 Joey Harrington 1st Oregon 25 59 23 2.57 55.20%
2002 Patrick Ramsay 1st Tulane 72 51 1.41 58.89%
2002 Josh McCown 3rd Sam Houston St. 18 56 46 1.22 58.97%
2002 David Garrard 4th ECU 27 60 39 1.54 56.97%
2002 Rohan Davey 4th LSU 12 29 11 2.64 59.12%
2002 Randy Fasani 5th Stanford 9 13 4 3.25 50.90%
2002 Kurt Kittner 5th Illinois 24 70 34 2.06 54.00%
2002 Brandon Doman 5th BYU 26 35 14 2.50 62.00%
2002 Craig Nall 5th Northwestern
State 6 14 3 4.67 56.10%
2002 J.T. O'Sullivan 6th UC Davis 32 94 41 2.29 62.52%
2002 Steve Bellisari 6th Ohio State 19 35 29 1.21 50.95%
2002 Jeff Kelly 7th Southern Miss 23 51 32 1.59 58.56%
2002 Wes Pate 7th Stephen F. Austin 17 49 27 1.81 53.10%

2003 Carson Palmer 1st USC 27 93 49 1.90 59.10%
2003 Byron Leftwich 1st Marshall 29 89 28 3.18 65.10%
2003 Kyle Boller 1st Cal. 11 64 48 1.33 50.04%
2003 Rex Grossman 1st Florida 23 77 36 2.14 61.10%
2003 Dave Ragone 3rd Louisville 74 29 2.55 58.01%
2003 Chris Simms 3rd Texas 26 58 31 1.87 58.72%
2003 Seneca Wallace 4th Iowa State 14 26 27 0.96 57.70%
2003 Brian St. Pierre 5th B.C. 15 48 27 1.78 56.90%
2003 Drew Henson 6th Michigan 11 16 4 4.00 60.36%
2003 Brooks Bollinger 6th Wisconsin 30 38 17 2.24 53.69%
2003 Kliff Kingsbury 6th Texas Tech 24 95 40 2.38 65.37%
2003 Gibran Hamdan 7th Indiana 4 9 14 0.64 51.83%
2003 Tony Romo Und. Eastern Illinois 26 85 36 2.36 62.06%
2004 Eli Manning 1st Ole Miss 24 84 36 2.33 60.80%
2004 Phillip Rivers 1st N.C. State 34 95 34 2.79 67.07%
2004 Ben Roethlisberger 1st Miami of Ohio 27 84 34 2.47 65.49%
2004 J.P. Losman 1st Tulane 13 60 27 2.22 57.70%
2004 Matt Schaub 3rd Virginia 21 56 26 2.15 67.00%
2004 Luke McCown 4th La. Tech 17 88 65 1.35 59.55%
2004 Craig Krenzel 5th Ohio State 24 28 20 1.40 56.82%
2004 Andy Hall 6th Delaware 21 34 12 2.83 57.40%
2004 Jim Sorgi 6th Wisconsin 7 33 21 1.57 55.49%
2004 Jeff Smoker 6th Michigan State 21 61 39 1.56 59.56%
2004 John Navarre 7th Michigan 31 72 31 2.32 56.00%
2004 Cody Pickett 7th UW 21 55 44 1.25 57.50%
2004 Casey Bramlet 7th Wyoming 8 56 48 1.17 55.57%
2004 Matt Mauck 7th LSU 19 36 18 2.00 58.60%
2004 B.J. Symons 7th Texas Tech 8 59 18 3.28 64.40%
2004 Bradlee Van Pelt 7th Colorado State 23 37 30 1.23 54.50%
2005 Alex Smith 1st Utah 21 47 8 5.88 66.26%
2005 Aaron Rodgers 1st Cal. 18 43 13 3.31 63.80%
2005 Jason Campbell 1st Auburn 25 45 24 1.88 64.60%
2005 Charlie Frye 3rd Akron 21 64 32 2.00 63.57%
2005 Andrew Walter 3rd Arizona State 18 85 36 2.36 54.87%
2005 David Greene 3rd Georgia 42 72 32 2.25 58.95%
2005 Kyle Orton 4th Purdue 19 32 23 1.39 58.41%
2005 Stefan Lefors 4th Louisville 37 13 2.85 66.00%
2005 Dan Orlosvsky 5th UConn 23 84 51 1.65 58.45%
2005 Adrian McPherson 5th Florida State 3 14 1 14.00 50.77%

2005 Derek Anderson 6th Oregon State 23 79 57 1.39 50.70%
2005 James Kilan 7th Tulsa 15 35 27 1.30 54.08%
2005 Matt Cassel 7th USC 0 0 1 0.00 57.57%
2006 Vince Young 1st Texas 30 44 28 1.57 60.80%
2006 Matt Leinart 1st USC 37 99 23 4.30 64.81%
2006 Jay Cutler 1st Vanderbilt 11 59 36 1.64 57.16%
2006 Kellen Clemens 2nd Oregon 20 61 24 2.54 60.90%
2006 Tavaris Jackson 2nd Alabama State 24 38 26 1.46 51.40%
2006 Charlie Whitehurst 3rd Clemson 25 49 46 1.07 59.66%
2006 Brodie Croyle 3rd Alabama 20 36 17 2.12 59.58%
2006 Brad Smith 4th Missouri 25 56 33 1.70 56.26%
2006 Ingle Martin 5th Furman 21 44 24 1.83 61.58%
2006 Omar Jacobs 5th Bowling Green 14 71 11 6.45 64.40%
2006 Reggie McNeal 6th Texas A&M 16 44 23 1.91 54.62%
2006 Bruce Gradkowski 6th Toledo 26 85 27 3.15 68.24%
2006 D.J. Shockley 7th Georgia 10 34 9 3.78 54.17%
2007 JaMarcus Russell 1st LSU 21 52 21 2.48 61.85%
2007 Brady Quinn 1st Notre Dame 29 95 32 2.97 57.99%
2007 Kevin Kolb 2nd Houston 26 85 31 2.74 61.60%
2007 John Beck 2nd BYU 38 79 34 2.32 62.41%
2007 Drew Stanton 2nd Michigan State 14 42 28 1.50 64.18%
2007 Trent Edwards 3rd Stanford 10 36 33 1.09 56.22%
2007 Jeff Rowe 5th Nevada 23 55 34 1.62 60.69%
2007 Troy Smith 5th Ohio State 25 54 13 4.15 62.70%
2007 Jordan Palmer 6th UTEP 23 88 64 1.38 59.63%
2007 Tyler Thigpen 7th Coastal Carolina 30 53 28 1.89 55.29%
2007 Matt Moore 7th Oregon State 15 29 26 1.12 60.00%
2008 Matt Ryan 1st B.C. 25 56 37 1.51 59.91%
2008 Joe Flacco 1st Delaware 13 36 15 2.40 63.43%
2008 Brian Brohm 2nd Louisville 24 71 24 2.96 65.82%
2008 Chad Henne 2nd Michigan 33 87 37 2.35 59.69%
2008 Kevin O'Connell 3rd San Diego State 12 46 34 1.35 57.69%
2008 John David Booty 5th USC 21 55 21 2.62 62.30%
2008 Dennis Dixon 5th Oregon 15 38 21 1.81 63.90%
2008 Josh Johnson 5th San Diego 30 113 14 8.07 68.26%
2008 Eric Ainge 5th Tennessee 25 72 35 2.06 60.57%
2008 Colt Brennan 6th Hawaii 25 131 42 3.12 70.40%
2008 Andre Woodson 6th Kentucky 18 81 25 3.24 62.70%
2008 Matt Flynn 7th LSU 12 31 14 2.21 56.10%

2008 Alex Brink 7th WSU 17 76 43 1.77 58.40%
2009 Matthew Stafford 1st Georgia 27 51 33 1.55 57.02%
2009 Mark Sanchez 1st USC 16 41 16 2.56 64.27%
2009 Josh Freeman 1st Kansas State 13 44 34 1.29 59.07%
2009 Pat White 2nd West Virginia 34 56 23 2.43 64.18%
2009 Stephen McGee 4th Texas A&M 16 28 13 2.15 59.50%
2009 Rhett Bromar 5th Sam Houston
State 17 37 27 1.37 57.35%
2009 Nate Davis 5th Ball State 22 74 18 4.11 60.32%
2009 Tom Brandstarter 6th Fresno State 11 47 32 1.47 59.04%
2009 Mike Teel 6th Rutgers 24 25 13 1.92 61.36%
2009 Keith Null 6th West Texas A&M 19 89 29 3.07 67.49%
2009 Curtis Painter 6th Purdue 30 67 46 1.46 59.89%
2010 Sam Bradford 1st Oklahoma 23 88 16 5.50 67.60%
2010 Tim Tebow 1st Florida 35 57 16 3.56 66.43%
2010 Jimmy Clausen 2nd Notre Dame 16 60 27 2.22 62.61%
2010 Colt McCoy 3rd Texas 43 112 45 2.49 70.33%
2010 Mike Kafka 4th Northwestern 12 19 20 0.95 64.05%
2010 John Skelton 5th Fordham 20 69 36 1.92 58.84%
2010 Jonathan Crompton
5th Tennessee 10 36 22 1.64 55.32%
2010 Rusty Smith 6th Florida Atlantic 19 76 36 2.11 56.42%
2010 Dan Lefevour 6th Central Michigan 36 102 36 2.83 66.42%
2010 Joe Webb 6th UAB 10 37 25 1.48 59.29%
2010 Tony Pike 6th Cincinnati 21 49 20 2.45 61.73%
2010 Levi Brown 7th Troy 14 43 19 2.26 61.06%
2010 Sean Canfield 7th Oregon State 15 38 26 1.46 64.11%
2010 Zac Robinson 7th Oklahoma State 23 66 31 2.13 61.06%
2011 Cam Newton 1st Auburn 14 30 7 4.29 66.07%
2011 Jake Locker 1st Washington 16 53 35 1.51 53.96%
2011 Blaine Gabbert 1st Missouri 18 40 18 2.22 60.87%
2011 Christian Ponder 1st Florida State 21 49 30 1.63 61.76%
2011 Andy Dalton 2nd TCU 41 71 30 2.37 61.65%
2011 Colin Kapernick 2nd Nevada 19 81 23 3.52 58.15%
2011 Ryan Mallett 3rd Arkansas 21 67 23 2.91 58.14%
2011 Ricky Stanzi 5th Iowa 26 56 31 1.81 59.75%
2011 T.J. Yates 5th UNC 23 58 46 1.26 62.25%
2011 Nathan Enderle 5th Idaho 17 81 60 1.35 59.00%
2011 Tyrod Taylor 6th Va.Tech 33 43 19 2.26 57.43%
2011 Greg McElroy 7th Alabama 24 39 10 3.90 66.26%

2012 Andrew Luck 1 Stanford 31 82 22 3.73 67.01%
2012 Robert Griffin III 1 Baylor 23 78 17 4.59 67.11%
2012 Ryan Tannehill 1 Texas A&M 12 42 21 2.00 62.53%
2012 Brandon Weeden 1 Okla. St 23 75 27 2.78 69.53%
2012 Brock Osweiler 2 Arizona St. 7 33 15 2.20 60.58%
2012 Russell Wilson 3 Wisconsin 30 109 30 3.63 60.91%
2012 Nick Foles 3 Arizona 15 67 33 2.03 66.88%
2012 Kirk Cousins 4 Michigan St. 27 66 30 2.20 64.09%
2012 Ryan Lindley 6 San Diego St. 23 90 47 1.91 55.48%
2012 B.J. Coleman 7 Chattanooga 14 52 31 1.68 57.44%
2012 Chandler Harnish 7 N. Illinois 28 68 26 2.62 61.89%

Section Two:
3-Tiers of QB Study

Tier 1: Elite QB’s
Year Player Round School Wins TD INT TD/INT Ratio Comp: % NFL Comp %
2000 Chad Pennington 1st Marshall 45 115 45 2.56 63.37% 66.04%
2000 Marc Bulger 6th West Virginia 22 59 34 1.74 61.58% 62.09%
2000 Tom Brady 6th Michigan 20 35 19 1.84 62.30% 63.76%
2001 Mike Vick 1st Va. Tech 21 21 13 1.62 56.32% 56.28%
2001 Drew Brees 2nd Purdue 24 90 45 2.00 61.14% 65.62%
2003 Carson Palmer 1st USC 27 93 49 1.90 59.10% 62.48%
2003 Tony Romo Und. Eastern Illinois 26 85 36 2.36 62.06% 64.72%
2004 Eli Manning 1st Ole Miss 24 84 36 2.33 60.80% 58.60%
2004 Phillip Rivers 1st N.C. State 34 95 34 2.79 67.07% 63.63%
2004 Ben Roethlisberger 1st Miami of Ohio 27 84 34 2.47 65.49% 63.10%
2004 Matt Schaub 3rd Virginia 21 56 26 2.15 67.00% 64.32%
2005 Aaron Rodgers 1st Cal. 18 43 13 3.31 63.80% 65.74%
2006 Jay Cutler 1st Vanderbilt 11 59 36 1.64 57.16% 60.77%
2008 Matt Ryan 1st B.C. 25 56 37 1.51 59.91% 62.72%
2008 Joe Flacco 1st Delaware 13 36 15 2.40 63.43% 62.00%
Avg: 23.87 67.40 31.47 2.17 62.04% 62.79%
Breakdown: These players were chosen from our list of 164 as the top level NFL QB’s who have been selected in the NFL
draft since 2000. Each of these players have or had shown a consistent level of play as a starting QB in the NFL for long
period of time. These players averaged roughly 24 wins while in college. Jay Cutler, Aaron Rodgers and recent Super
Bowl MVP Joe Flacco had less than 20 wins while in college. Most of these players had over 3 seasons as a starting QB in
college, which means they averaged roughly 9 wins a season. These players averaged 67 TD’s pass in college down from
previous years average of 69. A solid baseline of 40 TD’s pass thrown should be achieved before any QB is considered for
the NFL draft. A solid ratio of TD/INT Ratio of 2.0 should be achieved for any first round draft selection. Players that have
less than a 2.0 Ratio have shown to be inconsistent starters in the NFL. Finally, 4 of the 15 players in this list had a
completion percentage of 60% or less. Of these 4 players 2 of them (Matt Ryan and Carson Palmer) were 4 year starters
while in college. Each showed a continue ability to get better each season and were only a single percentage point away
from achieving the benchmark of 60%. On average the quarterbacks in this tier raised their career completion .76% from
college to the NFL. Tom Landry once said you can’t teach accuracy, and a .76% proof that he is correct

Tier 2: Second Level QB’s
Year Player Round School Wins TD INT TD/INT Ratio Comp: % Pro Comp %
2002 David Garrard 4th ECU 27 60 39 1.54 56.97% 61.63%
2003 Byron Leftwich 1st Marshall 29 89 28 3.1 65.10% 58.25%
2003 Seneca Wallace 4th Iowa State 14 26 27 0.96 57.70% 59.89%
2005 Jason Campbell 1st Auburn 25 45 24 1.8 64.60% 61.20%
2005 Matt Cassel 7th USC 0 0 1 0 57.57% 59.16%
2005 Alex Smith 1st Utah 21 47 8 5.8 66.26% 56.31%
2007 Kevin Kolb 2nd Houston 26 85 31 2.7 61.60% 60.76%
2008 Chad Henne 2nd Michigan 33 87 37 2.3 59.69% 60.69%
2009 Matthew Stafford 1st Georgia 27 51 33 1.54 57.02% 54.54%
2009 Josh Freeman 1st Kansas State 13 44 34 1.29 59.07% 58.76%
2010 Sam Bradford 1st Oklahoma 23 88 16 5.50 67.60% 60.00%
2010 Tim Tebow 1st Florida 35 57 16 3.56 66.43% 47.30%
2011 Cam Newton 1st Auburn 14 30 7 4.29 66.07% 59.96%
2011 Andy Dalton 2nd TCU 41 71 30 2.37 61.65% 58.13%
2011 Colin Kapernick 2nd Nevada 19 81 23 3.52 58.15%
2011 Christian Ponder 1st Florida State 21 49 30 1.63 61.76%
2012 Andrew Luck 1st Stanford 31 82 22 3.73 67.01% 58.33%
2012 Robert Griffin III 1st Baylor 23 78 17 4.59 67.11%
2012 Russell Wilson 3rd Wisconsin 30 109 30 3.63 60.91%
Avg: 23.79 62.05 23.84 2.83 62.22%
Breakdown: This list is a collection 19 players who are second tier QB’s in the NFL. This designation means they have yet
to show the consistent ability to produce at an elite level for a long period of time (Dalton, Newton, and Luck). They
have shown the ability to be a quality backups for a long period of time (Wallace, Leftwich). Lastly, they have been
starters in the NFL but have yet to transform their club into a perianal contender ( Campbell, and Garrard). These 19
players averaged roughly the same number of career wins a starter in college as the top tier group. These players avg. 62
TD’s passes, 5 less than our top tier group. 7 of the 19 players in this list had a completion percentage less than the 60%
benchmark. This is an interesting collection of players and it remains to be seen which players in this group will jump up
to the elite level, stay here or possible drop down to level 3. Luck, Griffin III, Wilson, Kapernick, Newton, Dalton, and
Bradford all are poised to take the next step, what is needed is just consistency.

Tier 3: Reserved/Backup QB’s
Year Player Round School Wins TD INT TD/INT Ratio
Comp: %
Pro Comp %
2001 Sage Rosenfels 4th Iowa State 13 19 26 0.73 52.10% 62.45%
2002 David Carr 1st Fresno State 28 70 23 3.04 62.80% 59.67%
2003 Kyle Boller 1st Cal. 11 64 48 1.33 50.04% 56.68%
2003 Rex Grossman 1st Florida 23 77 36 2.1 61.10% 53.96%
2004 J.P. Losman 1st Tulane 13 60 27 2.2 57.70% 59.23%
2005 Derek Anderson 6th Oregon State 23 79 57 1.3 50.70% 52.93%
2006 Matt Leinart 1st USC 37 99 23 4.3 64.81% 57.14%
2006 Bruce Gradkowski 6th Toledo 26 85 27 3.1 68.24% 53.34%
2006 Vince Young 1st Texas 30 44 28 1.5 60.80% 57.64%
2006 Tavaris Jackson 2nd Alabama
State 24 38 26 1.4 51.40% 58.71%
2007 Brady Quinn 1st Notre Dame 29 95 32 2.9 57.99% 52.12%
2007 Trent Edwards 3rd Stanford 10 36 33 1.09 56.22% 61.25%
2009 Mark Sanchez 1st USC 16 41 16 2.56 64.27% 54.42%
Avg: 21.77 62.08 30.92 2.12 58.32% 56.89%
Breakdown: These 13 players have are QB’s who have shown the consistent ability to be a backup QB for numerous NFL
teams for a sustained period of time. In addition some of these players are former first round draft picks (Boller,
Losman, Leinart, and Sanchez) who have not shown the ability to be a competitive starting QB in the NFL. These 9
players averaged 2 wins less in college than both the tier 1 and tier 2 groups. In fact 5 of these players had less than the
20 win benchmark we established with the top tier group. 6 of these players had a completion percentage less than 60%
while in college. The player stats that really jump out is Kyle Boller, he had only 11 wins in college, a low TD/INT ratio, on
only completed 50% of his passes in college. Yet he was a first round draft pick over players such as Seneca Wallace, and
undrafted Tony Romo. Mark Sanchez was recently added to this tier after is dismal performance the past few seasons
for the New York Jets. Sanchez QB rating this past season was 31st out of 32 NFL starters.

Section Three:
Top and Bottom 10 Breakdowns

Top 10 Wins # of Wins
Chad Pennington 45
Colt McCoy 43
David Greene 42
Andy Dalton 41
John Beck 38
Matt Leinart 37
Dan Lefevour 36
Tim Tebow 35
Pat White 34
Phillip Rivers 34
Breakdown: This is a list of the QB’s who had the most wins college from the entire study. There are 2 top tier players in
this group (Pennington, Rivers). There are also 2 tier-two players (Tebow, Dalton). To be in the top 10 in wins means you
had to have started as a freshman and continued to start almost all of their team’s games through 4 seasons to be
eligible on this list. As stated earlier, a baseline of at least 20 wins for draft eligible players, anything less and teams
should really question as to the reason why a someone who is supposed to be a starting NFL QB, yet can’t lead their
college team to a .500 record in college.
Bottom 10 in Wins # of Wins
Matt Cassel 0
Adrian McPherson 3
Gibran Hamdan 4
Craig Nall 6
A.J. Feely 7
Spergon Wynn 7
Jim Sorgi 7
Brock Osweiler 7
Josh Booty 8
Mike McMahon 8
Casey Bramlet 8
B.J. Symons 8
Breakdown: This is a list of the QB’s who had the lowest number of wins from our complete study. Matt Cassel is the
only player on this list to make the tier-2 level of QB’s. I would be very hesitant to draft any QB, in any round of the NFL
who makes this list. Brock Osweiler the newest addition to this years list, had 7 wins as a starter in college for ASU.

Top 10 TD's Thrown # of TD's
Colt Brennan 131
Tim Rattay 117
Chad Pennington 115
Josh Johnson 113
Colt McCoy 112
Russell Wilson 109
Dan Lefevour 102
Matt Leinart 99
Phillip Rivers 95
Brady Quinn 95
Kliff Kingsbury 95
Breakdown: These are the QB’s who had the highest number of career passing TD’s in college. There are 2 top tier
players (Pennington, Rivers) and 2 tier-three players (Quinn, and Leinart). Though these are all impressive numbers, NFL
should not be blind to the fact that most of these players played in spread, vertical passing offenses which allowed them
the opportunity to put up these numbers. It is recommended that a solid baseline of 40 TD’s be achieved for teams to
consider before drafting the QB.
Bottom 10 in TD's Thrown # of TD's
Matt Cassel 0
Gibran Hamdan 9
Randy Fasani 13
Craig Nall 14
Adrian McPherson 14
A.J. Feely 15
Drew Henson 16
Mike McMahon 18
Sage Rosenfels 19
Mike Kafka 19
Breakdown: These players had the lowest number of career TD’s passes in college from the entire study. Matt Cassel is
the only player in this list to make the 2nd tier list. Most of these players have played sparingly most as backups in the
NFL. I suggest teams stay away from any player who has a limited number of TD passes thrown. A 40 TD baseline
ensures NFL Front offices and coaching staff the opportunity to review a QB’s ability to make different throws in multiple
coverage’s and schemes and gain a more complete understanding of a player’s ability.

Top 10 Least Amount of INT's Thrown # of INT's
Matt Cassel 1
Adrian McPherson 1
Craig Nall 3
Randy Fasani 4
Drew Henson 4
A.J. Feely 6
Cam Newton 7
Alex Smith 8
D.J. Shockley 9
Greg McElroy 10
Breakdown: These players threw the lowest number of INT’s while in college. There are 3-players from the 2nd Tier
section of this report (Cassel, Newton, and Smith). It is a bit of a surprise to see the likes of Smith and McElroy
considering both these players started a few seasons in college and played against quality talent opponents. It seems
reasonable to assume that a player with a low INT total from college will not dictate future NFL success. In fact a QB who
has a low total may be someone who is too cautious with the football and is tentative in throwing the ball into tight
coverage’s.
Bottom 10 in INT's Thrown # of INT's
Luke McCown 65
Jordan Palmer 64
Nathan Enderle 60
Derek Anderson 57
Patrick Ramsay 51
Dan Orlosvsky 51
Chris Redman 51
Carson Palmer 49
Casey Bramlet 48
Kyle Boller 48
Breakdown: A QB who throws a low amount of INT’s does not indicate success in the NFL. But, a QB who throws high
amount interceptions shows a higher chance of not being a franchise QB or even a second tier QB. When evaluating a
QB’s career INT’s, NFL teams should note if a player threw a high amount in their freshman and sophomore years
(Carson Palmer) and if they progressed each season. If they continued to make careless mistakes with the football in
college, they will more than likely continue to make the same mistakes in the NFL.

Top 10 TD/INT Ratio Ratio
Adrian McPherson 14.00
Josh Johnson 8.07
Omar Jacobs 6.45
Alex Smith 5.88
Sam Bradford 5.50
Craig Nall 4.67
Robert Griffin III 4.59
Matt Leinart 4.30
Cam Newton 4.29
Nate Davis 4.11
Breakdown: A high TD/INT ratio indicates a player who was efficient with the football and was able to throw TD’s and
limit the number of INT’s thrown. This list has 3-players in the 2nd tier group (Newton, Bradford, and Smith), along with a
single player in the 3rd-tier group (Leinart). The top tier player’s avg: 2.17 for their TD/INT ratio and for this entire study a
TD/INTO ratio of at least 2.0 should be achieved when considering selecting a QB in the NFL Draft.
Bottom 10 TD/INT Ratio Ratio
Matt Cassel 0.00
Gibran Hamdan 0.64
Sage Rosenfels 0.73
Mike Kafka 0.95
Seneca Wallace 0.96
Mike McMahon 1.06
Charlie Whitehurst 1.07
Trent Edwards 1.09
Matt Moore 1.12
Marques Tuiasosopo 1.14
Breakdown: These players had the lowest TD/INTO ratio, only Matt Cassel and Seneca Wallace made the 2nd tier group
from this entire list. Most of these players were or are backups in the NFL, leading to the conclusion that players, who
fail to achieve at least a 2.0 ratio, are a high risk selection to teams in the draft.

Top 10 Completion % Comp. %
Colt Brennan 70.40%
Colt McCoy 70.33%
Brandon Weeden 69.53%
Josh Johnson 68.26%
Bruce Gradkowski 68.24%
Sam Bradford 67.60%
Keith Null 67.49%
Robert Griffin III 67.11%
Phillip Rivers 67.07%
Andrew Luck 67.01%
Breakdown: These players had the highest completion percentage from the entire study. These are 2 top-tier players
(Schaub, Rivers) and 3 second-tiers players (RGII, Luck, and Bradford). As stated earlier an absolute minimum baseline
for all QB’s who are to be considered by NFL Teams should achieve at least 60% completion rate in college. Players who
play in pro-style offense traditionally have a lower completion rate than players who play in a spread offense. In some
preliminary research QB’s who play in a spread offense typically have a 3-4% higher completion rate than QB’s who play
in a pro-style offense in college football.
Bottom 10 in Completion % Comp. %
Josh Booty 49.30%
Mike McMahon 49.70%
Kyle Boller 50.04%
Derek Anderson 50.70%
Adrian McPherson 50.77%
Randy Fasani 50.90%
Steve Bellisari 50.95%
Tavaris Jackson 51.40%
Gibran Hamdan 51.83%
Sage Rosenfels 52.10%
Breakdown: These players had the lowest completion percentage from the entire 153-player study. No player in this
group made the top tier group and Jackson and Rosenfels are the only playesr to make the third tier group. I strongly
urge all teams to adhere to the rule of at least 60% completion rate for all draftable NFL QB’s.

Section Four:
2013 NFL QB Draft Class

Player School Wins TDs INTS TD/INT RT Comp%
Mitchell Gale Abilene Christian 30 21 7 3.00 60.00%
Matt Scott Arizona 10 33 19 1.74 61.39%
Tyler Wilson Arkansas 14 52 26 2.00 61.50%
Ryan Aplin Arkansas State 25 67 37 1.81 64.42%
Zach Maynard California 10 29 22 1.32 58.63%
Ryan Radcliff Central Michigan 13 65 44 1.48 58.72%
Ross Dausin Colorado State - Pueblo 32 53 20 2.65 62.26%
Sean Renfree Duke 12 51 40 1.28 64.65%
Kyle Padron Eastern Washington 21 58 28 2.07 60.59%
Graham Wilbert Florida Atlantic 4 25 22 1.14 59.09%
EJ Manuel Florida State 25 47 28 1.68 66.89%
Matt Brown Illinois State 27 78 36 2.17 63.74%
James Vandenberg Iowa 11 35 20 1.75 57.09%
Steele Jantz Iowa State 12 23 23 1.00 57.77%
Collin Klein Kansas State 22 30 15 2.00 61.26%
Colby Cameron Louisiana Tech 22 45 13 3.46 63.82%
Zac Dysert Miami (Ohio) 15 73 51 1.43 63.76%
Kyle Frazier Monmouth 14 40 25 1.60 63.71%
Casey Brockman Murray State 18 71 28 2.54 66.76%
Mike Glennon North Carolina State 15 63 31 2.03 60.43%
Landry Jones Oklahoma 38 123 52 2.37 63.58%
Matt McGloin Penn State 13 46 19 2.42 57.38%
Tino Sunseri Pittsburgh 20 49 23 2.13 64.50%
B.J. Daniels South Florida 21 52 39 1.33 57.33%
Matt Barkley Southern California 34 116 48 2.42 64.08%
Brad Sorensen Southern Utah 17 61 27 2.26 65.55%
Ryan Nassib Syracuse 21 70 28 2.50 60.29%
Tyler Bray Tennessee 13 68 28 2.43 58.57%
Seth Doege Texas Tech 14 69 26 2.65 69.00%
Ryan Griffin Tulane 9 56 35 1.60 59.89%
Jordan Rodgers Vanderbilt 13 24 15 1.60 55.89%
Jeff Tuel Washington State 4 33 25 1.32 61.34%
Alex Carder Western Michigan 16 74 36 2.06 63.29%
Geno Smith West Virginia 26 98 21 4.67 67.44%
Breakdown: Using the benchmarks and baselines stated earlier in this report, we can help locate top tier NFL talent.
Geno Smith, Matt Barkley, Ryan Nassib, Tino Sunseri, Landry Jones, Colby Cameron, Matt Brown, EJ Manuel, and Ross
Dausin meet all the requirements such forth in this study. Players that are red flagged are: Matt Scott, Tyler Wilson,
James Vandenberg, Collin Klein, Zac Dysert, Mike Glennon, Brad Sorensen, and Jordan Rodgers.

Conclusion
An organization that is able to acquire a premier QB either by the draft (Brady), free agency (Brees), trade
(Hasselbeck) or as undrafted free agent (Romo), will ultimately have success in the NFL. By drafting the wrong
quarterback, an organization can put their franchise back a step of being competitive in the league. By pinpointing
certain statistical characteristics amongst the top tier NFL quarterback we can help pinpoint what statistical markers
college quarterbacks should achieve before being selected in the NFL Draft.
The research has indicated that a quarterback should have at least 20 college wins as a starter. Using this
benchmark teams would have avoided drafting 40% of the QB’s in this study. Only 2 players (Rodgers and Cutler) had
less than 20 wins in the top-tier group.
A QB should have at least 40 career TD passes thrown, this will allow scouts and coaches the ability to dissect
and determine if they are able to make all the necessary throws. Some of the hardest throws come in the red-zone,
because the field is shortened, space is limited, and accuracy and timing are at needed.
A college QB should have a career completion percentage of at least 60%, a player who is under this percent,
should only be explained if they started as a freshman, but showed continued progress throughout their college career
(Matt Ryan and Carson Palmer). On average our franchise QB’s, dropped 1.13% on their career completion percentage
from college to the NFL. A strong baseline for TD/INT ratio is 2.0 according to our look at the top tier QB in the NFL. A
player who does not achieve this may indicate their tendency to run with the football versus throw the ball (Vick,
Garrard, and Young).
The 2012 draft has a number of talented college QB’s, it is my recommendation that NFL teams pay closer
attention to Luck, RGIII, Cousins, Moore, Keenum, and Weeden. These players meet and exceed all the benchmarks and
baselines using our statistical analysis model.
If you should have any questions/comments/or suggestions please feel free to contact me at any time. I would
be happy to discuss some of the finer details of this report and specific aspects that I believe will help teams in finding
the next elite QB.