Qatar 2022 Facing the FIFA World Cup Climatic and Legacy Challenges
15
Sustainable Cities and Society 14 (2015) 16–30 Contents lists available at ScienceDirect Sustainable Cities and Society journal h om epage: www.elsevier.com/locate/scs Qatar 2022: Facing the FIFA World Cup climatic and legacy challenges Polytimi Sofotasiou ∗ , Benjamin Richard Hughes, John Kaiser Calautit School of Civil Engineering, University of Leeds, Leeds LS2 9JT, UK a r t i c l e i n f o Article history: Available online 28 July 2014 Keywords: Dynamic thermal modelling Stadiums Thermal comfort a b s t r a c t The 2022 World Cup creates great opportunities for the country of Qatar, but also poses significant challenges. In this study the main challenge of maintaining thermal comfort conditions within the football arenas is presented, with respect to the heat stress index (HSI) and the aero-thermal comfort thresholds established for opened stadiums. Potential cooling strategies for delivering tolerant comfort levels are introduced, followed by their functional strengths and limitations for the hot-humid climate of Qatar. An estimation of the cooling load for semi-outdoor stadiums in Qatar is also presented. The results, produced by dynamic thermal modelling, indicated that a load of 115 MW h per game should be at least consumed in order to provide both indoor and outdoor thermal comfort conditions. Finally, the use of solar energy technologies for the generation of electricity and cooling are evaluated, based on their viability beyond the 2022 World Cup event, towards the nation’s targets for sustainability and lasting legacy. © 2014 Elsevier Ltd. All rights reserved. Contents 1. Introduction . . . . . . . . . . . . . . . . . . . . . . . . . . . . . . . . . . . . . . . . . . . . . . . . . . . . . . . . . . . . . . . . . . . . . . . . . . . . . . . . . . . . . . . . . . . . . . . . . . . . . . . . . . . . . . . . . . . . . . . . . . . . . . . . . . . . . . . . . . 17 2. Climate . . . . . . . . . . . . . . . . . . . . . . . . . . . . . . . . . . . . . . . . . . . . . . . . . . . . . . . . . . . . . . . . . . . . . . . . . . . . . . . . . . . . . . . . . . . . . . . . . . . . . . . . . . . . . . . . . . . . . . . . . . . . . . . . . . . . . . . . . . . . . . . . 17 3. Technical requirements for stadiums . . . . . . . . . . . . . . . . . . . . . . . . . . . . . . . . . . . . . . . . . . . . . . . . . . . . . . . . . . . . . . . . . . . . . . . . . . . . . . . . . . . . . . . . . . . . . . . . . . . . . . . . . . . . . . . . 18 3.1. Aero-thermal comfort master plans . . . . . . . . . . . . . . . . . . . . . . . . . . . . . . . . . . . . . . . . . . . . . . . . . . . . . . . . . . . . . . . . . . . . . . . . . . . . . . . . . . . . . . . . . . . . . . . . . . . . . . . . . . 18 3.2. Evaporative cooling strategies . . . . . . . . . . . . . . . . . . . . . . . . . . . . . . . . . . . . . . . . . . . . . . . . . . . . . . . . . . . . . . . . . . . . . . . . . . . . . . . . . . . . . . . . . . . . . . . . . . . . . . . . . . . . . . . . 18 3.2.1. Down-draft evaporative cooling tower . . . . . . . . . . . . . . . . . . . . . . . . . . . . . . . . . . . . . . . . . . . . . . . . . . . . . . . . . . . . . . . . . . . . . . . . . . . . . . . . . . . . . . . . . . . . . 20 3.2.2. Evaporative mist-cooling system . . . . . . . . . . . . . . . . . . . . . . . . . . . . . . . . . . . . . . . . . . . . . . . . . . . . . . . . . . . . . . . . . . . . . . . . . . . . . . . . . . . . . . . . . . . . . . . . . . . 20 3.3. Solar cooling strategies . . . . . . . . . . . . . . . . . . . . . . . . . . . . . . . . . . . . . . . . . . . . . . . . . . . . . . . . . . . . . . . . . . . . . . . . . . . . . . . . . . . . . . . . . . . . . . . . . . . . . . . . . . . . . . . . . . . . . . . 20 3.3.1. Photovoltaic solar cooling . . . . . . . . . . . . . . . . . . . . . . . . . . . . . . . . . . . . . . . . . . . . . . . . . . . . . . . . . . . . . . . . . . . . . . . . . . . . . . . . . . . . . . . . . . . . . . . . . . . . . . . . . . . 20 3.3.2. Solar sorption cooling . . . . . . . . . . . . . . . . . . . . . . . . . . . . . . . . . . . . . . . . . . . . . . . . . . . . . . . . . . . . . . . . . . . . . . . . . . . . . . . . . . . . . . . . . . . . . . . . . . . . . . . . . . . . . . . 21 4. Stadium proposal . . . . . . . . . . . . . . . . . . . . . . . . . . . . . . . . . . . . . . . . . . . . . . . . . . . . . . . . . . . . . . . . . . . . . . . . . . . . . . . . . . . . . . . . . . . . . . . . . . . . . . . . . . . . . . . . . . . . . . . . . . . . . . . . . . . . . 21 4.1. Description of design and technologies . . . . . . . . . . . . . . . . . . . . . . . . . . . . . . . . . . . . . . . . . . . . . . . . . . . . . . . . . . . . . . . . . . . . . . . . . . . . . . . . . . . . . . . . . . . . . . . . . . . . . . 21 4.2. Aero-thermal comfort provision mechanism . . . . . . . . . . . . . . . . . . . . . . . . . . . . . . . . . . . . . . . . . . . . . . . . . . . . . . . . . . . . . . . . . . . . . . . . . . . . . . . . . . . . . . . . . . . . . . . . 21 4.3. Design restrictions . . . . . . . . . . . . . . . . . . . . . . . . . . . . . . . . . . . . . . . . . . . . . . . . . . . . . . . . . . . . . . . . . . . . . . . . . . . . . . . . . . . . . . . . . . . . . . . . . . . . . . . . . . . . . . . . . . . . . . . . . . . . 21 5. Estimation of energy consumption for cooling . . . . . . . . . . . . . . . . . . . . . . . . . . . . . . . . . . . . . . . . . . . . . . . . . . . . . . . . . . . . . . . . . . . . . . . . . . . . . . . . . . . . . . . . . . . . . . . . . . . . . . 22 5.1. Introduction . . . . . . . . . . . . . . . . . . . . . . . . . . . . . . . . . . . . . . . . . . . . . . . . . . . . . . . . . . . . . . . . . . . . . . . . . . . . . . . . . . . . . . . . . . . . . . . . . . . . . . . . . . . . . . . . . . . . . . . . . . . . . . . . . . . 22 5.2. Description of the case study . . . . . . . . . . . . . . . . . . . . . . . . . . . . . . . . . . . . . . . . . . . . . . . . . . . . . . . . . . . . . . . . . . . . . . . . . . . . . . . . . . . . . . . . . . . . . . . . . . . . . . . . . . . . . . . . . 22 5.2.1. Stadium description . . . . . . . . . . . . . . . . . . . . . . . . . . . . . . . . . . . . . . . . . . . . . . . . . . . . . . . . . . . . . . . . . . . . . . . . . . . . . . . . . . . . . . . . . . . . . . . . . . . . . . . . . . . . . . . . . 22 5.2.2. Structural elements data . . . . . . . . . . . . . . . . . . . . . . . . . . . . . . . . . . . . . . . . . . . . . . . . . . . . . . . . . . . . . . . . . . . . . . . . . . . . . . . . . . . . . . . . . . . . . . . . . . . . . . . . . . . . 24 5.3. Thermal analysis parameterisation . . . . . . . . . . . . . . . . . . . . . . . . . . . . . . . . . . . . . . . . . . . . . . . . . . . . . . . . . . . . . . . . . . . . . . . . . . . . . . . . . . . . . . . . . . . . . . . . . . . . . . . . . . . 24 5.3.1. Import design data . . . . . . . . . . . . . . . . . . . . . . . . . . . . . . . . . . . . . . . . . . . . . . . . . . . . . . . . . . . . . . . . . . . . . . . . . . . . . . . . . . . . . . . . . . . . . . . . . . . . . . . . . . . . . . . . . . 24 5.3.2. Climate data . . . . . . . . . . . . . . . . . . . . . . . . . . . . . . . . . . . . . . . . . . . . . . . . . . . . . . . . . . . . . . . . . . . . . . . . . . . . . . . . . . . . . . . . . . . . . . . . . . . . . . . . . . . . . . . . . . . . . . . . . 24 5.3.3. Thermal zone settings . . . . . . . . . . . . . . . . . . . . . . . . . . . . . . . . . . . . . . . . . . . . . . . . . . . . . . . . . . . . . . . . . . . . . . . . . . . . . . . . . . . . . . . . . . . . . . . . . . . . . . . . . . . . . . . 24 5.4. Results and discussion . . . . . . . . . . . . . . . . . . . . . . . . . . . . . . . . . . . . . . . . . . . . . . . . . . . . . . . . . . . . . . . . . . . . . . . . . . . . . . . . . . . . . . . . . . . . . . . . . . . . . . . . . . . . . . . . . . . . . . . . 25 5.5. Research limitations . . . . . . . . . . . . . . . . . . . . . . . . . . . . . . . . . . . . . . . . . . . . . . . . . . . . . . . . . . . . . . . . . . . . . . . . . . . . . . . . . . . . . . . . . . . . . . . . . . . . . . . . . . . . . . . . . . . . . . . . . . 27 ∗ Corresponding author. Tel.: +44 (0)7474181175. E-mail address: [email protected] (P. Sofotasiou). http://dx.doi.org/10.1016/j.scs.2014.07.007 2210-6707/© 2014 Elsevier Ltd. All rights reserved.
-
Upload
mtarnawski -
Category
Documents
-
view
70 -
download
12
description
Qatar 2022 WC Controversy
Transcript of Qatar 2022 Facing the FIFA World Cup Climatic and Legacy Challenges
Q
PS
a
AA
KDST
C
h2
Sustainable Cities and Society 14 (2015) 16–30
Contents lists available at ScienceDirect
Sustainable Cities and Society
journa l h om epage: www.elsev ier .com/ locate /scs
atar 2022: Facing the FIFA World Cup climatic and legacy challenges
olytimi Sofotasiou ∗, Benjamin Richard Hughes, John Kaiser Calautitchool of Civil Engineering, University of Leeds, Leeds LS2 9JT, UK
r t i c l e i n f o
rticle history:vailable online 28 July 2014
eywords:ynamic thermal modellingtadiums
a b s t r a c t
The 2022 World Cup creates great opportunities for the country of Qatar, but also poses significantchallenges. In this study the main challenge of maintaining thermal comfort conditions within the footballarenas is presented, with respect to the heat stress index (HSI) and the aero-thermal comfort thresholdsestablished for opened stadiums. Potential cooling strategies for delivering tolerant comfort levels areintroduced, followed by their functional strengths and limitations for the hot-humid climate of Qatar. An
hermal comfortestimation of the cooling load for semi-outdoor stadiums in Qatar is also presented. The results, producedby dynamic thermal modelling, indicated that a load of 115 MW h per game should be at least consumedin order to provide both indoor and outdoor thermal comfort conditions. Finally, the use of solar energytechnologies for the generation of electricity and cooling are evaluated, based on their viability beyondthe 2022 World Cup event, towards the nation’s targets for sustainability and lasting legacy.
© 2014 Elsevier Ltd. All rights reserved.
ontents
1. Introduction . . . . . . . . . . . . . . . . . . . . . . . . . . . . . . . . . . . . . . . . . . . . . . . . . . . . . . . . . . . . . . . . . . . . . . . . . . . . . . . . . . . . . . . . . . . . . . . . . . . . . . . . . . . . . . . . . . . . . . . . . . . . . . . . . . . . . . . . . . 172. Climate . . . . . . . . . . . . . . . . . . . . . . . . . . . . . . . . . . . . . . . . . . . . . . . . . . . . . . . . . . . . . . . . . . . . . . . . . . . . . . . . . . . . . . . . . . . . . . . . . . . . . . . . . . . . . . . . . . . . . . . . . . . . . . . . . . . . . . . . . . . . . . . . 173. Technical requirements for stadiums . . . . . . . . . . . . . . . . . . . . . . . . . . . . . . . . . . . . . . . . . . . . . . . . . . . . . . . . . . . . . . . . . . . . . . . . . . . . . . . . . . . . . . . . . . . . . . . . . . . . . . . . . . . . . . . . 18
3.1. Aero-thermal comfort master plans . . . . . . . . . . . . . . . . . . . . . . . . . . . . . . . . . . . . . . . . . . . . . . . . . . . . . . . . . . . . . . . . . . . . . . . . . . . . . . . . . . . . . . . . . . . . . . . . . . . . . . . . . . 183.2. Evaporative cooling strategies . . . . . . . . . . . . . . . . . . . . . . . . . . . . . . . . . . . . . . . . . . . . . . . . . . . . . . . . . . . . . . . . . . . . . . . . . . . . . . . . . . . . . . . . . . . . . . . . . . . . . . . . . . . . . . . . 18
3.2.1. Down-draft evaporative cooling tower . . . . . . . . . . . . . . . . . . . . . . . . . . . . . . . . . . . . . . . . . . . . . . . . . . . . . . . . . . . . . . . . . . . . . . . . . . . . . . . . . . . . . . . . . . . . . 203.2.2. Evaporative mist-cooling system . . . . . . . . . . . . . . . . . . . . . . . . . . . . . . . . . . . . . . . . . . . . . . . . . . . . . . . . . . . . . . . . . . . . . . . . . . . . . . . . . . . . . . . . . . . . . . . . . . . 20
3.3. Solar cooling strategies . . . . . . . . . . . . . . . . . . . . . . . . . . . . . . . . . . . . . . . . . . . . . . . . . . . . . . . . . . . . . . . . . . . . . . . . . . . . . . . . . . . . . . . . . . . . . . . . . . . . . . . . . . . . . . . . . . . . . . . 203.3.1. Photovoltaic solar cooling . . . . . . . . . . . . . . . . . . . . . . . . . . . . . . . . . . . . . . . . . . . . . . . . . . . . . . . . . . . . . . . . . . . . . . . . . . . . . . . . . . . . . . . . . . . . . . . . . . . . . . . . . . . 203.3.2. Solar sorption cooling . . . . . . . . . . . . . . . . . . . . . . . . . . . . . . . . . . . . . . . . . . . . . . . . . . . . . . . . . . . . . . . . . . . . . . . . . . . . . . . . . . . . . . . . . . . . . . . . . . . . . . . . . . . . . . . 21
4. Stadium proposal . . . . . . . . . . . . . . . . . . . . . . . . . . . . . . . . . . . . . . . . . . . . . . . . . . . . . . . . . . . . . . . . . . . . . . . . . . . . . . . . . . . . . . . . . . . . . . . . . . . . . . . . . . . . . . . . . . . . . . . . . . . . . . . . . . . . . 214.1. Description of design and technologies . . . . . . . . . . . . . . . . . . . . . . . . . . . . . . . . . . . . . . . . . . . . . . . . . . . . . . . . . . . . . . . . . . . . . . . . . . . . . . . . . . . . . . . . . . . . . . . . . . . . . . 214.2. Aero-thermal comfort provision mechanism . . . . . . . . . . . . . . . . . . . . . . . . . . . . . . . . . . . . . . . . . . . . . . . . . . . . . . . . . . . . . . . . . . . . . . . . . . . . . . . . . . . . . . . . . . . . . . . . 214.3. Design restrictions . . . . . . . . . . . . . . . . . . . . . . . . . . . . . . . . . . . . . . . . . . . . . . . . . . . . . . . . . . . . . . . . . . . . . . . . . . . . . . . . . . . . . . . . . . . . . . . . . . . . . . . . . . . . . . . . . . . . . . . . . . . . 21
5. Estimation of energy consumption for cooling . . . . . . . . . . . . . . . . . . . . . . . . . . . . . . . . . . . . . . . . . . . . . . . . . . . . . . . . . . . . . . . . . . . . . . . . . . . . . . . . . . . . . . . . . . . . . . . . . . . . . . 225.1. Introduction . . . . . . . . . . . . . . . . . . . . . . . . . . . . . . . . . . . . . . . . . . . . . . . . . . . . . . . . . . . . . . . . . . . . . . . . . . . . . . . . . . . . . . . . . . . . . . . . . . . . . . . . . . . . . . . . . . . . . . . . . . . . . . . . . . . 225.2. Description of the case study . . . . . . . . . . . . . . . . . . . . . . . . . . . . . . . . . . . . . . . . . . . . . . . . . . . . . . . . . . . . . . . . . . . . . . . . . . . . . . . . . . . . . . . . . . . . . . . . . . . . . . . . . . . . . . . . . 22
5.2.1. Stadium description . . . . . . . . . . . . . . . . . . . . . . . . . . . . . . . . . . . . . . . . . . . . . . . . . . . . . . . . . . . . . . . . . . . . . . . . . . . . . . . . . . . . . . . . . . . . . . . . . . . . . . . . . . . . . . . . . 225.2.2. Structural elements data . . . . . . . . . . . . . . . . . . . . . . . . . . . . . . . . . . . . . . . . . . . . . . . . . . . . . . . . . . . . . . . . . . . . . . . . . . . . . . . . . . . . . . . . . . . . . . . . . . . . . . . . . . . . 24
5.3. Thermal analysis parameterisation . . . . . . . . . . . . . . . . . . . . . . . . . . . . . . . . . . . . . . . . . . . . . . . . . . . . . . . . . . . . . . . . . . . . . . . . . . . . . . . . . . . . . . . . . . . . . . . . . . . . . . . . . . . 245.3.1. Import design data . . . . . . . . . . . . . . . . . . . . . . . . . . . . . . . . . . . . . . . . . . . . . . . . . . . . . . . . . . . . . . . . . . . . . . . . . . . . . . . . . . . . . . . . . . . . . . . . . . . . . . . . . . . . . . . . . . 24
5.3.2. Climate data . . . . . . . . . . . . . . . . . . . . . . . . . . . . . . . . . . . . . . . . . . . . . . .5.3.3. Thermal zone settings . . . . . . . . . . . . . . . . . . . . . . . . . . . . . . . . . . . . .5.4. Results and discussion . . . . . . . . . . . . . . . . . . . . . . . . . . . . . . . . . . . . . . . . . . . . . .5.5. Research limitations . . . . . . . . . . . . . . . . . . . . . . . . . . . . . . . . . . . . . . . . . . . . . . . .
∗ Corresponding author. Tel.: +44 (0)7474181175.E-mail address: [email protected] (P. Sofotasiou).
ttp://dx.doi.org/10.1016/j.scs.2014.07.007210-6707/© 2014 Elsevier Ltd. All rights reserved.
. . . . . . . . . . . . . . . . . . . . . . . . . . . . . . . . . . . . . . . . . . . . . . . . . . . . . . . . . . . . . . . . . . . . . . . . . . 24 . . . . . . . . . . . . . . . . . . . . . . . . . . . . . . . . . . . . . . . . . . . . . . . . . . . . . . . . . . . . . . . . . . . . . . . . . . 24
. . . . . . . . . . . . . . . . . . . . . . . . . . . . . . . . . . . . . . . . . . . . . . . . . . . . . . . . . . . . . . . . . . . . . . . . . . 25 . . . . . . . . . . . . . . . . . . . . . . . . . . . . . . . . . . . . . . . . . . . . . . . . . . . . . . . . . . . . . . . . . . . . . . . . . . 27

P. Sofotasiou et al. / Sustainable Cities and Society 14 (2015) 16–30 17
5.5.1. Internal uncertainties . . . . . . . . . . . . . . . . . . . . . . . . . . . . . . . . . . . . . . . . . . . . . . . . . . . . . . . . . . . . . . . . . . . . . . . . . . . . . . . . . . . . . . . . . . . . . . . . . . . . . . . . . . . . . . . 275.5.2. External uncertainties . . . . . . . . . . . . . . . . . . . . . . . . . . . . . . . . . . . . . . . . . . . . . . . . . . . . . . . . . . . . . . . . . . . . . . . . . . . . . . . . . . . . . . . . . . . . . . . . . . . . . . . . . . . . . . . 275.5.3. Method uncertainties . . . . . . . . . . . . . . . . . . . . . . . . . . . . . . . . . . . . . . . . . . . . . . . . . . . . . . . . . . . . . . . . . . . . . . . . . . . . . . . . . . . . . . . . . . . . . . . . . . . . . . . . . . . . . . . 27
6. Bidding for carbon neutrality . . . . . . . . . . . . . . . . . . . . . . . . . . . . . . . . . . . . . . . . . . . . . . . . . . . . . . . . . . . . . . . . . . . . . . . . . . . . . . . . . . . . . . . . . . . . . . . . . . . . . . . . . . . . . . . . . . . . . . . . . 276.1. FIFA’s green plan . . . . . . . . . . . . . . . . . . . . . . . . . . . . . . . . . . . . . . . . . . . . . . . . . . . . . . . . . . . . . . . . . . . . . . . . . . . . . . . . . . . . . . . . . . . . . . . . . . . . . . . . . . . . . . . . . . . . . . . . . . . . . . 276.2. Strategies to meet carbon neutrality . . . . . . . . . . . . . . . . . . . . . . . . . . . . . . . . . . . . . . . . . . . . . . . . . . . . . . . . . . . . . . . . . . . . . . . . . . . . . . . . . . . . . . . . . . . . . . . . . . . . . . . . . 276.3. Weather arising restrictions . . . . . . . . . . . . . . . . . . . . . . . . . . . . . . . . . . . . . . . . . . . . . . . . . . . . . . . . . . . . . . . . . . . . . . . . . . . . . . . . . . . . . . . . . . . . . . . . . . . . . . . . . . . . . . . . . . 28
7. Lasting commitment. . . . . . . . . . . . . . . . . . . . . . . . . . . . . . . . . . . . . . . . . . . . . . . . . . . . . . . . . . . . . . . . . . . . . . . . . . . . . . . . . . . . . . . . . . . . . . . . . . . . . . . . . . . . . . . . . . . . . . . . . . . . . . . . . . 287.1. Contribution to local community . . . . . . . . . . . . . . . . . . . . . . . . . . . . . . . . . . . . . . . . . . . . . . . . . . . . . . . . . . . . . . . . . . . . . . . . . . . . . . . . . . . . . . . . . . . . . . . . . . . . . . . . . . . . . 28
7.1.1. Social development . . . . . . . . . . . . . . . . . . . . . . . . . . . . . . . . . . . . . . . . . . . . . . . . . . . . . . . . . . . . . . . . . . . . . . . . . . . . . . . . . . . . . . . . . . . . . . . . . . . . . . . . . . . . . . . . . 287.1.2. Environmental and economic development . . . . . . . . . . . . . . . . . . . . . . . . . . . . . . . . . . . . . . . . . . . . . . . . . . . . . . . . . . . . . . . . . . . . . . . . . . . . . . . . . . . . . . . . 28
7.2. Contribution to broad communities . . . . . . . . . . . . . . . . . . . . . . . . . . . . . . . . . . . . . . . . . . . . . . . . . . . . . . . . . . . . . . . . . . . . . . . . . . . . . . . . . . . . . . . . . . . . . . . . . . . . . . . . . . 288. Conclusions . . . . . . . . . . . . . . . . . . . . . . . . . . . . . . . . . . . . . . . . . . . . . . . . . . . . . . . . . . . . . . . . . . . . . . . . . . . . . . . . . . . . . . . . . . . . . . . . . . . . . . . . . . . . . . . . . . . . . . . . . . . . . . . . . . . . . . . . . . . 28
References . . . . . . . . . . . . . . . . . . . . . . . . . . . . . . . . . . . . . . . . . . . . . . . . . . . . . . . . . . . . . . . . . . . . . . . . . . . . . . . . . . . . . . . . . . . . . . . . . . . . . . . . . . . . . . . . . . . . . . . . . . . . . . . . . . . . . . . . . . . . 29
1
ctMtip
tt2hs(otHhts
blQr1ctccdcm
wcfacomtopobn
& Montain, 2011; Ucuncu, Woolf, & Zikri, 2010).The situation is considered to be more complicated when
assessing the heat stress risk regarding the football players. Exper-imental studies have shown that the probability of placing player’s
. Introduction
Sport is a dynamically growing sector that may successfullyontribute to economic development and profile enhancement ofhe corresponding host county, through various channels (Baade &
atheson, 2004). Sport mega-event organisations may operate forhe benefit of international development, strengthening of urbannfrastructure construction and services, with regard to sustainingrosperity (Ec.europa.eu, 2013).
Qatar, the FIFA’s World Cup 2022 host city, aims to achieve theseargets, as part of the country’s long-term aspirations, based onhe four Pillars of the Qatar National Vision 2030 (Gsdp.gov.qa,011). The nation plans the implementation of social, economic,uman and environmental strategies that will ensure the provi-ion of adequate reserves for future generations, via developmentGsdp.gov.qa, 2011). The World Cup will be a significant milestonen this journey, since it will be the first Middle Eastern coun-ry hosting this important sporting event (Sulayem, O’connor, &assan, 2013). The winning bid, nevertheless, demands from theost county to accelerate the enactment, as well as the implemen-ation of its plans, as far as the research and the constructionalegment of the event are concerned.
Awareness of the successful and on time event’s delivery haseen expressed, due to the limited existing infrastructure and the
arge conceptual design ideas that have been revealed. Althoughatar has gained recognition for its ability to host large scale events,
egarding previous events, such as the FIFA U-20 Football Cup995 (FIFA, 1999), XV Asian Games 2006 and AFC Asian Cup 2011,oncerns have been raised in the media, surrounding the effec-ive implementation of the proposed events, due to its prominentlimatic characteristics. The Qatar Football Association (QFA) hasommitted to deliver, within FIFA’s technical requirements, con-itions that will satisfy both the player and user thermal comfortriteria, by developing cooling technologies classified as environ-ental friendly, thus promoting sustainability (FIFA, 2010).The present study focuses on the various challenges that Qatar
ill confront, particularly related to the provision of comfortonditions in hosting areas, using pioneering environmentallyriendly cooling technologies. The holistic approach of the spatialnd temporal characteristics is presented, followed by analyti-al scientifically based interpretations concerning the attainmentf aero-thermal comfort with technologies that are to be imple-ented within the context of the requirements that FIFA has set and
he commitments that Qatar has made. A preliminary assessmentf the cooling load requirements during the event is also presented,
roduced by dynamic thermal modelling software. The importancef the results will give an overview of the energy load that needs toe either produced from renewable sources or balanced from theational electrical grid as Qatar has committed to deliver a carbonneutral World Cup and a legacy based on sustainable developmentprinciples.
2. Climate
Qatar experiences living conditions under a temperature rangeof 25–46 ◦C during the summer season (Caa.gov.qa, 2013) thatif combined with a relative humidity of up to 100%, can createa sensation of temperature more than 50 ◦C (Patel, 2013). Thesetemperatures greatly exceed the exposure threshold of NationalOceanic and Atmospheric Administration’s (NOAA) heat stressindex, as depicted in Fig. 1. Temperature values of such intensity areextremely dangerous and may cause heat illnesses to people thathave prolonged exposure to direct sunlight (Nws.noaa.gov, 2005).
In an event with an extended duration, such as the World Cup,visitors will be exposed involuntary to the extreme and unprece-dented (for some) temperatures (Maughan et al., 2010). However, ifadequate mitigating measures, including shading and rehydrationare provided, occupants can show a certain tolerance to the adverseenvironmental conditions prevailing in hot climates (Sawka, Leon,
Fig. 1. Heat index chart (Nws.noaa.gov, 2005).
1 e Cities and Society 14 (2015) 16–30
ictntW
pmhspiN
ewcHtlCpaflspc
etefagtodoF
3
tbhbtl8tpfiifmme
mfa2
8 P. Sofotasiou et al. / Sustainabl
ntegrity into danger is extremely high, when exercising in hotlimates, because their core temperature may be increased upo 41.5 ◦C (Brotherhood, 2008). Under harsh playing conditions,ot only their thermoregulatory response is disrupted, but alsoheir exercise performance is compromised (Maughan et al., 2010;
atson, Black, Clark, & Maughan, 2006).Heat stress conditions of such extent have been recorded in
revious World Cup venues organised in semi-hot regions, whereidday kick-off times were rearranged, due to possible imminent
eat risks (FIFA, 2009, 2013a). Similarly, the combination of heattress and strain exercise was proven to be a dominating factor inlayers’ performance disruption during the 2006 World Cup held
n Germany, with the temperature attaining just 30 ◦C (FIFA, 2006;ews.bbc.co.uk, 2006).
Vigorous exercise of more than 30 min, to which players will bexposed, is of concern to the QFA, in order to devise strategies thatill prevent hyperthermia and dehydration; two effects that will be
ompounded by the thermal environment (Maughan et al., 2010;argreaves, 2008). The commonly suggested measure to prevent
he heat-induced effects is acclimatisation that should include ateast 100 min of high interval exercise (Hargreaves, 2008). Worldup teams are given 4 weeks prior to the event, in order to be pre-ared, but even then, they will be disadvantaged compared to thelready weather-familiarised local teams (Maughan et al., 2010). Asar as the players’ comfort levels are concerned, there are no estab-ished and widely approved method that can assess their tolerance,ince it is a multidimensional process dependant on the personalhysical and physiological response rate to the prevailing weatheronditions (Hargreaves, 2008).
The preservation of visitors’ comfort levels, who will not havenough time to allow for acclimatisation, is going to be achieved byhe integration of environmental friendly cooling technologies in allvent-related facilities. These include stadiums, training sites andan zones, which must offer comfortable ambient environment forll occupants (FIFA, 2010). However, these purpose built technolo-ies have to be fully developed and consequently, their efficiencyo be validated for the areas of interest. Irrespective of the modef implementation, the resulting characteristics of the developedesigns and microclimate should adhere to specific requirements inrder to be approved by the International Federation of Associationootball (FIFA).
. Technical requirements for stadiums
The construction promise of delivering 12 football stadiums,hree of which will undergo large-scale renovations, has set aottom-up budgeting of USD 3 billion (FIFA, 2010). On the otherand, the revealed futuristic stadium designs seem to boost theudget’s bottom line even further (Borikar, 2013) that in combina-ion with the controversial future social-related incorporation, hased to speculation that the World Cup will be conducted within
stadiums in total (Borikar, 2013; Khatri, 2013). Nevertheless,he decisive number of the football arenas is independent of theredefined conditions within the sport facilities. The stadium con-guration is the most critical, since it has to combine various
ndependent aspects, in the same design approach, producing aunctional result. The awareness of FIFA, as an event owner, to
aintain a high level profile, is reflected in the technical recom-endations and requirements within the sport facilities that will
nsure the favourable conditions for all occupants.According to FIFA’s official technical guide (FIFA, 2011), the
icroclimate should be expected to provide the optimum com-ort levels that, in point of fact, fluctuate depending on occupant’sctivity (Auliciems & Szokolay, 1997; Djongyang, Tchinda, & Njomo,010). In other words, spectators do not have the same comfort
Fig. 2. Comfort zone with flexible outlines (Szucs, 2004).
limits compared to the intensively exercised players. For thisreason, FIFA requires a temperature range of 20–25.5 ◦C in all hos-pitality areas of the stadium (FIFA, 2011). This temperature barrierapplies for all the areas within a sport facility, including the inte-rior enclosed spaces, the spectator tiers, as well as the playing field.The generic stadium aero-thermal comfort thresholds for specta-tors are based on the revised bioclimatic chart (Szucs, 2004) andare illustrated in Fig. 2.
The chart is representative of the comfort thresholds set forspectators in open stadia and it incorporates four dominant cli-matic parameters; the air temperature, air speed, humidity andsolar radiation (see Szucs, 2004; Szucs, Moreau, & Allard, 2007 forfurther details). When stadium configuration and outdoor environ-mental conditions do not allow the natural air distribution (withinthe temperature thresholds) to be implemented, moderate micro-climate conditions should be produced, by passive or active coolingtechniques (FIFA, 2011).
3.1. Aero-thermal comfort master plans
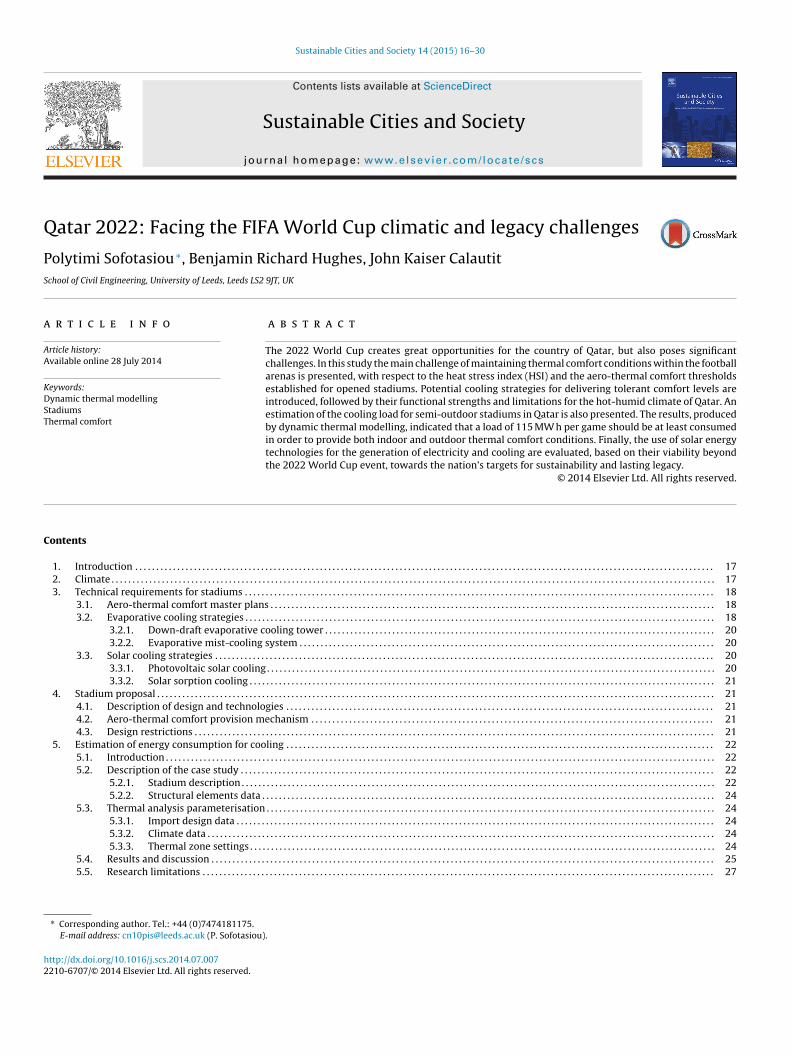
The Qatari stadium design showcase discloses oculus roofconfigurations for the majority of the football arenas. Based onexperimental wind tunnel tests, such a central opening is prefer-able in cooler climates, since it acts as a protector, attenuating theintense airflow beyond the playing field (Szucs, Moreau, & Allard,2009). However, when combined with a peripheral continuousopening between the roof and the upper spectator terrace, leads toincrease of local ventilation rates for the benefit of users in warmclimates (Szucs et al., 2007). A football arena that takes advantageof the aforementioned oculus design features is the Stade de France.Its oculus configuration was assessed under summer weather con-ditions (Bouyer, Vinet, Delpech, & Carre, 2007) and the resultantthermal regions of both comfort and discomfort are depicted inFig. 3.
Despite the natural ventilation and the shading shelter actionsthat these design configurations may offer (John & Sheard, 2000),some areas remain exposed to direct sunlight, due to the pitch’sorientation requirements (FIFA, 2011).
3.2. Evaporative cooling strategies
Evaporative cooling techniques could be used in addition to the
partial control of the air movement and solar radiation by structuralconfigurations, since they are considered to be effective strate-gies for moderating climatic factors in desert climates (Spagnolo &De Dear, 2003). Middle Eastern countries traditionally use passive
P. Sofotasiou et al. / Sustainable Cities and Society 14 (2015) 16–30 19
Fig. 3. Roof configuration of Stade de France (top) (Unknown, 2013) and the thermal sensation map of the Stade de France (bottom) (Bouyer et al., 2007).
Fig. 4. Evaporative cooling technique suggestion for 2022 World Cup stadiums (Laylin, 2013).

20 P. Sofotasiou et al. / Sustainable Cities and Society 14 (2015) 16–30
F glaze(
ciogbttoc
3
apEbm
3
pppsiaa
ig. 5. Schematic section of evaporative cooling tower, showing installation in
Pearlmutter et al., 1996).
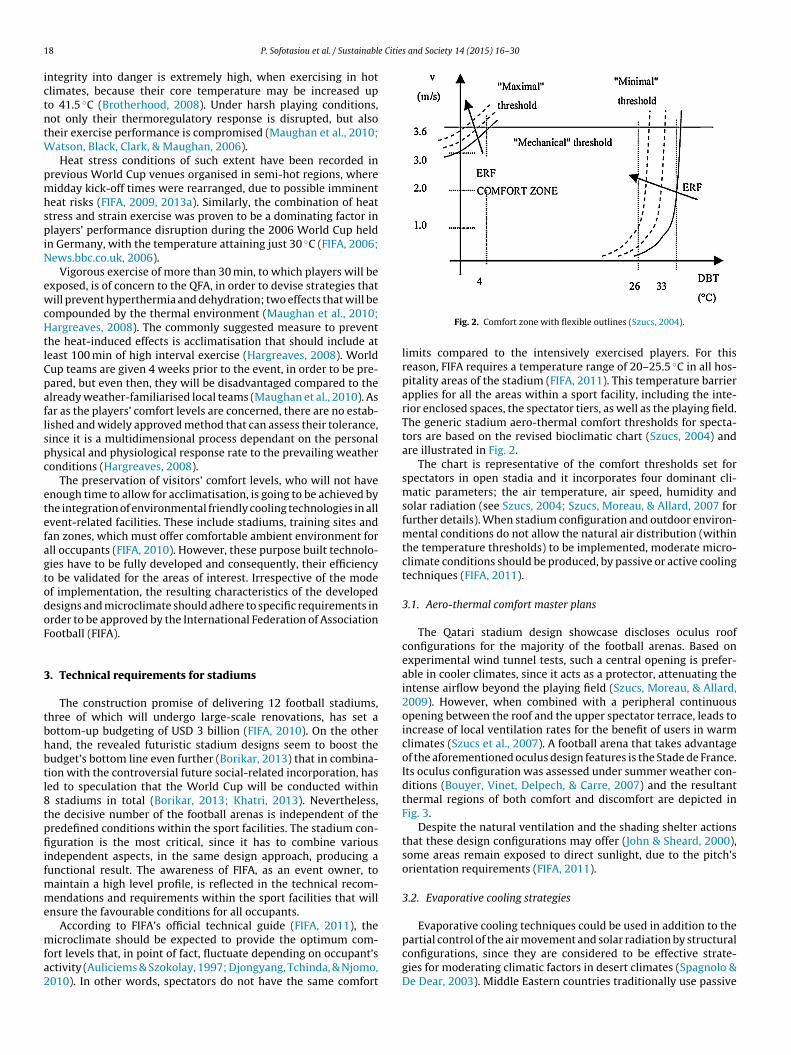
ooling techniques, known as the ‘badgir’ wind tower, to delivernterior cool air, usually by creating an air route over a wetted matr a pool of water (Pearlmutter, Erell, Etzion, Meir, & Di, 1996). Tan-ram Gulf Associates, presented a stadium configuration (Fig. 4)ased on this technique that takes advantage of the Venturi effecto supply tolerant air temperatures under spectators’ tiers and tohe stadium bowl (Laylin, 2013). However, there is little evidencen whether it is functional and if it can successfully deliver thermalomfort within the required thresholds.
.2.1. Down-draft evaporative cooling towerDown-draft evaporative cooling towers (Fig. 5) are recognised
s an economic method, if not the only one, to reduce ambient tem-eratures up to 10 ◦C in semi-outdoor spaces (Pearlmutter, Erell, &tzion, 2008). Their integration in a stadium, nevertheless, shoulde considered at an early design phase, due to their space require-ents for installation.
.2.2. Evaporative mist-cooling systemEvaporative cooling misting fans are already considered to be
art of QFA’s intervention strategies for thermoregulatory stressrevention, in favour of football players (FIFA, 2010). Installation inlaying fields and training sites is deemed necessary and applicable,
ince they are direct active cooling technologies that may reducenstantly the core temperature, protecting players’ performancend health (Maughan et al., 2010). Although this cooling strategyppears to be temporally and locally functional, its water intensityd courtyard and typical temperature profile during summer daytime operation
should not be overlooked (Ezzeldin & Rees, 2013), especially in acountry like Qatar where more than 50% of water resources arisefrom energy-demanding desalination processes (Qatar NationalDevelopmental Strategy, 2011).
3.3. Solar cooling strategies
Solar-powered cooling technologies are the most likely andobjectively applicable to be used in Qatari stadiums, since theycan effectively produce low level air temperatures, in an energy-efficient way (Kalogirou & Florides, 2012). They are alreadydeveloped technologies combining cooling techniques with analternative power source. Examples of solar cooling systems appli-cable in stadium construction are presented in the followingsection.
3.3.1. Photovoltaic solar coolingSolar cooling systems use photovoltaic panels to produce
electricity, subsequently used to power a refrigerated system.Depending on the manufacturing material of the cell, the elec-tricity conversion efficiency may vary from 10% to 15% (Kalogirou& Florides, 2012). The main disadvantage is that for every 1 ◦Cincrease over 25 ◦C, their performance is reduced for about
0.25–0.45% (Nagengast, Hendrickson, & Matthews, 2013), due tothe magnitude of the emitted heat. Summer temperatures in Qatarhave an average value of 33.4 ◦C entailing a reduction in perfor-mance that cannot be overlooked.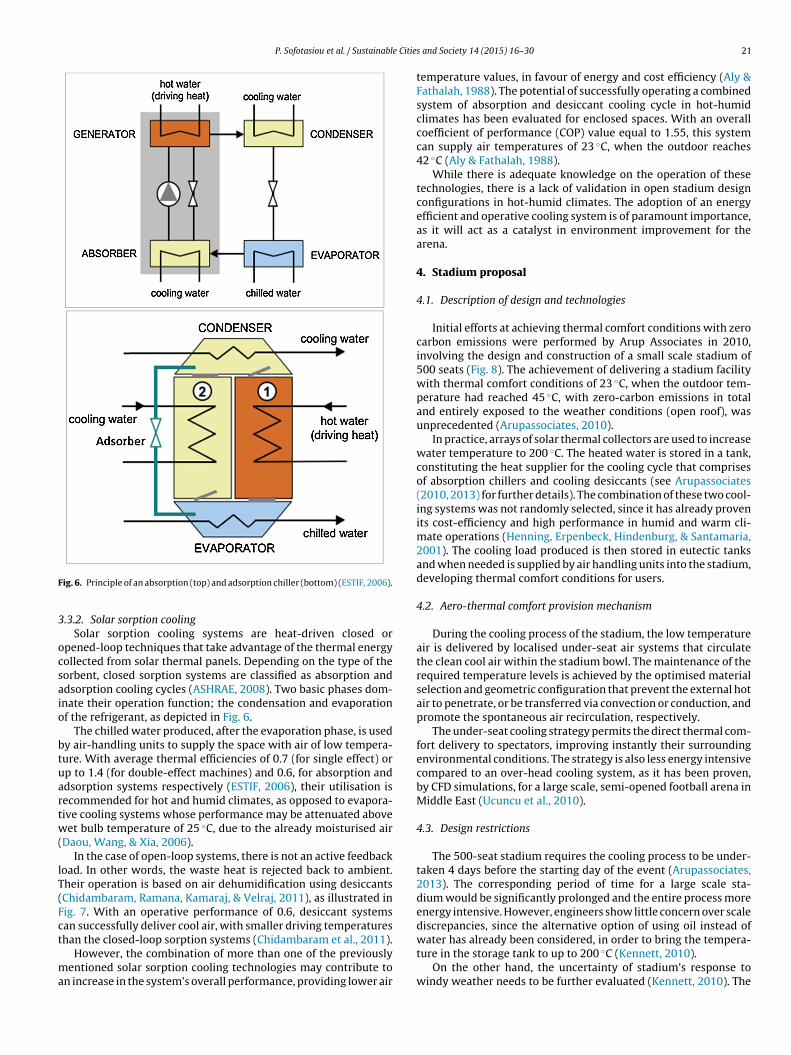
P. Sofotasiou et al. / Sustainable Citie
F
3
ocsaio
btuartw(
lT(Fct
ma
ig. 6. Principle of an absorption (top) and adsorption chiller (bottom) (ESTIF, 2006).
.3.2. Solar sorption coolingSolar sorption cooling systems are heat-driven closed or
pened-loop techniques that take advantage of the thermal energyollected from solar thermal panels. Depending on the type of theorbent, closed sorption systems are classified as absorption anddsorption cooling cycles (ASHRAE, 2008). Two basic phases dom-nate their operation function; the condensation and evaporationf the refrigerant, as depicted in Fig. 6.
The chilled water produced, after the evaporation phase, is usedy air-handling units to supply the space with air of low tempera-ure. With average thermal efficiencies of 0.7 (for single effect) orp to 1.4 (for double-effect machines) and 0.6, for absorption anddsorption systems respectively (ESTIF, 2006), their utilisation isecommended for hot and humid climates, as opposed to evapora-ive cooling systems whose performance may be attenuated aboveet bulb temperature of 25 ◦C, due to the already moisturised air
Daou, Wang, & Xia, 2006).In the case of open-loop systems, there is not an active feedback
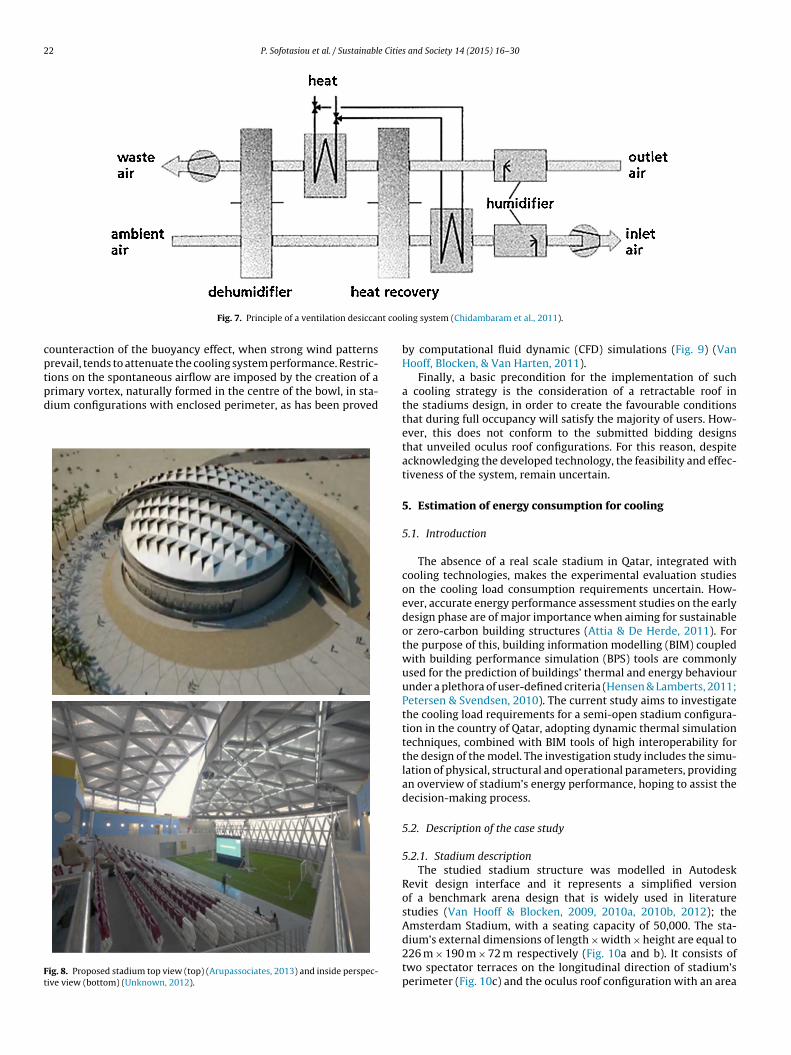
oad. In other words, the waste heat is rejected back to ambient.heir operation is based on air dehumidification using desiccantsChidambaram, Ramana, Kamaraj, & Velraj, 2011), as illustrated inig. 7. With an operative performance of 0.6, desiccant systemsan successfully deliver cool air, with smaller driving temperatures
han the closed-loop sorption systems (Chidambaram et al., 2011).However, the combination of more than one of the previouslyentioned solar sorption cooling technologies may contribute to
n increase in the system’s overall performance, providing lower air
s and Society 14 (2015) 16–30 21
temperature values, in favour of energy and cost efficiency (Aly &Fathalah, 1988). The potential of successfully operating a combinedsystem of absorption and desiccant cooling cycle in hot-humidclimates has been evaluated for enclosed spaces. With an overallcoefficient of performance (COP) value equal to 1.55, this systemcan supply air temperatures of 23 ◦C, when the outdoor reaches42 ◦C (Aly & Fathalah, 1988).
While there is adequate knowledge on the operation of thesetechnologies, there is a lack of validation in open stadium designconfigurations in hot-humid climates. The adoption of an energyefficient and operative cooling system is of paramount importance,as it will act as a catalyst in environment improvement for thearena.
4. Stadium proposal
4.1. Description of design and technologies
Initial efforts at achieving thermal comfort conditions with zerocarbon emissions were performed by Arup Associates in 2010,involving the design and construction of a small scale stadium of500 seats (Fig. 8). The achievement of delivering a stadium facilitywith thermal comfort conditions of 23 ◦C, when the outdoor tem-perature had reached 45 ◦C, with zero-carbon emissions in totaland entirely exposed to the weather conditions (open roof), wasunprecedented (Arupassociates, 2010).
In practice, arrays of solar thermal collectors are used to increasewater temperature to 200 ◦C. The heated water is stored in a tank,constituting the heat supplier for the cooling cycle that comprisesof absorption chillers and cooling desiccants (see Arupassociates(2010, 2013) for further details). The combination of these two cool-ing systems was not randomly selected, since it has already provenits cost-efficiency and high performance in humid and warm cli-mate operations (Henning, Erpenbeck, Hindenburg, & Santamaria,2001). The cooling load produced is then stored in eutectic tanksand when needed is supplied by air handling units into the stadium,developing thermal comfort conditions for users.
4.2. Aero-thermal comfort provision mechanism
During the cooling process of the stadium, the low temperatureair is delivered by localised under-seat air systems that circulatethe clean cool air within the stadium bowl. The maintenance of therequired temperature levels is achieved by the optimised materialselection and geometric configuration that prevent the external hotair to penetrate, or be transferred via convection or conduction, andpromote the spontaneous air recirculation, respectively.
The under-seat cooling strategy permits the direct thermal com-fort delivery to spectators, improving instantly their surroundingenvironmental conditions. The strategy is also less energy intensivecompared to an over-head cooling system, as it has been proven,by CFD simulations, for a large scale, semi-opened football arena inMiddle East (Ucuncu et al., 2010).
4.3. Design restrictions
The 500-seat stadium requires the cooling process to be under-taken 4 days before the starting day of the event (Arupassociates,2013). The corresponding period of time for a large scale sta-dium would be significantly prolonged and the entire process moreenergy intensive. However, engineers show little concern over scalediscrepancies, since the alternative option of using oil instead of
water has already been considered, in order to bring the tempera-ture in the storage tank to up to 200 ◦C (Kennett, 2010).On the other hand, the uncertainty of stadium’s response towindy weather needs to be further evaluated (Kennett, 2010). The
22 P. Sofotasiou et al. / Sustainable Cities and Society 14 (2015) 16–30
t coo
cptpd
Ft
Fig. 7. Principle of a ventilation desiccan
ounteraction of the buoyancy effect, when strong wind patternsrevail, tends to attenuate the cooling system performance. Restric-
ions on the spontaneous airflow are imposed by the creation of arimary vortex, naturally formed in the centre of the bowl, in sta-ium configurations with enclosed perimeter, as has been provedig. 8. Proposed stadium top view (top) (Arupassociates, 2013) and inside perspec-ive view (bottom) (Unknown, 2012).
ling system (Chidambaram et al., 2011).
by computational fluid dynamic (CFD) simulations (Fig. 9) (VanHooff, Blocken, & Van Harten, 2011).
Finally, a basic precondition for the implementation of sucha cooling strategy is the consideration of a retractable roof inthe stadiums design, in order to create the favourable conditionsthat during full occupancy will satisfy the majority of users. How-ever, this does not conform to the submitted bidding designsthat unveiled oculus roof configurations. For this reason, despiteacknowledging the developed technology, the feasibility and effec-tiveness of the system, remain uncertain.
5. Estimation of energy consumption for cooling
5.1. Introduction
The absence of a real scale stadium in Qatar, integrated withcooling technologies, makes the experimental evaluation studieson the cooling load consumption requirements uncertain. How-ever, accurate energy performance assessment studies on the earlydesign phase are of major importance when aiming for sustainableor zero-carbon building structures (Attia & De Herde, 2011). Forthe purpose of this, building information modelling (BIM) coupledwith building performance simulation (BPS) tools are commonlyused for the prediction of buildings’ thermal and energy behaviourunder a plethora of user-defined criteria (Hensen & Lamberts, 2011;Petersen & Svendsen, 2010). The current study aims to investigatethe cooling load requirements for a semi-open stadium configura-tion in the country of Qatar, adopting dynamic thermal simulationtechniques, combined with BIM tools of high interoperability forthe design of the model. The investigation study includes the simu-lation of physical, structural and operational parameters, providingan overview of stadium’s energy performance, hoping to assist thedecision-making process.
5.2. Description of the case study
5.2.1. Stadium descriptionThe studied stadium structure was modelled in Autodesk
Revit design interface and it represents a simplified versionof a benchmark arena design that is widely used in literaturestudies (Van Hooff & Blocken, 2009, 2010a, 2010b, 2012); theAmsterdam Stadium, with a seating capacity of 50,000. The sta-
dium’s external dimensions of length × width × height are equal to226 m × 190 m × 72 m respectively (Fig. 10a and b). It consists oftwo spectator terraces on the longitudinal direction of stadium’sperimeter (Fig. 10c) and the oculus roof configuration with an area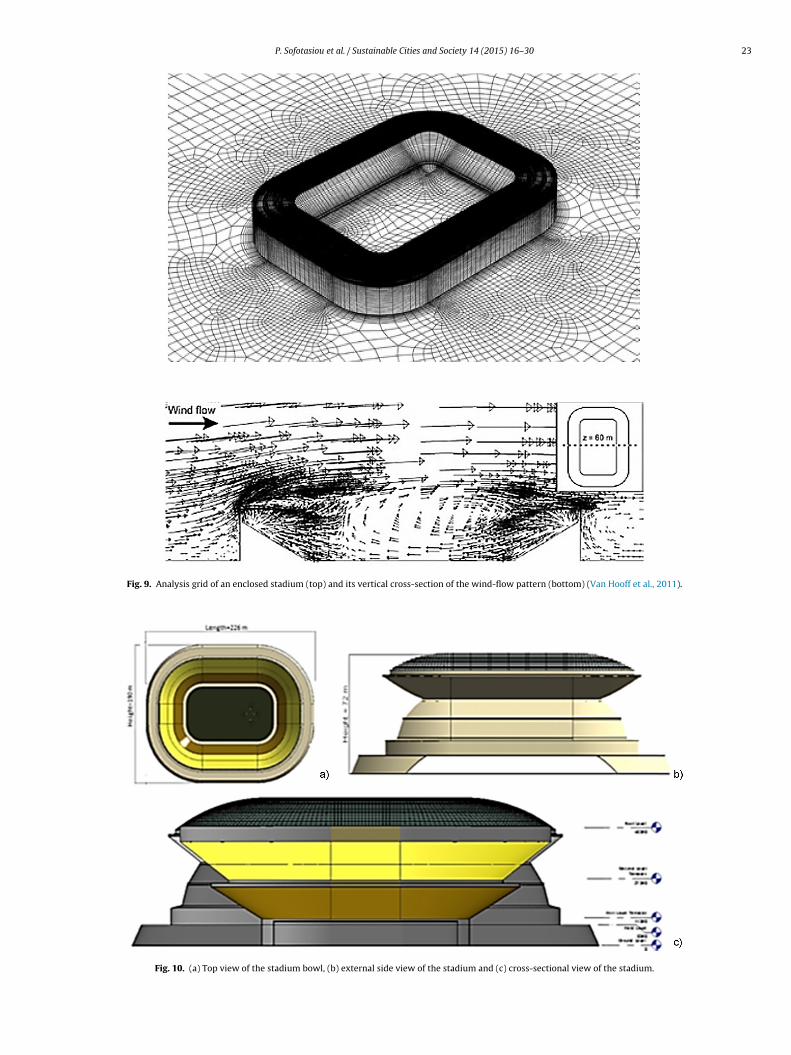
P. Sofotasiou et al. / Sustainable Cities and Society 14 (2015) 16–30 23
Fig. 9. Analysis grid of an enclosed stadium (top) and its vertical cross-section of the wind-flow pattern (bottom) (Van Hooff et al., 2011).
Fig. 10. (a) Top view of the stadium bowl, (b) external side view of the stadium and (c) cross-sectional view of the stadium.
24 P. Sofotasiou et al. / Sustainable Cities and Society 14 (2015) 16–30
Table 1Thermal properties of the selected structural elements that consist the stadium envelope.
Structural element Exterior walls Spectator tiers Roof Slab
Structural material Insulated metal sheets Concrete slab + plastic seat Translucent polycarbonate sheets Concrete slabU-value (W/m2 K) 0.55 3.0 2.1 0.88Admittance (W/m2 K) 1.0 5.2 2.0 6.0Solar absorption (0–1) 0.5 0.77 0.6 0.467Transmittance (0–1) 0 0 0.4 0Total thickness (mm) 75 100 980 400
Table 2Zonal division of the internal and external air conditioned areas of the stadium.
Thermal zone Description Level Volume (m3) Max. occupant number
1Internal
Facility area Ground 143,032 20,0002 Facility area First 57,127 10,000
GroFirsGro
oc
5
ftttPam
5
5
urFoEam
pwct
3External
Spectators’ tiers
4 Spectators’ tiers
5 Playing field
f 4400 m2 represents the only opening that was created for theurrent thermal analysis.
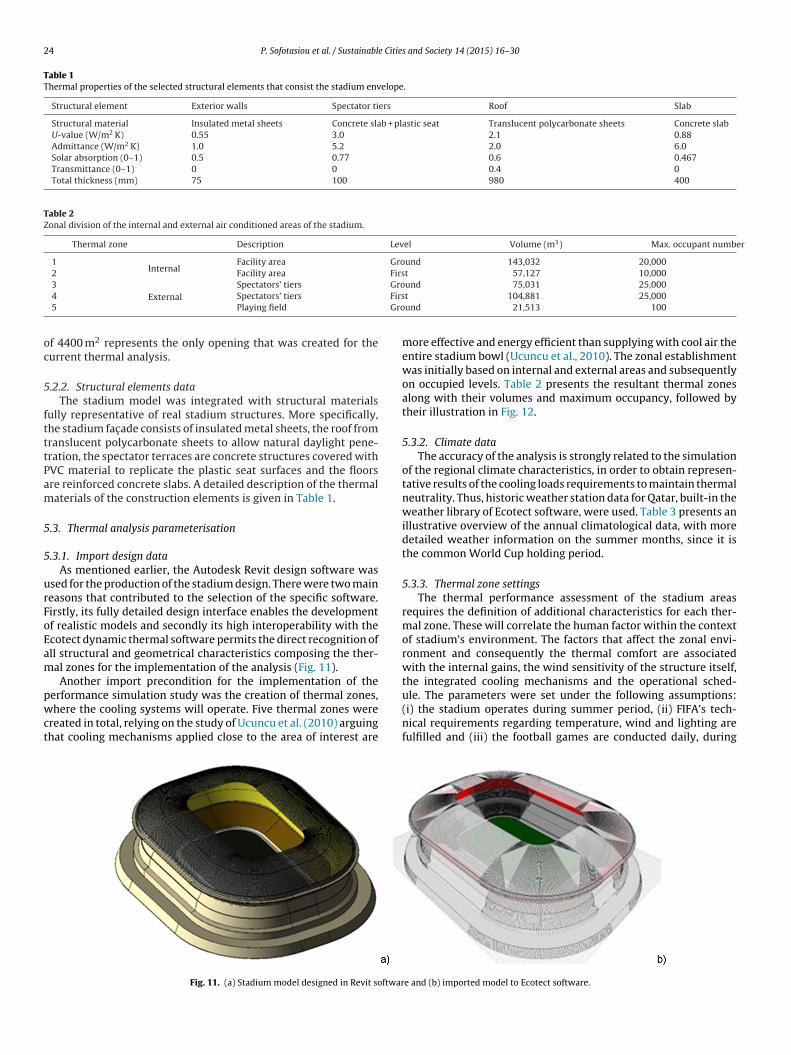
.2.2. Structural elements dataThe stadium model was integrated with structural materials
ully representative of real stadium structures. More specifically,he stadium fac ade consists of insulated metal sheets, the roof fromranslucent polycarbonate sheets to allow natural daylight pene-ration, the spectator terraces are concrete structures covered withVC material to replicate the plastic seat surfaces and the floorsre reinforced concrete slabs. A detailed description of the thermalaterials of the construction elements is given in Table 1.
.3. Thermal analysis parameterisation
.3.1. Import design dataAs mentioned earlier, the Autodesk Revit design software was
sed for the production of the stadium design. There were two maineasons that contributed to the selection of the specific software.irstly, its fully detailed design interface enables the developmentf realistic models and secondly its high interoperability with thecotect dynamic thermal software permits the direct recognition ofll structural and geometrical characteristics composing the ther-al zones for the implementation of the analysis (Fig. 11).Another import precondition for the implementation of the
erformance simulation study was the creation of thermal zones,here the cooling systems will operate. Five thermal zones were
reated in total, relying on the study of Ucuncu et al. (2010) arguinghat cooling mechanisms applied close to the area of interest are
Fig. 11. (a) Stadium model designed in Revit softwar
und 75,031 25,000t 104,881 25,000und 21,513 100
more effective and energy efficient than supplying with cool air theentire stadium bowl (Ucuncu et al., 2010). The zonal establishmentwas initially based on internal and external areas and subsequentlyon occupied levels. Table 2 presents the resultant thermal zonesalong with their volumes and maximum occupancy, followed bytheir illustration in Fig. 12.
5.3.2. Climate dataThe accuracy of the analysis is strongly related to the simulation
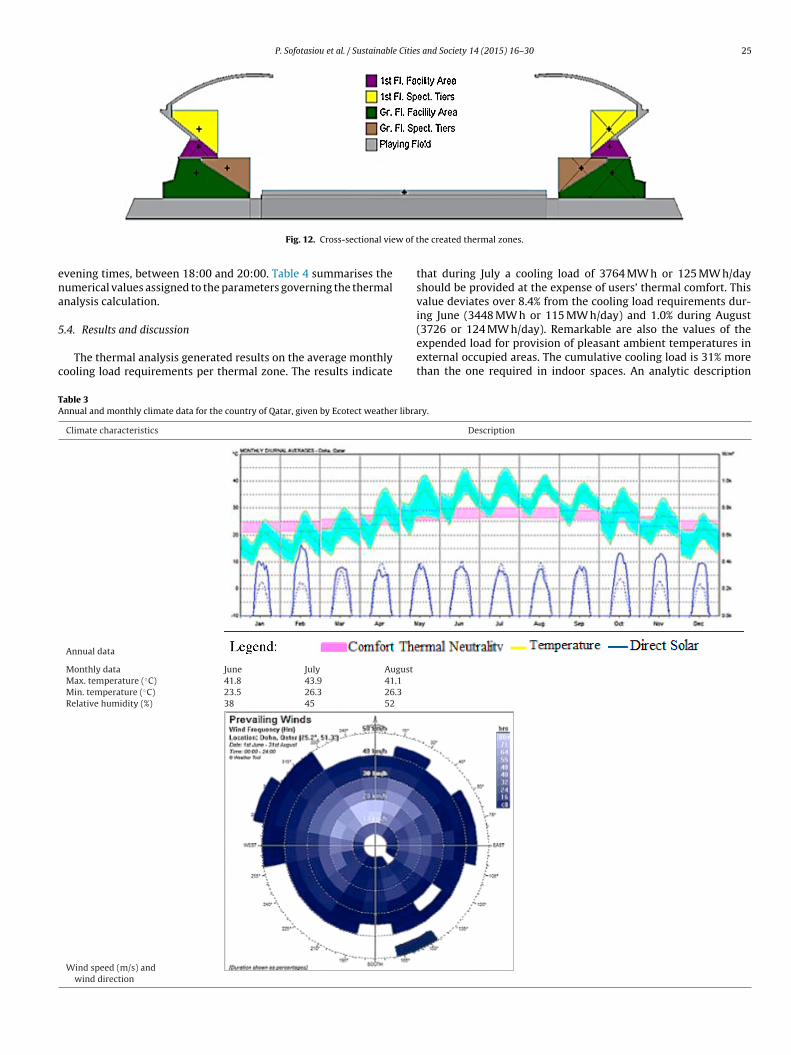
of the regional climate characteristics, in order to obtain represen-tative results of the cooling loads requirements to maintain thermalneutrality. Thus, historic weather station data for Qatar, built-in theweather library of Ecotect software, were used. Table 3 presents anillustrative overview of the annual climatological data, with moredetailed weather information on the summer months, since it isthe common World Cup holding period.
5.3.3. Thermal zone settingsThe thermal performance assessment of the stadium areas
requires the definition of additional characteristics for each ther-mal zone. These will correlate the human factor within the contextof stadium’s environment. The factors that affect the zonal envi-ronment and consequently the thermal comfort are associatedwith the internal gains, the wind sensitivity of the structure itself,the integrated cooling mechanisms and the operational sched-
ule. The parameters were set under the following assumptions:(i) the stadium operates during summer period, (ii) FIFA’s tech-nical requirements regarding temperature, wind and lighting arefulfilled and (iii) the football games are conducted daily, duringe and (b) imported model to Ecotect software.
P. Sofotasiou et al. / Sustainable Cities and Society 14 (2015) 16–30 25
w of t
ena
5
c
TA
Fig. 12. Cross-sectional vie
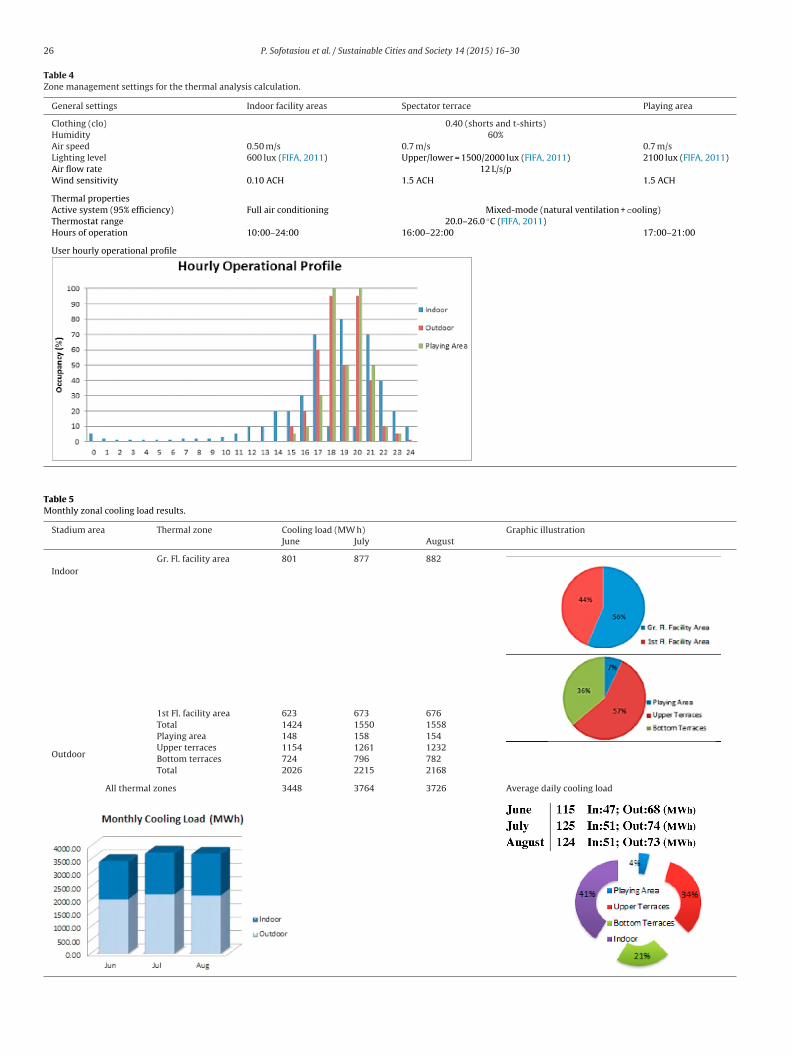
vening times, between 18:00 and 20:00. Table 4 summarises theumerical values assigned to the parameters governing the thermalnalysis calculation.
.4. Results and discussion
The thermal analysis generated results on the average monthlyooling load requirements per thermal zone. The results indicate
able 3nnual and monthly climate data for the country of Qatar, given by Ecotect weather libra
Climate characteristics
Annual data
Monthly data June July AugustMax. temperature (◦C) 41.8 43.9 41.1Min. temperature (◦C) 23.5 26.3 26.3Relative humidity (%) 38 45 52
Wind speed (m/s) andwind direction
he created thermal zones.
that during July a cooling load of 3764 MW h or 125 MW h/dayshould be provided at the expense of users’ thermal comfort. Thisvalue deviates over 8.4% from the cooling load requirements dur-ing June (3448 MW h or 115 MW h/day) and 1.0% during August
(3726 or 124 MW h/day). Remarkable are also the values of theexpended load for provision of pleasant ambient temperatures inexternal occupied areas. The cumulative cooling load is 31% morethan the one required in indoor spaces. An analytic descriptionry.
Description
26 P. Sofotasiou et al. / Sustainable Cities and Society 14 (2015) 16–30
Table 4Zone management settings for the thermal analysis calculation.
General settings Indoor facility areas Spectator terrace Playing area
Clothing (clo) 0.40 (shorts and t-shirts)Humidity 60%Air speed 0.50 m/s 0.7 m/s 0.7 m/sLighting level 600 lux (FIFA, 2011) Upper/lower = 1500/2000 lux (FIFA, 2011) 2100 lux (FIFA, 2011)Air flow rate 12 L/s/pWind sensitivity 0.10 ACH 1.5 ACH 1.5 ACH
Thermal propertiesActive system (95% efficiency) Full air conditioning Mixed-mode (natural ventilation + cooling)Thermostat range 20.0–26.0 ◦C (FIFA, 2011)Hours of operation 10:00–24:00 16:00–22:00 17:00–21:00
User hourly operational profile
Table 5Monthly zonal cooling load results.
Stadium area Thermal zone Cooling load (MW h) Graphic illustrationJune July August
IndoorGr. Fl. facility area 801 877 882
1st Fl. facility area 623 673 676Total 1424 1550 1558
Outdoor
Playing area 148 158 154Upper terraces 1154 1261 1232Bottom terraces 724 796 782Total 2026 2215 2168
All thermal zones 3448 3764 3726 Average daily cooling load
P. Sofotasiou et al. / Sustainable Cities and Society 14 (2015) 16–30 27
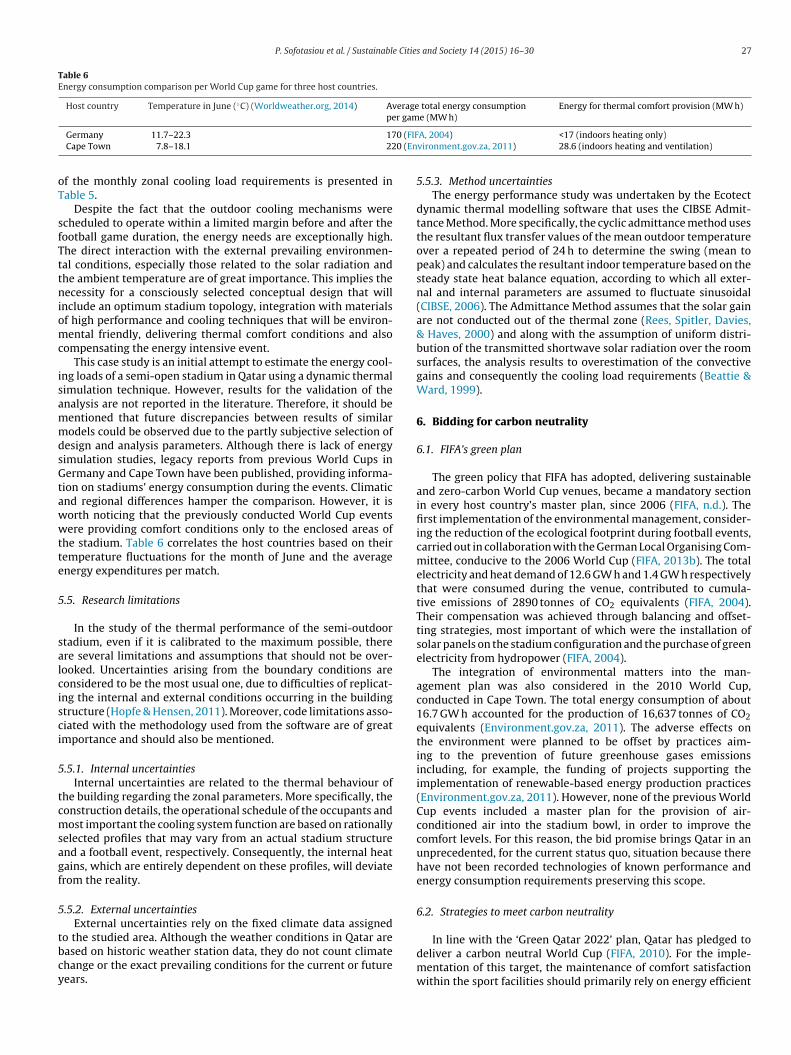
Table 6Energy consumption comparison per World Cup game for three host countries.
Host country Temperature in June (◦C) (Worldweather.org, 2014) Average total energy consumptionper game (MW h)
Energy for thermal comfort provision (MW h)
0 (FIF0 (En
oT
sfTttniomc
isammdsGtawwtte
5
salcisci
5
tcmsagf
5
tbcy
Germany 11.7–22.3 17Cape Town 7.8–18.1 22
f the monthly zonal cooling load requirements is presented inable 5.
Despite the fact that the outdoor cooling mechanisms werecheduled to operate within a limited margin before and after theootball game duration, the energy needs are exceptionally high.he direct interaction with the external prevailing environmen-al conditions, especially those related to the solar radiation andhe ambient temperature are of great importance. This implies theecessity for a consciously selected conceptual design that will
nclude an optimum stadium topology, integration with materialsf high performance and cooling techniques that will be environ-ental friendly, delivering thermal comfort conditions and also
ompensating the energy intensive event.This case study is an initial attempt to estimate the energy cool-
ng loads of a semi-open stadium in Qatar using a dynamic thermalimulation technique. However, results for the validation of thenalysis are not reported in the literature. Therefore, it should beentioned that future discrepancies between results of similarodels could be observed due to the partly subjective selection of
esign and analysis parameters. Although there is lack of energyimulation studies, legacy reports from previous World Cups inermany and Cape Town have been published, providing informa-
ion on stadiums’ energy consumption during the events. Climaticnd regional differences hamper the comparison. However, it isorth noticing that the previously conducted World Cup eventsere providing comfort conditions only to the enclosed areas of
he stadium. Table 6 correlates the host countries based on theiremperature fluctuations for the month of June and the averagenergy expenditures per match.
.5. Research limitations
In the study of the thermal performance of the semi-outdoortadium, even if it is calibrated to the maximum possible, therere several limitations and assumptions that should not be over-ooked. Uncertainties arising from the boundary conditions areonsidered to be the most usual one, due to difficulties of replicat-ng the internal and external conditions occurring in the buildingtructure (Hopfe & Hensen, 2011). Moreover, code limitations asso-iated with the methodology used from the software are of greatmportance and should also be mentioned.
.5.1. Internal uncertaintiesInternal uncertainties are related to the thermal behaviour of
he building regarding the zonal parameters. More specifically, theonstruction details, the operational schedule of the occupants andost important the cooling system function are based on rationally
elected profiles that may vary from an actual stadium structurend a football event, respectively. Consequently, the internal heatains, which are entirely dependent on these profiles, will deviaterom the reality.
.5.2. External uncertaintiesExternal uncertainties rely on the fixed climate data assigned
o the studied area. Although the weather conditions in Qatar areased on historic weather station data, they do not count climatehange or the exact prevailing conditions for the current or futureears.
A, 2004) <17 (indoors heating only)vironment.gov.za, 2011) 28.6 (indoors heating and ventilation)
5.5.3. Method uncertaintiesThe energy performance study was undertaken by the Ecotect
dynamic thermal modelling software that uses the CIBSE Admit-tance Method. More specifically, the cyclic admittance method usesthe resultant flux transfer values of the mean outdoor temperatureover a repeated period of 24 h to determine the swing (mean topeak) and calculates the resultant indoor temperature based on thesteady state heat balance equation, according to which all exter-nal and internal parameters are assumed to fluctuate sinusoidal(CIBSE, 2006). The Admittance Method assumes that the solar gainare not conducted out of the thermal zone (Rees, Spitler, Davies,& Haves, 2000) and along with the assumption of uniform distri-bution of the transmitted shortwave solar radiation over the roomsurfaces, the analysis results to overestimation of the convectivegains and consequently the cooling load requirements (Beattie &Ward, 1999).
6. Bidding for carbon neutrality
6.1. FIFA’s green plan
The green policy that FIFA has adopted, delivering sustainableand zero-carbon World Cup venues, became a mandatory sectionin every host country’s master plan, since 2006 (FIFA, n.d.). Thefirst implementation of the environmental management, consider-ing the reduction of the ecological footprint during football events,carried out in collaboration with the German Local Organising Com-mittee, conducive to the 2006 World Cup (FIFA, 2013b). The totalelectricity and heat demand of 12.6 GW h and 1.4 GW h respectivelythat were consumed during the venue, contributed to cumula-tive emissions of 2890 tonnes of CO2 equivalents (FIFA, 2004).Their compensation was achieved through balancing and offset-ting strategies, most important of which were the installation ofsolar panels on the stadium configuration and the purchase of greenelectricity from hydropower (FIFA, 2004).
The integration of environmental matters into the man-agement plan was also considered in the 2010 World Cup,conducted in Cape Town. The total energy consumption of about16.7 GW h accounted for the production of 16,637 tonnes of CO2equivalents (Environment.gov.za, 2011). The adverse effects onthe environment were planned to be offset by practices aim-ing to the prevention of future greenhouse gases emissionsincluding, for example, the funding of projects supporting theimplementation of renewable-based energy production practices(Environment.gov.za, 2011). However, none of the previous WorldCup events included a master plan for the provision of air-conditioned air into the stadium bowl, in order to improve thecomfort levels. For this reason, the bid promise brings Qatar in anunprecedented, for the current status quo, situation because therehave not been recorded technologies of known performance andenergy consumption requirements preserving this scope.
6.2. Strategies to meet carbon neutrality
In line with the ‘Green Qatar 2022’ plan, Qatar has pledged todeliver a carbon neutral World Cup (FIFA, 2010). For the imple-mentation of this target, the maintenance of comfort satisfactionwithin the sport facilities should primarily rely on energy efficient
28 P. Sofotasiou et al. / Sustainable Citie
F
srcace
spoebises
aocwTdae
6
etewbti(f
7
m2ma
8. Conclusions
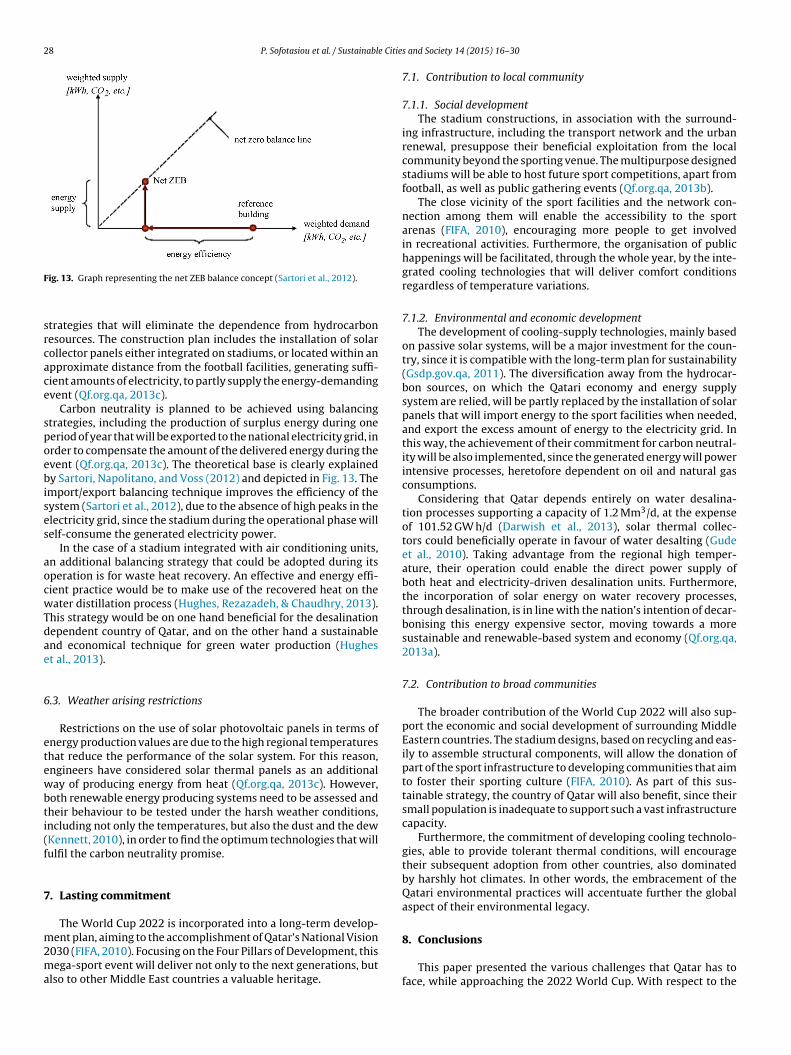
ig. 13. Graph representing the net ZEB balance concept (Sartori et al., 2012).
trategies that will eliminate the dependence from hydrocarbonesources. The construction plan includes the installation of solarollector panels either integrated on stadiums, or located within anpproximate distance from the football facilities, generating suffi-ient amounts of electricity, to partly supply the energy-demandingvent (Qf.org.qa, 2013c).
Carbon neutrality is planned to be achieved using balancingtrategies, including the production of surplus energy during oneeriod of year that will be exported to the national electricity grid, inrder to compensate the amount of the delivered energy during thevent (Qf.org.qa, 2013c). The theoretical base is clearly explainedy Sartori, Napolitano, and Voss (2012) and depicted in Fig. 13. The
mport/export balancing technique improves the efficiency of theystem (Sartori et al., 2012), due to the absence of high peaks in thelectricity grid, since the stadium during the operational phase willelf-consume the generated electricity power.
In the case of a stadium integrated with air conditioning units,n additional balancing strategy that could be adopted during itsperation is for waste heat recovery. An effective and energy effi-ient practice would be to make use of the recovered heat on theater distillation process (Hughes, Rezazadeh, & Chaudhry, 2013).
his strategy would be on one hand beneficial for the desalinationependent country of Qatar, and on the other hand a sustainablend economical technique for green water production (Hughest al., 2013).
.3. Weather arising restrictions
Restrictions on the use of solar photovoltaic panels in terms ofnergy production values are due to the high regional temperatureshat reduce the performance of the solar system. For this reason,ngineers have considered solar thermal panels as an additionalay of producing energy from heat (Qf.org.qa, 2013c). However,
oth renewable energy producing systems need to be assessed andheir behaviour to be tested under the harsh weather conditions,ncluding not only the temperatures, but also the dust and the dewKennett, 2010), in order to find the optimum technologies that willulfil the carbon neutrality promise.
. Lasting commitment
The World Cup 2022 is incorporated into a long-term develop-ent plan, aiming to the accomplishment of Qatar’s National Vision
030 (FIFA, 2010). Focusing on the Four Pillars of Development, thisega-sport event will deliver not only to the next generations, but
lso to other Middle East countries a valuable heritage.
s and Society 14 (2015) 16–30
7.1. Contribution to local community
7.1.1. Social developmentThe stadium constructions, in association with the surround-
ing infrastructure, including the transport network and the urbanrenewal, presuppose their beneficial exploitation from the localcommunity beyond the sporting venue. The multipurpose designedstadiums will be able to host future sport competitions, apart fromfootball, as well as public gathering events (Qf.org.qa, 2013b).
The close vicinity of the sport facilities and the network con-nection among them will enable the accessibility to the sportarenas (FIFA, 2010), encouraging more people to get involvedin recreational activities. Furthermore, the organisation of publichappenings will be facilitated, through the whole year, by the inte-grated cooling technologies that will deliver comfort conditionsregardless of temperature variations.
7.1.2. Environmental and economic developmentThe development of cooling-supply technologies, mainly based
on passive solar systems, will be a major investment for the coun-try, since it is compatible with the long-term plan for sustainability(Gsdp.gov.qa, 2011). The diversification away from the hydrocar-bon sources, on which the Qatari economy and energy supplysystem are relied, will be partly replaced by the installation of solarpanels that will import energy to the sport facilities when needed,and export the excess amount of energy to the electricity grid. Inthis way, the achievement of their commitment for carbon neutral-ity will be also implemented, since the generated energy will powerintensive processes, heretofore dependent on oil and natural gasconsumptions.
Considering that Qatar depends entirely on water desalina-tion processes supporting a capacity of 1.2 Mm3/d, at the expenseof 101.52 GW h/d (Darwish et al., 2013), solar thermal collec-tors could beneficially operate in favour of water desalting (Gudeet al., 2010). Taking advantage from the regional high temper-ature, their operation could enable the direct power supply ofboth heat and electricity-driven desalination units. Furthermore,the incorporation of solar energy on water recovery processes,through desalination, is in line with the nation’s intention of decar-bonising this energy expensive sector, moving towards a moresustainable and renewable-based system and economy (Qf.org.qa,2013a).
7.2. Contribution to broad communities
The broader contribution of the World Cup 2022 will also sup-port the economic and social development of surrounding MiddleEastern countries. The stadium designs, based on recycling and eas-ily to assemble structural components, will allow the donation ofpart of the sport infrastructure to developing communities that aimto foster their sporting culture (FIFA, 2010). As part of this sus-tainable strategy, the country of Qatar will also benefit, since theirsmall population is inadequate to support such a vast infrastructurecapacity.
Furthermore, the commitment of developing cooling technolo-gies, able to provide tolerant thermal conditions, will encouragetheir subsequent adoption from other countries, also dominatedby harshly hot climates. In other words, the embracement of theQatari environmental practices will accentuate further the globalaspect of their environmental legacy.
This paper presented the various challenges that Qatar has toface, while approaching the 2022 World Cup. With respect to the
e Citie
rvbdtocsllta
fisbwf
cbcfa
R
A
A
A
A
A
A
B
B
B
.
B
B
C
C
CD
D
D
E
P. Sofotasiou et al. / Sustainabl
equirements that FIFA has established, in order to ensure the pro-ision of aero-thermal comfort conditions within the stadiums,oth passive and active cooling techniques should be adopted. Con-ucive to preserve both visitors’ and players’ physical integrity, thehermal thresholds of 20.0–25.5 ◦C can be delivered either by evap-rative or solar sorption cooling systems. Based on the climaticharacteristics, the use of a combined system consisting of solarorption techniques is deemed to be more effective for the coolingoad production, especially when it is driven by solar thermal col-ectors to generate the required amounts of heat. The feasibility ofhese techniques, however, has not yet been tested on large scalerenas or under real weather conditions.
A dynamic thermal simulation was performed based on a simpli-ed stadium design integrated with HVAC components. The resultshowed that a minimum cooling load of 47 MW h per game shoulde provided to produce an indoor thermal comfort environment,ith an additional load of at least 115 MW h per game for the com-
ort neutrality of the semi-outdoor occupied areas.The final decisions, though, should rely upon the sustainable
oncept of carbon neutrality that it is planned to be accomplishedy balancing techniques and to the future viability of the event, twoommitments adhered to the Qatari National development Visionor 2030, for the delivery of a World Cup widely remembered and
valuable legacy extended beyond Qatar’s boarders.
eferences
ly, S., & Fathalah, K. (1988). Combined absorption–desiccant solar powered air con-ditioning system. Warme-und Stoffubertragung, 23(2), 111–121. Available from:http://link.springer.com/article/10.1007%2FBF01637133#page-1
rupassociates.com. (2010). Qatar showcase: ARUP ASSOCIATES (online). Availablefrom: http://www.arupassociates.com/en/case-studies/qatar-showcase/
rupassociates.com. (2013). Qatar 2022 FIFA showcase environmental strategy:ARUP ASSOCIATES (online). Available from: http://www.arupassociates.com/en/exploration/books/qatar-2022/
SHRAE. (2008). Desiccant dehumidification and pressure-drying equipment (e-book).Available from: http://nashaucheba.ru/docs/2/1624/conv 32/file32.pdf
ttia, S., & De Herde, A. (2011). Early design simulation tools for net zero energybuildings: A comparison of ten tools.
uliciems, A., & Szokolay, S. (1997). Plea note 3: Thermal comfort (e-book). Australia:Department of Architecture, The University of Queensland. Available from:http://plea-arch.org/wp-content/uploads/PLEA-NOTE-3-THERMAL-COMFORT.pdf
aade, R., & Matheson, V. (2004). The quest for the cup: Assessing the economicimpact of the World Cup. Regional Studies, 38(4), 343–354. Available from:http://www.tandfonline.com/doi/pdf/10.1080/03434002000213888
eattie, K., & Ward, I. (1999). . The advantages of building simulation for building designengineers (2).
orikar, G. (2013). Qatar Real Estate Report Q2 2013 (e-book). Al Asmakh Real EstateDevelopment. Available from: http://www.alasmakhrealestate.com/images/news/MarketReport/Qatar%20Real%20Estate%20Market%20Report%20Q2%2013pdf
ouyer, J., Vinet, J., Delpech, P., & Carre, S. (2007). Thermal comfort assessment insemi-outdoor environments: Application to comfort study in stadia. Journal ofWind Engineering and Industrial Aerodynamics, 95(9), 963–976. Available from:http://dx.doi.org/10.1016/j.jweia.2007.01.022
rotherhood, J. (2008). Heat stress and strain in exercise and sport. Jour-nal of Science and Medicine in Sport, 11(1), 6–19. http://dx.doi.org/10.1016/j.jsams.2007.08.017
aa.gov.qa. (2013). About Qatar | Civil Aviation Authority (online). Available from:http://www.caa.gov.qa/en/about Qatar
hidambaram, L., Ramana, A., Kamaraj, G., & Velraj, R. (2011). Review of solarcooling methods and thermal storage options. Renewable and SustainableEnergy Reviews, 15(6), 3220–3228. Available from: http://dx.doi.org/10.1016/S0140-7007(00)00024-4
IBSE. (2006). Environmental design CIBSE guide A. CIBSE Publications.aou, K., Wang, R., & Xia, Z. (2006). Desiccant cooling air conditioning: A
review. Renewable and Sustainable Energy Reviews, 10(2), 55–77. Available from:http://dx.doi.org/10.1016/j.rser.2004.09.010
arwish, M., Hassabou, A., & Shomar, B. (2013). Using seawater reverse osmosis(SWRO) desalting system for less environmental impacts in Qatar. Desalination,309, 113–124. Available from: http://dx.doi.org/10.1016/j.desal.2012.09.026
jongyang, N., Tchinda, R., & Njomo, D. (2010). Thermal comfort: A review paper.
Renewable and Sustainable Energy Reviews, 14(9), 2626–2640. Available from:http://dx.doi.org/10.1016/j.rser.2010.07.040c.europa.eu. (2013). ec-European Commission – Regional development (online).Available from: http://ec.europa.eu/sport/what-we-do/regional-developmenten.htm
s and Society 14 (2015) 16–30 29
Environment.gov.za. (2011). Energy (e-book). Department of EnvironmentalAffairs., p. 40, 45, 46, 47. Available from: https://www.environment.gov.za/sites/default/files/docs/energy.pdf
ESTIF. (2006). Solar assisted cooling (e-book). European Solar Thermal Industry Feder-ation., p. 7, 8, 11. Available from: http://www.estif.org/fileadmin/estif/content/policies/downloads/D23-solar-assisted-cooling.pdf
Ezzeldin, S., & Rees, S. (2013). The potential for office buildings with mixed-modeventilation and low energy cooling systems in arid climates. Energy and Buildings,65, 368–381. Available from: http://dx.doi.org/10.1016/j.enbuild.2013.06.004
FIFA.com. (1999). The great world youth championship adventure (online). FIFA.com.Available from: http://www.fifa.com/tournaments/archive/u20worldcup/nigeria1999/news/newsid=70614/index.html
FIFA.com. (2004). Legacy report (e-book). FIFA., p. 13, 67, 89. Availablefrom: http://www.fifa.com/mm/document/afsocial/environment/01/57/12/66/2006fwcgreengoallegacyreport en.pdf
FIFA.com. (2006). England feel the heat (online). Available from: http://www.fifa.com/worldcup/archive/germany2006/news/newsid=18168.html
FIFA. (2009). The FIFA World Cup final draw history (e-book). FIFA., p. 2,3. Available from: http://www.fifa.com/mm/document/fifafacts/mencompwc/51/97/68/fs-201 10e fwc-final-draw-history.pdf
FIFA. (2010). 2022 FIFA World CupTM bid evaluation report: Qatar (e-book). FIFA.com. Available from: http://www.fifa.com/mm/document/tournament/competition/01/33/74/56/b9qate.pdf
FIFA. (2011). Football stadiums: Technical recommendations and requirements (e-book) (5th ed.). FIFA., p. 108, 283. Available from: http://www.fifa.com/mm/document/tournament/competition/01/37/17/76/stadiumbook2010 buch.pdf
FIFA.com. (2013a). 1986 FIFA World Cup MexicoTM (online). Available from:http://www.fifa.com/worldcup/archive/edition=68/overview.html
FIFA.com. (2013b). FIFA and environmental protection/earth hour 2013 on23 March (e-book). FIFA. Available from: http://www.fifa.com/mm/document/affederation/administration/02/02/89/68/circularno.1350-fifaandenvironmentalprotection earthhour2013on23march.pdf
FIFA.com. (n.d.) FIFA and the environment (online). Available at: http://www.fifa.com/aboutfifa/socialresponsibility/environmental.html
Gsdp.gov.qa. (2011). Goals and benefits (online). Available from: http://www.gsdp.gov.qa/portal/page/portal/gsdp en/nds/goals benefits
Gude, V., Nirmalakhandan, N., & Deng, S. (2010). Renewable and sustainableapproaches for desalination. Renewable and Sustainable Energy Reviews, 14(9),2641–2654. Available from: http://dx.doi.org/10.1016/j.rser.2010.06.008
Hargreaves, M. (2008). Physiological limits to exercise performance in theheat. Journal of Science and Medicine in Sport, 11(1), 66–71. Available from:http://dx.doi.org/10.1016/j.jsams.2007.07.002
Henning, H., Erpenbeck, T., Hindenburg, C., & Santamaria, I. (2001). Thepotential of solar energy use in desiccant cooling cycles. InternationalJournal of Refrigeration, 24(3), 220–229. Available from: http://dx.doi.org/10.1016/S0140-7007(00)00024-4
Hensen, J., & Lamberts, R. (2011). Building performance simulation for design andoperation (1st ed.). Abingdon, Oxon: Spon Press.
Hopfe, C., & Hensen, J. (2011). Uncertainty analysis in building performance sim-ulation for design support. Energy and Buildings, 43(10), 2798–2805. Availablefrom: http://dx.doi.org/10.1016/j.envbuild.2011.06.034
Hughes, B. R., Rezazadeh, F., & Chaudhry, H. N. (2013). Economic viability ofincorporating multi-effect distillation with district cooling systems in theUnited Arab Emirates. Sustainable Cities and Society, 7, 37–43. Available from:http://dx.doi.org/10.1016/j.scs.2012.10.002
John, G., & Sheard, R. (2000). Stadia: A design and development guide. Boston: Archi-tectural Press.
Kalogirou, S., & Florides, G. (2012). 3.13 – Solar Space Heating and Cool-ing Systems. Comprehensive Renewable Energy, 3, 449–480. Available from:http://dx.doi.org/10.1016/B978-0-08-087872-0.00313-9
Kennett, S. (2010). Qatar’s zero carbon stadium: 96 degrees in the shade (online). Avail-able from: http://www.building.co.uk/buildings/qatars-zero-carbon-stadium-96-degrees-in-the-shade/5008557.article
Khatri, S. (2013). First World Cup stadium in Qatar to be built in Al Wakrah(online), 16th November. Doha News. Available from: http://dohanews.co/first-world-cup-stadium-in-qatar-to-be-built-in-al-wakrah/
Laylin, T. (2013). Tangram 2022 World Cup Stadium cools itself like a lizard(online), 13th May. Green Prophet. Available from: http://www.greenprophet.com/2013/05/tangram-ancient-qatari-design-world-cup-stadium/
Maughan, R., Shirreffs, S., Ozgünen, K., Kurdak, S., Ersöz, G., Binnet, M., & Dvo-rak, J. (2010). Living, training and playing in the heat: Challenges to thefootball player and strategies for coping with environmental extremes.Scandinavian Journal of Medicine & Science in Sports, 20(s3), 117–124. Availablefrom: http://onlinelibrary.wiley.com/doi/10.1111/j.1600-0838.2010.01221.x/pdf
Nagengast, A., Hendrickson, C., & Matthews, H. (2013). Variations in photovoltaicperformance due to climate and low-slope roof choice. Energy and Buildings, 64,493–502. Available from: http://dx.doi.org/10.1016/j.enbuild.2013.05.009
News.bbc.co.uk. (2006). England 1-0 Ecuador (online). Available from:http://news.bbc.co.uk/sport1/hi/football/world cup 2006/4991536.stm
Nws.noaa.gov. (2005). National Weather Service Heat Safety (online). Available from:
http://www.nws.noaa.gov/os/heat/index.shtmlPatel, C. (2013). Heat Stress Guidelines QGL-CHH-001 (e-book). Qatar Petroleum/RLIC.Available from: http://www.raslaffan.qp.qa/irj/go/km/docs/documents/Qatar%20Petroleum/e-RLC/Attachments/Regulations/RLC%20Heat%20Stress%20Guidelines.pdf
http://www.alasmakhrealestate.com/images/news/MarketReport/Qatar Real Estate Market Report Q2 13.pdf
http://www.alasmakhrealestate.com/images/news/MarketReport/Qatar Real Estate Market Report Q2 13.pdf
http://www.alasmakhrealestate.com/images/news/MarketReport/Qatar Real Estate Market Report Q2 13.pdf
http://www.fifa.com/mm/document/afsocial/environment/01/57/12/66/2006fwcgreengoallegacyreport_en.pdf
3 e Citie
P
P
P
(
Q
Q
Q
R
S
S
S
S
S
0 P. Sofotasiou et al. / Sustainabl
earlmutter, D., Erell, E., & Etzion, Y. (2008). A multi-stage down-draft evaporativecool tower for semi-enclosed spaces: Experiments with a water spraying sys-tem. Solar Energy, 82(5), 430–440. Available from: http://dx.doi.org/10.1016/j.solener.2007.12.003
earlmutter, D., Erell, E., Etzion, Y., Meir, I., & Di, H. (1996). Refining the use of evap-oration in an experimental down-draft cool tower. Energy and Buildings, 23(3),191–197. Available from: http://dx.doi.org/10.1016/0378-7788(95)00944-2
etersen, S., & Svendsen, S. (2010). Method and simulation program informeddecisions in the early stages of building design (e-book). Energy and Build-ings, 1. Available from: Elsevier, http://dx.doi.org/10.1016/j.enbuild.2010.02.002
2011). Qatar National Development Strategy 2011–2016 (e-book). Doha. Availablefrom: http://www.gsdp.gov.qa/gsdp vision/docs/NDS EN.pdf
f.org.qa. (2013a). Qatar foundation | Crossing an energy frontier (online). Avail-able from: http://www.qf.org.qa/content/the-foundation/issue-47/crossing-an-energy-frontier
f.org.qa. (2013b). Qatar foundation | QF’s visionary World Cup stadium (online).Available from: http://www.qf.org.qa/content/the-foundation/issue-49/qfs-visionary-world-cup-stadium
f.org.qa. (2013c). Qatar foundation | Solar energy put to the test (online).Available from: http://www.qf.org.qa/content/the-foundation/issue-49/solar-energy-put-to-the-test
ees, S., Spitler, J., Davies, M., & Haves, P. (2000). Qualitative comparison of NorthAmerican and UK cooling load calculation methods. HVAC & R Research, 6(1),75–99.
artori, I., Napolitano, A., & Voss, K. (2012). Net zero energy buildings: A consis-tent definition framework. Energy and Buildings, 48, 220–232. Available from:http://dx.doi.org/10.1016/j.enbuild.2012.01.032
awka, M., Leon, L., & Montain, S. (2011). Integrated physiological mechanismsof exercise performance, adaptation, and maladaptation to heat stress. InComprehensive physiology (e-book). Wiley Online Library. Available from:http://onlinelibrary.wiley.com/doi/10.1002/cphy.c100082/full
pagnolo, J., & De Dear, R. (2003). A field study of thermal comfort inoutdoor and semi-outdoor environments in subtropical Sydney Australia.Building and Environment, 38(5), 721–738. Available from: http://dx.doi.org/10.1016/0378-7788(95)00944-2
ulayem, M., O’connor, S., & Hassan, D. (2013). Sport management in the mid-dle east: A case study analysis (e-book). Routledge. Available from: http://books.google.co.uk/books?id=81Wy8vhoZvEC&pg=PA35&lpg=PA35&dq=fifa+u20+world+cup+1995+qatar+overview&source=bl&ots=RL3UXIUmnE&sig=
trdK WR2odvk2eaBe rJ54MnZJM&hl=en&sa=X&ei=k99bUr-uMcis0QXz5IG4Dw&ved=0CGUQ6AEwBw#v=onepage&q=fifa%20u20%20world%20cup%201995%20qatar%20overview&f=falsezucs, A. (2004). Stadia in the environment – Environment in stadia. Available from:http://alexandria.tue.nl/openaccess/635611/p0601final.pdf
s and Society 14 (2015) 16–30
Szucs, A., Moreau, S., & Allard, F. (2007). Spectators’ aerothermal comfort assessmentmethod in stadia. Building and Environment, 42(6), 2227–2240. Available from:http://dx.doi.org/10.1016/j.buildenv.2006.03.009
Szucs, A., Moreau, S., & Allard, F. (2009). Aspects of stadium design forwarm climates. Building and Environment, 44(6), 1206–1214. http://dx.doi.org/10.1016/j.buildenv.2008.09.008
Ucuncu, M., Woolf, D., & Zikri, M. (2010). Thermal comfort of spectators in stadiabuilt in hot climates. In Paper presented at Adapting to change: New thinkingon comfort, Windsor 9–11 April (p. 8). London: Network for Comfort andEnergy Use in Buildings. Available from: http://nceub.org.uk/dokuwiki/lib/exe/fetch.php?media=nceub:uploads:members:w2010:extra papers:53-01-14-ucuncu.pdf
Unknown. (2012). Indoor prospect of Arup’s small scale stadium in Qatar (image online).Available from: http://buildingindustry.org/quotshowcasequot-arena
Unknown. (2013). Stade de France sports facility (image online). Available from:http://www.vinci-concessions.com/2011/03/stade-de-france-2/
Van Hooff, T., & Blocken, B. (2009). CFD analysis of natural ventilation inlarge semi-enclosed buildings — Case study: Amsterdam Arena footballstadium. In Paper presented at Eleventh International IBPSA Conference Glas-gow, Scotland, 27–30 July,. Available from: http://www.ibpsa.org/proceedings/BS2009/BS09 1228 1235.pdf
Van Hooff, T., & Blocken, B. (2010a). Coupled urban wind flow and indoor naturalventilation modelling on a high-resolution grid: A case study for the Amster-dam Arena stadium. Environmental Modelling & Software, 25(1), 51–65. Availablefrom: http://dx.doi.org/10.1016/j.envsoft.2009.07.008
Van Hooff, T., & Blocken, B. (2010b). On the effect of wind direction and urbansurroundings on natural ventilation of a large semi-enclosed stadium. Com-puters & Fluids, 39(7), 1146–1155. Available from: http://dx.doi.org/10.1016/j.compfluid.2010.02.004
Van Hooff, T., & Blocken, B. (2012). Full-scale measurements of indoor envi-ronmental conditions and natural ventilation in a large semi-enclosedstadium: Possibilities and limitations for CFD validation. Journal of WindEngineering and Industrial Aerodynamics, 104, 330–341. Available from:http://dx.doi.org/10.1016/j.jweia.2012.02.009
Van Hooff, T., Blocken, B., & Van Harten, M. (2011). 3D CFD simulations ofwind flow and wind-driven rain shelter in sports stadia: Influence of sta-dium geometry. Building and Environment, 46(1), 22–37. Available from:http://dx.doi.org/10.1016/j.buildenv.2010.06.013
Watson, P., Black, K., Clark, S., & Maughan, R. (2006). Exercise in the heat:Effect of fluid ingestion on blood–brain barrier permeability. Medicine and
Science in Sports and Exercise, 38(12), 2118. Available from: http://www.setantacollege.com/wp-content/uploads/Journal db/Rapid%20IV%20versus%20Oral%20Rehydration.pdfWorldweather.org. (2014). worldweather.org (online). Available from: www.worldweather.org