Q46-88 Suspended Solids Monitor - Analytical … Suspended... · Model Q46/88 Suspended Solids...
64
Model Q46/88 Suspended Solids Monitor Home Office European Office Analytical Technology, Inc. ATI (UK) Limited 6 Iron Bridge Drive Unit 1 & 2 Gatehead Business Park Collegeville, PA 19426 Delph New Road, Delph Saddleworth OL35DE Ph: 800-959-0299 Ph: +44 (0)1457-873-318 610-917-0991 Fax: 610-917-0992 Fax: + 44 (0)1457- 874-468 Email: [email protected] Email:[email protected]
Transcript of Q46-88 Suspended Solids Monitor - Analytical … Suspended... · Model Q46/88 Suspended Solids...
Model Q46/88 Suspended Solids
Monitor
Home Office European Office Analytical Technology, Inc. ATI (UK) Limited 6 Iron Bridge Drive Unit 1 & 2 Gatehead Business Park Collegeville, PA 19426 Delph New Road, Delph Saddleworth OL35DE Ph: 800-959-0299 Ph: +44 (0)1457-873-318 610-917-0991 Fax: 610-917-0992 Fax: + 44 (0)1457-874-468 Email: [email protected] Email:[email protected]

PRODUCT WARRANTY Analytical Technology, Inc. (Manufacturer) warrants to the Customer that if any part(s) of the Manufacturer's equipment proves to be defective in materials or workmanship within the earlier of 18 months of the date of shipment or 12 months of the date of start-up, such defective parts will be repaired or replaced free of charge. Inspection and repairs to products thought to be defective within the warranty period will be completed at the Manufacturer's facilities in Collegeville, PA. Products on which warranty repairs are required shall be shipped freight prepaid to the Manufacturer. The product(s) will be returned freight prepaid and allowed if it is determined by the manufacturer that the part(s) failed due to defective materials or workmanship. This warranty does not cover consumable items, batteries, or wear items subject to periodic replacement including lamps and fuses. Gas sensors carry a 12 months from date of shipment warranty and are subject to inspection for evidence of misuse, abuse, alteration, improper storage, or extended exposure to excessive gas concentrations. Should inspection indicate that sensors have failed due to any of the above, the warranty shall not apply. The Manufacturer assumes no liability for consequential damages of any kind, and the buyer by acceptance of this equipment will assume all liability for the consequences of its use or misuse by the Customer, his employees, or others. A defect within the meaning of this warranty is any part of any piece of a Manufacturer's product which shall, when such part is capable of being renewed, repaired, or replaced, operate to condemn such piece of equipment. This warranty is in lieu of all other warranties ( including without limiting the generality of the foregoing warranties of merchantability and fitness for a particular purpose), guarantees, obligations or liabilities expressed or implied by the Manufacturer or its representatives and by statute or rule of law. This warranty is void if the Manufacturer's product(s) has been subject to misuse or abuse, or has not been operated or stored in accordance with instructions, or if the serial number has been removed. Analytical Technology, Inc. makes no other warranty expressed or implied except as stated above.
3
O&M Manual Rev-D (8/17)
Table of Contents
PART 1 - INTRODUCTION ....................... 5
1.1 General ......................................... 5 1.2 Standard System .......................... 5 1.3 Features ....................................... 7 1.4 Q46/88 System Specifications ...... 8 1.5 Q46/88 Performance Specifications 9
PART 2 – ANALYZER MOUNTING ........ 10
2.1 General ....................................... 10 2.2 Wall or Pipe Mount ...................... 11 2.3 Panel Mount, AC Powered Monitor 13
PART 3 – SENSOR INSTALLATION ...... 15
3.1 General ....................................... 15 3.2 Flowcell Mounting ....................... 19 3.3 In-Line Installation ....................... 16 3.4 Submersible Installation .............. 15
PART 4 – ELECTRICAL INSTALLATION ................................................................ 21
4.1 General ....................................... 21 4.2 AC Wiring.................................... 22 4.3 Relay Connection ........................ 24 4.4 Optional Output/Relay Connection 25 4.5 Direct Sensor Wiring ................... 26 4.6 Remote Sensor Wiring ................ 27
PART 5 – CONFIGURATION .................. 28
5.1 User Interface ............................. 28 5.11 Keys ........................................ 29 5.12 Display ..................................... 29
5.2 Software ...................................... 31 5.21 Software Navigation ................ 31 5.22 Measure Menu [MEASURE]..... 34 5.23 Calibration Menu [CAL] ............. 35 5.24 Configuration Menu [CONFIG] 36 5.25 Control Menu [CONTROL] ...... 39 5.26 Diagnostics Menu [DIAG] ......... 44
PART 6 – CALIBRATION ........................ 49
6.1 Suspended Solids Calibration ..... 49 6.11 Cal Zero ................................... 49 6.12 Cal Span .................................. 50
6.2 Temperature Calibration .............. 51
PART 7 – PID CONTROLLER DETAILS . 59
7.1 PID Description ........................... 59 7.2 PID Algorithm .............................. 59 7.3 Classical PID Tuning ................... 61 7.4 Manual PID Override Control ...... 62 7.5 Common PID Pitfalls ................... 62
PART 8 – SYSTEM MAINTENANCE ...... 54
8.1 General ....................................... 54 8.2 Analyzer Maintenance ................. 54 8.3 Sensor Maintenance ................... 54
PART 9 – TROUBLESHOOTING ............ 55
9.1 General ....................................... 55 9.2 External ....................................... 55 9.3 Analyzer ...................................... 56 9.31 Display ........................................ 57
SPARE PARTS ....................................... 59
4
O&M Manual Rev-D (8/17)
Table of Figures FIGURE 1 - SYSTEM OPTIONS .............................................................................................. 6 FIGURE 2 – Q46 ENCLOSURE DIMENSIONS ........................................................................ 10 FIGURE 3 - WALL OR PIPE MOUNT BRACKET ....................................................................... 11 FIGURE 4 - WALL MOUNTING DIAGRAM .............................................................................. 12 FIGURE 5 - PIPE MOUNTING DIAGRAM................................................................................ 12 FIGURE 6 - PANEL MOUNT INSTALLATION ........................................................................... 14 FIGURE 7 - SUBMERSION MOUNTING ASSEMBLY ................................................................. 15 FIGURE 8 - SUBMERSIBLE SENSOR ASSEMBLY ................................................................... 16 FIGURE 9 - 1 1/2" IN-LINE INSTALLATION ............................................................................ 17 FIGURE 10 - FLOW TEE EXPLODED VIEW ........................................................................... 18 FIGURE 11 - FLOWCELL DIMENSIONS ................................................................................. 19 FIGURE 12 - SENSOR/FLOWCELL EXPLODED VIEW ............................................................. 20 FIGURE 13 - AC POWER CONNECTIONS ............................................................................. 23 FIGURE 14 - RELAY CONTACTS ......................................................................................... 24 FIGURE 15 - OPTIONAL LOW POWER RELAY WIRING ........................................................... 25 FIGURE 16 - OPTIONAL 3RD ANALOG OUTPUT WIRING ........................................................ 25 FIGURE 17 – SUSPENDED SOLIDS SENSOR CONNECTION .................................................... 26 FIGURE 18 - REMOTE SENSOR WIRING .............................................................................. 27 FIGURE 19 - USER INTERFACE .......................................................................................... 28 FIGURE 20 - SOFTWARE MAP ............................................................................................ 33 FIGURE 21 - CONTROL RELAY EXAMPLE, HYSTERESIS & PHASE OPTIONS ............................ 42 FIGURE 22 - ALARM RELAY EXAMPLE ................................................................................ 43 FIGURE 23 - DISPLAY MESSAGES ...................................................................................... 58 FIGURE 24 - ISA PID EQUATION ....................................................................................... 60
5
O&M Manual Rev-D (8/17)
Part 1 - Introduction 1.1 General
The Model Q46/88 is an on-line monitoring system designed for the continuous measurement of suspended solids in water. It is intended for continuous monitoring of aeration tank mixed liquor, clarifier effluent, industrial process water, and other applications containing relatively high levels of suspended solids. The system provides measurement over one of 3 selectable operating ranges, 0-100.0 mg/l, 0-1000 mg/l, or 0-10.00 g/l. The sensing element used for suspended solids measurement is an optical sensor measuring infrared “backscatter”, a method suitable for high solids levels. For applications where sensor fouling is frequent, and Auto-Clean version of the system is available that uses ATI’s Q-Blast air cleaner assembly.
Q46/88 Monitors are available in two electronic versions, an AC powered monitor with integral alarm relays and dual 4-20 mA output capability, and a 12-24 VDC unit with dual output and relays. Options are available to add either a third 4-20 mA output or 3 additional low power SPST relays (required for Auto-Clean systems). In addition, digital output options are available for Profibus-DP, Modbus RTU or TCP/IP, or Ethernet-IP.
1.2 Standard System
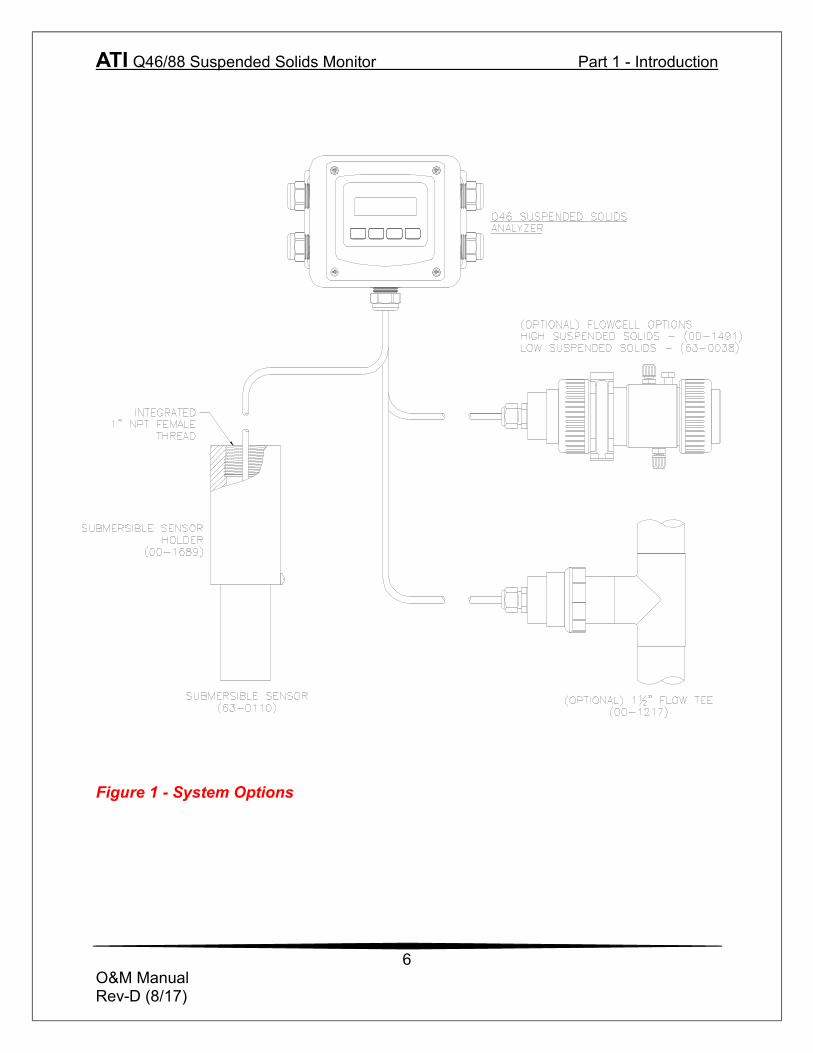
Q46/88 systems include two components, the Q46 analyzer and an optical sensor with 30 ft. cable. Sensor mounting options include submersion, submersion with Auto-Clean holder, 1 ½” flow tee, or flowcell. If possible, the flowcell or flow tee should be used if expected suspended solids levels are always below 10 mg/l. For connection of the sensor to the electronics, a 30' cable is supplied. Up to an additional 400 feet of interconnect cable may be added using #07-0100 junction box.
ATI Q46/88 Suspended Solids Monitor Part 1 - Introduction
6
O&M Manual Rev-D (8/17)
Figure 1 - System Options
ATI Q46/88 Suspended Solids Monitor Part 1 - Introduction
7
O&M Manual Rev-D (8/17)
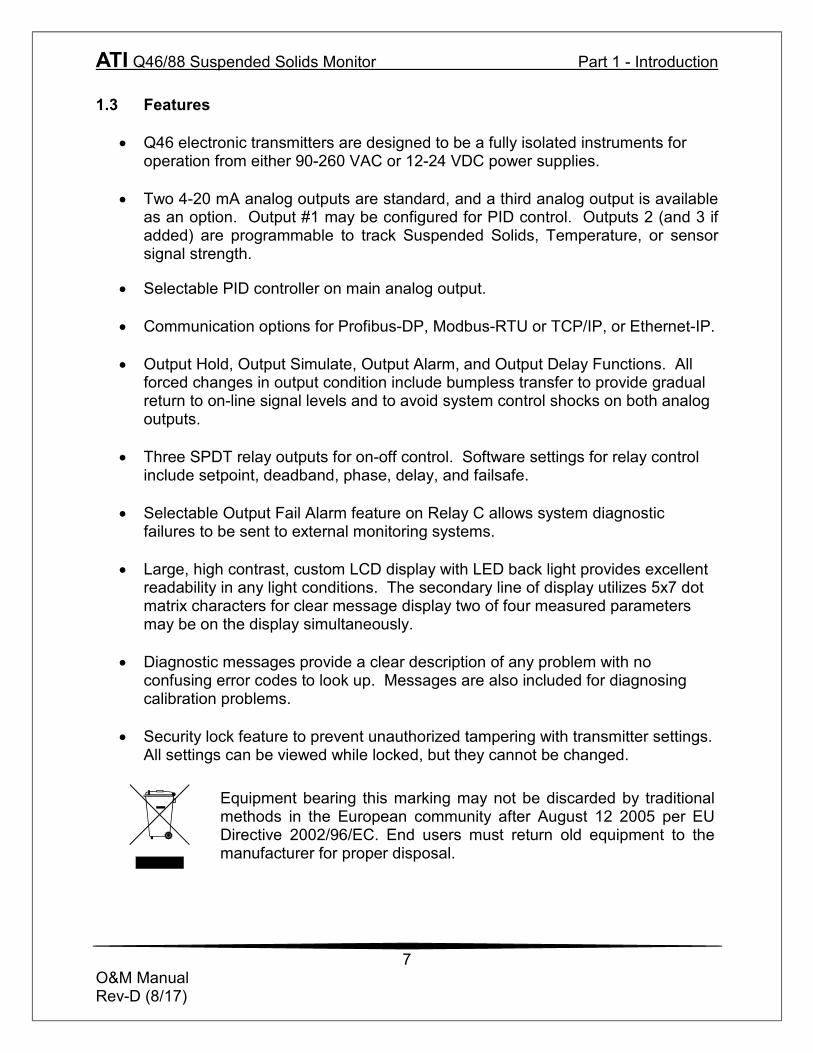
1.3 Features
• Q46 electronic transmitters are designed to be a fully isolated instruments for operation from either 90-260 VAC or 12-24 VDC power supplies.
• Two 4-20 mA analog outputs are standard, and a third analog output is available
as an option. Output #1 may be configured for PID control. Outputs 2 (and 3 if added) are programmable to track Suspended Solids, Temperature, or sensor signal strength.
• Selectable PID controller on main analog output.
• Communication options for Profibus-DP, Modbus-RTU or TCP/IP, or Ethernet-IP.
• Output Hold, Output Simulate, Output Alarm, and Output Delay Functions. All forced changes in output condition include bumpless transfer to provide gradual return to on-line signal levels and to avoid system control shocks on both analog outputs.
• Three SPDT relay outputs for on-off control. Software settings for relay control
include setpoint, deadband, phase, delay, and failsafe.
• Selectable Output Fail Alarm feature on Relay C allows system diagnostic failures to be sent to external monitoring systems.
• Large, high contrast, custom LCD display with LED back light provides excellent
readability in any light conditions. The secondary line of display utilizes 5x7 dot matrix characters for clear message display two of four measured parameters may be on the display simultaneously.
• Diagnostic messages provide a clear description of any problem with no
confusing error codes to look up. Messages are also included for diagnosing calibration problems.
• Security lock feature to prevent unauthorized tampering with transmitter settings.
All settings can be viewed while locked, but they cannot be changed. Equipment bearing this marking may not be discarded by traditional
methods in the European community after August 12 2005 per EU Directive 2002/96/EC. End users must return old equipment to the manufacturer for proper disposal.
ATI Q46/88 Suspended Solids Monitor Part 1 - Introduction
8
O&M Manual Rev-D (8/17)
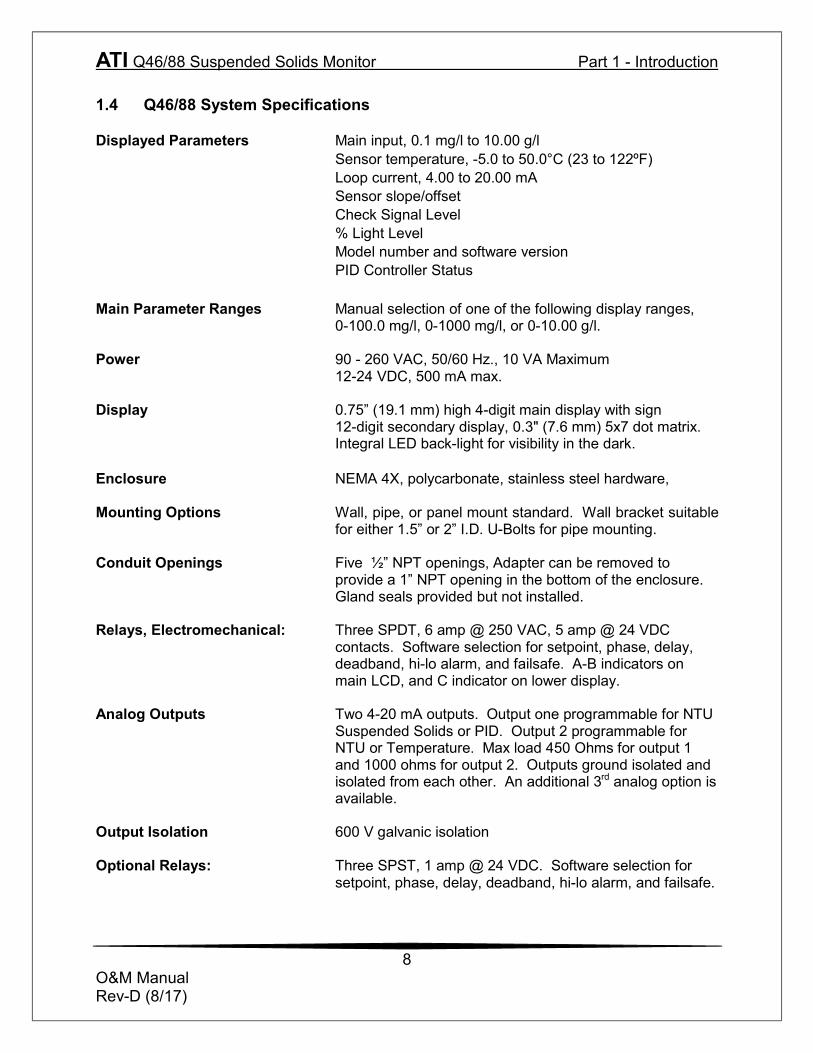
1.4 Q46/88 System Specifications
Displayed Parameters Main input, 0.1 mg/l to 10.00 g/l Sensor temperature, -5.0 to 50.0°C (23 to 122ºF) Loop current, 4.00 to 20.00 mA Sensor slope/offset Check Signal Level % Light Level Model number and software version PID Controller Status Main Parameter Ranges Manual selection of one of the following display ranges, 0-100.0 mg/l, 0-1000 mg/l, or 0-10.00 g/l. Power 90 - 260 VAC, 50/60 Hz., 10 VA Maximum 12-24 VDC, 500 mA max. Display 0.75” (19.1 mm) high 4-digit main display with sign 12-digit secondary display, 0.3" (7.6 mm) 5x7 dot matrix. Integral LED back-light for visibility in the dark. Enclosure NEMA 4X, polycarbonate, stainless steel hardware, Mounting Options Wall, pipe, or panel mount standard. Wall bracket suitable
for either 1.5” or 2” I.D. U-Bolts for pipe mounting. Conduit Openings Five ½” NPT openings, Adapter can be removed to
provide a 1” NPT opening in the bottom of the enclosure. Gland seals provided but not installed.
Relays, Electromechanical: Three SPDT, 6 amp @ 250 VAC, 5 amp @ 24 VDC
contacts. Software selection for setpoint, phase, delay, deadband, hi-lo alarm, and failsafe. A-B indicators on main LCD, and C indicator on lower display.
Analog Outputs Two 4-20 mA outputs. Output one programmable for NTU
Suspended Solids or PID. Output 2 programmable for NTU or Temperature. Max load 450 Ohms for output 1 and 1000 ohms for output 2. Outputs ground isolated and isolated from each other. An additional 3rd analog option is available.
Output Isolation 600 V galvanic isolation Optional Relays: Three SPST, 1 amp @ 24 VDC. Software selection for
setpoint, phase, delay, deadband, hi-lo alarm, and failsafe.
ATI Q46/88 Suspended Solids Monitor Part 1 - Introduction
9
O&M Manual Rev-D (8/17)
Ambient Temperature Analyzer Service, -20 to 60 °C (-4 to 140 ºF) Sensor Service, 0 to 55°C (23 to 131 °F)
Storage, -30 to 70 °C (-22 to 158 ºF) Ambient Humidity 0 to 95%, indoor/outdoor use, non-condensing to rated
ambient temperature range Altitude Up to 2000 m (6562 ft) Electrical Certification Ordinary Location, cCSAus (Certified to both CSA and UL
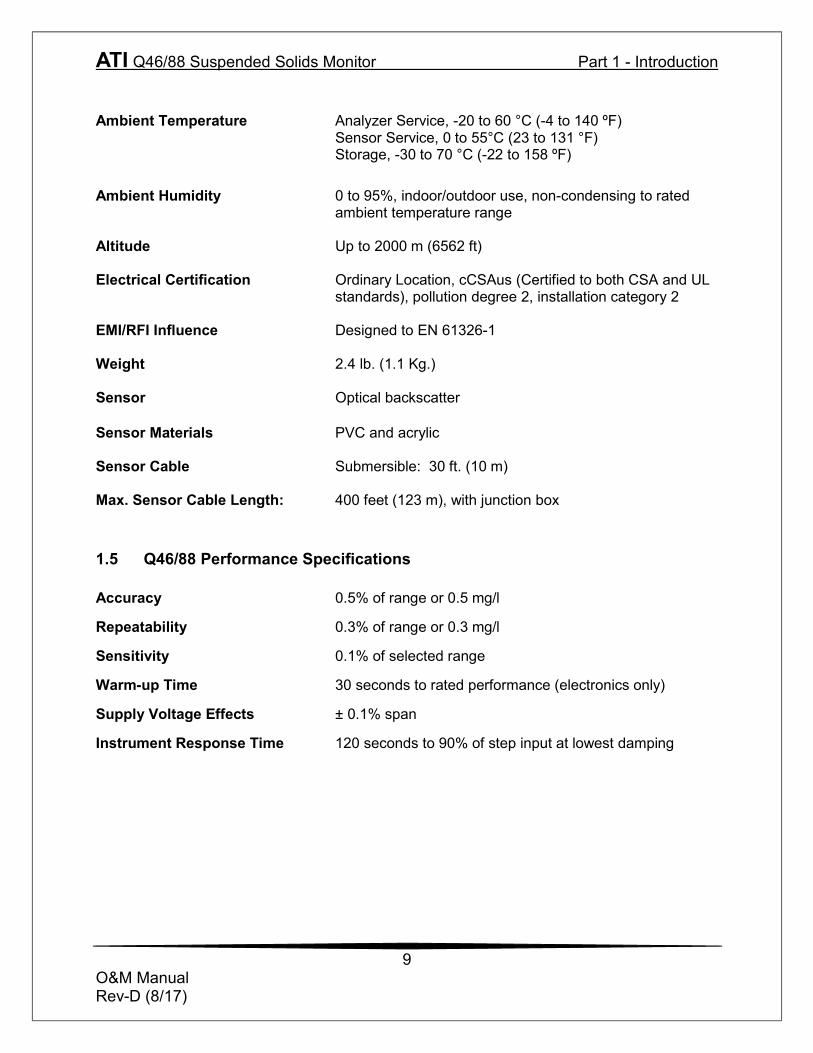
standards), pollution degree 2, installation category 2 EMI/RFI Influence Designed to EN 61326-1 Weight 2.4 lb. (1.1 Kg.) Sensor Optical backscatter Sensor Materials PVC and acrylic Sensor Cable Submersible: 30 ft. (10 m) Max. Sensor Cable Length: 400 feet (123 m), with junction box 1.5 Q46/88 Performance Specifications
Accuracy 0.5% of range or 0.5 mg/l Repeatability 0.3% of range or 0.3 mg/l Sensitivity 0.1% of selected range Warm-up Time 30 seconds to rated performance (electronics only) Supply Voltage Effects ± 0.1% span Instrument Response Time 120 seconds to 90% of step input at lowest damping
10
O&M Manual Rev-D (8/17)
Part 2 – Analyzer Mounting 2.1 General
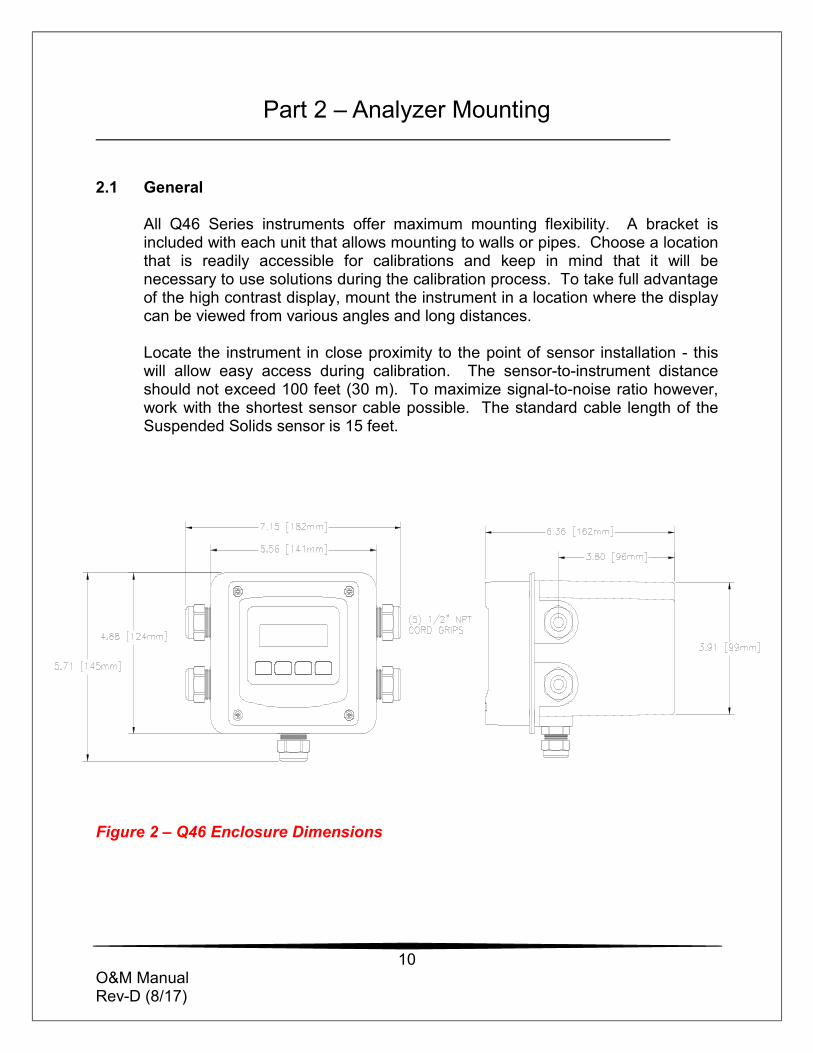
All Q46 Series instruments offer maximum mounting flexibility. A bracket is included with each unit that allows mounting to walls or pipes. Choose a location that is readily accessible for calibrations and keep in mind that it will be necessary to use solutions during the calibration process. To take full advantage of the high contrast display, mount the instrument in a location where the display can be viewed from various angles and long distances. Locate the instrument in close proximity to the point of sensor installation - this will allow easy access during calibration. The sensor-to-instrument distance should not exceed 100 feet (30 m). To maximize signal-to-noise ratio however, work with the shortest sensor cable possible. The standard cable length of the Suspended Solids sensor is 15 feet.
Figure 2 – Q46 Enclosure Dimensions
ATI Q46/88 Suspended Solids Monitor Part 2 – Analyzer Mounting
11
O&M Manual Rev-D (8/17)
2.2 Wall or Pipe Mount
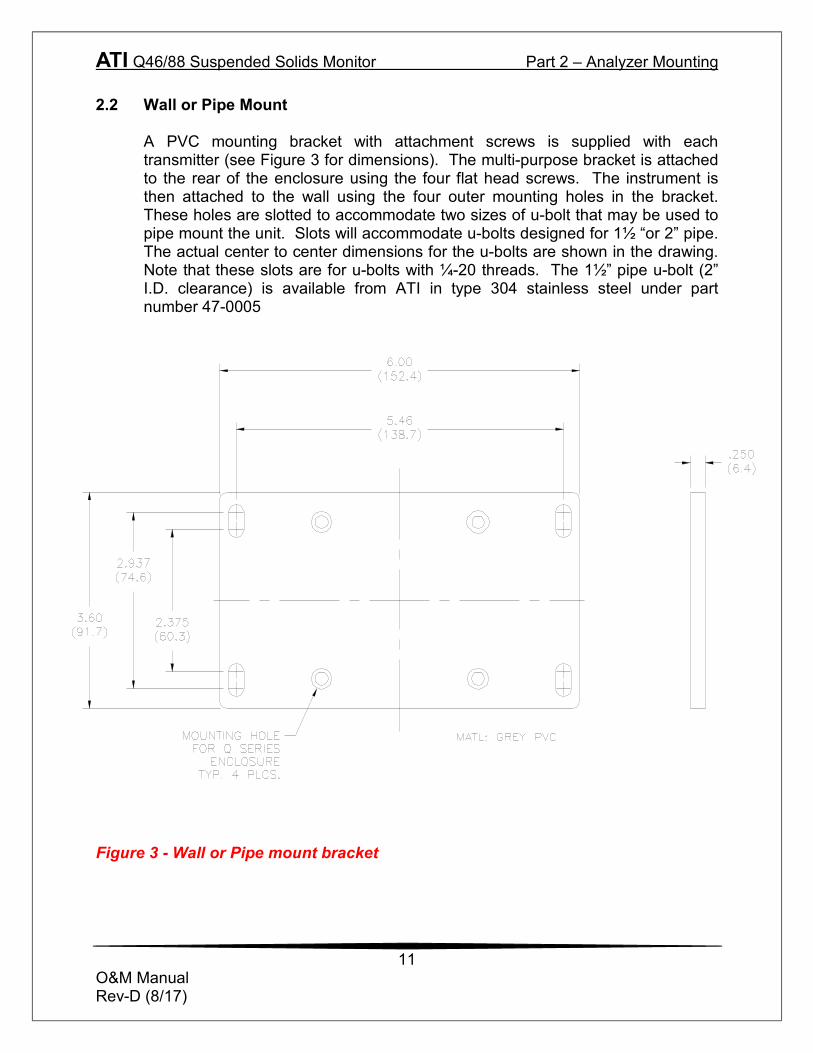
A PVC mounting bracket with attachment screws is supplied with each transmitter (see Figure 3 for dimensions). The multi-purpose bracket is attached to the rear of the enclosure using the four flat head screws. The instrument is then attached to the wall using the four outer mounting holes in the bracket. These holes are slotted to accommodate two sizes of u-bolt that may be used to pipe mount the unit. Slots will accommodate u-bolts designed for 1½ “or 2” pipe. The actual center to center dimensions for the u-bolts are shown in the drawing. Note that these slots are for u-bolts with ¼-20 threads. The 1½” pipe u-bolt (2” I.D. clearance) is available from ATI in type 304 stainless steel under part number 47-0005
Figure 3 - Wall or Pipe mount bracket
ATI Q46/88 Suspended Solids Monitor Part 2 – Analyzer Mounting
12
O&M Manual Rev-D (8/17)
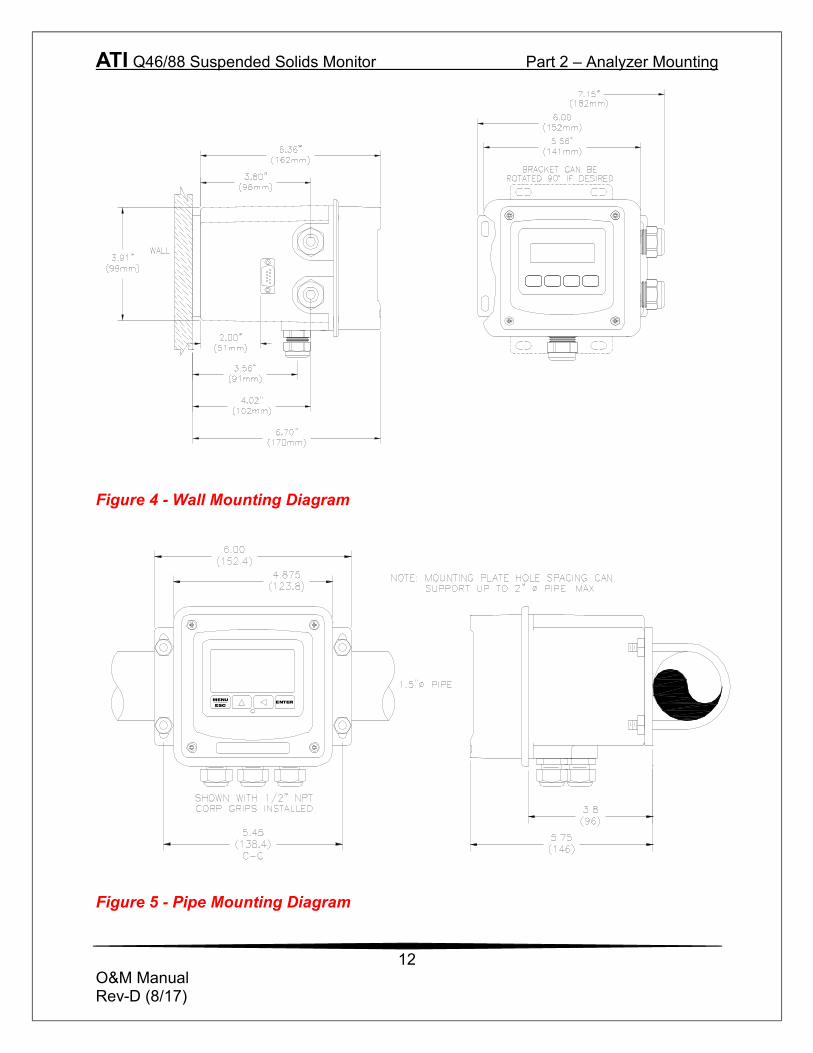
Figure 4 - Wall Mounting Diagram
Figure 5 - Pipe Mounting Diagram
ENTERMENU
ESC
ATI Q46/88 Suspended Solids Monitor Part 2 – Analyzer Mounting
13
O&M Manual Rev-D (8/17)
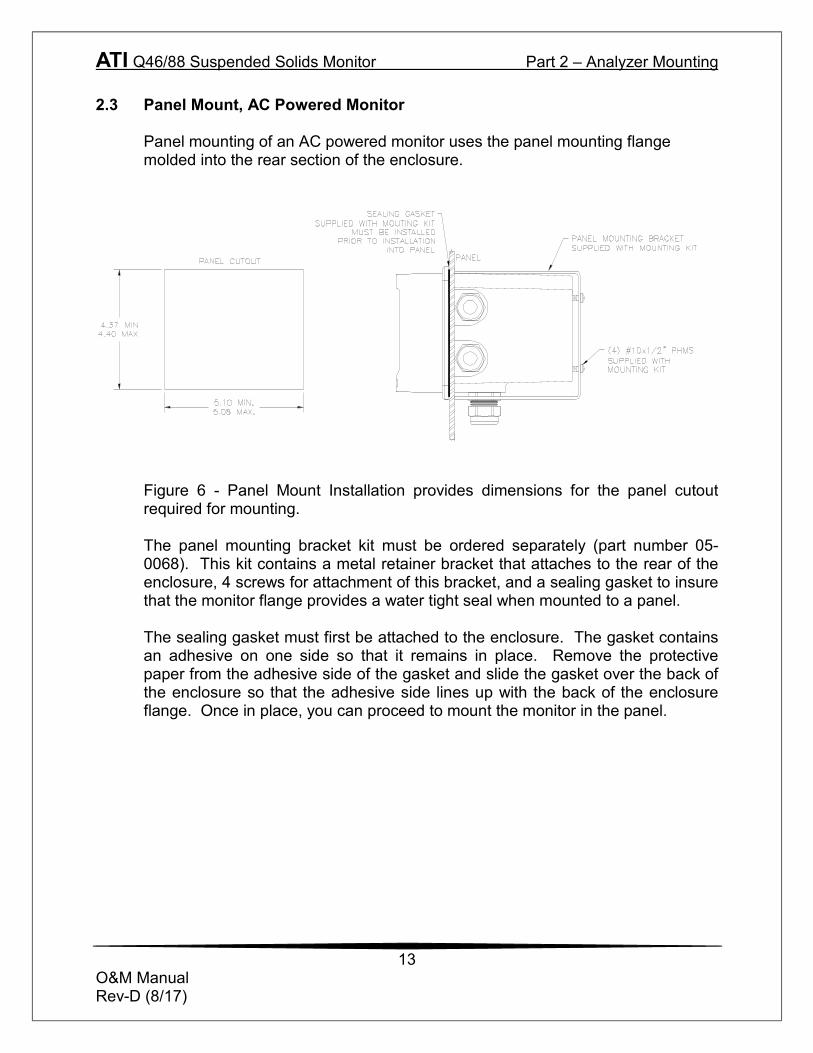
2.3 Panel Mount, AC Powered Monitor
Panel mounting of an AC powered monitor uses the panel mounting flange molded into the rear section of the enclosure.
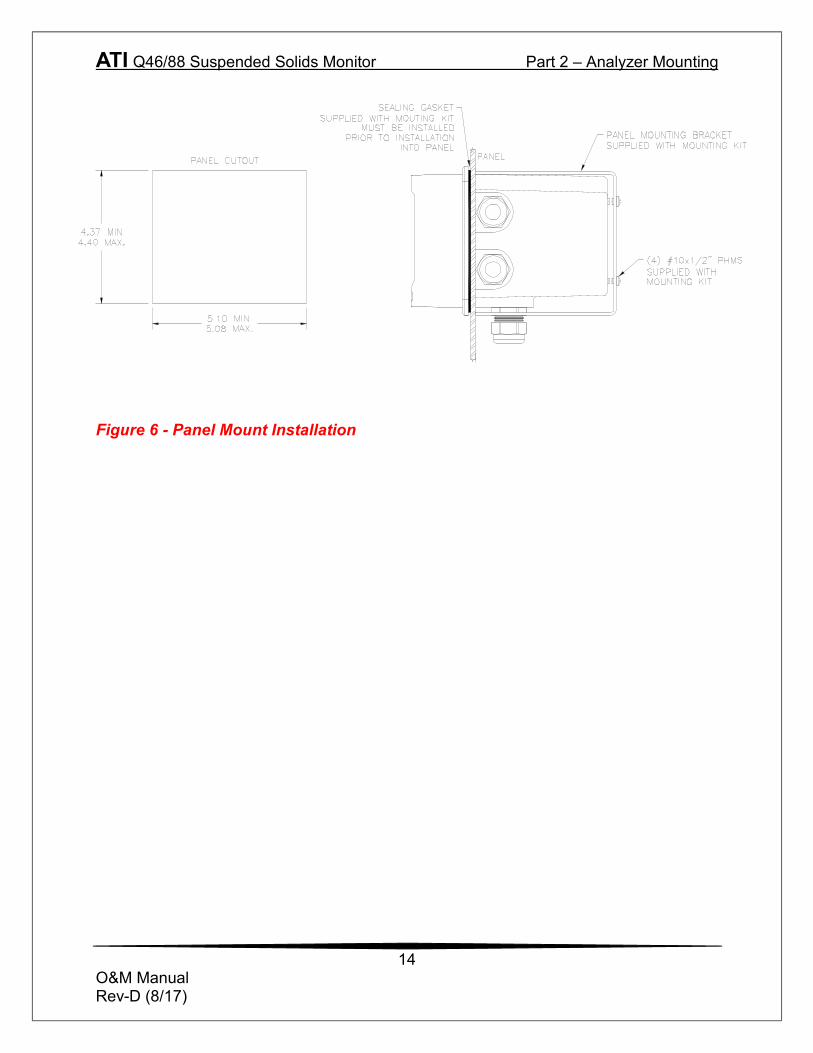
Figure 6 - Panel Mount Installation provides dimensions for the panel cutout required for mounting. The panel mounting bracket kit must be ordered separately (part number 05-0068). This kit contains a metal retainer bracket that attaches to the rear of the enclosure, 4 screws for attachment of this bracket, and a sealing gasket to insure that the monitor flange provides a water tight seal when mounted to a panel. The sealing gasket must first be attached to the enclosure. The gasket contains an adhesive on one side so that it remains in place. Remove the protective paper from the adhesive side of the gasket and slide the gasket over the back of the enclosure so that the adhesive side lines up with the back of the enclosure flange. Once in place, you can proceed to mount the monitor in the panel.
ATI Q46/88 Suspended Solids Monitor Part 2 – Analyzer Mounting
14
O&M Manual Rev-D (8/17)
Figure 6 - Panel Mount Installation
15
O&M Manual Rev-D (8/17)
Part 3 – Sensor Installation 3.1 General
The majority of suspended solids applications use a submersible sensor mounted on a pipe and submerged in aeration tanks, effluent channels, or other open tanks. For monitoring very low suspended solids levels, it is often better to use a flowcell or flow tee for measurement, which means the sample must be pumped to the measuring point. A flowcell or flow tee eliminates all ambient light which might interfere at low solids levels. If a flowcell or tee is used, insure that air is not entrained in the pumped sample. Air bubbles will cause high SS values do to optical reflections off the bubbles.
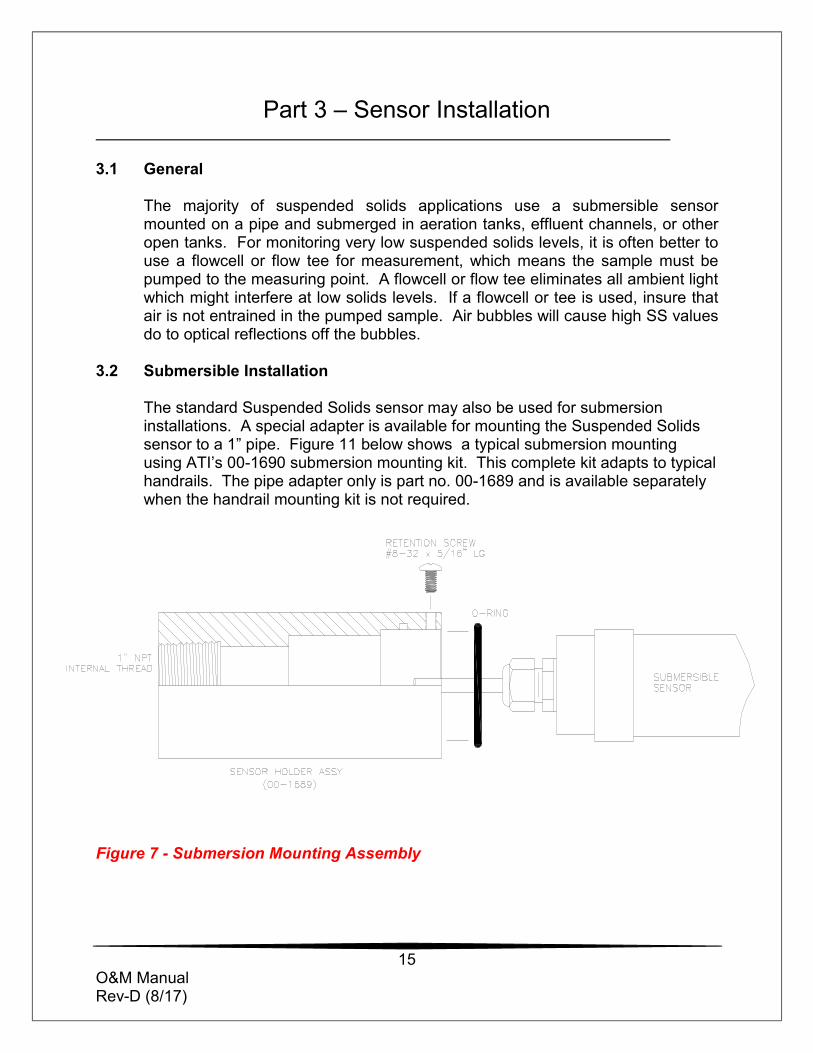
3.2 Submersible Installation
The standard Suspended Solids sensor may also be used for submersion installations. A special adapter is available for mounting the Suspended Solids sensor to a 1” pipe. Figure 11 below shows a typical submersion mounting using ATI’s 00-1690 submersion mounting kit. This complete kit adapts to typical handrails. The pipe adapter only is part no. 00-1689 and is available separately when the handrail mounting kit is not required.
Figure 7 - Submersion Mounting Assembly
ATI Q46/88 Suspended Solids Monitor Part 3 – Sensor Installation
16
O&M Manual Rev-D (8/17)
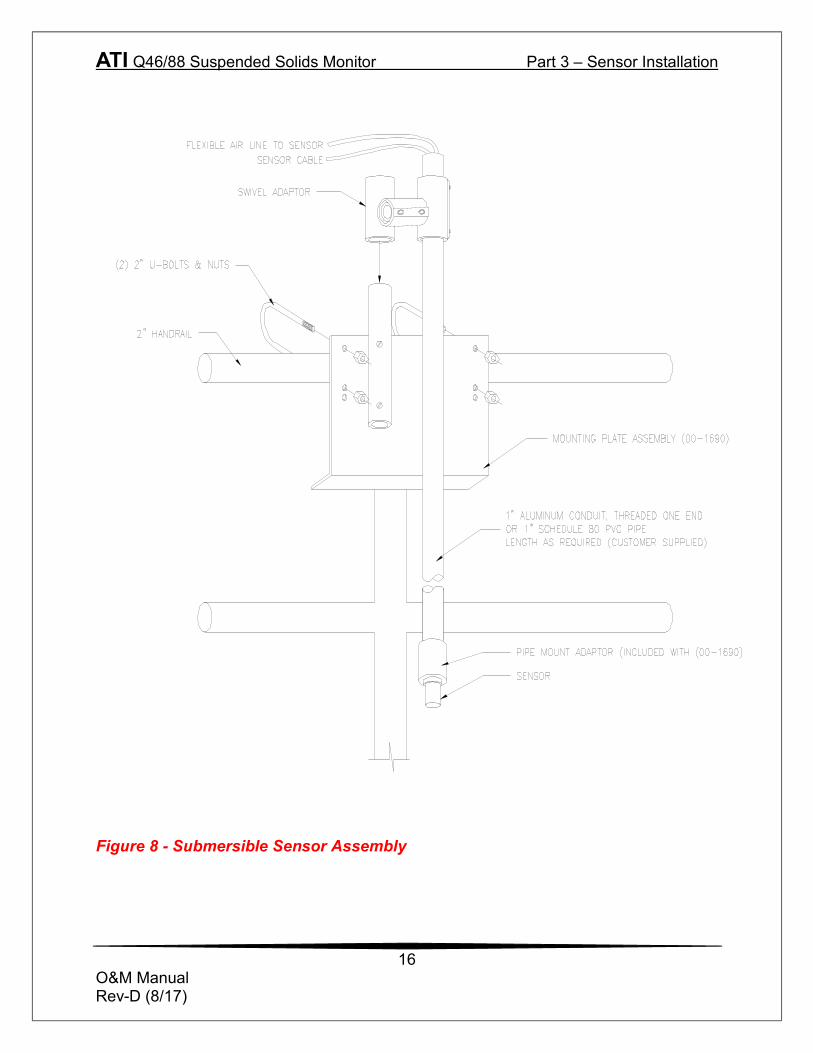
Figure 8 - Submersible Sensor Assembly
ATI Q46/88 Suspended Solids Monitor Part 3 – Sensor Installation
17
O&M Manual Rev-D (8/17)
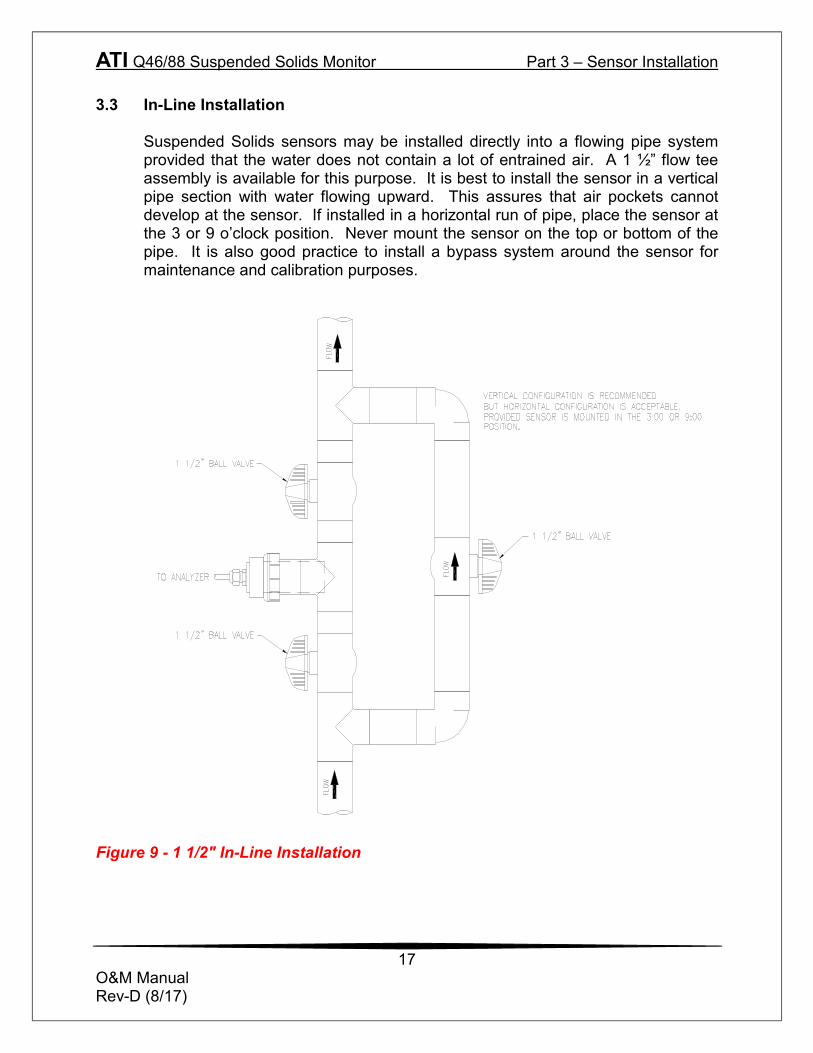
3.3 In-Line Installation
Suspended Solids sensors may be installed directly into a flowing pipe system provided that the water does not contain a lot of entrained air. A 1 ½” flow tee assembly is available for this purpose. It is best to install the sensor in a vertical pipe section with water flowing upward. This assures that air pockets cannot develop at the sensor. If installed in a horizontal run of pipe, place the sensor at the 3 or 9 o’clock position. Never mount the sensor on the top or bottom of the pipe. It is also good practice to install a bypass system around the sensor for maintenance and calibration purposes.
Figure 9 - 1 1/2" In-Line Installation
ATI Q46/88 Suspended Solids Monitor Part 3 – Sensor Installation
18
O&M Manual Rev-D (8/17)
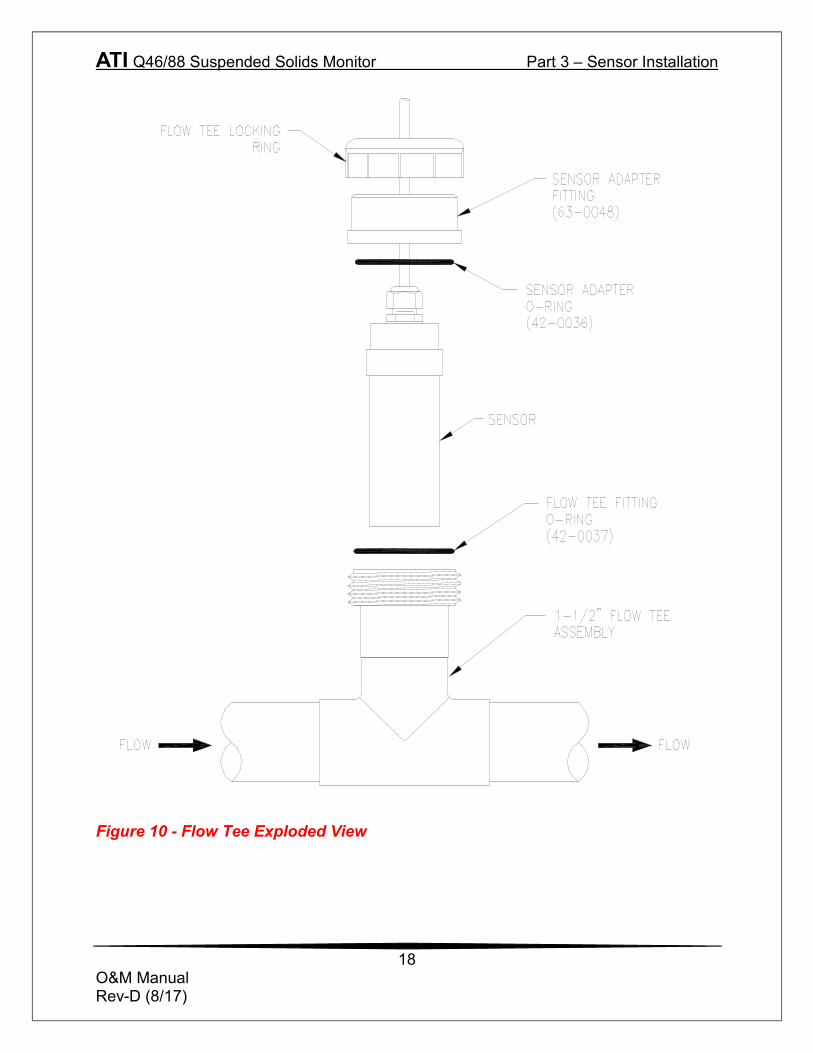
Figure 10 - Flow Tee Exploded View
ATI Q46/88 Suspended Solids Monitor Part 3 – Sensor Installation
19
O&M Manual Rev-D (8/17)
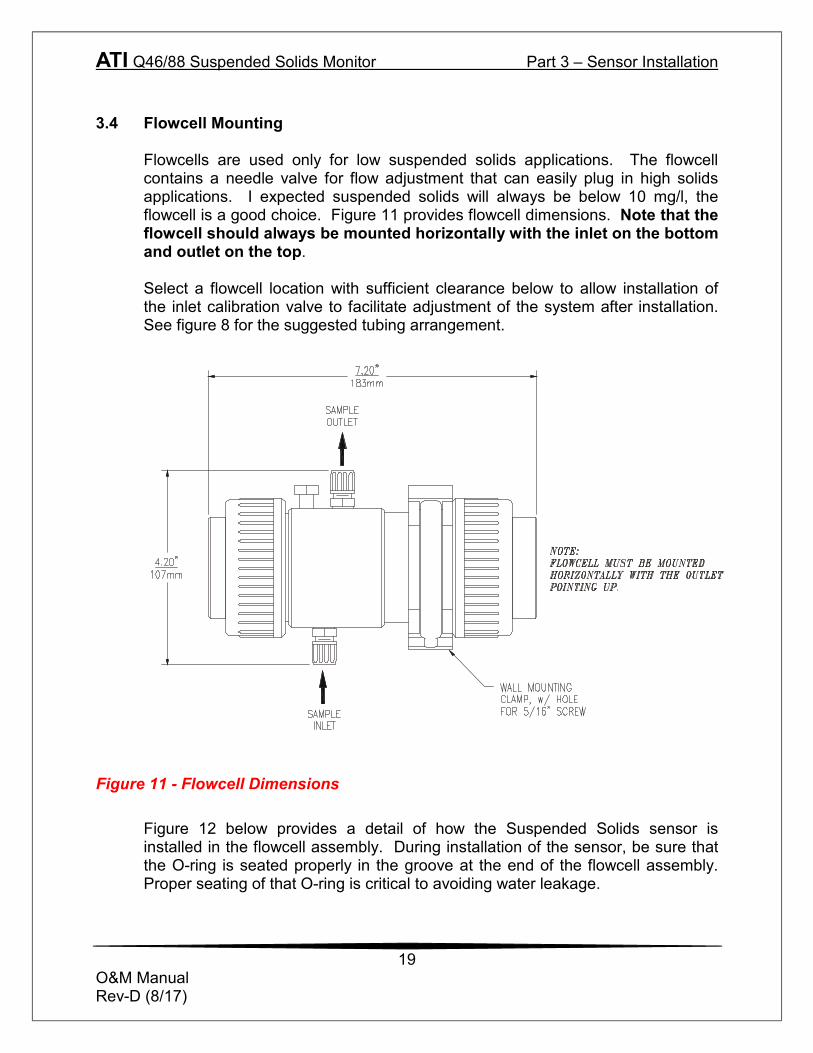
3.4 Flowcell Mounting
Flowcells are used only for low suspended solids applications. The flowcell contains a needle valve for flow adjustment that can easily plug in high solids applications. I expected suspended solids will always be below 10 mg/l, the flowcell is a good choice. Figure 11 provides flowcell dimensions. Note that the flowcell should always be mounted horizontally with the inlet on the bottom and outlet on the top. Select a flowcell location with sufficient clearance below to allow installation of the inlet calibration valve to facilitate adjustment of the system after installation. See figure 8 for the suggested tubing arrangement.
Figure 11 - Flowcell Dimensions
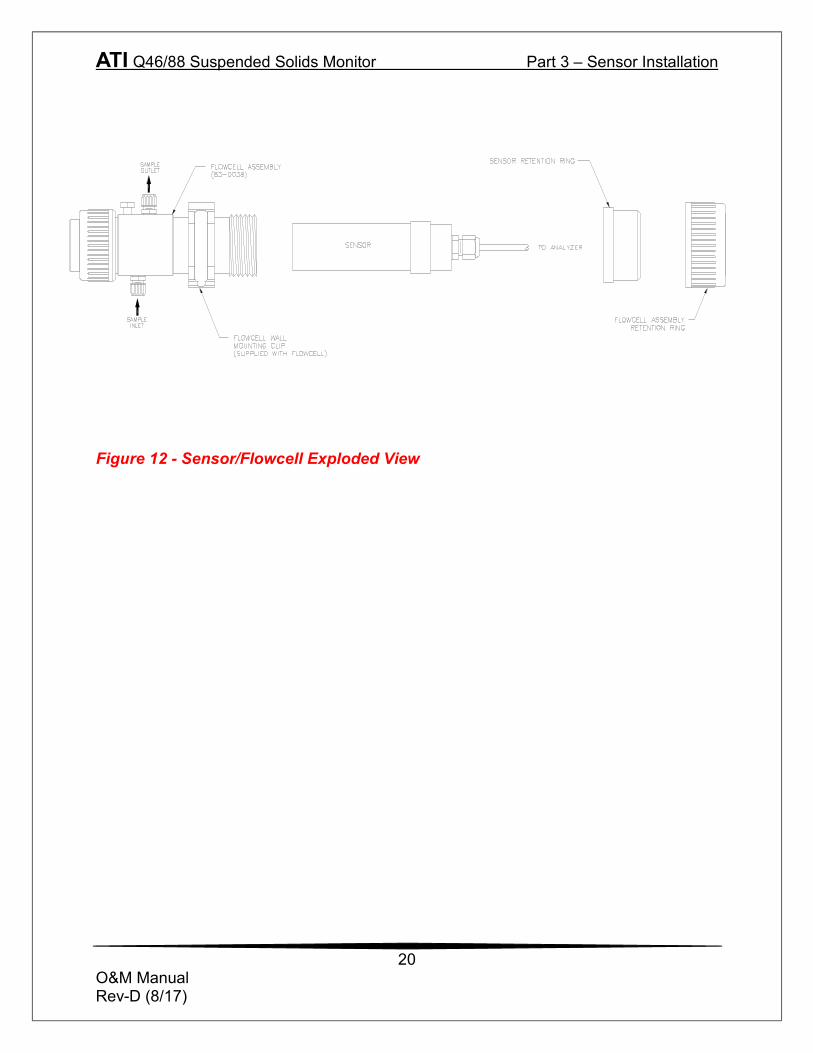
Figure 12 below provides a detail of how the Suspended Solids sensor is installed in the flowcell assembly. During installation of the sensor, be sure that the O-ring is seated properly in the groove at the end of the flowcell assembly. Proper seating of that O-ring is critical to avoiding water leakage.
ATI Q46/88 Suspended Solids Monitor Part 3 – Sensor Installation
20
O&M Manual Rev-D (8/17)
Figure 12 - Sensor/Flowcell Exploded View
21
O&M Manual Rev-D (8/17)
Part 4 – Electrical Installation 4.1 General
The Q46 is powered in one of two ways, depending on the version purchased. The 12-24 VDC powered analyzer requires a customer supplied DC power supply. The 90-260 VAC version requires line power. Please verify the type of unit before connecting any power.
WARNING: Do not connect AC line power to the DC version. Severe damage will result.
Important Notes:
1. Use wiring practices that conform to national, state and local electrical
codes. For proper safety as well as stable measuring performance, it is important that the earth ground connection be made to a solid ground point on TB7. The AC power supply in the transmitter contains a single 630mA slo-blo fuse (Wickmann/Littlefuse #372-0630). The fuse F1 is located adjacent to TB7 and is easily replaceable.
2. Do NOT run sensor cables or instrument 4-20 mA output wiring in the
same conduit that contains AC power wiring. AC power wiring should be run in a dedicated conduit to prevent electrical noise from coupling with the instrumentation signals.
3. This analyzer must be installed by specifically trained personnel in
accordance with relevant local codes and instructions contained in this operating manual. Observe the analyzer's technical specifications and input ratings. Proper electrical disconnection means must be provided prior to the electrical power connected to this instrument, such as a circuit breaker - rated 250 VAC, 2 A minimum. If one line of the line power mains is not neutral, use a double-pole mains switch to disconnect the analyzer.
4. Repeated problems with lightning strikes damaging sensitive
instrumentation are often attributed to poorly bonded earth grounds in the instrument power source. The protection schemes incorporated into this analyzer cannot operate to maximum efficiency unless the ground connection is at its’ absolute lowest impedance.
ATI Q46/88 Suspended Solids Monitor Part 4 – Electrical Installation
22
O&M Manual Rev-D (8/17)
5. There is no standard ground resistance universally recognized.
Many agencies recommend a ground resistance value of 5 ohms or less. The NEC recommends an impedance to ground of less than 25 ohms, and less than 5 ohms where sensitive equipment is installed. Power sources feeding sensitive instruments like the Q46H/79PR should have the lowest possible impedance to ground.
4.2 AC Wiring
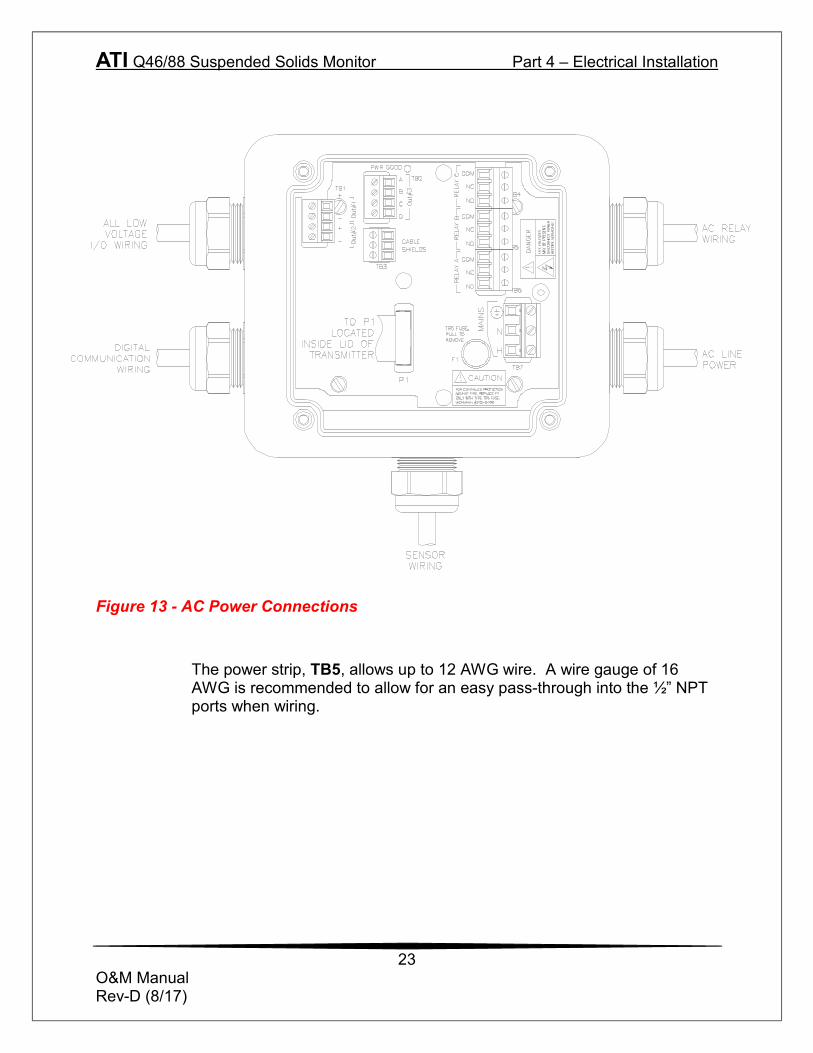
Verify the AC power supply requirement before installing. Also verify that power is fully disconnected before attempting to wire. Q46 systems are supplied with 5 cable gland fittings for sealing cable entries. Connect HOT, NEUTRAL, and GROUND to the matching designations on terminal strip TB7.
The analog outputs from the system are present at terminals TB1 and TB2. The loop-load limitation in this configuration is 450 Ohms maximum for output 1 and 1000 ohms maximum for output 2. Also note that these two outputs are completely isolated from each other to insure that ground loops do not result from the connection of both outputs to the same device such as a PLC or DCS. A ribbon cable connects the power supply assembly with the microprocessor assembly located in the front section of the enclosure. This cable may be unplugged from the front section of the monitor if service is needed, but should normally be left in place during installation.
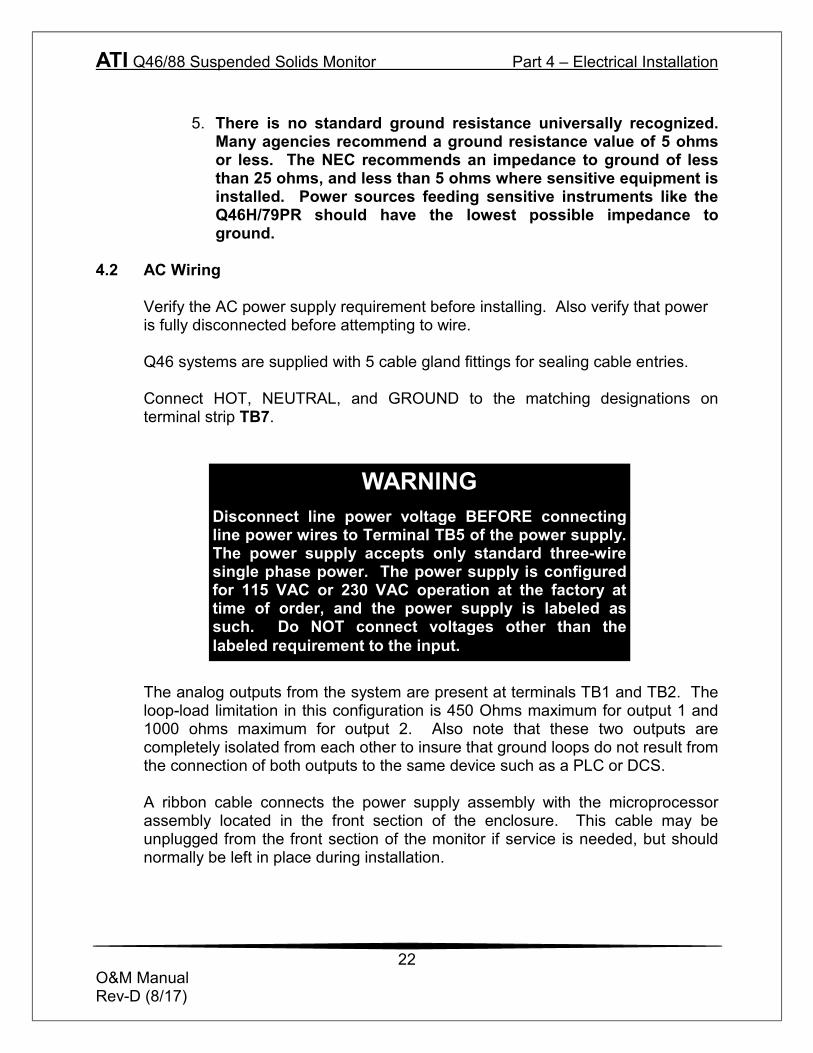
WARNING Disconnect line power voltage BEFORE connecting line power wires to Terminal TB5 of the power supply. The power supply accepts only standard three-wire single phase power. The power supply is configured for 115 VAC or 230 VAC operation at the factory at time of order, and the power supply is labeled as such. Do NOT connect voltages other than the labeled requirement to the input.
ATI Q46/88 Suspended Solids Monitor Part 4 – Electrical Installation
23
O&M Manual Rev-D (8/17)
Figure 13 - AC Power Connections The power strip, TB5, allows up to 12 AWG wire. A wire gauge of 16 AWG is recommended to allow for an easy pass-through into the ½” NPT ports when wiring.
ATI Q46/88 Suspended Solids Monitor Part 4 – Electrical Installation
24
O&M Manual Rev-D (8/17)
4.3 Relay Connection
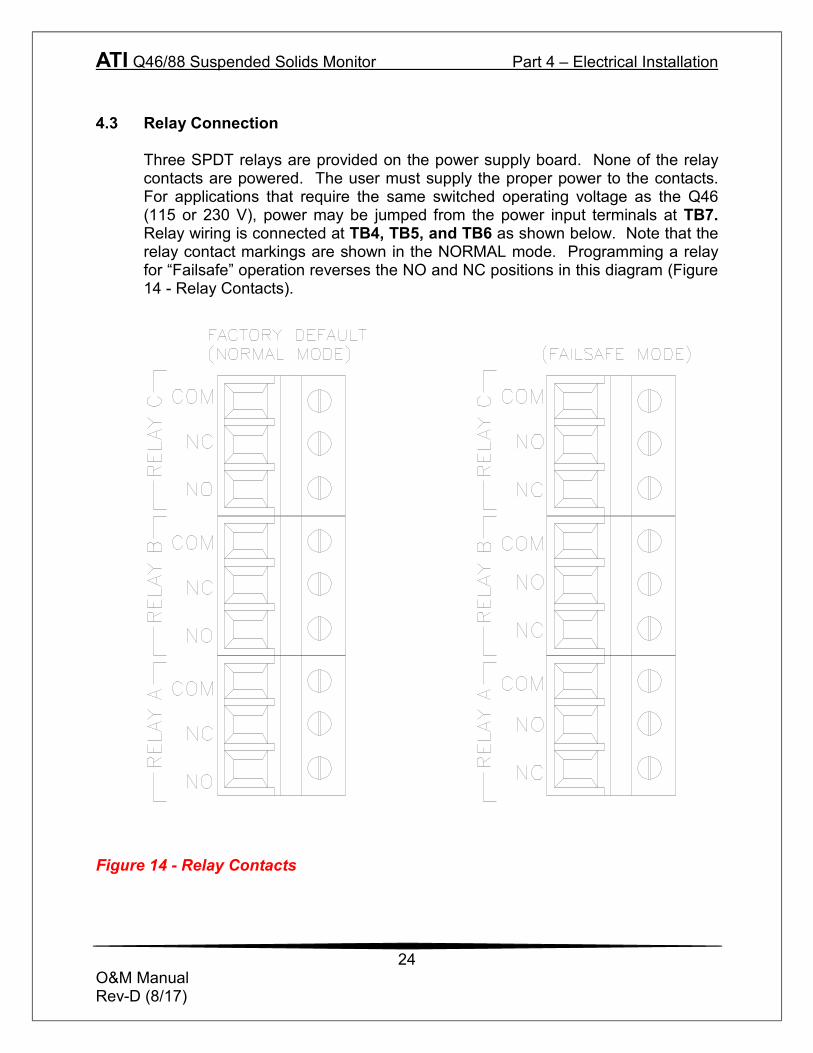
Three SPDT relays are provided on the power supply board. None of the relay contacts are powered. The user must supply the proper power to the contacts. For applications that require the same switched operating voltage as the Q46 (115 or 230 V), power may be jumped from the power input terminals at TB7. Relay wiring is connected at TB4, TB5, and TB6 as shown below. Note that the relay contact markings are shown in the NORMAL mode. Programming a relay for “Failsafe” operation reverses the NO and NC positions in this diagram (Figure 14 - Relay Contacts).
Figure 14 - Relay Contacts
ATI Q46/88 Suspended Solids Monitor Part 4 – Electrical Installation
25
O&M Manual Rev-D (8/17)
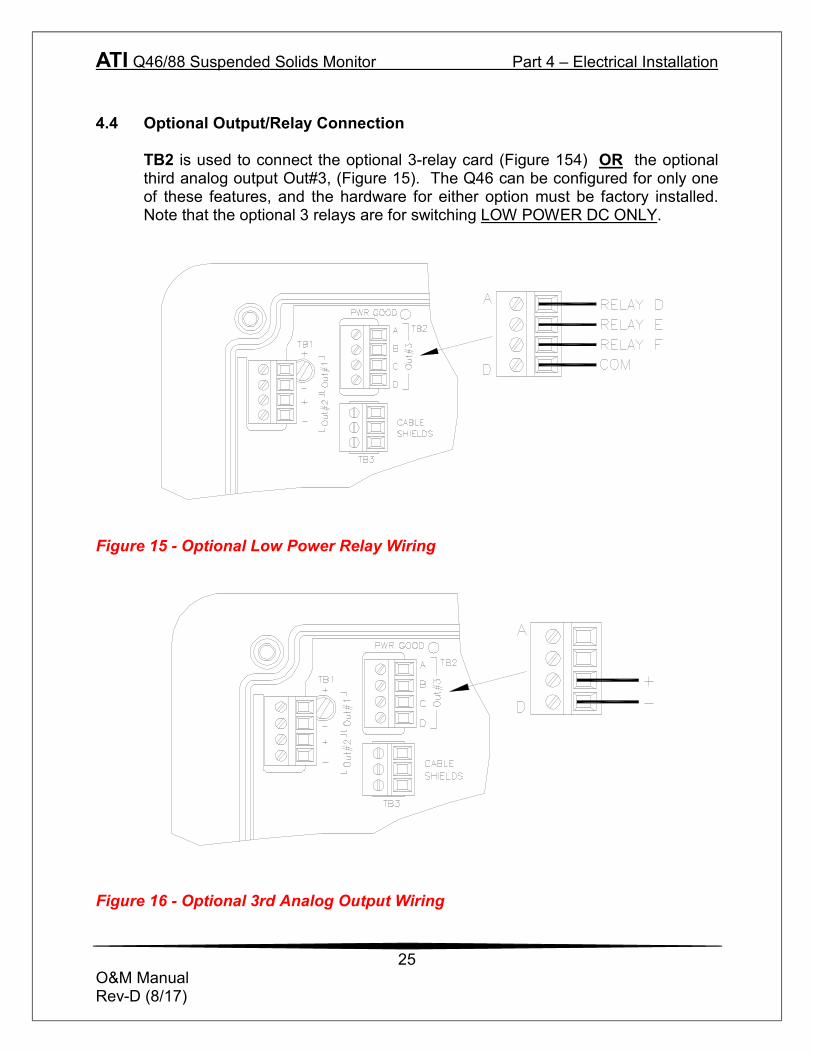
4.4 Optional Output/Relay Connection
TB2 is used to connect the optional 3-relay card (Figure 154) OR the optional third analog output Out#3, (Figure 15). The Q46 can be configured for only one of these features, and the hardware for either option must be factory installed. Note that the optional 3 relays are for switching LOW POWER DC ONLY.
Figure 15 - Optional Low Power Relay Wiring
Figure 16 - Optional 3rd Analog Output Wiring
ATI Q46/88 Suspended Solids Monitor Part 4 – Electrical Installation
26
O&M Manual Rev-D (8/17)
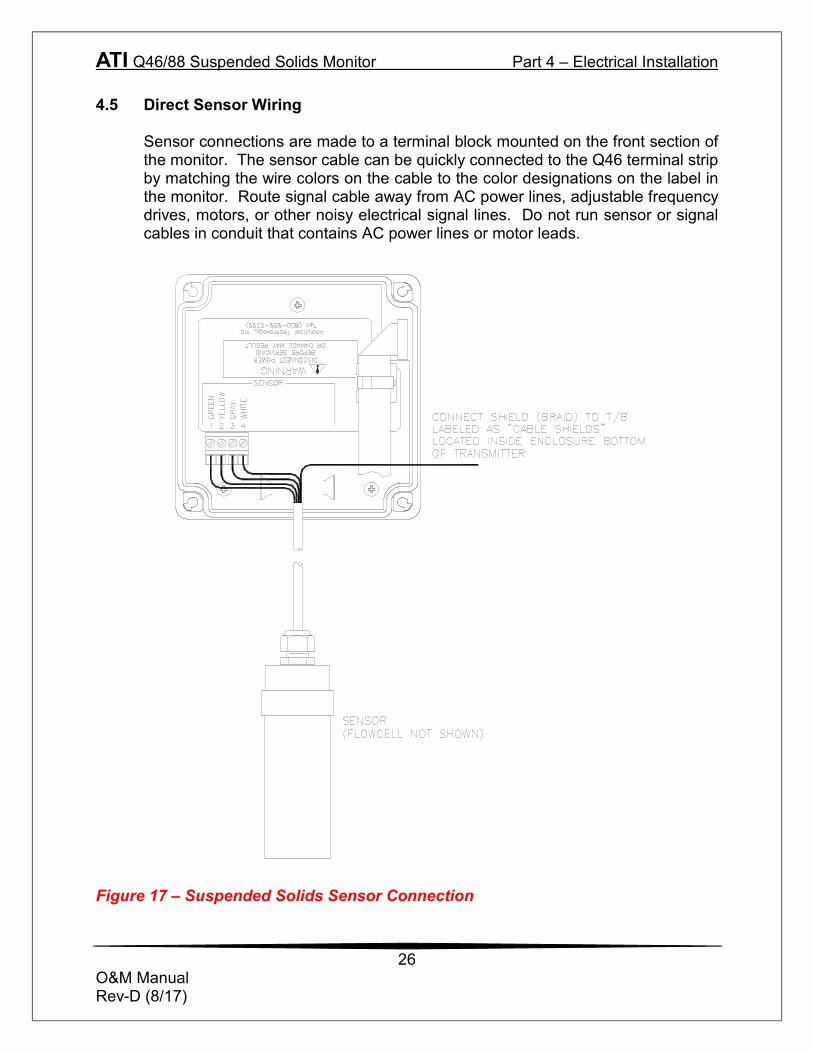
4.5 Direct Sensor Wiring Sensor connections are made to a terminal block mounted on the front section of
the monitor. The sensor cable can be quickly connected to the Q46 terminal strip by matching the wire colors on the cable to the color designations on the label in the monitor. Route signal cable away from AC power lines, adjustable frequency drives, motors, or other noisy electrical signal lines. Do not run sensor or signal cables in conduit that contains AC power lines or motor leads.
Figure 17 – Suspended Solids Sensor Connection
ATI Q46/88 Suspended Solids Monitor Part 4 – Electrical Installation
27
O&M Manual Rev-D (8/17)
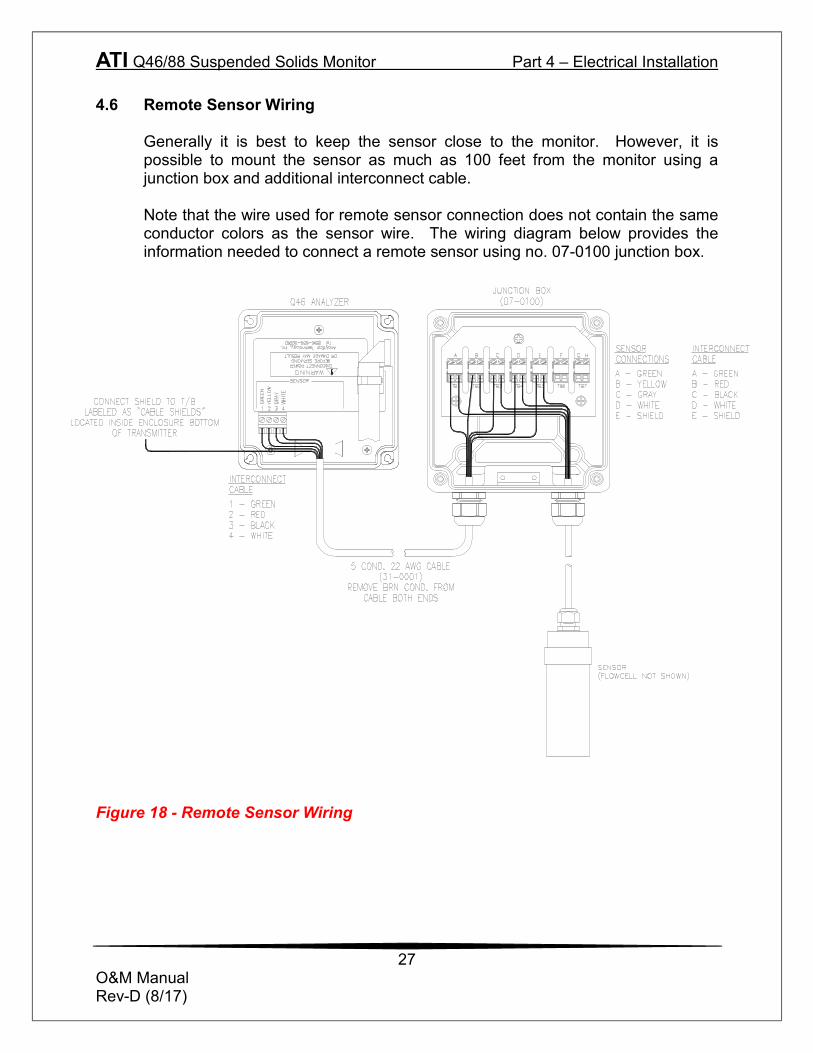
4.6 Remote Sensor Wiring
Generally it is best to keep the sensor close to the monitor. However, it is possible to mount the sensor as much as 100 feet from the monitor using a junction box and additional interconnect cable.
Note that the wire used for remote sensor connection does not contain the same conductor colors as the sensor wire. The wiring diagram below provides the information needed to connect a remote sensor using no. 07-0100 junction box.
Figure 18 - Remote Sensor Wiring
28
O&M Manual Rev-D (8/17)
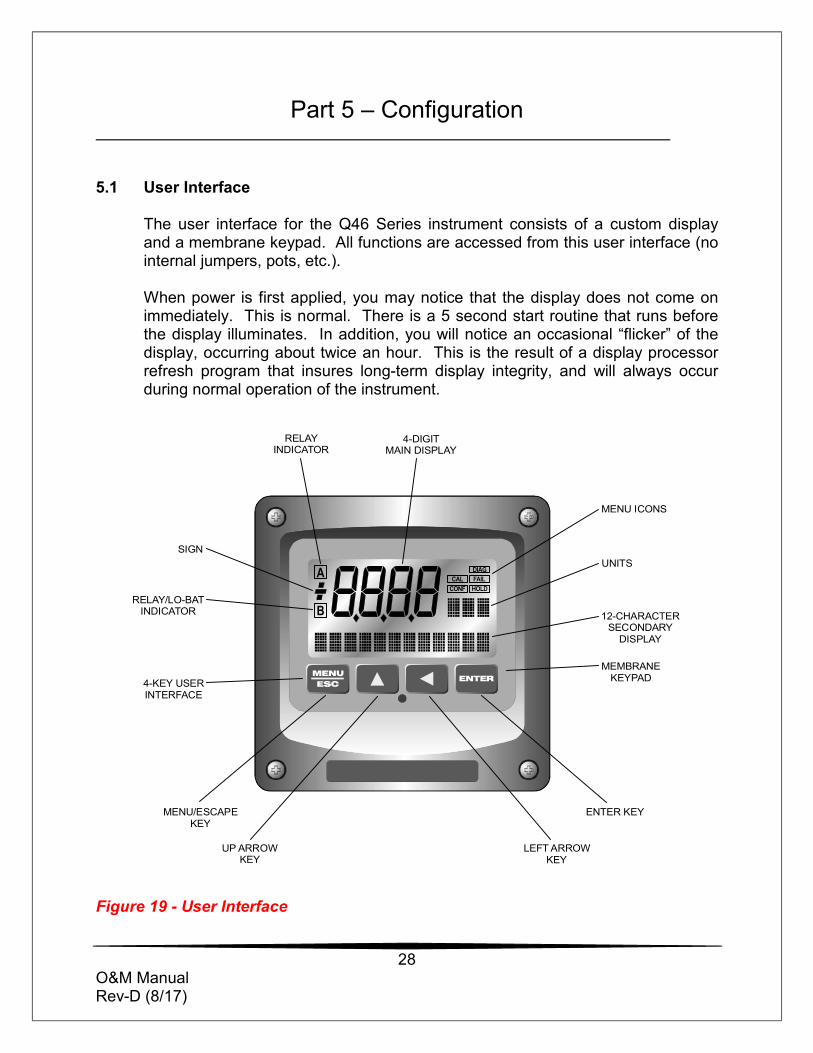
Part 5 – Configuration 5.1 User Interface
The user interface for the Q46 Series instrument consists of a custom display and a membrane keypad. All functions are accessed from this user interface (no internal jumpers, pots, etc.). When power is first applied, you may notice that the display does not come on immediately. This is normal. There is a 5 second start routine that runs before the display illuminates. In addition, you will notice an occasional “flicker” of the display, occurring about twice an hour. This is the result of a display processor refresh program that insures long-term display integrity, and will always occur during normal operation of the instrument.
Figure 19 - User Interface
MENU ICONS
UNITS
12-CHARACTERSECONDARY
DISPLAY
MEMBRANEKEYPAD
MENUESC
ENTER
A
B
DIAGFAILHOLD
CALCONF
MENU ICONS
UNITS
12-CHARACTERSECONDARY
DISPLAY
MEMBRANEKEYPAD
ENTER KEY
LEFT ARROWKEY
4-DIGITMAIN DISPLAY
MENU/ESCAPEKEY
UP ARROWKEY
SIGN
RELAY/LO-BATINDICATOR
4-KEY USERINTERFACE
RELAYINDICATOR
ATI Q46/88 Suspended Solids Monitor Part 5 – Configuration
29
O&M Manual Rev-D (8/17)
5.11 Keys All user configurations occur through the use of four membrane keys. These keys are used as follows:
MENU/ESC To scroll through the menu section headers or to escape from anywhere in software. The escape sequence allows the user to back out of any changes in a logical manner. Using the escape key aborts all changes to the current screen and backs the user out one level in the software tree. The manual will refer to this key as either MENU or ESC, depending upon its particular function. In the battery-powered version of the Q46, this is also the ON button.
UP (arrow) To scroll through individual list or display items and to
change number values. LEFT (arrow) To move the cursor from right to left during changes to a
number value. ENTER To select a menu section or list item for change and to store
any change. 5.12 Display
The large custom display provides clear information for general measurement use and user configuration. There are three main areas of the display: the main parameter display, the secondary message line, and the icon area.
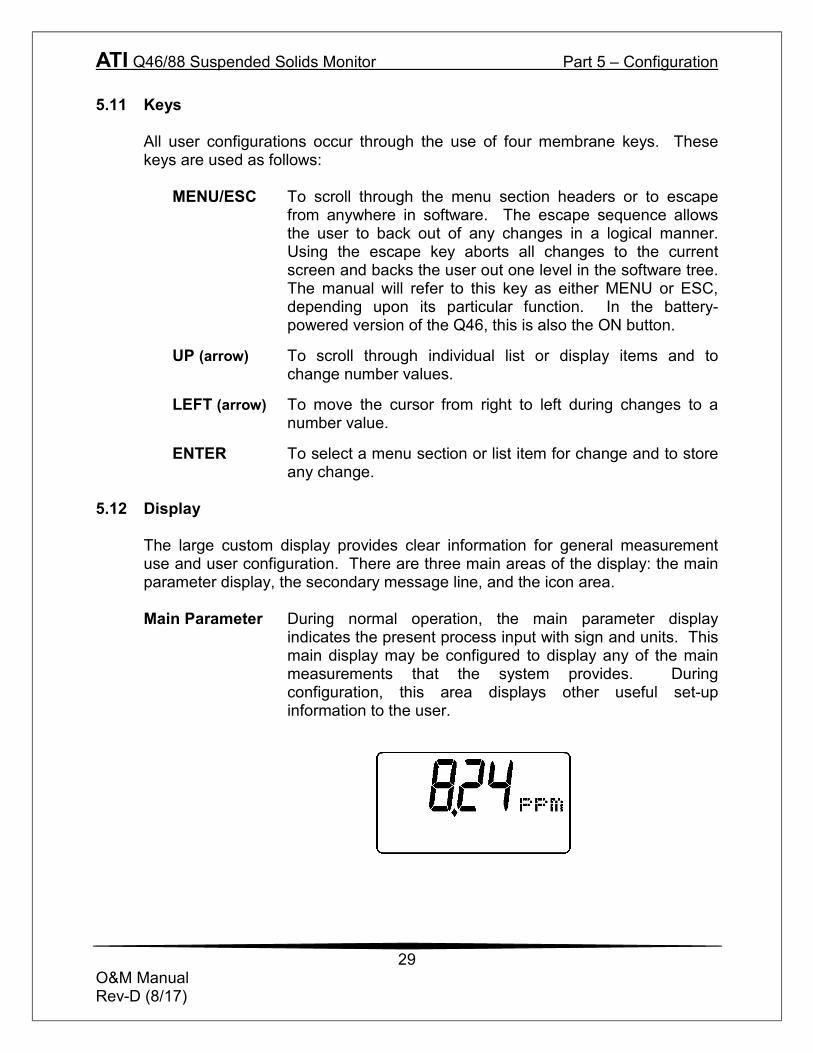
Main Parameter During normal operation, the main parameter display
indicates the present process input with sign and units. This main display may be configured to display any of the main measurements that the system provides. During configuration, this area displays other useful set-up information to the user.
ATI Q46/88 Suspended Solids Monitor Part 5 - Configuration
30
O&M Manual Rev-D (8/17)
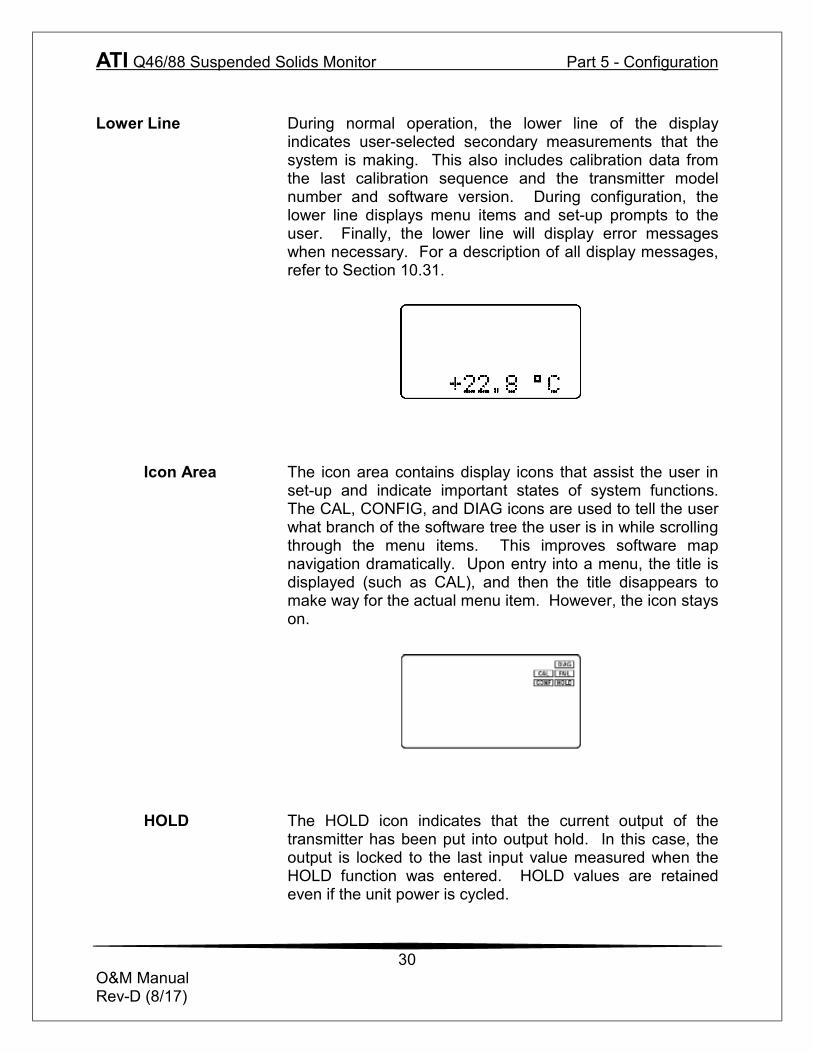
Lower Line During normal operation, the lower line of the display
indicates user-selected secondary measurements that the system is making. This also includes calibration data from the last calibration sequence and the transmitter model number and software version. During configuration, the lower line displays menu items and set-up prompts to the user. Finally, the lower line will display error messages when necessary. For a description of all display messages, refer to Section 10.31.
Icon Area The icon area contains display icons that assist the user in
set-up and indicate important states of system functions. The CAL, CONFIG, and DIAG icons are used to tell the user what branch of the software tree the user is in while scrolling through the menu items. This improves software map navigation dramatically. Upon entry into a menu, the title is displayed (such as CAL), and then the title disappears to make way for the actual menu item. However, the icon stays on.
HOLD The HOLD icon indicates that the current output of the
transmitter has been put into output hold. In this case, the output is locked to the last input value measured when the HOLD function was entered. HOLD values are retained even if the unit power is cycled.
ATI Q46/88 Suspended Solids Monitor Part 5 - Configuration
31
O&M Manual Rev-D (8/17)
FAIL The FAIL icon indicates that the system diagnostic function has detected a problem that requires immediate attention. This icon is automatically cleared once the problem has been resolved.
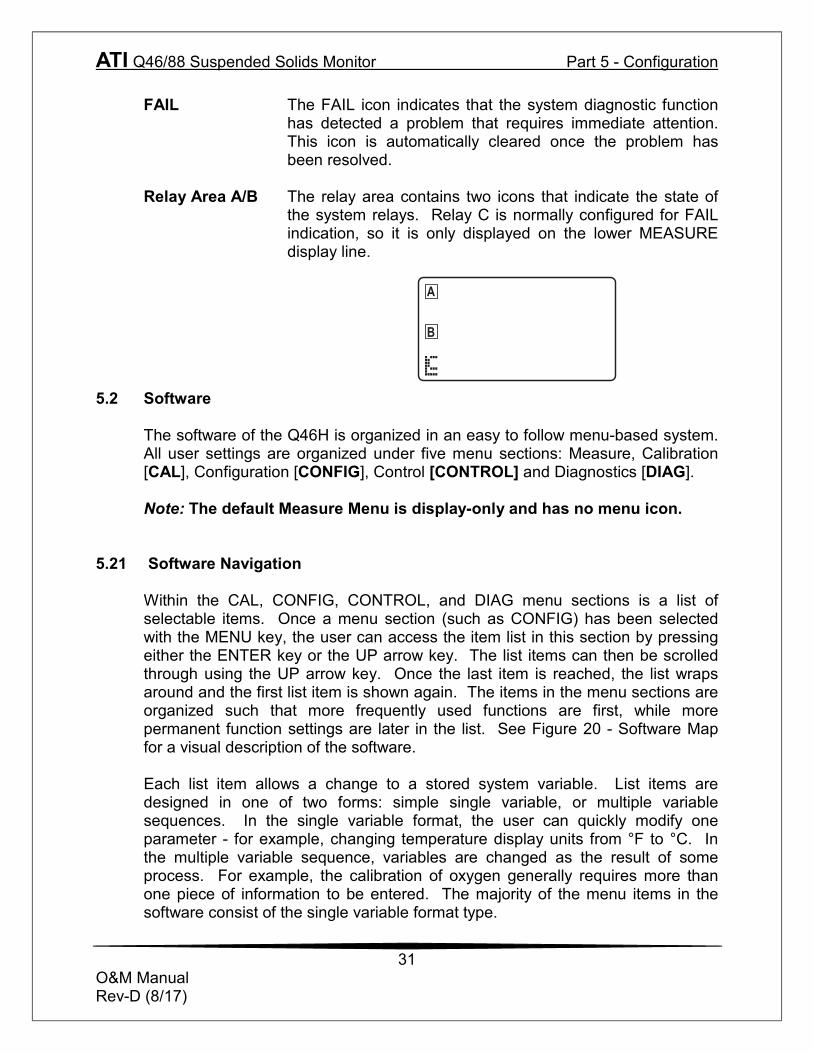
Relay Area A/B The relay area contains two icons that indicate the state of
the system relays. Relay C is normally configured for FAIL indication, so it is only displayed on the lower MEASURE display line.
5.2 Software
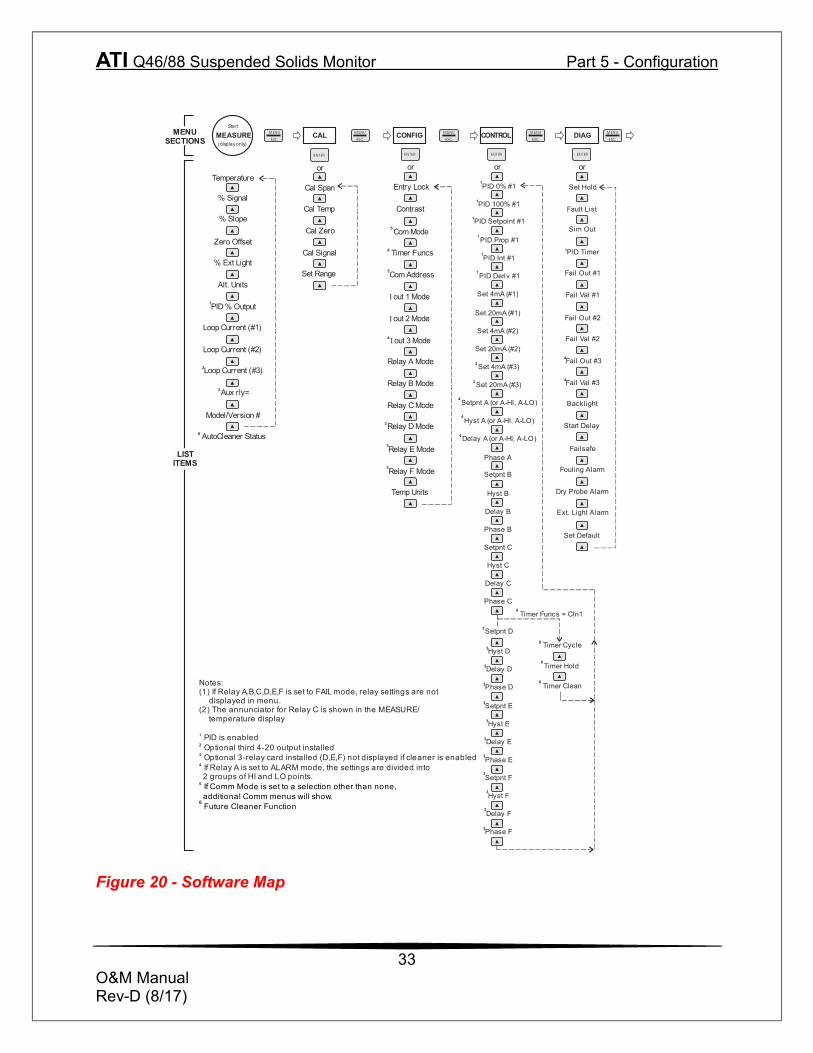
The software of the Q46H is organized in an easy to follow menu-based system. All user settings are organized under five menu sections: Measure, Calibration [CAL], Configuration [CONFIG], Control [CONTROL] and Diagnostics [DIAG]. Note: The default Measure Menu is display-only and has no menu icon.
5.21 Software Navigation
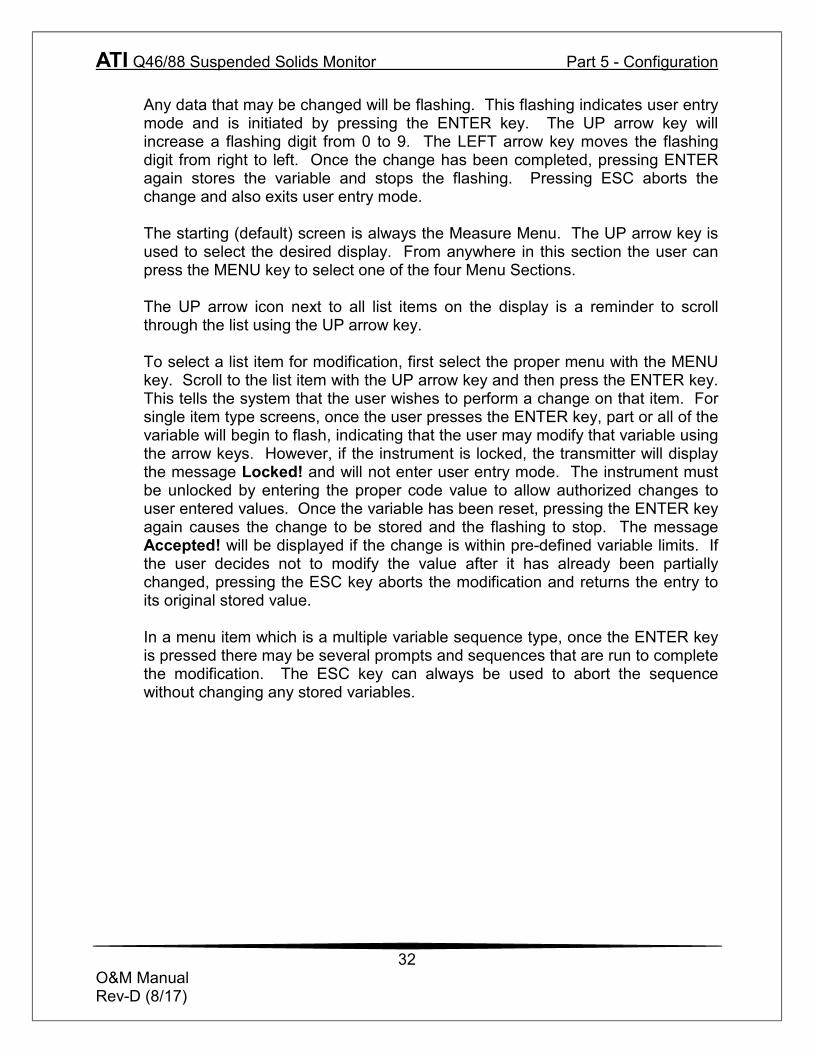
Within the CAL, CONFIG, CONTROL, and DIAG menu sections is a list of selectable items. Once a menu section (such as CONFIG) has been selected with the MENU key, the user can access the item list in this section by pressing either the ENTER key or the UP arrow key. The list items can then be scrolled through using the UP arrow key. Once the last item is reached, the list wraps around and the first list item is shown again. The items in the menu sections are organized such that more frequently used functions are first, while more permanent function settings are later in the list. See Figure 20 - Software Map for a visual description of the software.
Each list item allows a change to a stored system variable. List items are designed in one of two forms: simple single variable, or multiple variable sequences. In the single variable format, the user can quickly modify one parameter - for example, changing temperature display units from °F to °C. In the multiple variable sequence, variables are changed as the result of some process. For example, the calibration of oxygen generally requires more than one piece of information to be entered. The majority of the menu items in the software consist of the single variable format type.
A
B
ATI Q46/88 Suspended Solids Monitor Part 5 - Configuration
32
O&M Manual Rev-D (8/17)
Any data that may be changed will be flashing. This flashing indicates user entry mode and is initiated by pressing the ENTER key. The UP arrow key will increase a flashing digit from 0 to 9. The LEFT arrow key moves the flashing digit from right to left. Once the change has been completed, pressing ENTER again stores the variable and stops the flashing. Pressing ESC aborts the change and also exits user entry mode. The starting (default) screen is always the Measure Menu. The UP arrow key is used to select the desired display. From anywhere in this section the user can press the MENU key to select one of the four Menu Sections. The UP arrow icon next to all list items on the display is a reminder to scroll through the list using the UP arrow key. To select a list item for modification, first select the proper menu with the MENU key. Scroll to the list item with the UP arrow key and then press the ENTER key. This tells the system that the user wishes to perform a change on that item. For single item type screens, once the user presses the ENTER key, part or all of the variable will begin to flash, indicating that the user may modify that variable using the arrow keys. However, if the instrument is locked, the transmitter will display the message Locked! and will not enter user entry mode. The instrument must be unlocked by entering the proper code value to allow authorized changes to user entered values. Once the variable has been reset, pressing the ENTER key again causes the change to be stored and the flashing to stop. The message Accepted! will be displayed if the change is within pre-defined variable limits. If the user decides not to modify the value after it has already been partially changed, pressing the ESC key aborts the modification and returns the entry to its original stored value. In a menu item which is a multiple variable sequence type, once the ENTER key is pressed there may be several prompts and sequences that are run to complete the modification. The ESC key can always be used to abort the sequence without changing any stored variables.
ATI Q46/88 Suspended Solids Monitor Part 5 - Configuration
33
O&M Manual Rev-D (8/17)
Start
MEASURE(display only)
CAL CONFIG DIAG
ENT ER
M ENU
ESC
or or or
Cal Span 1PID 0% #1 Set Hold
Cal Temp1PID 100% #1
1PID Setpoint #1
1PID Prop #1
Fault List
Sim Out
Fail Out #1
Fail Val #1
Fail Out #2
Temperature
1PID % Output
Loop Current (#1)
LISTITEMS
Loop Current (#2)
Set Default
2Loop Current (#3)
CONTROL
Fail Val #2
Failsafe
1PID Int #1
1PID Deriv #1
Set 4mA (#1)
Set 20mA (#1)
or
Entry Lock
Contrast
I out 1 Mode
I out 2 Mode
Relay B Mode
Temp Units
Set 4mA (#2)
Set 20mA (#2)
% Signal
3Aux rly=
1PID Timer
MENUSECTIONS
6 AutoCleaner Status
M ENU
ESC
ENTER
M ENU
ESC
M ENU
ESC
M ENU
ESC
ENT ER ENT ER
Relay A Mode
4 I out 3 Mode
Relay C Mode
3Relay E Mode
3Relay D Mode
3Relay F Mode
5Com Mode
5Com Address
2 Set 4mA (#3)
2 Set 20mA (#3)
4Setpnt A (or A-HI, A-LO)
4Hyst A (or A-HI, A-LO)
4 Delay A (or A-HI, A-LO)
Phase A
Setpnt B
Hyst B
Delay B
Phase B
Setpnt C
Hyst C
Delay C
Phase C
3Setpnt D
3Hyst D
3Delay D
3Phase D
3Setpnt E
3Hyst E
3Delay E
3Phase E
3Setpnt F
3Hyst F
3Delay F
3Phase F
4Fail Out #3
4Fail Val #3
Backlight
Notes:(1) If Relay A,B,C,D,E,F is set to FAIL mode, relay settings are not displayed in menu.(2) The annunciator for Relay C is shown in the MEASURE/ temperature display
PID is enabled1
Optional third 4-20 output installed2
Optional 3-relay card installed (D,E,F) not displayed if cleaner is enabled3
If Relay A is set to ALARM mode, the settings are divided into4
2 groups of HI and LO points.5 If Comm Mode is set to a selection other than none, additional Comm menus will show. Future Cleaner Function 6
Start Delay
6 Timer Funcs
6 Timer Funcs = Cln1
6 Timer Cycle
6 Timer Hold
6 Timer Clean
% Slope
Zero Offset
% Ext Light
Alt. Units
Cal Zero
Cal Signal
Set Range
Fouling Alarm
Dry Probe Alarm
Ext. Light Alarm
Model/Version #
Figure 20 - Software Map
ATI Q46/88 Suspended Solids Monitor Part 5 - Configuration
34
O&M Manual Rev-D (8/17)
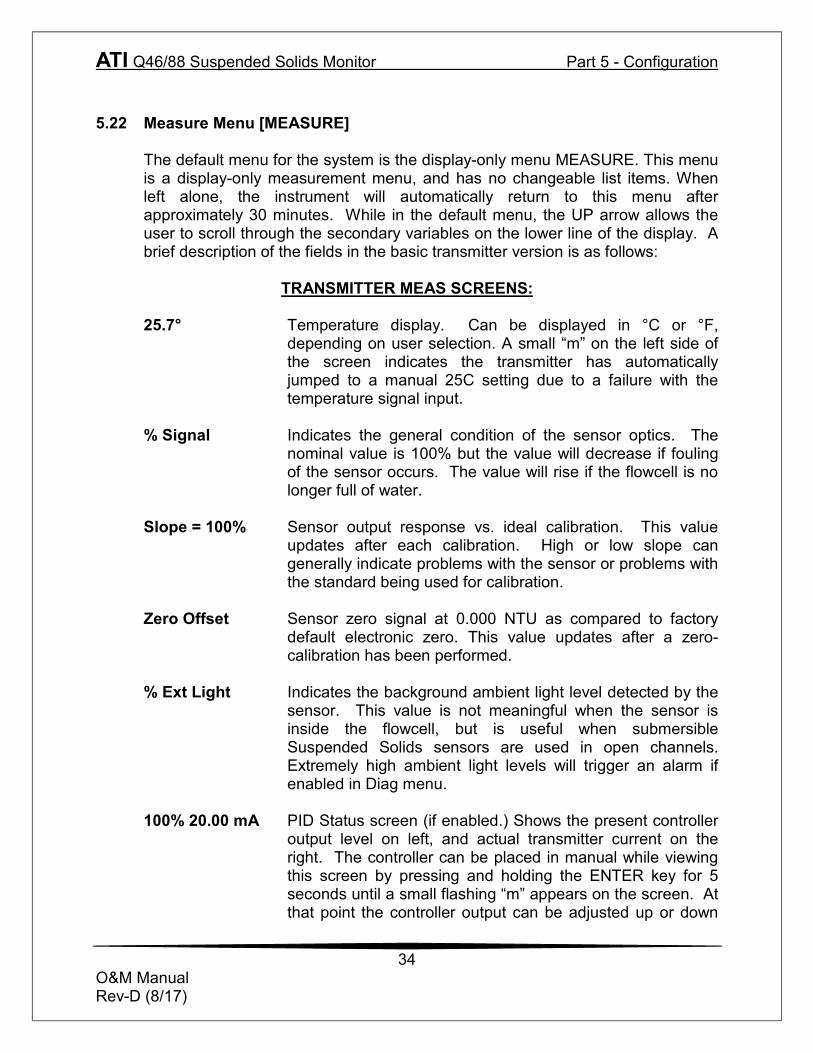
5.22 Measure Menu [MEASURE]
The default menu for the system is the display-only menu MEASURE. This menu is a display-only measurement menu, and has no changeable list items. When left alone, the instrument will automatically return to this menu after approximately 30 minutes. While in the default menu, the UP arrow allows the user to scroll through the secondary variables on the lower line of the display. A brief description of the fields in the basic transmitter version is as follows:
TRANSMITTER MEAS SCREENS:
25.7° Temperature display. Can be displayed in °C or °F,
depending on user selection. A small “m” on the left side of the screen indicates the transmitter has automatically jumped to a manual 25C setting due to a failure with the temperature signal input.
% Signal Indicates the general condition of the sensor optics. The
nominal value is 100% but the value will decrease if fouling of the sensor occurs. The value will rise if the flowcell is no longer full of water.
Slope = 100% Sensor output response vs. ideal calibration. This value
updates after each calibration. High or low slope can generally indicate problems with the sensor or problems with the standard being used for calibration.
Zero Offset Sensor zero signal at 0.000 NTU as compared to factory
default electronic zero. This value updates after a zero-calibration has been performed.
% Ext Light Indicates the background ambient light level detected by the
sensor. This value is not meaningful when the sensor is inside the flowcell, but is useful when submersible Suspended Solids sensors are used in open channels. Extremely high ambient light levels will trigger an alarm if enabled in Diag menu.
100% 20.00 mA PID Status screen (if enabled.) Shows the present controller
output level on left, and actual transmitter current on the right. The controller can be placed in manual while viewing this screen by pressing and holding the ENTER key for 5 seconds until a small flashing “m” appears on the screen. At that point the controller output can be adjusted up or down
ATI Q46/88 Suspended Solids Monitor Part 5 - Configuration
35
O&M Manual Rev-D (8/17)
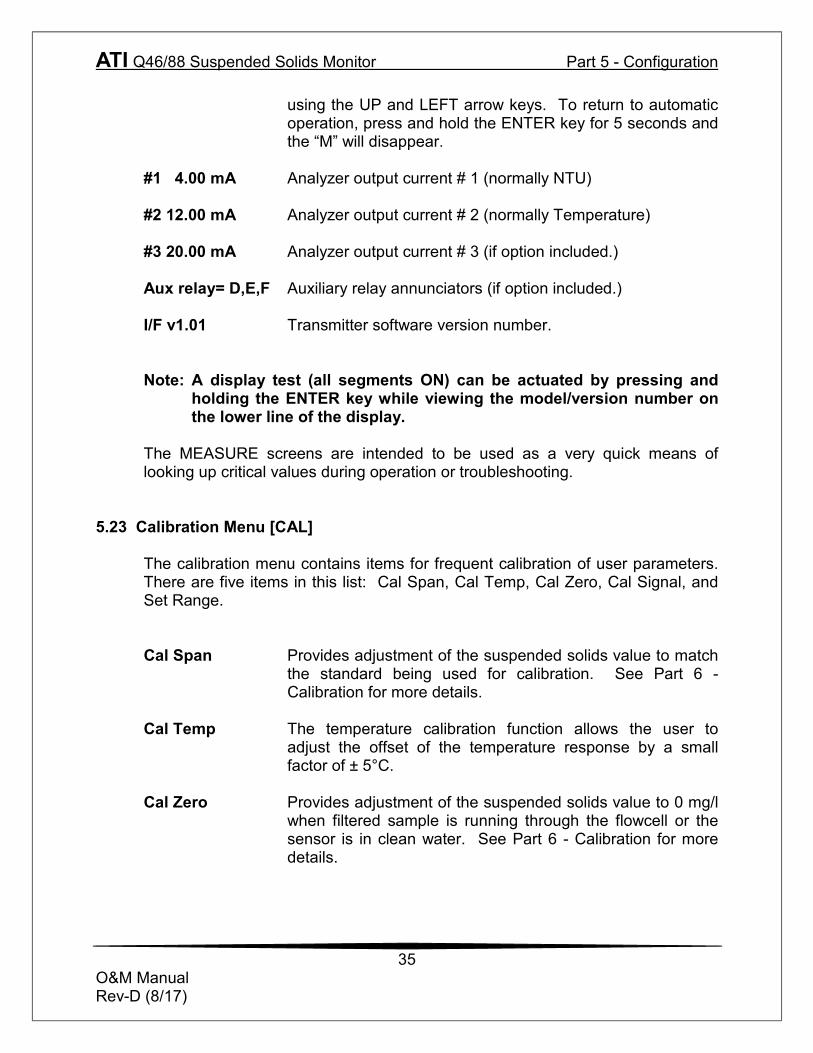
using the UP and LEFT arrow keys. To return to automatic operation, press and hold the ENTER key for 5 seconds and the “M” will disappear.
#1 4.00 mA Analyzer output current # 1 (normally NTU) #2 12.00 mA Analyzer output current # 2 (normally Temperature) #3 20.00 mA Analyzer output current # 3 (if option included.) Aux relay= D,E,F Auxiliary relay annunciators (if option included.) I/F v1.01 Transmitter software version number. Note: A display test (all segments ON) can be actuated by pressing and
holding the ENTER key while viewing the model/version number on the lower line of the display.
The MEASURE screens are intended to be used as a very quick means of looking up critical values during operation or troubleshooting.
5.23 Calibration Menu [CAL]
The calibration menu contains items for frequent calibration of user parameters. There are five items in this list: Cal Span, Cal Temp, Cal Zero, Cal Signal, and Set Range.
Cal Span Provides adjustment of the suspended solids value to match
the standard being used for calibration. See Part 6 - Calibration for more details.
Cal Temp The temperature calibration function allows the user to
adjust the offset of the temperature response by a small factor of ± 5°C.
Cal Zero Provides adjustment of the suspended solids value to 0 mg/l
when filtered sample is running through the flowcell or the sensor is in clean water. See Part 6 - Calibration for more details.
ATI Q46/88 Suspended Solids Monitor Part 5 - Configuration
36
O&M Manual Rev-D (8/17)
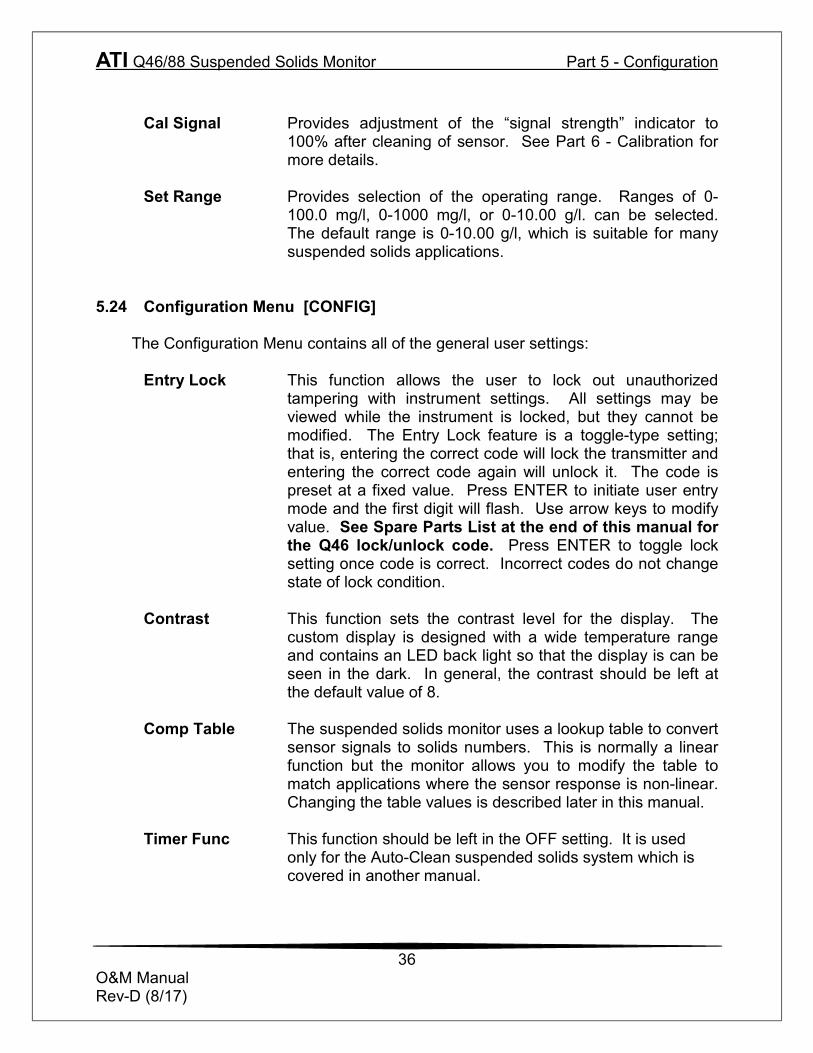
Cal Signal Provides adjustment of the “signal strength” indicator to
100% after cleaning of sensor. See Part 6 - Calibration for more details.
Set Range Provides selection of the operating range. Ranges of 0-
100.0 mg/l, 0-1000 mg/l, or 0-10.00 g/l. can be selected. The default range is 0-10.00 g/l, which is suitable for many suspended solids applications.
5.24 Configuration Menu [CONFIG] The Configuration Menu contains all of the general user settings: Entry Lock This function allows the user to lock out unauthorized
tampering with instrument settings. All settings may be viewed while the instrument is locked, but they cannot be modified. The Entry Lock feature is a toggle-type setting; that is, entering the correct code will lock the transmitter and entering the correct code again will unlock it. The code is preset at a fixed value. Press ENTER to initiate user entry mode and the first digit will flash. Use arrow keys to modify value. See Spare Parts List at the end of this manual for the Q46 lock/unlock code. Press ENTER to toggle lock setting once code is correct. Incorrect codes do not change state of lock condition.
Contrast This function sets the contrast level for the display. The
custom display is designed with a wide temperature range and contains an LED back light so that the display is can be seen in the dark. In general, the contrast should be left at the default value of 8.
Comp Table The suspended solids monitor uses a lookup table to convert
sensor signals to solids numbers. This is normally a linear function but the monitor allows you to modify the table to match applications where the sensor response is non-linear. Changing the table values is described later in this manual.
Timer Func This function should be left in the OFF setting. It is used
only for the Auto-Clean suspended solids system which is covered in another manual.
ATI Q46/88 Suspended Solids Monitor Part 5 - Configuration
37
O&M Manual Rev-D (8/17)
Com Mode Sets digital communication mode of analyzer. Optional
digital communication card must be plugged into the power supply slot for this function to work. Press ENTER to initiate user entry mode, and the entire value will flash. Use the UP arrow key to modify the desired value; selections include 1-None, 2- P-DP for Profibus DP, 3 – Modbus, 4 – Ethernet IP. Press ENTER to store the new value
Com Address Sets bus address for digital communication mode of
analyzer. Optional digital communication card must be plugged into the power supply slot for this function to work.
Press ENTER to initiate user entry mode, and the entire
value will flash. Use the UP arrow key to modify the desired value. Range is 1-125. Press ENTER to store the new value.
Com Baud Sets communications baud rate. Com Parity Sets parity for the digital communications. Iout#1 Mode This function sets analog output #1 to either track NTU
Suspended Solids or enables the PID controller to operate on the Suspended Solids input. Press ENTER to initiate user entry mode, and the entire value will flash. Use the UP arrow key to modify the desired value; selections include 1- NTU tubidity or 2-PID for PID control. Press ENTER to store the new value.
Iout#2 Mode This function sets analog output #2 for either temperature
(default), NTU tubidity, or for Aux Units (mg/l or PSL). Press ENTER to initiate user entry mode, and the entire value will flash. Use the UP arrow key to modify the desired value; selections include 1-C/F for temperature, or 2-ppm NTU or r 3-mg/l or PSL. Press ENTER to store the new value.
Iout#3 Mode OPTIONAL. This function sets analog output #3 for either
temperature (default), NTU, or Aux. Units. Press ENTER to initiate user entry mode, and the entire value will flash. Use the UP arrow key to modify the desired value; selections include 1-C/F for temperature, or 2-ppm NTU or r 3-mg/l or PSL. Press ENTER to store the new value.
ATI Q46/88 Suspended Solids Monitor Part 5 - Configuration
38
O&M Manual Rev-D (8/17)
Rly A Mode Relay A can be used in three different ways: as a setpoint
control, as a fail alarm, or as a HI-LO alarm band. The three settings for Rly A Mode are CON, FAIL and AL.
The CON setting enables normal control operation for Relay
A, with settings for setpoint, hysteresis, delay and phasing appearing in the CONTROL menu automatically. See Figure 19 – Control Relay Example for further details.
The AL setting allows two setpoints to be selected for the
same relay, producing a HI-LO alarm band. In this mode, Relay A will trip inside or outside of the band, depending upon the Phase selected. See Figure 20 – Alarm Relay Example for further details.
The FAIL setting enables the fail alarm mode for Relay A.
Relay A will then trip on any condition that causes the FAIL icon to be displayed on the LCD. Using this mode allows the User to send alarm indications to other remote devices.
Relay B Mode Relay C Mode Relay B can be used in two ways: as a setpoint control or as
a fail alarm. The settings for Relay B Mode are CON, FAIL and they are the same as those modes in relay A
*Relay D Mode *Relay E Mode *Relay F Mode OPTIONAL. Relays D,E,and F can be used in two ways: as
a setpoint control, or as a fail alarm. The two settings for Relay D, E, & F Mode are CON and FAIL.
Temp Units This function sets the display units for temperature
measurement. Press ENTER to initiate user entry mode, and the entire value will flash. Use the UP arrow key to modify the desired display value. The choices are °F and °C. Press ENTER to store the new value.
ATI Q46/88 Suspended Solids Monitor Part 5 - Configuration
39
O&M Manual Rev-D (8/17)
5.25 Control Menu [CONTROL] The Control Menu contains all of the output control user settings. Note that PID
menu items will not appear unless output 1 is configured for PID mode in the CONFIG menu.
Set PID 0% Set PID 100% [Iout1=PID] If the PID is enabled, this function sets the minimum and
maximum controller end points. Unlike the standard 4-20 mA output, the controller does not “scale” output values across the endpoints. Rather, the endpoints determine where the controller would normally force minimum or maximum output in an attempt to recover the setpoint (even though the controller can achieve 0% or 100% anywhere within the range.)
If the 0% point is lower than the 100% point, then the
controller action will be “reverse” acting. That is, the output of the controller will increase if the measured value is less than the setpoint, and the output will decrease if the measured value is larger than the setpoint. Flipping the stored values in these points will reverse the action of the controller to “direct” mode.
The entry value is limited to a value within the range
specified in “Set Range”, and the 0% and the 100% point must be separated by at least 1% of this range Use the LEFT arrow key to select the first digit to be modified. Then use the UP and LEFT arrow keys to select the desired numerical value. Press ENTER to store the new value.
PID Setpnt [Iout1=PID] The measured value which the controller is attempting to
maintain by adjusting output value. It is the nature of the PID controller that it never actually gets to the exact value and stops. The controller is continually making smaller and smaller adjustments as the measured value gets near the setpoint.
PID Prop [Iout1=PID] Proportional gain factor. The proportional gain value is a
multiplier on the controller error (difference between measured value and setpoint value.) Increasing this value will make the controller more responsive.
ATI Q46/88 Suspended Solids Monitor Part 5 - Configuration
40
O&M Manual Rev-D (8/17)
PID Int [Iout1=PID] Integral is the number of “repeats-per-minute” of the action
of the controller. It is the number of times per minute that the controller acts on the input error. At a setting of 2.0 rpm, there are two repeats every minute. If the integral is set to zero, a fixed offset value is added to the controller (manual reset.) Increasing this value will make the controller more responsive.
PID Deriv [Iout1=PID] Derivative is a second order implementation of Integral, used
to suppress “second-order” effects from process variables. These variables may include items like pumps or mixers that may have minor impacts on the measured value. The derivative factor is rarely used in water treatment process, and therefore, it is best in most cases to leave it at the default value. Increasing this value will make the controller more responsive.
Set 4 mA Set 20 mA [Iout1=NTU] These functions set the main 4 and 20 mA current loop
output points for the transmitter. The units displayed depend on the selection made in the CONFIG menu for Iout #1 Mode. Do not set the 20 mA setting above 400 NTU.
The value stored for the 4 mA point may be higher or lower
than the value stored for the 20 mA point. The entry values are limited to values within the range specified in “Set Range”, and the 4 mA and the 20 mA point must be separated by at least 1% of this range Use the LEFT arrow key to select the first digit to be modified. Then use the UP and LEFT arrow keys to select the desired numerical value. Press ENTER to store the new value.
*Set 4 mA #2 *Set 20 mA #2 [temp/D.O.] These functions set the second 4 mA and 20 mA current
loop output points for the transmitter. The output may be set to track temperature (default), NTU, or the selected Aux Units of mg/l or PSL. The values stored for the 4 mA point may be higher or lower than the value stored for the 20 mA point.
ATI Q46/88 Suspended Solids Monitor Part 5 - Configuration
41
O&M Manual Rev-D (8/17)
The entry value is limited to a value between 0 and 55 °C if it
is set for temperature, within the range specified in “Set Range” if the output is set to track NTU. The 4 mA and the 20 mA point must be at least 20 units away from each other. Press ENTER to initiate user entry mode, and the value will flash. Use arrow keys to modify value. Press ENTER to store the new value.
*Set 4 mA #3 *Set 20 mA #3 [temp/NTU/Aux] OPTIONAL. These functions set the optional third 4 mA and
20 mA current loop output points for the analyzer. The output may be set to track temperature (default), NTU, or Aux Units. The values stored for the 4 mA point may be higher or lower than the value stored for the 20 mA point.
The entry value is limited to a value between 0 and 55 °C if it
is set for temperature. The 4 mA and the 20 mA point must be at least 20 units away from each other. Press ENTER to initiate user entry mode, and the value will flash. Use arrow keys to modify value. Press ENTER to store the new value.
*A Setpoint This function establishes the trip point for relay A. The entry
value is limited to a value within the range specified in “Set Range”. Use the LEFT arrow key to select the first digit to be modified. Then use the UP and LEFT arrow keys to select the desired numerical value. Press ENTER to store the new value.
*A Hysteresis This function establishes the hysteresis, or “deadband”, for
Relay A. Hysteresis is most often used to control relay chattering; however, it may also be used in control schemes to separate the ON/OFF trip points of the relay. Press ENTER to initiate user entry mode, and the value will flash. Use the arrow keys to modify value. Press ENTER to store the new value.
*A Delay This function places an additional amount of time delay on
the trip point for relay A. This delay is in addition to the main delay setting for the controller. The entry value is limited to a value between 0 and 999 seconds. Press ENTER to initiate user entry mode, and the value will flash. Use arrow keys to modify value; range is 0 to 999 seconds. Press ENTER to store the new value.
ATI Q46/88 Suspended Solids Monitor Part 5 - Configuration
42
O&M Manual Rev-D (8/17)
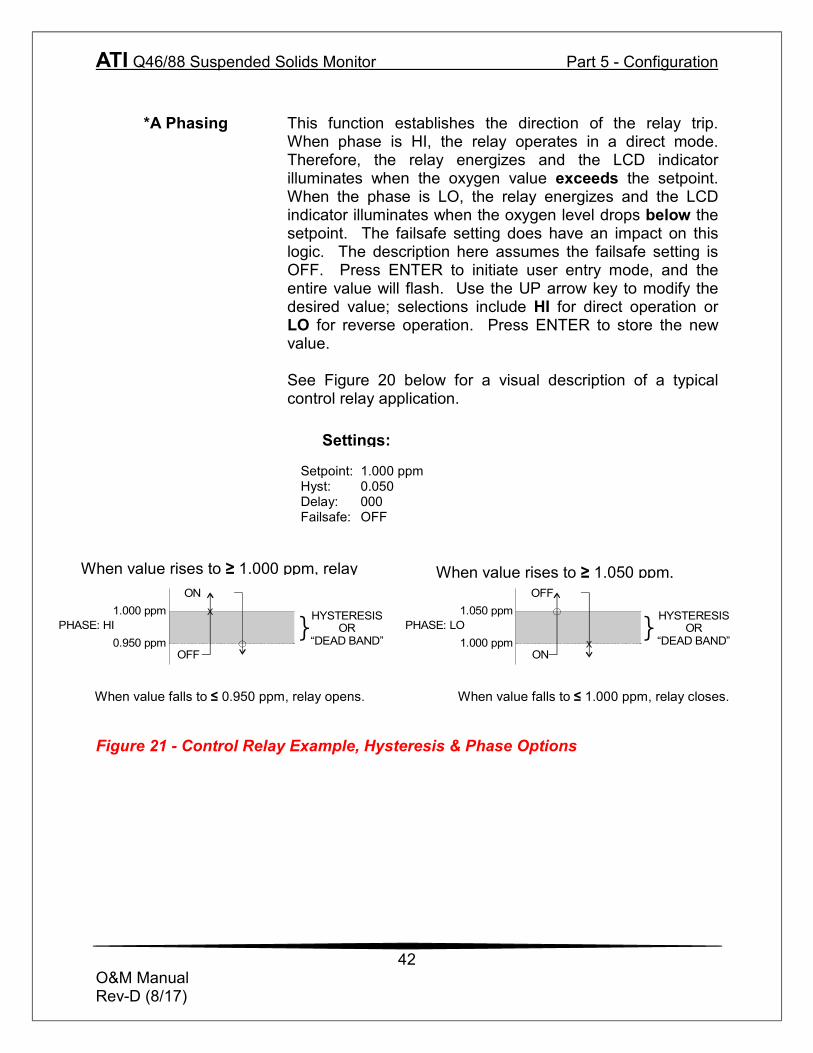
*A Phasing This function establishes the direction of the relay trip.
When phase is HI, the relay operates in a direct mode. Therefore, the relay energizes and the LCD indicator illuminates when the oxygen value exceeds the setpoint. When the phase is LO, the relay energizes and the LCD indicator illuminates when the oxygen level drops below the setpoint. The failsafe setting does have an impact on this logic. The description here assumes the failsafe setting is OFF. Press ENTER to initiate user entry mode, and the entire value will flash. Use the UP arrow key to modify the desired value; selections include HI for direct operation or LO for reverse operation. Press ENTER to store the new value.
See Figure 20 below for a visual description of a typical control relay application.
Figure 21 - Control Relay Example, Hysteresis & Phase Options
Setpoint: 1.000 ppm Hyst: 0.050 Delay: 000 Failsafe: OFF
When value rises to ≥ 1.000 ppm, relay
When value falls to ≤ 0.950 ppm, relay opens.
When value rises to ≥ 1.050 ppm,
When value falls to ≤ 1.000 ppm, relay closes.
Settings:
}1.000 ppm
0.950 ppmPHASE: HI
ON
HYSTERESISOR
“DEAD BAND”
X
OFF
}1.050 ppm
1.000 ppmPHASE: LO
OFF
HYSTERESISOR
“DEAD BAND”XON
ATI Q46/88 Suspended Solids Monitor Part 5 - Configuration
43
O&M Manual Rev-D (8/17)
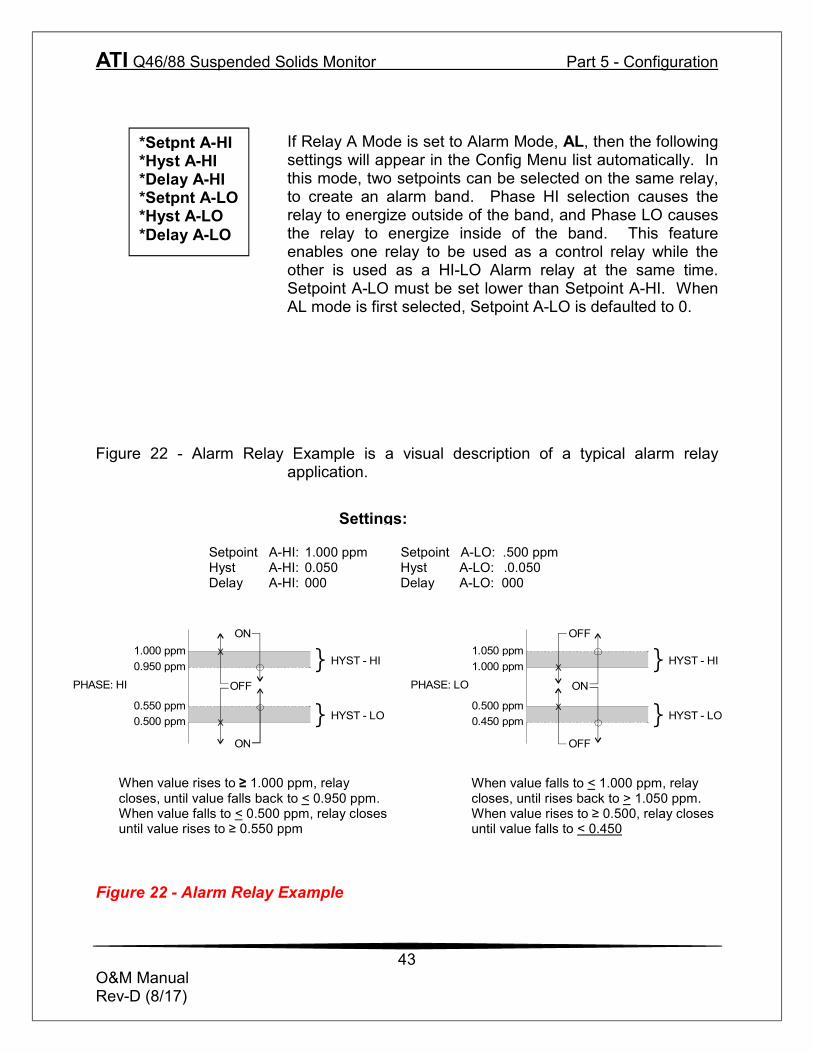
If Relay A Mode is set to Alarm Mode, AL, then the following
settings will appear in the Config Menu list automatically. In this mode, two setpoints can be selected on the same relay, to create an alarm band. Phase HI selection causes the relay to energize outside of the band, and Phase LO causes the relay to energize inside of the band. This feature enables one relay to be used as a control relay while the other is used as a HI-LO Alarm relay at the same time. Setpoint A-LO must be set lower than Setpoint A-HI. When AL mode is first selected, Setpoint A-LO is defaulted to 0.
Figure 22 - Alarm Relay Example is a visual description of a typical alarm relay
application.
Figure 22 - Alarm Relay Example
Setpoint A-HI: 1.000 ppm Setpoint A-LO: .500 ppm Hyst A-HI: 0.050 Hyst A-LO: .0.050 Delay A-HI: 000 Delay A-LO: 000
When value rises to ≥ 1.000 ppm, relay closes, until value falls back to < 0.950 ppm. When value falls to < 0.500 ppm, relay closes until value rises to ≥ 0.550 ppm
Settings:
When value falls to < 1.000 ppm, relay closes, until rises back to > 1.050 ppm. When value rises to ≥ 0.500, relay closes until value falls to < 0.450
*Setpnt A-HI *Hyst A-HI *Delay A-HI *Setpnt A-LO *Hyst A-LO *Delay A-LO
}
}
1.000 ppm0.950 ppm
0.550 ppm0.500 ppm
PHASE: HI
ON
HYST - HI
HYST - LO
ON
X
X
OFF
}
}
1.050 ppm1.000 ppm
0.500 ppm0.450 ppm
PHASE: LO
OFF
HYST - HI
HYST - LO
OFF
X
X
ON
ATI Q46/88 Suspended Solids Monitor Part 5 - Configuration
44
O&M Manual Rev-D (8/17)
If Relay B Mode is set to CON, then Relay B will function
identically to Relay A. Relay B settings appear in the CONFIG menu list automatically.
If Relay C Mode is set to CON (see Relay C Mode), then
Relay C will function identically to Relay A. Relay C settings appear in the CONFIG menu list automatically.
If Relay D, E, or F Mode is set to CON (see Relay D,E,F Modes), then the Relay will function identically to Relay A. Relay settings appear in the CONFIG menu list automatically.
5.26 Diagnostics Menu [DIAG]
The diagnostics menu contains all of the user settings that are specific to the system diagnostic functions, as well as functions that aid in troubleshooting application problems.
Set Hold The Set Hold function locks the current loop output values
on the present process value and holds relays in current status. This function can be used prior to calibration, or when removing the sensor from the process, to hold the output in a known state. Once HOLD is released, the outputs return to their normal state of following the process input. The transfer out of HOLD is bumpless on the both analog outputs - that is, the transfer occurs in a smooth manner rather than as an abrupt change. An icon on the display indicates the HOLD state, and the HOLD state is retained even if power is cycled. Press ENTER to initiate user entry mode, and entire value will flash. Use the UP arrow key to modify the desired value, selections are ON for engaging the HOLD function, and OFF to disengage the function. Press ENTER to store the new value.
*B Setpoint *B Hysteresis *B Delay *B Phasing
C Setpoint C Hysteresis C Delay C Phasing
D,E,F Setpoint D,E,F Hyster D,E,F Delay D,E,F Phasing
ATI Q46/88 Suspended Solids Monitor Part 5 - Configuration
45
O&M Manual Rev-D (8/17)
The Set Hold function can also hold at an output value
specified by the user. To customize the hold value, first turn the HOLD function on. Press the ESC key to go to the DIAG Menu and scroll to Sim Output using the UP arrow key. Press ENTER. Follow the instructions under Sim Output (see following page).
Fault List The Fault List screen is a read-only screen that allows the
user to display the cause of the highest priority failure. The screen indicates the number of faults present in the system and a message detailing the highest priority fault present. Note that some faults can result in multiple displayed failures due to the high number of internal tests occurring. As faults are corrected, they are immediately cleared.
Faults are not stored; therefore, they are immediately
removed if power is cycled. If the problem causing the faults still exists, however, faults will be displayed again after power is re-applied and a period of time elapses during which the diagnostic system re-detects them. The exception to this rule is the calibration failure. When a calibration fails, no corrupt data is stored. Therefore, the system continues to function normally on the data that was present before the calibration was attempted.
After 30 minutes or if power to the transmitter is cycled, the
failure for calibration will be cleared until calibration is attempted again. If the problem still exists, the calibration failure will re-occur. Press ENTER to initiate view of the highest priority failure. The display will automatically return to normal after a few seconds.
PID Timer This function sets a timer to monitor the amount of time the
PID controller remains at 0% or 100%. This function only appears if the PID controller is enabled. If the timer is set to 0000, the feature is effectively disabled. If the timer value is set to any number other zero, a FAIL condition will occur if the PID controller remains at 0% or 100% for the timer value. If one of the relays is set to FAIL mode, this failure condition can be signaled by a changing relay contact.
Press ENTER to initiate user entry mode, and the entire
value will flash. Use the UP arrow key to modify desired
ATI Q46/88 Suspended Solids Monitor Part 5 - Configuration
46
O&M Manual Rev-D (8/17)
value; range of value is 0-9999 seconds. Press ENTER to store the new value.
Sim Out The Sim Out function allows the user to simulate the oxygen
level of the instrument in the user selected display range. The user enters a ppm value directly onto the screen, and the output responds as if it were actually receiving the signal from the sensor. This allows the user to check the function of attached monitoring equipment during set-up or troubleshooting. Escaping this screen returns the unit to normal operation. Press ENTER to initiate the user entry mode, and the right-most digit of the value will flash. Use arrow keys to modify desired value.
The starting display value will be the last read value of the
input. The output will be under control of the SIM screen until the ESC key is pressed.
Note: If the HOLD function is engaged before the Sim Output
function is engaged, the simulated output will remain the same even when the ESC key is pressed. Disengage the HOLD function to return to normal output.
Fail Out #1 This function enables the user to define a specified value
that the main current output will go to under fault conditions. When the Relay Option Board is installed, the display will read Fail Out #1. When enabled to ON, the output may be forced to the current value set in Fail Val (next item.) With the Fail Out setting of ON, and a Fail Val setting of 6.5 mA, any alarm condition will cause the current loop output to drop outside the normal operating range to exactly 6.5 mA, indicating a system failure that requires attention.
Press ENTER to initiate user entry mode, and the entire
value will flash. Use the UP arrow key to modify desired value; selections are ON, OFF. Press ENTER to store the new value.
Fail Val #1 Sets the output failure value for Iout#1. When Fail Out
above is set to ON, this function sets value of the current loop under a FAIL condition. When the Relay Option Board is installed, the display will read Fail Out #1. The output may be forced to any current value between 4-20 mA.
ATI Q46/88 Suspended Solids Monitor Part 5 - Configuration
47
O&M Manual Rev-D (8/17)
Press ENTER to initiate user entry mode, and the entire
value will flash. Use the UP arrow key to modify desired value; selections are between 4mA, and 20mA. Press ENTER to store the new value.
Fail Out #2 This function sets the fail-mode of current loop output #2
under a FAIL condition. The settings and operation are identical to Fail Out for output #1.
Fail Val #2 This function sets the value of current loop output #2 under a
FAIL condition. The settings and operation are identical to Fail Out for output #1.
*Fail Out #3 OPTIONAL. This function sets the fail-mode of current loop
output #3 under a FAIL condition. The settings and operation are identical to Fail Out for output #1.
*Fail Val #3 OPTIONAL. This function sets the value of current loop
output #3 under a FAIL condition. The settings and operation are identical to Fail Out for output #1.
Backlight This function has three options. ON – On all the time, OFF –
Off all the time, AL – Alarm (Default). This function flashes the backlight on and off whenever the Fail icon is displayed.
Start Delay This function is designed to minimize control or alarm issues
arising from temporary power loss. When power goes down, the monitor records the analog output values and the status of relays and PID functions. When power is restored, the analog values and relays will be held at the pre-power loss values for a defined period of time. This “start delay” may be programmed for periods from 0-9.9 minutes. This function is set to 0.0 minutes by default and must be activated by the user if desired by setting a positive time value.
*Failsafe This function allows the user to set the optional system
relays to a failsafe condition. In a failsafe condition, the relay logic is reversed so that the relay is electrically energized in a normal operating state. By doing this, the relay will not only change state when, for example, an oxygen limit is exceeded, but also when power is lost to the controller.
ATI Q46/88 Suspended Solids Monitor Part 5 - Configuration
48
O&M Manual Rev-D (8/17)
When failsafe is selected to be ON, the normally-open
contacts of the relay will be closed during normal operation. In an attempt to make this configuration less confusing, the LCD icon logic is reversed with this setting, and the icon is OFF under this normal condition. Therefore, when the trip condition occurs, the closed N.O. contacts will be opened (relay de-energized), and the LCD icon will illuminate. In addition, a power fail would also cause the same contacts to open.
Fouling Alarm Activates or disables the fouled sensor detector. This circuit
detects the buildup of solids on the face of the sensor that can degrade the Suspended Solids measurement. The options are ON–alarm is active, or OFF–alarm is disabled. The default is ON.
Dry Probe Alarm Similar to the fouling alarm, this alarm is generated when the
sensor is no longer in liquid. Loss of sample flow can cause this alarm to activate if the flowcell is drained of sample. The options are ON–alarm is active, or OFF–alarm is disabled. The default is ON.
Ext Light Alarm The sensor can provide an alarm in the event that ambient
light is high enough to cause measurement problems. This alarm is not useful for flowcell applications but can be of value if a submersible sensor is in use. The options are ON–alarm is active, or OFF–alarm is disabled. The default is OFF.
Set Default The Set Default function allows the user to return the
instrument back to factory default data for all user settings or for just the calibration default. It is intended to be used as a last resort troubleshooting procedure. All user settings or the calibration settings are returned to the original factory values. Hidden factory calibration data remains unchanged. Press ENTER to initiate user entry mode and select either CAL or ALL with the UP arrow key. The default CAL routine will reset the zero offset to 0.0 nA and reset the slope to 100%. The default ALL routine will reset all program variables to factory default and should be used with care since it will change any user settings that were programmed in the field.
49
O&M Manual Rev-D (8/17)
Part 6 – Calibration 6.1 Suspended Solids Calibration
Suspended solids monitors will start to measure aqueous samples as soon as power is applied and the sensor is in contact with sample. Calibration of a system is normally required at start-up as factory calibration for suspended solids is not practical due to solids density variability. Calibration involves adjustment of both the zero and span of the instrument. The SS sensor zero has been adjusted at the factory and user adjustment is normally not required for high solids applications. When operating in the lowest range of 0-100.0 mg/l, the zero should be check using clean tap water at startup.
6.11 Cal Zero
If you are using a submersible SS sensor, remove the sensor from the process, wipe the sensing are clean, and suspend the sensor in a bucket of clean tap water, distilled water, or any solids free water. When cleaning, use only a soft cloth and detergent to clean the optical lens. Do not sit the sensor on the bottom of you sample container. You need at least 2 or 3 inches of water below the sensor in order for it to zero it properly. If you are using either a flowcell or a flow tee, you can zero the sensor in place if you can fill the chamber with solids free water. If not, you will need to remove the sensor from the flowcell or flow tee in order to zero it. If your system is normally running on the high range of 0-10.00 g/l, zeroing the sensor is normally not necessary. To zero the sensor, proceed as follows: 1. Immerse the sensor in solids free water and allow it to stabilize for 2 or 3
minutes. Press the Menu key to access the Cal Menu. Press the UP key until to access “Cal Zero”.
2. Press the Enter key and the bottom line will display a message asking that
the sensor be placed in zero sample. Zero sample is already flowing so just press Enter again. The display will flash a “Wait” message.
ATI Q46/88 Suspended Solids Monitor Part 6 - Calibration
50
O&M Manual Rev-D (8/17)
3. After a short period, the monitor will zero the sensor and flash an “accepted”
message indicating that the zero was successful. If the zero offset is too high, a “Cal Fail” message will appear and the “Fail” icon on the display will light up.
4. Once the zero adjustment is complete, remove the filter from the incoming
sample line. 6.12 Cal Span
Calibration of a Q46/88 suspended solids monitor is normally done by adjusting the displayed value to a lab measurement. Lab measurements of suspended solids take quite a long time so often an estimated value is used. If the application involves measurement of a known type of solids, it is sometimes possible to mix a standard for calibration. In many wastewater applications like raw sewage or mixed liquor suspended solids, it is often necessary to estimate the calibration value. Factory calibration is done using a formazin standard that may, or may not, have the same optical backscatter properties as the process in which the sensor is to be used. To set the span of the SS monitor, follow the procedure below.
1. Submerge the sensor in the process tank or turn on the process water flow through the flowcell or flow tee. Allow the sensor to stabilize for 5-10 minutes. If possible, take a sample and get a measurement made as quickly as possible using an alternative method. If that is not possible, estimate the solids level based on experience with the process.
2. Press the Menu key to access the Cal Menu. Press the UP arrow to access “Cal Span”.
3. Press the Enter key and you will be prompted to place the sensor into a
reference solution. Press Enter again and the display will flash “Wait” while checking for the stability of the signal. After a few seconds, the display will flash, allowing adjustment of the value. Use the Up and Left keys to adjust each digit of the display to the value of suspended solids determined previously.
4. After the proper value is entered, press the Enter key and the display will flash “accepted”. Should the sensor determine that the entered value is outside its normal offset limits, a “Cal Fail” message will flash. Should this occur, try to verify that the process value is correct. Also check the sensor optical surface and wipe with a clean cloth before attempting another span adjustment.
ATI Q46/88 Suspended Solids Monitor Part 6 - Calibration
51
O&M Manual Rev-D (8/17)
6.2 Temperature Calibration
The temperature calibration sequence is essentially a 1-point offset calibration that allows adjustments of approximately ± 5°C. The sensor temperature may be calibrated on line, or the sensor can be removed from the process and placed into a known solution temperature reference. In any case, it is critical that the sensor be allowed to reach temperature equilibrium with the solution in order to provide the highest accuracy. When moving the sensor between widely different temperature conditions, it may be necessary to allow the sensor to stabilize as much as one hour before the calibration sequence is initiated. If the sensor is on-line, the user may want to set the output HOLD feature prior to calibration to lock out any output fluctuations. 1. Scroll to the CAL menu section using the MENU key and press ENTER or the
UP arrow key. 2. Press the UP arrow key until Cal Temp is displayed. 3. Press the ENTER key. The message Place sensor in solution then press
ENTER will be displayed. Move the sensor into the calibration reference (if it hasn’t been moved already) and wait for temperature equilibrium to be achieved. Press ENTER to begin the calibration sequence.
4. The calibration data gathering process will begin. The message Wait will
flash as data is accumulated and analyzed. The °C or °F symbol may flash periodically if the reading is too unstable.
5. The message Adjust value - press ENTER will be displayed, and the right-
most digit will begin to flash, indicating that the value can be modified. Using the UP and LEFT arrow keys, modify the value to the known ref solution temperature. Adjustments up to ± 5 °C from the factory calibrated temperature are allowed. Press ENTER.
Once completed, the display will indicate PASS or FAIL. If the unit fails, the temperature adjustment may be out of range, the sensor may not have achieved complete temperature equilibrium, or there may be a problem with the temperature element. In the event of calibration failure, it is recommended to attempt the calibration again immediately.
ATI Q46/88 Suspended Solids Monitor Part 6 - Calibration
52
O&M Manual Rev-D (8/17)
6.3 Check Signal Function Suspended solids systems contain a sensor check system that is intended to give operators an indication of the operating condition of the optics. The scale of this function is somewhat arbitrary, going from 0% to 220%. When a sensor is tested at the factory, the “check signal” value is set to 100% so a check signal value of 100% indicates optimum operation of the optical system. In an actual installation, conditions are never perfect so the check signal value is unlikely to be exactly 100% in normal operation, but that value is generally pretty close to 100% at startup. The main purpose of this number is to indicate how much optical fouling is occurring over time. As the sensor runs for longer and longer periods of time, the check signal value will often go down slowly or up slowly, indicating that coatings on the optic lens is reflecting more and more of the LED emission. Oily organic coatings tend to increase the check signal value while inorganic coatings tend to decrease the value. A decreasing check signal value is the most common occurrence. Periodically checking the value of this variable on the lower line of the display will alert operators that maintenance will be needed. In the DIAG menu, there is a “Foul Alarm” that can be turned on or off. If the Foul Alarm is turned on, the “Fail” icon on the display and relay C (if configured for fail) will activate when the check signal value falls below 50%. The check signal also can be used to indicate a “dry cell” when the sensor is used in a flowcell or flow tee. If sample flow is lost, the check signal value will normally rise to 220%. There is a second alarm function in the DIAG menu called “Dry Alarm”. Turning this alarm on will active the “Fail” icon on the display and relay C (if configured for fail) when signal value goes to 220%. 6.31 Calibrate Check Signal After startup of the SS monitor, you may set the check signal level to
100%. As mentioned above, the check signal value is different in different types of applications. The monitor allows you to set the check signal level to 100% when the sensor is operating in normal conditions and the sensor is clean. This can establish a good reference point so that the changes in the check signal value are related to your particular application.
To calibrate the check signal value, proceed as follow. Be sure that the
sensor is in normal operation. You cannot complete this procedure with the sensor out of the sample.
ATI Q46/88 Suspended Solids Monitor Part 6 - Calibration
53
O&M Manual Rev-D (8/17)
1. Press Menu to go to the CAL Menu. Press the á key until the lower
line indicates “Cal Signal”.
2. Pess the Enter key and the check signal value will begin to flash. After the monitor evaluates the check signal value, you will see a “Pass” message and the check signal value will be set to 100%
6.4 External Light Function
Optical suspended solids sensors can be sensitive to ambient light interference in unusual conditions. This is possible when sensors are submerged in flowing streams outdoors in bright sunlight. While it is not normally an issue, the Q46/88 contains a sensor diagnostic feature that measures the amount of ambient light and can provide an alarm in the event that ambient light levels are too high for reliable operation. In dark conditions, the % Light value will normally be around 37%. That value will increase with increasing ambient light and can go as high as about 70%. If values above 65% are observed in an application, investigate the possibility of locating the sensor in an area with less sunlight or adding a sun shield to the mounting assembly to reduce the % Light value. In the DIAG menu, you can configure an alarm for high ambient light conditions. If you program the “Ext Light Alarm” to ON, the monitor will active the “Fail” icon on the display and relay C (if configured for fail) when signal value goes above 70%.
54
O&M Manual Rev-D (8/17)
Part 7 – System Maintenance 7.1 General
The Q46/88 Suspended Solids Monitor will generally provide unattended operation over long periods of time. With proper care, the system should continue to provide measurements indefinitely. For reliable operation, maintenance on the system must be done on a regular schedule. Keep in mind that preventive maintenance on a regular schedule is much less troublesome than emergency maintenance that always seems to come at the wrong time.
7.2 Analyzer Maintenance
No unusual maintenance of the analyzer is required if installed according to the guidelines of this operating manual. If the enclosure door is frequently opened and closed, it would be wise to periodically inspect the enclosure sealing gasket for breaks or tears.
7.3 Sensor Maintenance
Sensor maintenance is limited to simple cleaning of the optical surfaces. In general, wiping with a soft cloth is all that’s needed. The optical surfaces can also be cleaned with a household glass cleaner or a surface cleaner. Never use abrasive pads on the optical surfaces. In some applications, the sensor might accumulate iron and manganese deposits that precipitate from the water after chlorination. Should this occur, cleaning the sensor by soaking in solution of a commercial iron remover such as “Red-B-Gone” will quickly remove deposits. The lenses on the sensor are made of acrylic. Be careful not to scratch these surfaces when handling the sensor. Severe scratches can cause irreparable damage.
55
O&M Manual Rev-D (8/17)
Part 8 – Troubleshooting 8.1 General
The information included in this section is intended to be used in an attempt to quickly resolve an operational problem with the system. During any troubleshooting process, it will save the most time if the operator can first determine if the problem is related to the analyzer, sensor, or some external source. Therefore, this section is organized from the approach of excluding any likely external sources, isolating the analyzer, and finally isolating the sensor. If these procedures still do not resolve the operational problems, any results the operator may have noted here will be very helpful when discussing the problem with the factory technical support group.
8.2 External Sources of Problems To begin this process, review the connections of the system to all
external connections. 1. Verify the analyzer is earth grounded. For all configurations of
the analyzer, an earth ground connection MUST be present for the shielding systems in the electronics to be active. Grounded conduit provides no earth connection to the plastic enclosure, so an earth ground wiring connection must be made at the power input terminal strip. Use the special “shield terminal” stub on the power supply board for optimum sensor cable shield grounding.
2. Verify the proper power input is present. Check instrument label
to verify your unit is either 100-240 VAC or 12-24 VDC. 3. Verify the loads on any 4-20 mA outputs do not exceed the
limits in the Instrument Specifications. During troubleshooting, it is many times helpful to disconnect all these outputs and place wire-shorts across the terminals in the instrument to isolate the system and evaluate any problems which may be coming down the analog output connections.
4. Do not run sensor cables or analog output wiring in the same
conduits as power wiring. If low voltage signal cables must come near power wiring, cross them at 90° to minimize coupling.
ATI Q46/88 Suspended Solids Monitor Part 8 - Troubleshooting
56
O&M Manual Rev-D (8/17)
5. If rigid conduit has been run directly to the Q46 enclosure,
check for signs that moisture has followed conduit into the enclosure.
6. Check for ground loops. Although the sensor is electrically
isolated from the process water, high frequency sources of electrical noise may still cause erratic behavior in extreme conditions. If readings are very erratic after wiring has been checked, check for a possible AC ground loop by temporarily placing the sensor into a bucket of water.
7. On relay based systems, check the load that is connected to the
relay contacts. Verify the load is within the contact rating of the relays. Relay contacts which have been used for higher power AC current loads may become unsuitable for very low signal DC loads later on because a small amount of pitting can form on the contacts. If the load is highly inductive (solenoids, motor starters, large aux relays), note that the contact rating will be de-rated to a lower level. Also, due to the large amount of energy present in circuits driving these types of loads when they are switched on an off, the relay wiring placement can result in electrical interference for other devices. This can be quickly resolved by moving wiring, or by adding very inexpensive snubbers (such As Quencharcs) to the load.
8. Carefully examine any junction box connections for loose wiring
or bad wire stripping. If possible, connect the sensor directly to the analyzer for testing.
9. Check sensor for fouling. Look closely for signs of grease or oil
which may be present. Sensor fouling can be corrected by cleaning optical surfaces with a soft cloth.
8.3 Analyzer Tests 1. Disconnect power and completely disconnect all output wiring
coming from the analyzer. Remove sensor wiring, relay wiring, and analog output wiring. Re-apply power to the analyzer. Verify proper voltage (115 or 230 VAC) is present on the incoming power strip of the analyzer, and that the analyzer power label matches the proper voltage value.
2. If analyzer does not appear to power up (no display), remove
power and check removable fuse for continuity with a DVM.
ATI Q46/88 Suspended Solids Monitor Part 8 - Troubleshooting
57
O&M Manual Rev-D (8/17)
3. Using a DVM, check the voltage across the BLUE and WHITE
wires coming from the power supply board in the base of the enclosure. FIRST, disconnect any wiring going to Iout#1. Then, verify voltage across these wires is about 16-18 VDC when still connected to the terminal strip on the front half of the enclosure. If the BLUE and WHITE wires are not connected to the terminal strip on the front half of the enclosure, the voltage across them should measure about 29 VDC.
4. If analyzer does power up with a display, use the “Simulate”
feature to check operation of the analog outputs (and relays contacts with a DVM.)
5. Check sensor power circuits. With a DVM, verify between -4.5
and -5.5 VDC from sensor connection terminals WHITE (+) to BLACK (-). Then verify between +4.5 and +5.5VDC from GREEN (+) to BLACK (-).
6. Check TC drive circuit. Place a wire-short between the RED
and BLACK sensor terminals. With a DVM, measure the voltage between the BLACK (-) and BROWN (+) sensor terminals to verify that the TC drive circuit is producing about -4.6 to -5.5 VDC open-circuit. Remove DVM completely and connect a 1000 Ohm resistor across the BLACK to BROWN terminals. The temperature reading on the front LCD should display approximately 0°C and the dissolved oxygen reading should display approximately 0 ppm.
8.31 Display
Messages The Q46 Series instruments provide a number of diagnostic messages which indicate problems during normal operation and calibration. These messages appear as prompts on the secondary line of the display or as items on the Fault List.
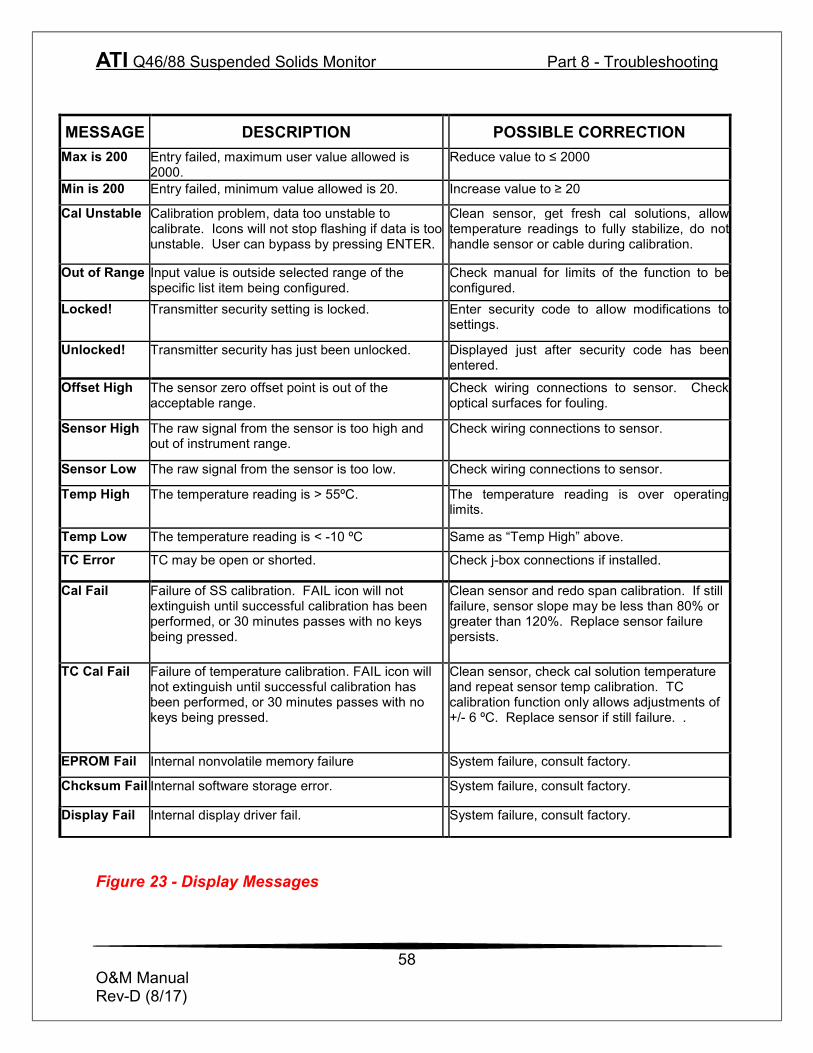
ATI Q46/88 Suspended Solids Monitor Part 8 - Troubleshooting
58
O&M Manual Rev-D (8/17)
MESSAGE DESCRIPTION POSSIBLE CORRECTION Max is 200 Entry failed, maximum user value allowed is
2000. Reduce value to ≤ 2000
Min is 200 Entry failed, minimum value allowed is 20. Increase value to ≥ 20
Cal Unstable Calibration problem, data too unstable to calibrate. Icons will not stop flashing if data is too unstable. User can bypass by pressing ENTER.
Clean sensor, get fresh cal solutions, allow temperature readings to fully stabilize, do not handle sensor or cable during calibration.
Out of Range Input value is outside selected range of the specific list item being configured.
Check manual for limits of the function to be configured.
Locked! Transmitter security setting is locked. Enter security code to allow modifications to settings.
Unlocked! Transmitter security has just been unlocked. Displayed just after security code has been entered.
Offset High The sensor zero offset point is out of the acceptable range.
Check wiring connections to sensor. Check optical surfaces for fouling.
Sensor High The raw signal from the sensor is too high and out of instrument range.
Check wiring connections to sensor.
Sensor Low The raw signal from the sensor is too low. Check wiring connections to sensor.
Temp High The temperature reading is > 55ºC. The temperature reading is over operating limits.
Temp Low The temperature reading is < -10 ºC Same as “Temp High” above.
TC Error TC may be open or shorted. Check j-box connections if installed.
Cal Fail Failure of SS calibration. FAIL icon will not extinguish until successful calibration has been performed, or 30 minutes passes with no keys being pressed.
Clean sensor and redo span calibration. If still failure, sensor slope may be less than 80% or greater than 120%. Replace sensor failure persists.
TC Cal Fail Failure of temperature calibration. FAIL icon will not extinguish until successful calibration has been performed, or 30 minutes passes with no keys being pressed.
Clean sensor, check cal solution temperature and repeat sensor temp calibration. TC calibration function only allows adjustments of +/- 6 ºC. Replace sensor if still failure. .
EPROM Fail Internal nonvolatile memory failure System failure, consult factory.
Chcksum Fail Internal software storage error. System failure, consult factory.
Display Fail Internal display driver fail. System failure, consult factory.
Figure 23 - Display Messages
59
O&M Manual Rev-D (8/17)
Part 9 – PID Controller Details 9.1 PID Description
PID control, like many other control schemes, is used in chemical control to improve the efficiency of chemical addition or control. By properly tuning the control loop that controls chemical addition, only the amount of chemical that is truly required is added to the system, saving money. The savings can be substantial when compared to a system which may be simply adding chemical at a constant rate to maintain some minimal addition under even the worst case conditions. The PID output controller is highly advantageous over simple control schemes that just utilize direct (proportional only) 4-20 mA output connections for control, since the PID controller can automatically adjust the “rate” of recovery based on the error between the setpoint and the measured value – which can be a substantial efficiency improvement.. The PID controller is basically designed to provide a “servo”action on the 4-20 mA output to control a process. If the user requires that a measured process stay as close as possible to a specific setpoint value, the controller output will change from 0% to 100% in an effort to keep the process at the setpoint. To affect this control, the controller must be used with properly selected control elements (valves, proper chemicals, etc.) that enable the controller to add or subtract chemical rapidly enough. This is not only specific to pumps and valves, but also to line sizes, delays in the system, etc. This section is included to give a brief description of tuning details for the PID controller, and is not intended to be an exhaustive analysis of the complexities of PID loop tuning. Numerous sources are available for specialized methods of tuning that are appropriate for a specific application.
9.2 PID Algorithm
As most users of PID controllers realize, the terminology for the actual algorithm terms and even the algorithms themselves can vary between different manufacturers. This is important to recognize as early as possible, since just plugging in similar values from one controller into another can result in dramatically different results. There are various basic forms of PID algorithms that are commonly seen, and the implementation here is the most common version; The ISA algorithm (commonly referred to as the “ideal” algorithm.)
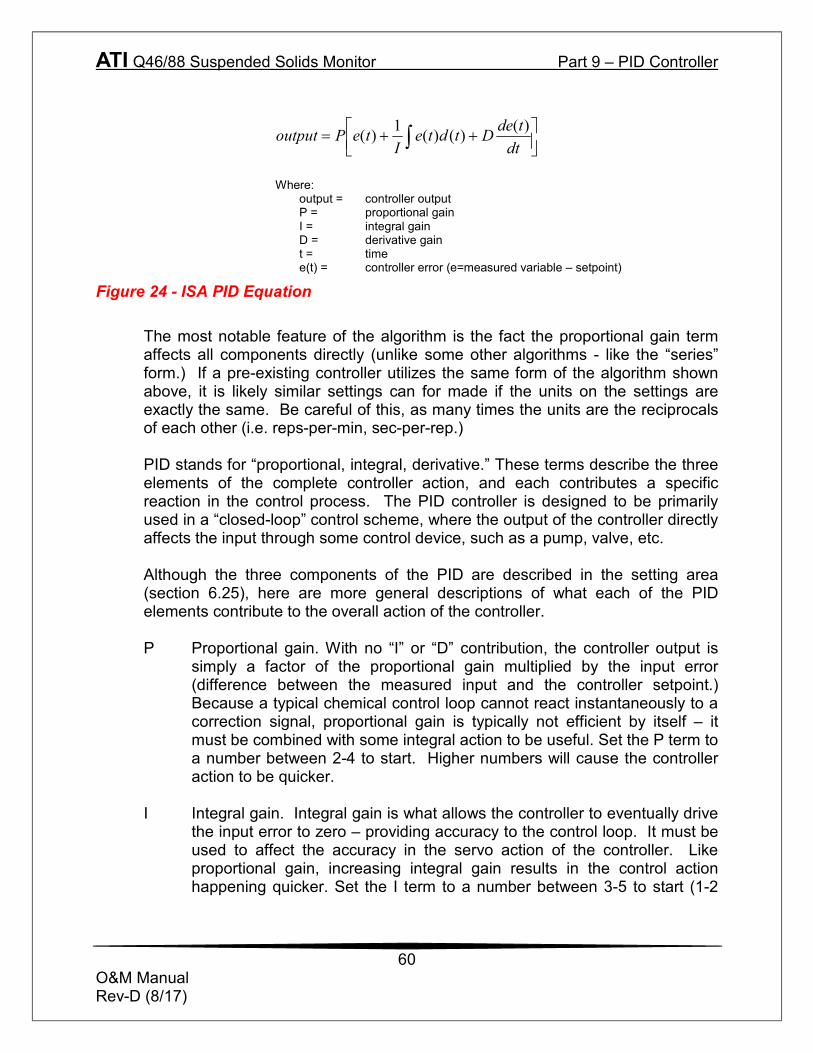
ATI Q46/88 Suspended Solids Monitor Part 9 – PID Controller
60
O&M Manual Rev-D (8/17)
++= ∫ dt
tdeDtdteI
tePoutput )()()(1)(
Where: output = controller output P = proportional gain I = integral gain D = derivative gain t = time e(t) = controller error (e=measured variable – setpoint)
Figure 24 - ISA PID Equation The most notable feature of the algorithm is the fact the proportional gain term affects all components directly (unlike some other algorithms - like the “series” form.) If a pre-existing controller utilizes the same form of the algorithm shown above, it is likely similar settings can for made if the units on the settings are exactly the same. Be careful of this, as many times the units are the reciprocals of each other (i.e. reps-per-min, sec-per-rep.) PID stands for “proportional, integral, derivative.” These terms describe the three elements of the complete controller action, and each contributes a specific reaction in the control process. The PID controller is designed to be primarily used in a “closed-loop” control scheme, where the output of the controller directly affects the input through some control device, such as a pump, valve, etc. Although the three components of the PID are described in the setting area (section 6.25), here are more general descriptions of what each of the PID elements contribute to the overall action of the controller.
P Proportional gain. With no “I” or “D” contribution, the controller output is
simply a factor of the proportional gain multiplied by the input error (difference between the measured input and the controller setpoint.) Because a typical chemical control loop cannot react instantaneously to a correction signal, proportional gain is typically not efficient by itself – it must be combined with some integral action to be useful. Set the P term to a number between 2-4 to start. Higher numbers will cause the controller action to be quicker.
I Integral gain. Integral gain is what allows the controller to eventually drive
the input error to zero – providing accuracy to the control loop. It must be used to affect the accuracy in the servo action of the controller. Like proportional gain, increasing integral gain results in the control action happening quicker. Set the I term to a number between 3-5 to start (1-2
ATI Q46/88 Suspended Solids Monitor Part 7 – PID Controller
61
O&M Manual Rev-D (8/17)
more than P). Like proportional gain, increasing the integral term will cause the controller action to be quicker.
D Derivative gain. The addition of derivative control can be problematic in
many applications, because it greatly contributes to oscillatory behavior. In inherently slow chemical control process’, differential control is generally added in very small amounts to suppress erratic actions in the process that are non-continuous, such as pumps and valves clicking on and off. However, as a starting point for chemical process control, its best to leave the “D” term set to 0.
Based on these descriptions, the focus on tuning for chemical applications really only involves adjustment of “P” and “I” in most cases. However, increasing both increases the response of the controller. The difference is in the time of recovery. Although combinations of high “P’s” and low “I” will appear to operate the same as combinations of low “P’s” and high “I’s”, there will be a difference in rate of recovery and stability. Because of the way the algorithm is structured, large “P’s” can have a larger impact to instability, because the proportional gain term impacts all the other terms directly. Therefore, keep proportional gain lower to start and increase integral gain to achieve the effect required. Many of the classical tuning techniques have the user start with all values at 0, and then increase the P term until oscillations occur. The P value is then reduced to ½ of the oscillatory value, and the I term is increased to give the desired response. This can be done with the Q46D controller, with the exception that the I term should start no lower than 1.0. If it appears that even large amounts of integral gain (>20) don’t appreciably increase the desired response, drop I back to about 1.0, and increase P by 1.00, and start increasing I again. In most chemical control schemes, I will be approximately 3 times the value of P.
9.3 Classical PID Tuning
Unlike many high speed position applications where PID loops are commonly used, the chemical feed application employed by this instrument does not require intense mathematical exercise to determine tuning parameters for the PID. In fact, the risk of instability is far greater with overly tuned PID control schemes. In addition, many of the classical mathematical exercises can be damaging or wasteful in the use of chemicals when the process is bumped with large amounts of input error to seek a response curve. Because of this, the general adjustment guidelines described in section 8.2 are sufficient for almost all application tuning for this instrument. Beyond this, many sources are available for classical tuning methods.
ATI Q46/88 Suspended Solids Monitor Part 7 – PID Controller
62
O&M Manual Rev-D (8/17)
9.4 Manual PID Override Control
The Q46 electronics is equipped designed to allow the user to take manual control of the PID output. This is often useful when starting up a control loop, or in the event that you wish to bump the system manually to measure system response time. To access the manual PID control, you must be in the MEASURE mode of operation and you must have the PID output displayed on the lower line. This line will indicate “XX.X% XX.X mA” with the X values simply indicating the current values. With this display on the screen, press and hold the ENTER key for about 5 seconds. You will see a small “m” show up between the % value and the mA value. This indicates you are now in manual mode. Once in manual, you may increase the PID output by pressing the UP arrow or you may decrease the output by pressing the LEFT arrow. This will allow you to drive the PID output to any desired setting. To revert to normal PID control, press and hold the ENTER key again until the “m” indicator disappears.
9.5 Common PID Pitfalls
The most common problem occurring in PID control applications involves the false belief that proper settings on only the PID controller can balance any process to an efficient level. Close-loop control can only be effective if all elements in the loop are properly selected for the application, and the process behavior is properly understood. Luckily, the nature of simple chemical control process are generally slow in nature. Therefore, even a de-tuned controller (one that responds somewhat slow) can still provide substantial improvements to setpoint control. In fact, damaging oscillatory behavior is far more likely in tightly tuned controllers where the user attempted to increase response too much. When deciding on a PID control scheme, it is important to initially review all elements of the process. Sticking valves, undersized pumps, or delays in reaction times associated with chemical addition can have a dramatic effect on the stability of the control loop. When controlling a chemical mix or reaction, the sensor should be placed in a location that ensures proper mixing or reaction time has occurred.
ATI Q46/88 Suspended Solids Monitor Part 7 – PID Controller
63
O&M Manual Rev-D (8/17)
The easiest process’ to control with closed-loop schemes are generally linear, and symmetrical, in nature. For example, controlling level in tank where the opening of valve for a fixed period of time corresponds linearly to the amount that flows into a tank. Chemical control process’ can be more problematic when the nature of the setpoint value is non-linear relative to the input of chemical added. For example, D.O. control of a process may appear linear only in a certain range of operation, and become highly exponential at the extreme ranges of the measuring scale. In addition, if a chemical process is not symmetrical, that means it responds differentially to the addition and subtraction of chemical. It is important in these applications to study steady-state impact as well as step-change impact to process changes. In other words, once the process has apparently been tuned under normal operating conditions, the user should attempt to force a dramatic change to the input to study how the output reacts. If this is difficult to do with the actual process input (the recommended method), the user can place the control in manual at an extreme control point such as 5% or 95%, and release it in manual. The recovery should not be overly oscillatory. If so, the loop needs to be de-tuned to deal with that condition (reduce P and/or I.)
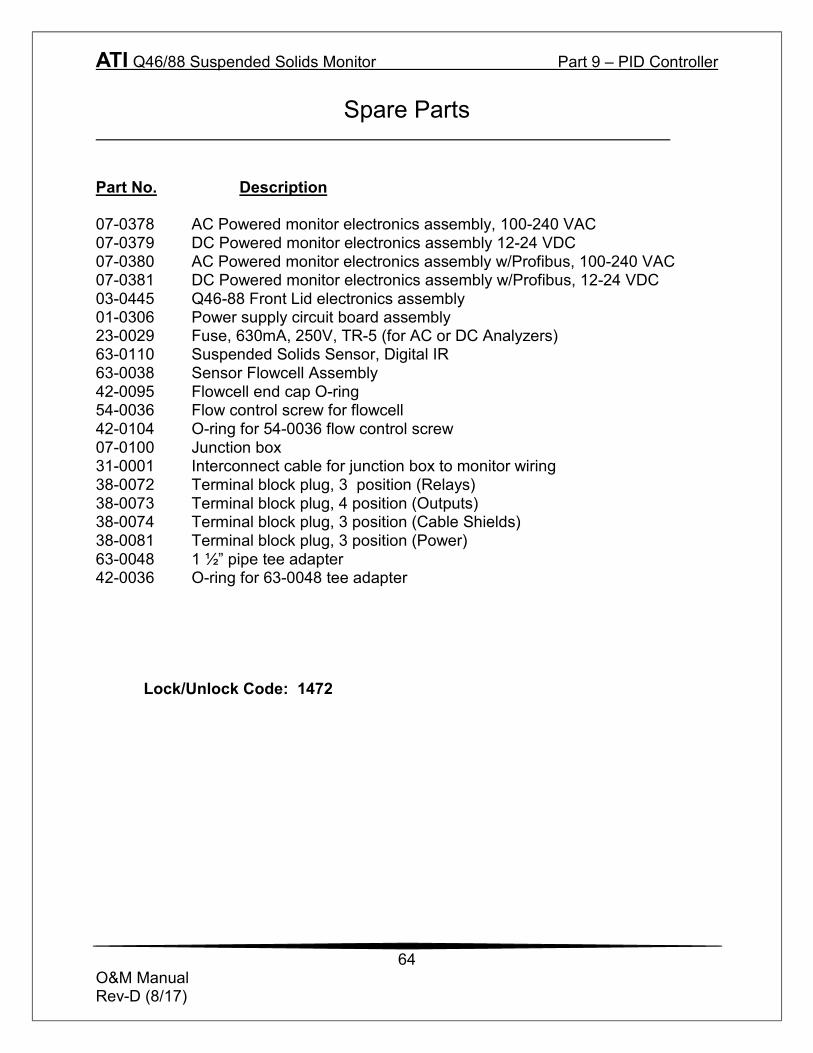
ATI Q46/88 Suspended Solids Monitor Part 9 – PID Controller
64
O&M Manual Rev-D (8/17)
Spare Parts Part No. Description 07-0378 AC Powered monitor electronics assembly, 100-240 VAC 07-0379 DC Powered monitor electronics assembly 12-24 VDC 07-0380 AC Powered monitor electronics assembly w/Profibus, 100-240 VAC 07-0381 DC Powered monitor electronics assembly w/Profibus, 12-24 VDC 03-0445 Q46-88 Front Lid electronics assembly 01-0306 Power supply circuit board assembly 23-0029 Fuse, 630mA, 250V, TR-5 (for AC or DC Analyzers) 63-0110 Suspended Solids Sensor, Digital IR 63-0038 Sensor Flowcell Assembly 42-0095 Flowcell end cap O-ring 54-0036 Flow control screw for flowcell 42-0104 O-ring for 54-0036 flow control screw 07-0100 Junction box 31-0001 Interconnect cable for junction box to monitor wiring 38-0072 Terminal block plug, 3 position (Relays) 38-0073 Terminal block plug, 4 position (Outputs) 38-0074 Terminal block plug, 3 position (Cable Shields) 38-0081 Terminal block plug, 3 position (Power) 63-0048 1 ½” pipe tee adapter 42-0036 O-ring for 63-0048 tee adapter
Lock/Unlock Code: 1472