Q4’09 Company Update - Lithia...
30
Q4’09 Company Update Q4’09 Company Update
Transcript of Q4’09 Company Update - Lithia...
Q4’09 Company UpdateQ4’09 Company Update
DISCLOSUREThis presentation includes numerous “forward‐looking statements”. These forward‐looking statements address our future objectives, plans and goals, as well as our intent, beliefs and current expectations regarding future operating performance. Specific events addressed by these forward‐looking statements include, without limitation: future U.S. automotive industry trends; future liquidity trends or needs and our business and growth strategies These forward‐lookingfuture liquidity trends or needs and our business and growth strategies. These forward looking statements are based on our current estimates and assumptions and involve various risks and uncertainties. As a result, you are cautioned that these forward‐looking statements are not guarantees of future performance, and that actual results could differ materially from those projected in these forward‐looking statements. Factors which may cause actual results to differ materially from our projections include those risks described in our filings with the Securities and Exchange Commission, including those under the heading “Risk Factors” in such documents.
Additionally, this presentation contains information about Adjusted Diluted EPS, Adjusted EBITDA and Adjusted Cash Flow from Operations. These are non‐GAAP financial measures used by Company management when evaluating results of operations and cash flow. Management b li th l id f th fi i l t t t ith dditi l d f lbelieves these measures also provide users of the financial statements with additional and useful comparisons of current results of operations and cash flows with past and future periods. Non‐GAAP financial measures should not be construed as being more important than comparable GAAP measures. Detailed reconciliations of the non‐GAAP measures included herein to comparable GAAP financial measures have been included in the tables appearing in the Appendix to this presentationto this presentation.
2

1947 Photo
THE BEGINNING – “SINCE 1946"
9 7 o o
THE BEGINNING SINCE 1946Named after Lithia Springs in Ashland, OR
3

WRV
IEW
Lithia Motors, based in Medford, OR, is a leading operator of automotive franchises and retailer of new and used vehicles and
OVE automotive franchises and retailer of new and used vehicles and
related services
As of January 1, 2010, we offered 26 brands of new vehicles and all brands of used vehicles in 85 stores in the United States and
TORS
all brands of used vehicles in 85 stores in the United States and over the internet
Service, Body F&I, Fleet & Porsched
Revenue Mix Brand Mix
MOT
New Vehicles50%
Used and
Wholesale Vehicles
4%
& Parts16%
Other3%
BMW8.9%
Suzuki0.1%
0.6%
Chrysler Jeep Dodge30.6%
Mazda0.5%
Mercedes1.9%
Nissan3.1%
Subaru4.6%
Toyota13.3%
VW Audi2.9%
THIA Used and
Program Vehicles27%
Ford5.1%General
Kia0.1%
Honda7.4%
Hyundai3.8%
LIT General
Motors17.1%
Note: Revenue mix is as of the year ended December 31, 2009 and brand mix is based on new vehicle revenues s for the year ended December 31, 2009
4

I.P.O. in Dec. 1996 ‐ 5 dealerships
The 8th largest U.S. auto retailer ‐by retail sales
LITHIA MOTORS OVERVIEWLITHIA MOTORS OVERVIEW85 Dealerships, 12 States, 26 Brands
5
B sinessBusiness Overview
6

LITHIA’S DIFFERENTIATED BUSINESS MODELBUSINESS MODEL
Small and mid‐sized, regional markets
Restructured to be profitable at current SAAR levels
Vast majority single‐point markets
Unique and fully‐integrated and centralized operating structure
Lithia’s differentiated auto retail
Higher demand for trucks and domestic brands
Entrepreneurial store management
model
Growth
Proven track record of purchasing and on average improving underperforming dealerships
Growth
Substantial organic growth potential with SAAR recovery
Successful used vehicle strategy 77

UNIQUE MARKET POSITIONThe Company focuses on small‐ and mid‐sized markets
Revenue per State
Oregon16%
Iowa
Idaho6%
Colorado1% Montana
7%
Nevada4%
North Dakota2%
New Mexico1%
Revenue per State
Texas24%
California12%
Washington10%
Alaska10%
7%
Diversification helps insulate Lithia from market‐specific risks
Note: Revenue are based on results for the year ended December 31, 2009
Target 30% new vehicle share
Derives less than 25% of revenue from one state
Hi h d d f t k d d ti i k tHigher demand for trucks and domestic cars in our markets
8

FOCUSED ON CENTRALIZATION TO SUPPORT STORE OPERATIONSTO SUPPORT STORE OPERATIONS
Centralized administrative processes promote entrepreneurial
Administrative Functions Entrepreneurial Environment
Corporate Customer‐Facing
Centralized administrative processes promote entrepreneurial store management
Administrative Functions• Cash Management• Advertising / Marketing• Accounts Payable• Procurement
Entrepreneurial Environment• Model Tailored to Local Markets
• Empowered Store Management:Centralized
d• Accounts Receivable• Credit and Collections• Legal• Tax / Accounting• Information Systems
‐ Hiring Decisions‐ Ad Campaigns‐ Customer Experience‐ Community Reputation‐ Internet Lead Mgmt
Budgeting & Common
Measurement
Information Systems• Payroll / Benefits• Inventory Management• Human Development• Human Resources
Internet Lead Mgmt• GM is Local Leader• Unique Store Culture• Individual Recipe for Success
Company‐wide administrative personnelreduced 50% from 6.4 to 3.1 per store since 2007 9

MORE STABLE PROFITABILITY THROUGH BUSINESS LINE MIXTHROUGH BUSINESS LINE MIX
(2)Manufacturer / RetailerBreakdown of Business Lines(2)
Manufacturer / Retailer Comparison(1)
30.9%20.0%2.2% 1.9% 1.4%
17.4%50.0%
22.4%
‐3.5% ‐2.8%
tax Income %
15.8%
40.2%3.3%
Revenue Gross Profit
Service, body and parts F&I and Other
‐14.8%
Pre‐t
Auto Manufacturers Peer Group
Significant gross profit contribution
New vehicle Used vehicle2006 2007 200816.6 16.2 13.2SAAR
57% of gross profit from 19% of revenues
(1) Margin based on reported pre‐tax income as a percentage of revenue adjusted for one‐time asset impairment charges. Domestic auto manufacturers includes Daimler Chrysler (2006 only), General Motors and Ford Motor. Peer group average includes Lithia, AutoNation, Sonic, Asbury, Penske, and Group 1.
(2) Used vehicles includes both used and wholesale vehicles. Revenues and gross profit based on the year ended December 31, 2009.10

DOMESTIC BRANDS STRONG IN OURMARKETSOUR MARKETS
New Vehicle Revenues New Vehicle Gross ProfitsDomestic brands
Domestic54.1%
Import/Luxury45.9%
Domestic brands derive more gross profit than revenue,
proportionallyDomestic53.4%
Import/Luxury46.6%
New Vehicle Gross Margin
8.4%
New Vehicle Gross Margin
7.9%7.8%
7.9%
Note: Revenue and gross profits are based on results for the year ended December 31, 2009. Gross margins are based on the three‐months ended September 30, 2009
Highest new vehicle margins among publically traded peers11
2006 2007 2008 2009

INDUSTRY LEADER IN USED VEHICLE SALEVEHICLE SALE
Value line autos shifts sales16 0%
Retail Used Gross MarginsValue line autos shifts sales to retail transactions
Margins improve as retail sales price declines
15.0%
14.1%
11.5%
14.1%
12.0%
14.0%
16.0%
Retail / Wholesale Sales Split
sales price declines
Average Selling Price
10.0%
2006 2007 2008 2009
63.4% 61.6% 63.3%68.2%
36.6% 38.4% 36.7%31.8%
Split
16,316
16,980
16,638
16,2666,249
6,629
5 897
g g
31.8%
2006 2007 2008 2009
5,897
5,345
2006 2007 2008 2009
Retail
Wholesale
Converting more used cars to retail transactions
Note: Gross margins are based on results for the three‐months ended September 30, 2009. Average selling price and retail wholesale splits are based on results for the year ended December 31, 2009
12
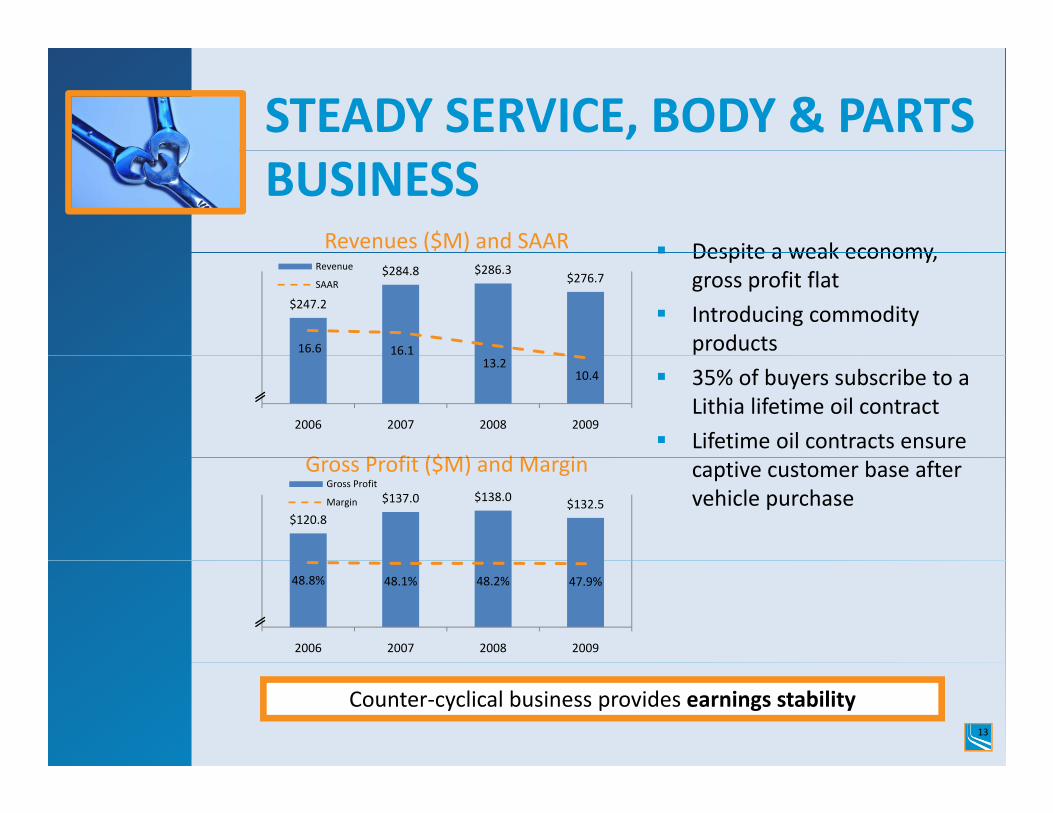
STEADY SERVICE, BODY & PARTS BUSINESS
Revenues ($M) and SAAR Despite a weak economy
$247.2
$284.8 $286.3$276.7
16.6 16.1
Revenue
SAAR
Despite a weak economy, gross profit flat
Introducing commodity products
G P fit ($M) d M i
13.2 10.4
2006 2007 2008 2009
35% of buyers subscribe to a Lithia lifetime oil contract
Lifetime oil contracts ensure
$120.8
$137.0 $138.0 $132.5
Gross Profit ($M) and MarginGross Profit
Margin
captive customer base after vehicle purchase
48.8% 48.1% 48.2% 47.9%
2006 2007 2008 2009
Counter‐cyclical business provides earnings stability13

ORGANIC OPPORTUNITIES TO GROW IN NEW VEHICLES
Change in Units in Operation
14
15
16
17
18
SAAR Scrappage
10
11
12
13
14
Units (M
)
Net reduction in vehicles in service
8
9
2004 2005 2006 2007 2008 2009E 2010E 2011E
“Pent‐up” demand must be realizedPent‐up demand must be realized
Earnings unlocked as cost structure leveraged
Given scrappage rates SAAR levels will recoverGiven scrappage rates, SAAR levels will recover
Source: Global Insight, NADA, R.L. Polk & Co.; Forward scrappage numbers provided by equity research.
14

ORGANIC OPPORTUNITIES TO GROW IN USED VEHICLES
Used‐to‐New Ratio
0.6x 0.6x0.7x
1.0x
2006 2007 2008 2009
d h f d h lDemand shifts to used vehicles in a recession
Incremental sales with no additional investment
Free of manufacturer restrictionsFree of manufacturer restrictions
Adaptable inventory to meet customer demand
Focused on increasing used vehicle salesFocused on increasing used vehicle sales
Note: Ratio is based on year‐to‐date new and used unit counts
15

ACQUISITION OPPORTUNITIESThe industry is poised for consolidation
Public dealerships only 3.7%(1) of industryPublic dealerships only 3.7% of industry
Targeted brands:
R t i i ti k tRoom to grow in existing markets
Consolidation benefits survivors
Current timing = attractive opportunities
(1) Based on public filings and NADA
16

PROVEN ACQUISITION STRATEGY WITH EXPERIENCED MANAGEMENT
Growth since IPOYears in Industry
Purchased over 100 stores in 12 years
Industry
Sid DeBoerChairman & CEO
M.L. Dick Heimann
45
42Vice Chairman
R. Bradford GrayExecutive VP
42
32 5.6x
Improvement in Net Income 1 Year After Acquisition (1)
# ‐ number of acquisitions in the year
Bryan DeBoerPresident & COO
Jeff DeBoer
20
12 1 3
2.8x
2.2x
Senior VP & CFO
Scott HillierSenior Vice President
12
23
1.3x
2004 Acq. 2005 Acq. 2006 Acq. 2007 Acq.
#10 #5 #10 #5
Note: Improvements based on total net income acquired during given year, annualized, compared to next year results
Successful management with over 170 years of experience17

FinancialFinancial Overview
18
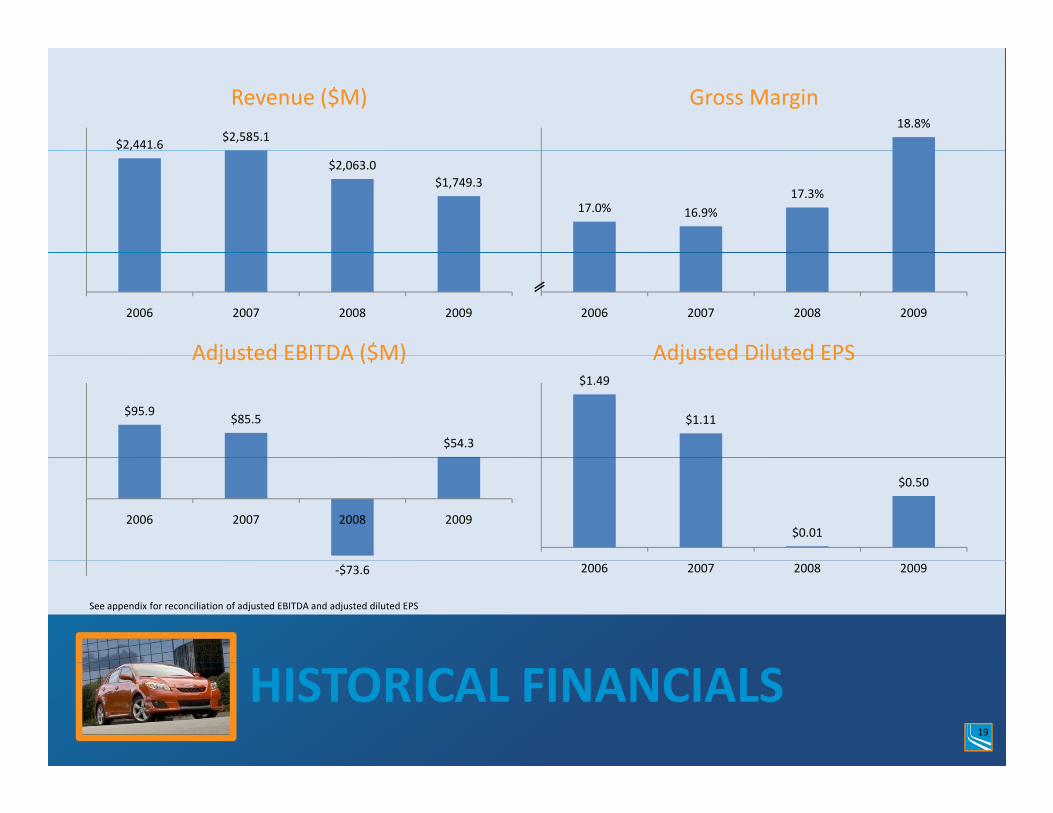
$2,441.6$2,585.1
Revenue ($M)18.8%
Gross Margin
,
$2,063.0$1,749.3
17.0% 16.9%17.3%
2006 2007 2008 2009
Adjusted EBITDA ($M)
2006 2007 2008 2009
Adjusted Diluted EPS
$95.9$85.5
$54.3
Adjusted EBITDA ($M)$1.49
$1.11
Adjusted Diluted EPS
2006 2007 2008 2009$0.01
$0.50
See appendix for reconciliation of adjusted EBITDA and adjusted diluted EPS
‐$73.6 2006 2007 2008 2009
HISTORICAL FINANCIALS19

Q4’09 FINANCIAL UPDATEFocus on profitability, margins and cash flow
($K) Q4’09 Q4’08 % change Q4’09 Highlights($K) Q4’09 Q4’08 % change
Revenues $418,670 $399,124 4.9%
Gross Profit 75,405 75,997 (0.8)%
SG&A Expense 66,083 67,437 (2.0)%Adj Income from
Q4 09 Highlights
New vehicle same store sales up 1.2%
Excluding Chrysler, newCon’t Ops $132 $(3,195) NM
Adj Diluted EPS $0.01 $(0.16) NM
Excluding Chrysler, new vehicle same stores sales up 18.5%
Retail used vehicle same store sales up 17.9%p
Profitable Q4 despite challenging environment
Full Year Highlight($K) 2009 2008 % change
Significant improvements in full year net income despite 15.2% decline in revenues
Revenues $1,749,315 $2,063,000 (15.2)%
Gross Profit 329,619 356,475 (7.5)%
SG&A Expense 270,245 307,316 (12.1)%Adj Income from Con’t Ops $11 036 $255 4 227 8%
20
Con t Ops $11,036 $255 4,227.8%
Adj Diluted EPS $0.50 $0.01 4,900.0%
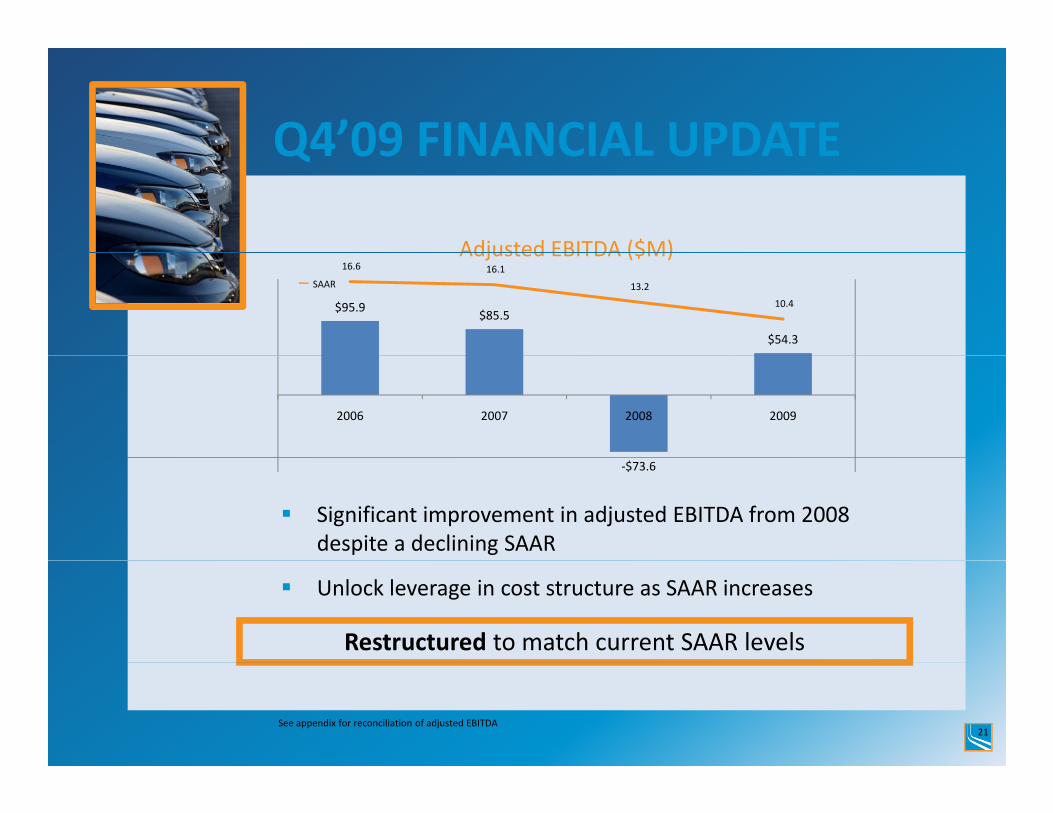
Q4’09 FINANCIAL UPDATEQ4 09 FINANCIAL UPDATE
Adjusted EBITDA ($M)SAAR
$95.9$85.5
$54.3
16.6 16.1
13.2
10.4
Adjusted EBITDA ($M)
2006 2007 2008 2009
Significant improvement in adjusted EBITDA from 2008 despite a declining SAAR
‐$73.6
Unlock leverage in cost structure as SAAR increases
Restructured to match current SAAR levels
See appendix for reconciliation of adjusted EBITDA21

STABLE BALANCE SHEETSolid liquidity and minimal debt maturities
Immediately Available Funds ($K) 12/31/09 Book value per basic share of Immediately Available Funds ($K) 12/31/09
Cash and Cash Equivalents $12,776
Availability on Line of Credit 25,682
Unfloored Vehicles 35 728
$13.93
Current Ratio of 1.30
1% LT debt to total capitalization,Unfloored Vehicles 35,728
Total $74,186
70
Future Mortgage Debt Maturities ($M)
1% LT debt to total capitalization, excluding mortgages
30
40
50
60
70
Avg Annual Adj Cash Flow from Ops
0
10
20
2010 2011 2012 2013 2014 2015 2016 Beyond
No significant near term mortgage maturities
22Note: Average annual adjusted cash flow from operations is the average for 2007 to 2009. See appendix for reconciliation of adjusted cash flow from operations

GUIDANCE
Projected earnings of $0.04 ‐ $0.06 for Q1’09 and $0.55 ‐ $0.63 for 2009
Assumptions
Total Revenues at $1.80 to $1.85 billion
New Vehicle same store sales increasing 3.5%
New Vehicle gross margin from 8.1% to 8.3%
Used Vehicle same store sales increasing 7.2%
Used Vehicle gross margin from 14.2% to 14.5%
Service Body and Parts same store sales decreasing 1.0%
Service Body and Parts gross margin from 47.5% to 47.7%
Finance and Insurance gross profit of $955 per unit
Tax rate of 40.0%
Estimated average diluted shares outstanding of 26.2 million
Maintenance capital expenditures of approximately $2.7 million
23
Chrysler market share consistent with full year 2009 levels

APPENDIX
24
MISSION STATEMENTTo be the preferred provider of cars and trucks andTo be the preferred provider of cars and trucks and related services in North America
OUR VALUESOUR VALUESEarn Customers for LifeLet’s listen and understand our customers’ needs. Know that you are empowered to ‘do the right thing.’ Let’s make sure our customers are so satisfied that they refer us to their families and friends
Respect Everyonei h h d i i i iTreat everyone with the utmost respect and integrity. Our reputation is our
competitive advantage – protect it. Be proud of the work you do and the services we provide to our communities
Improve ConstantlyImprove ConstantlyWe work together as a team sharing ideas and best practices to make our customers’ experience easier and faster. Never quit trying to improve your performance
Have FunOur enthusiasm to sell and repair vehicles will set us above our competitors
25

12/31/2009 12/31/2008 12/31/2007 12/31/2006EBITDAEBITDAIncome from continuing operations 10,703 (335,227) 36,635 50,921
Addback:Taxes 4,639 (108,721) 14,865 19,626 Other interest exp 14,063 17,878 16,273 12,206 pDepreciation - building 5,439 5,039 4,567 3,581 Depreciation and amortization - other 12,809 11,904 11,918 9,588
Adjustments:Asset impairments 7,931 340,767 1,215 19 Gain on extinguishment of debt (1,317) (5,248) - -
Adjusted EBITDA 54,267 (73,608) 85,473 95,941
GAAP RECONCILIATIONAdjusted EBITDA
GAAP RECONCILIATION26

12/31/09 12/31/08 12/31/07 12/31/06Pre-tax income from continuing
ti 10 703 (335 227) 36 635 50 921operations 10,703 (335,227) 36,635 50,921
AdjustmentsAsset impairments 7,412 340,767 1,215 19Reserve adjustments 1,854 - - -
Gain on extinguishment of debt (1 317) (5 248) - -Gain on extinguishment of debt (1,317) (5,248) - -Total Proforma Adj 8,039 335,519 1,215 19
Adjusted Pre-tax Income from Continuing Operations 18,742 292 37,850 50,940
Implied Tax Rate 41 1% 12 7% 39 8% 38 6%Implied Tax Rate 41.1% 12.7% 39.8% 38.6%
Adjusted Income from Continuing Operations 11,037 255 22,777 31,297
Diluted Shares 22,037 20,195 22,204 22,207
Adjusted Diluted EPS 0.50 0.01 1.11 1.49
GAAP RECONCILIATIONGAAP RECONCILIATIONAdjusted Annual Diluted EPS
27

Q4’09 Q3’09 Q2’09 Q1’09Pre-tax income from continuing
ti (2 993) 11 217 3 763 (1 284)operations (2,993) 11,217 3,763 (1,284)
AdjustmentsAsset impairments 1,729 1,664 2,956 1,153Reserve adjustments 1,854 - - -Gain on extinguishment of debt - - (231) (1,086)Total Proforma Adj 3,583 1,664 2,725 19
Adjusted Pre-tax Income from Continuing Operations 590 12,881 6,488 (1,217)
Implied Tax Rate 77.6% 39.9% 40.7% 44.1%
Adjusted Income from Continuing Operations 132 7,737 3,848 (680)
Diluted Shares 25,113 21,448 21,096 20,750
Adjusted Diluted EPS 0 01 0 36 0 18 (0 03)Adjusted Diluted EPS 0.01 0.36 0.18 (0.03)
GAAP RECONCILIATIONGAAP RECONCILIATIONAdjusted Quarterly 2009 Diluted EPS
28

Q4’08 Q3’08 Q2’08 Q1’08Pre-tax income from continuing
ti (2 674) 2 279 (333 317) (1 515)operations (2,674) 2,279 (333,317) (1,515)
AdjustmentsAsset impairments 1,147 2,105 337,515 -Gain on extinguishment of debt (3,605) (1,643) - -Total Proforma Adj (2,458) 462 337,515 -
Adjusted Pre-tax Income from Continuing Operations (5,132) 2,741 4,198 (1,515)
Implied Tax Rate 37.7% 31.3% 42.9% 45.2%
Adj t d I f C ti iAdjusted Income from Continuing Operations (3,196) 1,882 2,399 (830)
Diluted Shares 20,519 20,371 20,073 19,873
Adjusted Diluted EPS (0.16) 0.09 0.12 (0.04)
GAAP RECONCILIATIONGAAP RECONCILIATIONAdjusted Quarterly 2008 Diluted EPS
29

12/31/2009 12/31/2008 12/31/2007
Cash flows from operations 9,934 85,165 (49,211)
Flooring notes payable: non-trade 31,417 (16,803) 69,540
Adjusted cash flow from operations 41 351 68 362 20 329Adjusted cash flow from operations 41,351 68,362 20,329
GAAP RECONCILIATIONGAAP RECONCILIATIONAdjusted Cash Flow from Operations
30