Q4 FY 10 - Investor Presentation - Hindalco Industries · Q4 FY 10 - Investor Presentation. 2...
40
Hindalco Industries Ltd Q4 FY 10 - Investor Presentation
Transcript of Q4 FY 10 - Investor Presentation - Hindalco Industries · Q4 FY 10 - Investor Presentation. 2...
Hindalco Industries LtdQ4 FY 10 - Investor Presentation
2
Performance Highlights
Economy & Industry
Projects
Financials

Performance Highlights
Strong Operating PerformanceHighest ever Production. YOY..
Alumina up 6%
Aluminium up 6%
Copper up 12%
Better geography and product-mixCost of production brought down despite input cost pressures
Greenfield projects remain on track, facilitated by various financing initiatives
Reduced earnings volatility through early adoption of AS 30
3
All-round improvement in performanceAll-round improvement in performance

Economic Backdrop
4

Economic recovery gathered momentum
GDP Growth (%)ChinaG-7 IMF expects world GDP
growth to bounce back to 4.2% in 2010 after (0.6)% in 2009
It’s a ‘multi-speed’ recoveryo US returning to ~3% growtho Europe languishing at ~0-1%o China +10%, India +8%
Concerns over fiscal deficit and public debt in developed nations, China & India worried about overheating
5
11.93.6
6.2
-8.5
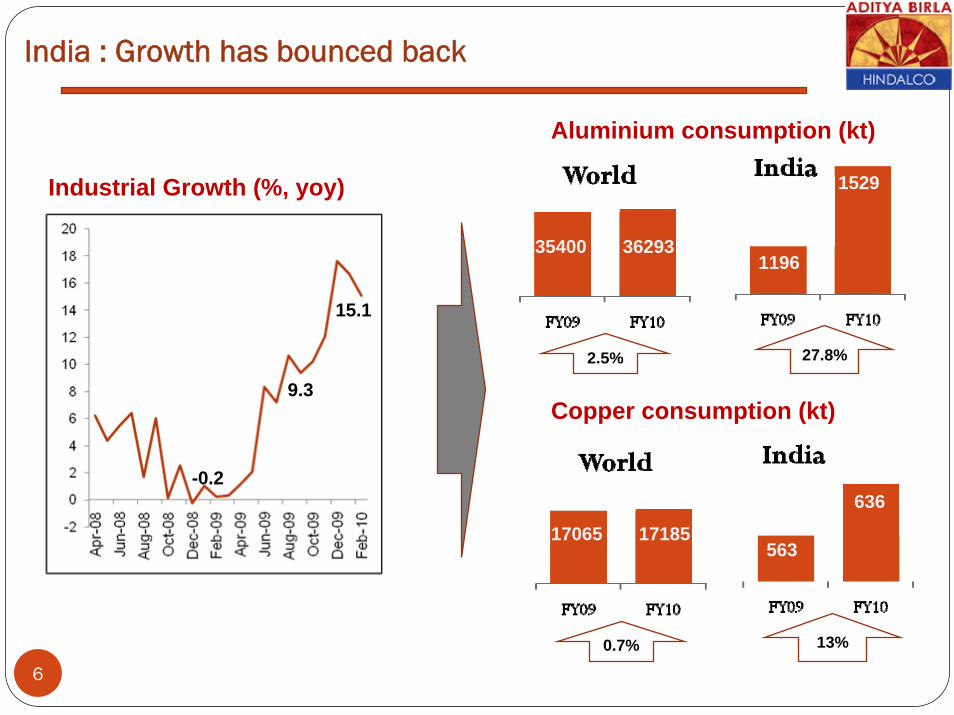
India : Growth has bounced back
Industrial Growth (%, yoy)
Aluminium consumption (kt)
35400 36293
2.5%
1196
1529
27.8%
Copper consumption (kt)
17065 17185
0.7%
563
636
13%
6
15.1
9.3
-0.2

Al 2010: Rebound in world consumption
Leading Indicators Positive… World Aluminium Consumption: Rebound from demand destruction
7
Rising above 100 for last 5 months
3741934302
39001
(kt)
N America +11%
Europe +9%
China +18%
India +14%
Oth. Asia
RoW8.3%
13.7%
- Asia driving growth- Western world demand witnessing recovery, still short of 2008 levels
Global Mfg PMI
57.8Apr

Al: Surplus continues…
8
World Aluminium Production
4013137670
41927(kt)
RoW-8%
N America, Europe ~0%
China +27%
India, ME +29%
6.1%
11.3% Stocks have remained at elevated levels, though steady for last 3 qtrs …
LME ($/t)
Exch. stocks (mn ton)
2324
4.70
3.97
1421
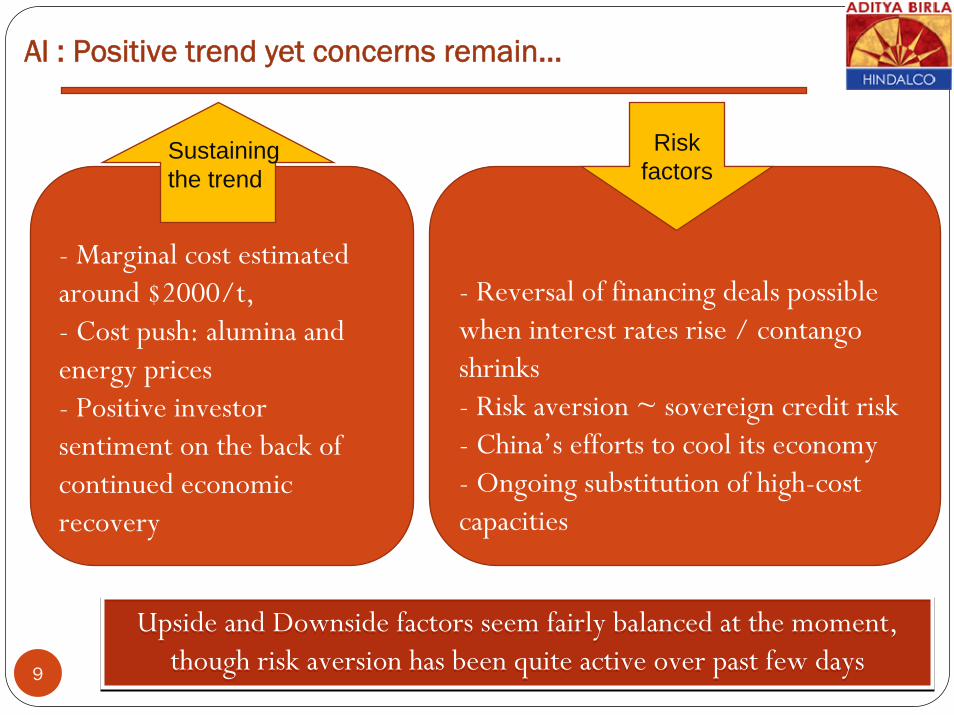
Al : Positive trend yet concerns remain…
9
Upside and Downside factors seem fairly balanced at the moment, though risk aversion has been quite active over past few days
Upside and Downside factors seem fairly balanced at the moment, though risk aversion has been quite active over past few days
- Marginal cost estimated around $2000/t, - Cost push: alumina and energy prices- Positive investor sentiment on the back of continued economic recovery
- Reversal of financing deals possible when interest rates rise / contangoshrinks- Risk aversion ~ sovereign credit risk- China’s efforts to cool its economy- Ongoing substitution of high-cost capacities
Risk factors
Sustaining the trend

Copper: Still strong as mine supply lags behind
Global Mine Supply Deficit
LME driven up by investors and improving economy, despite rising stocks
World consumption projected to rise 8% in 2010 to 18 mnton; surplus to shrink to 162 ktfrom 1,404 kt in 2009 (CRU)
Global deficit in concentrate supply continues
Long-term TCRC for 2010 settled at 40% below 2009 level
10
(kt)
78% 76% 72% 69% 66%
World Smelter Capacity Utlization
LME ($/t)
Exch. stocks (kt)
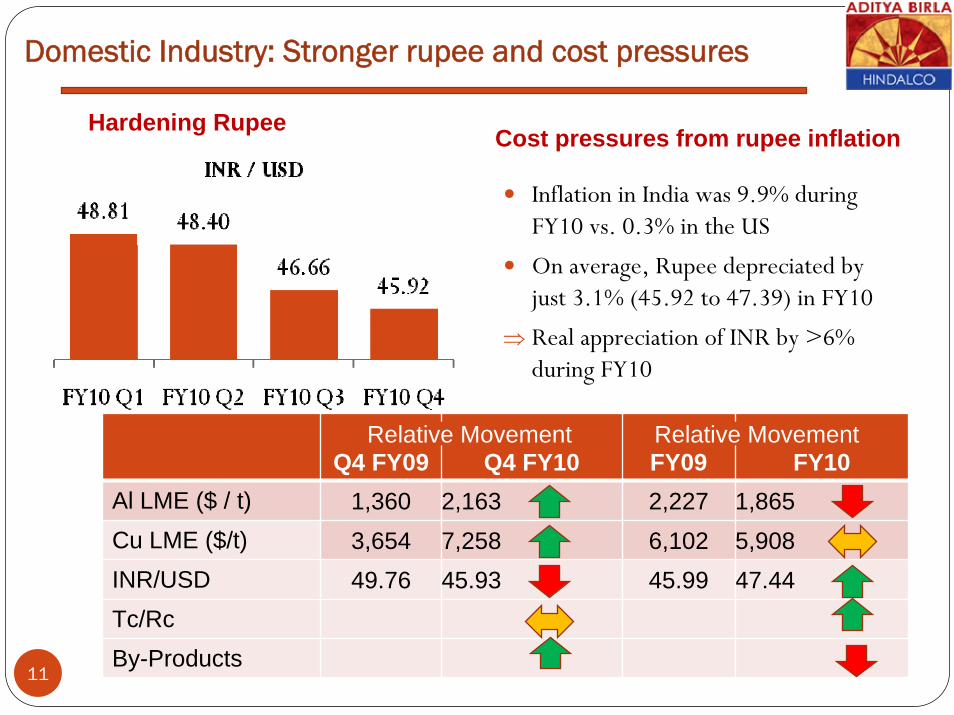
Domestic Industry: Stronger rupee and cost pressures
11
Inflation in India was 9.9% during FY10 vs. 0.3% in the US
On average, Rupee depreciated by just 3.1% (45.92 to 47.39) in FY10
⇒ Real appreciation of INR by >6% during FY10
Cost pressures from rupee inflationHardening Rupee
Q4 FY09 Q4 FY10 FY09 FY10Al LME ($ / t) 1,360 2,163 2,227 1,865Cu LME ($/t) 3,654 7,258 6,102 5,908INR/USD 49.76 45.93 45.99 47.44Tc/RcBy-Products
Relative Movement Relative Movement

Performance Review - Aluminium
12

Highlights – FY10
Strong Operating Performance
Highest ever alumina & aluminium Production
Aluminium capacity Up by 8 ktpa
Better geography and product-mix
Cost of production brought down despite input cost pressures
Greenfield projects remain on track, facilitated by various
financing initiatives
13
Best ever operational performanceBest ever operational performance

Production Performance: FY10
14
Metal (kt)
523
555
FY09 FY10
6%6% 23%
FRP (kt)
182205
FY09 FY10
13%8%
Higher Alumina and
Metal Production on the
back of brownfield
expansions
Increased volumes of
downstream value added
products

Extrusion
7,115
9,751
Q4 FY09 Q4 FY10
FRP
44,310
47,781
Q4 FY09 Q4 FY10
Wire Rod
20,264
23,177
Q4 FY09 Q4 FY10
Metal
133,179
138,023
Q4 FY09 Q4 FY10
Alumina
318,325
343,801
Q4 FY09 Q4 FY10
Production Performance: Q4 FY10
15
8% 4% 14%
8% 8%
All round improvement
in production
Higher VAP
Production
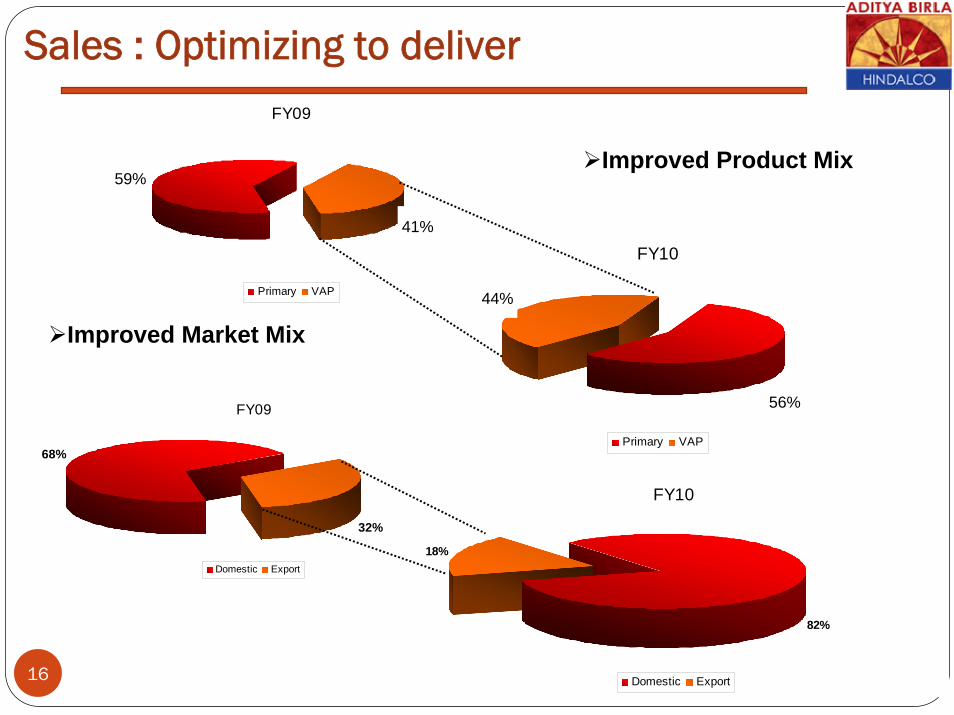
Sales : Optimizing to deliver
16
FY09
68%
32%
Domestic Export
FY10
82%
18%
Domestic Export
Improved Product Mix
Improved Market Mix
FY09
60%
40%
Primary VAP
FY10
57%
43%
Primary VAP
59%
41%
44%
56%
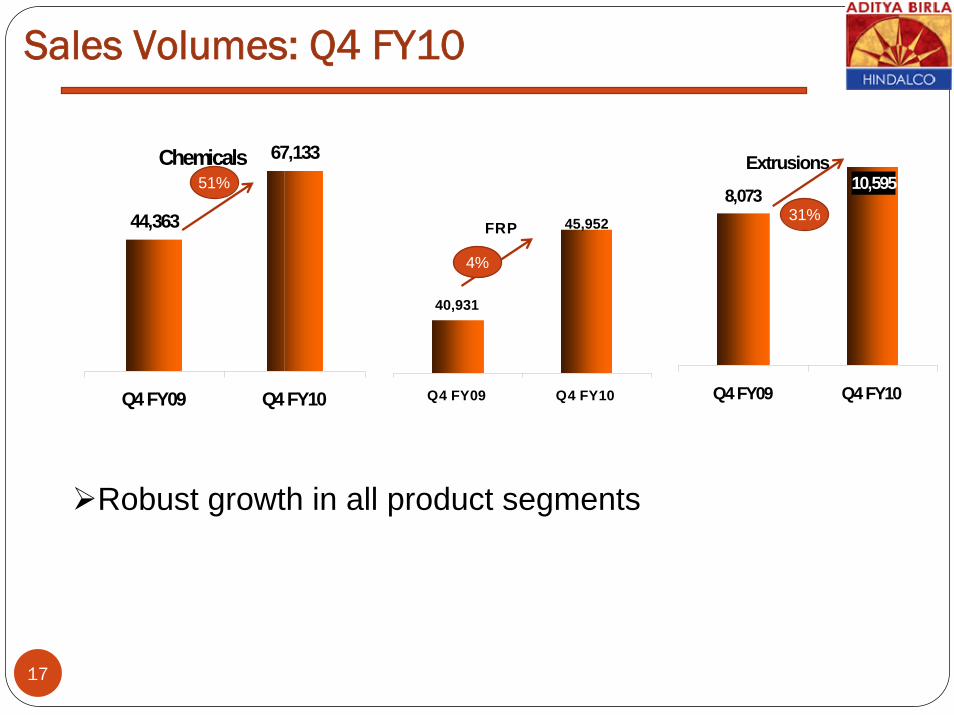
Extrusions
8,07310,595
Q4 FY09 Q4 FY10
FRP
40,931
45,952
Q4 FY09 Q4 FY10
Chemicals
44,363
67,133
Q4 FY09 Q4 FY10
Sales Volumes: Q4 FY10
17
51%
4%
31%
Robust growth in all product segments

Aluminium Business – Financial Performance
18
Q4 FY09 Q4 FY10 Change
Net Sales & Operating Revenue 1,561 2,045 31%
EBIT 163 614 278%
(Rs cr)
FY09 FY10 Change
Net Sales & Operating Revenue 7,604 7,001 (8)%
EBIT 2,158 1,767 (18)%
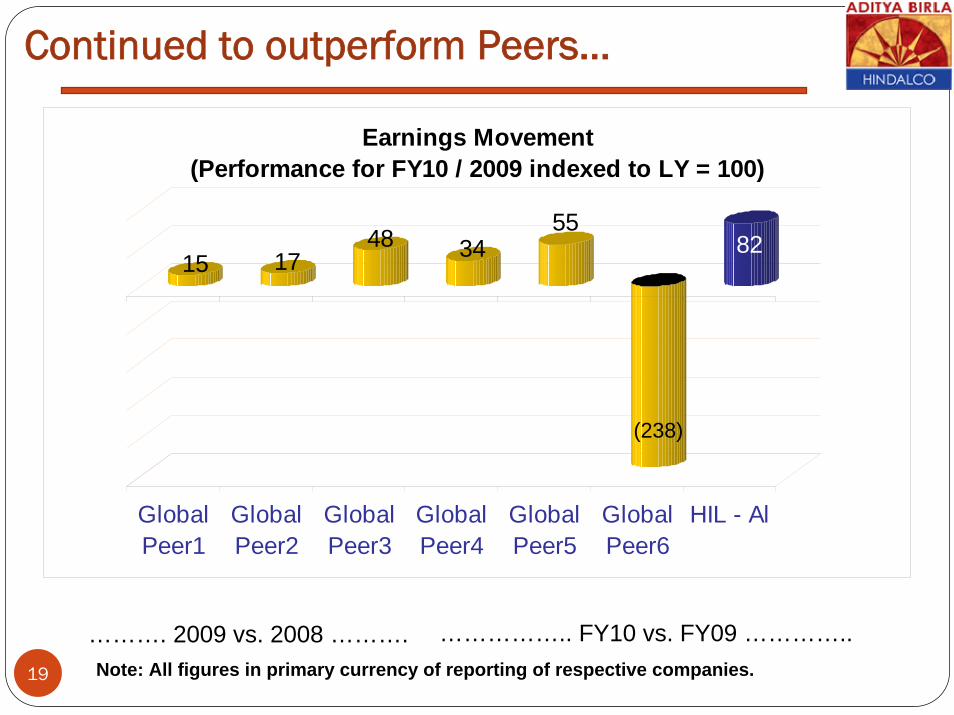
Continued to outperform Peers…
19
15 1748 34
5582
GlobalPeer1
GlobalPeer2
GlobalPeer3
GlobalPeer4
GlobalPeer5
GlobalPeer6
HIL - Al
Earnings Movement(Performance for FY10 / 2009 indexed to LY = 100)
………. 2009 vs. 2008 ………. …………….. FY10 vs. FY09 …………..Note: All figures in primary currency of reporting of respective companies.
(238)
Performance Review - Copper
20

Highlights – FY10
Highest ever copper production
Improved operational efficiencies & continued cost reduction
focus
Strong Financial Performance despite adverse Industry
dynamics
Commissioning of CCR-II, copper rod facility
Better geographical and product-mix
21Best ever operational performanceBest ever operational performance

Operational Performance: FY10
22
12%
Sulfuric Acid (kt)
999
1,043
FY09 FY10
4% 7%
Production growth despite 16 kt copper output lost in Q4 due to annual shutdown (38 days) in Cu-I
(kt) Q4 FY09 Q4 FY10*
Cathode 87 75
CCRods (Own) 31 37
Sulfuric acid 295 233
DAP 48 51
Q4 FY10*Decline in production due to Planned shutdown
122
1317%
CC Rods (Own)

Copper Business – Financial Performance
23 Complimentary Business Portfolio model vindicatedComplimentary Business Portfolio model vindicated
Q4 FY09 Q4 FY10 Change
Net Sales & Operating Revenue 2,213 3,361 52%
EBIT 51 127 150%
(Rs cr)
FY09 FY10 Change
Net Sales & Operating Revenue 10,625 12,542 18%
EBIT 379 660 74%

Projects
24

Hirakud Smelter and Power Plant Expansion
25
Smelter expansion from 155 to 161 KTPA (addition of 28 pots) is nearing completion, 12 pots ready for commissioning.
Project commissioning by Q2FY11
Smelter expansion from 155 to 161 KTPA (addition of 28 pots) is nearing completion, 12 pots ready for commissioning.
Project commissioning by Q2FY11
Smelter Expansion
Capacity increase from 161 to 213 KTPA through addition of 80 Pots of 235 kA
Power Plant Expansion
Capacity to increase to 467.5 MW by Addition of 100 MW.
Project Schedule
30 pots to be commissioned by Dec’2011 & balance 50 pots by Mar’2012.
Technology GAMI Design
Progress 1. Land Acquisition completed & Statutory clearances obtained2. Technology agreement finalized with GAMI3. BTG order placed this quarter
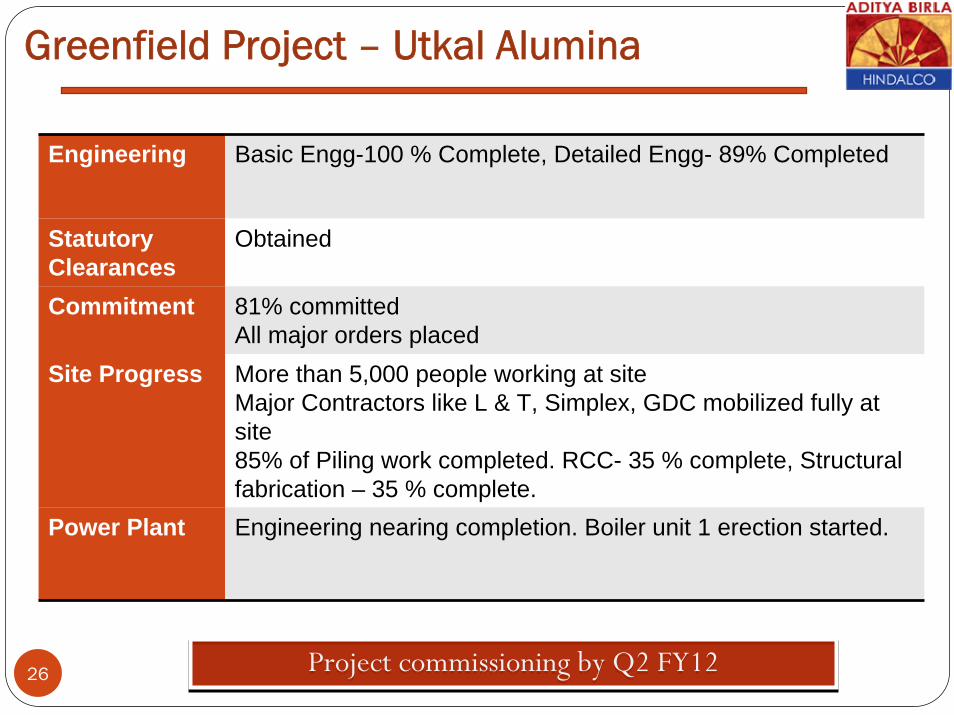
Greenfield Project – Utkal Alumina
26 Project commissioning by Q2 FY12Project commissioning by Q2 FY12
Engineering Basic Engg-100 % Complete, Detailed Engg- 89% Completed
Statutory Clearances
Obtained
Commitment 81% committedAll major orders placed
Site Progress More than 5,000 people working at siteMajor Contractors like L & T, Simplex, GDC mobilized fully at site85% of Piling work completed. RCC- 35 % complete, Structural fabrication – 35 % complete.
Power Plant Engineering nearing completion. Boiler unit 1 erection started.

2727
Greenfield Project Greenfield Project –– UtkalUtkal AluminaAlumina
Q4 FY09 Q4 FY10
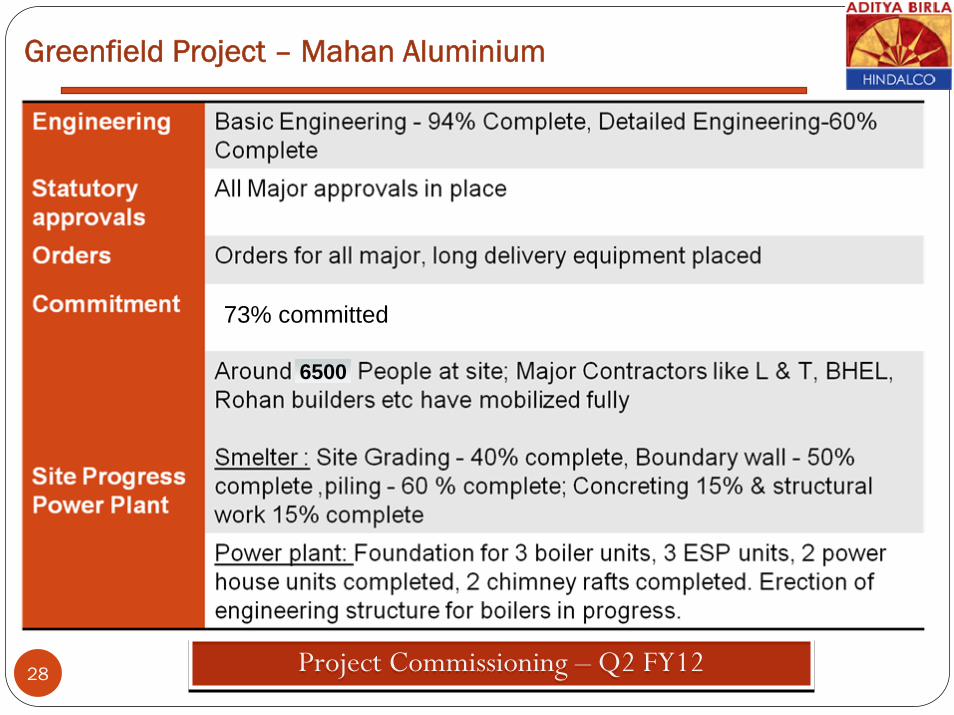
Greenfield Project – Mahan Aluminium
28 Project Commissioning – Q2 FY12 Project Commissioning – Q2 FY12
6500
73% committed

Mahan Smelter – Progress on ground
29
Mech. & Elect. Work shop Pot room”A”
Sub-station east Pot line Anode paste plant bldg.

Mahan CPP – Progress on ground
30
Chimey #1: RCC Shell in progress Boiler #1: Structural erection in progress
ESP #1: Structural erection in progressTG#1 RCC Columns: Reinforcement and
shuttering in progress
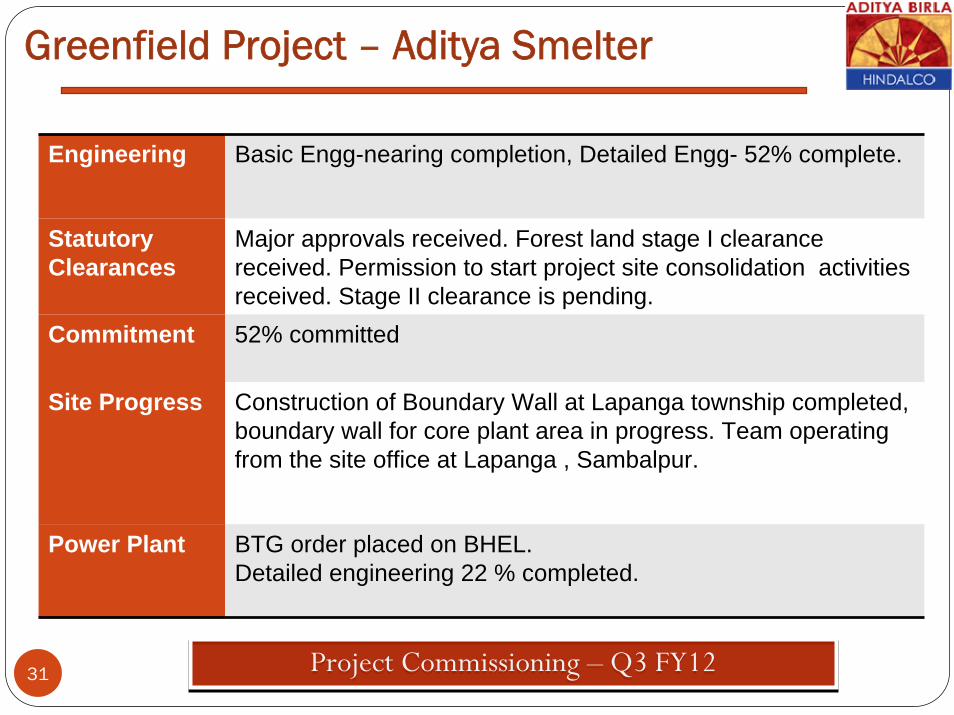
Greenfield Project – Aditya Smelter
31 Project Commissioning – Q3 FY12Project Commissioning – Q3 FY12
Engineering Basic Engg-nearing completion, Detailed Engg- 52% complete.
Statutory Clearances
Major approvals received. Forest land stage I clearance received. Permission to start project site consolidation activities received. Stage II clearance is pending.
Commitment 52% committed
Site Progress Construction of Boundary Wall at Lapanga township completed, boundary wall for core plant area in progress. Team operating from the site office at Lapanga , Sambalpur.
Power Plant BTG order placed on BHEL. Detailed engineering 22 % completed.
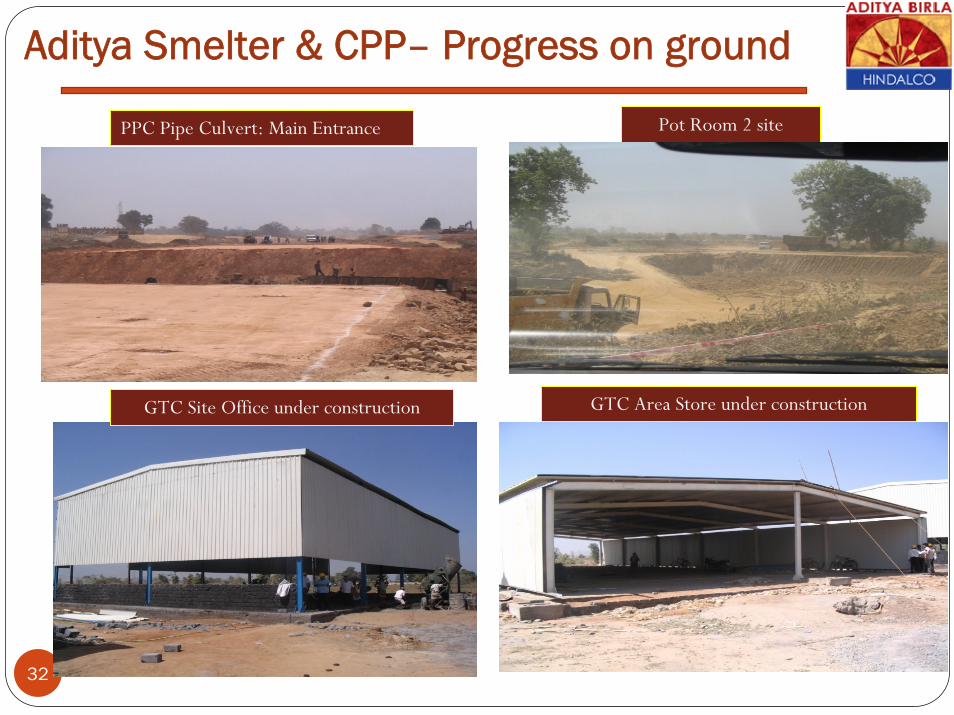
Aditya Smelter & CPP– Progress on ground
32
PPC Pipe Culvert: Main Entrance Pot Room 2 site
GTC Site Office under construction GTC Area Store under construction

Brownfield Project: Can Body stock at Hirakud(Project Blue Fox )
33 Project Commissioning – Q2 FY12Project Commissioning – Q2 FY12
Dismantling of assets at Rogerstone
Dismantling more than 65 % complete. To be completed by July 2010
Receipt of equipments in India
250 containers ( ~20 MT each) dispatched from site( Total scope – 450 no) & around 100 no of containers received in India.1st Break bulk consignment , containing 4500 MT of equipments scheduled to leave UK port in May 2nd week.
Cold Mill Order placed on Achenback.
Hot Mill up gradation Parkegate, UK is working on this.
Civil work Expected to start at site by mid June.
OPCB clearance
Consent to establish received from OPCB to establish Blue fox on K plot in Hirakud & Forest clearance received for tree cutting from DFO. Tree cutting started.
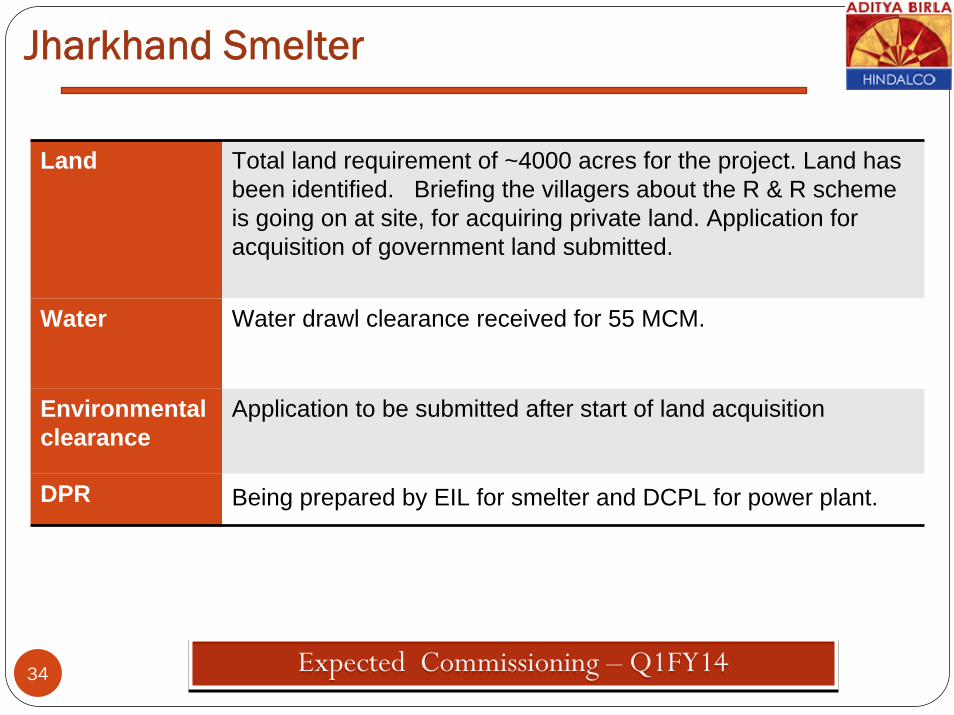
Jharkhand Smelter
34 Expected Commissioning – Q1FY14Expected Commissioning – Q1FY14
Land Total land requirement of ~4000 acres for the project. Land has been identified. Briefing the villagers about the R & R schemeis going on at site, for acquiring private land. Application foracquisition of government land submitted.
Water Water drawl clearance received for 55 MCM.
Environmental clearance
Application to be submitted after start of land acquisition
DPR Being prepared by EIL for smelter and DCPL for power plant.
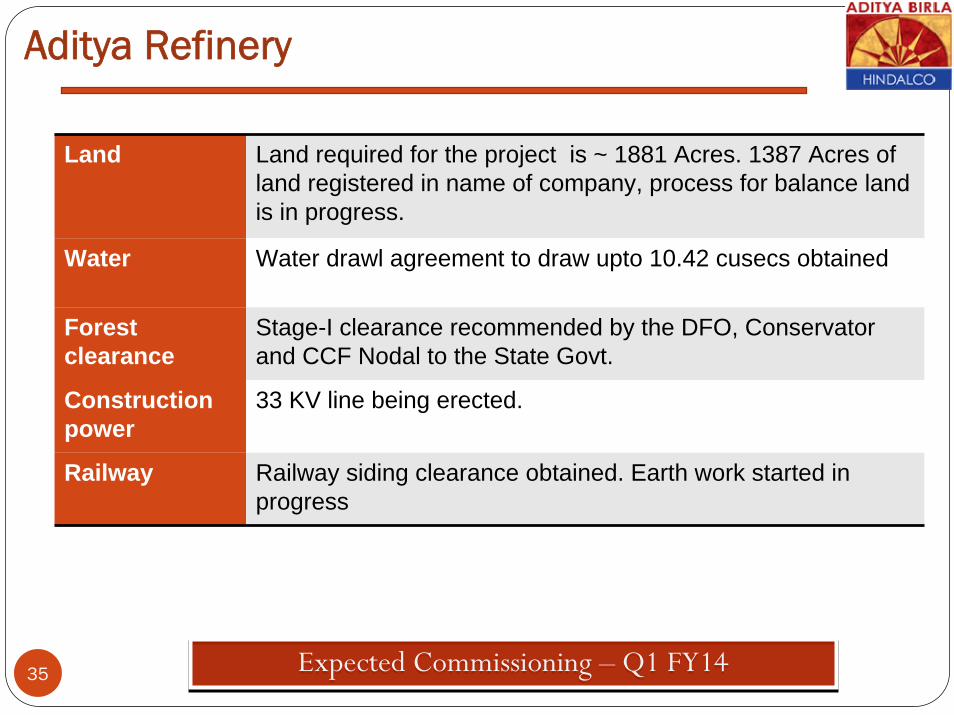
Aditya Refinery
35 Expected Commissioning – Q1 FY14Expected Commissioning – Q1 FY14
Land Land required for the project is ~ 1881 Acres. 1387 Acres of land registered in name of company, process for balance land is in progress.
Water Water drawl agreement to draw upto 10.42 cusecs obtained
Forest clearance
Stage-I clearance recommended by the DFO, Conservator and CCF Nodal to the State Govt.
Construction power
33 KV line being erected.
Railway Railway siding clearance obtained. Earth work started in progress

Financials
36
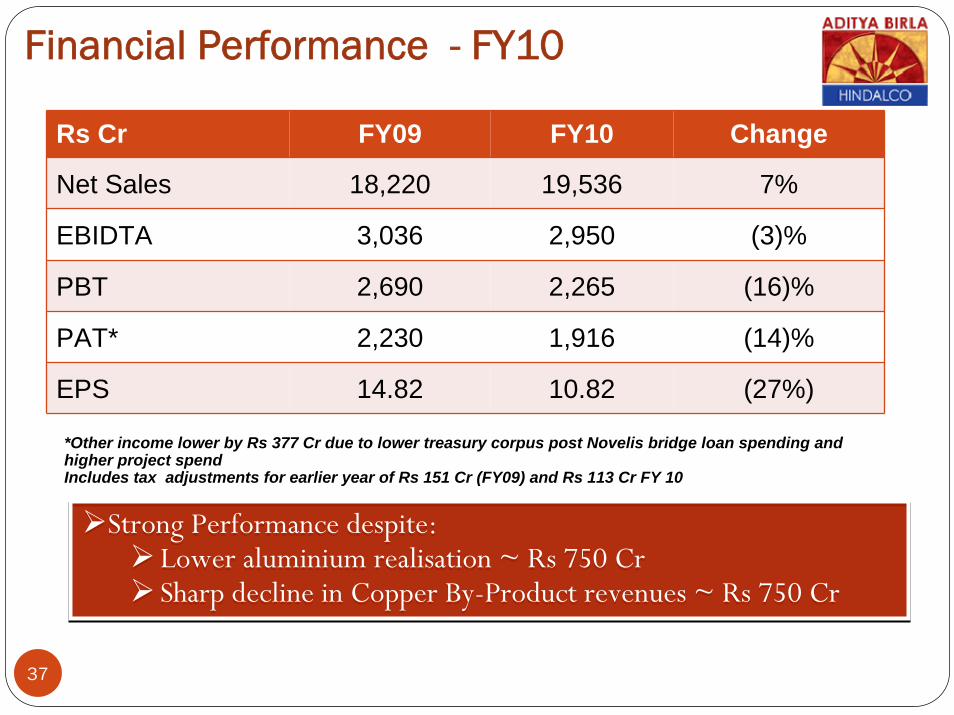
Financial Performance - FY10
37
Rs Cr FY09 FY10 Change
Net Sales 18,220 19,536 7%
EBIDTA 3,036 2,950 (3)%
PBT 2,690 2,265 (16)%
PAT* 2,230 1,916 (14)%
EPS 14.82 10.82 (27%)
Strong Performance despite:Lower aluminium realisation ~ Rs 750 CrSharp decline in Copper By-Product revenues ~ Rs 750 Cr
Strong Performance despite:Lower aluminium realisation ~ Rs 750 CrSharp decline in Copper By-Product revenues ~ Rs 750 Cr
*Other income lower by Rs 377 Cr due to lower treasury corpus post Novelis bridge loan spending and higher project spendIncludes tax adjustments for earlier year of Rs 151 Cr (FY09) and Rs 113 Cr FY 10
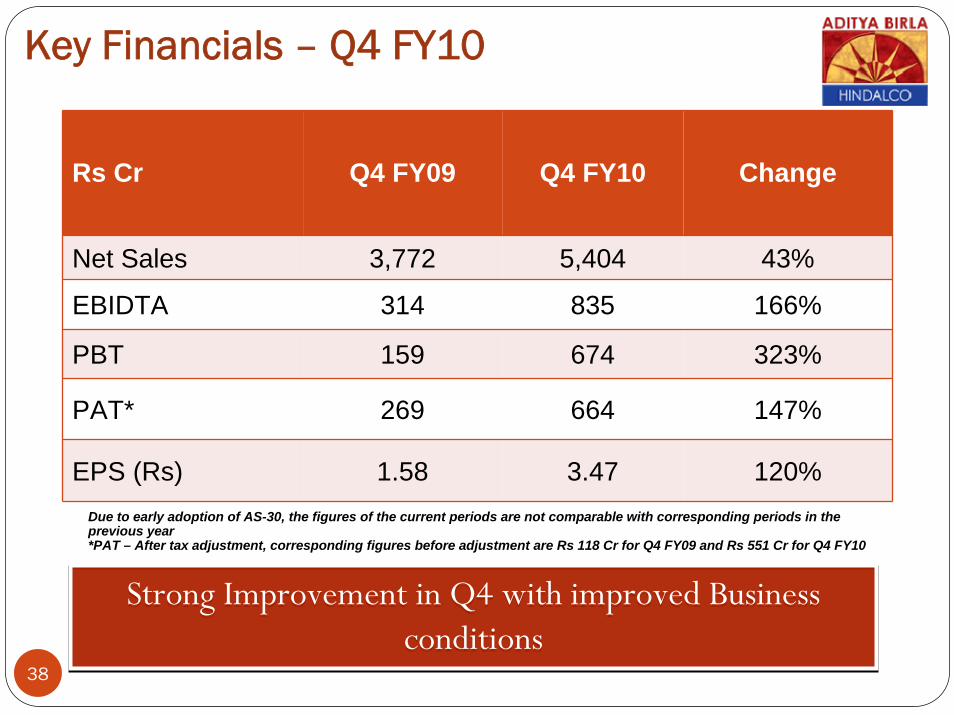
Key Financials – Q4 FY10
38
Rs Cr Q4 FY09 Q4 FY10 Change
Net Sales 3,772 5,404 43%
EBIDTA 314 835 166%
PBT 159 674 323%
PAT* 269 664 147%
EPS (Rs) 1.58 3.47 120%
Strong Improvement in Q4 with improved Business conditions
Strong Improvement in Q4 with improved Business conditions
Due to early adoption of AS-30, the figures of the current periods are not comparable with corresponding periods in the previous year*PAT – After tax adjustment, corresponding figures before adjustment are Rs 118 Cr for Q4 FY09 and Rs 551 Cr for Q4 FY10
Thank you
39

40
Certain statements in this report may be “forward looking statements” within the meaning of applicable securities laws and regulations. Actual results could differ materially from those expressed or implied. Important factors that could make a difference to the company’s operations include global and Indian demand supply conditions, finished goods prices, feed stock availability and prices, cyclical demand and pricing in the company’s principal markets, changes in Government regulations, tax regimes, economic developments within India and the countries within which the company conducts business and other factors such as litigation and labour negotiations. The company assume no responsibility to publicly amend, modify or revise any forward looking statement, on the basis of any subsequent development, information or events, or otherwise.
Forward Looking & Cautionary Statement