Q4 and FY 2017 Results Presentation - sanofi.com · generally identified by the words "expects",...
50
Q4 and Full Year 2017 Results February 7, 2018
-
Upload
vuonghuong -
Category
Documents
-
view
213 -
download
0
Transcript of Q4 and FY 2017 Results Presentation - sanofi.com · generally identified by the words "expects",...

Q4 and Full Year 2017 Results
February 7, 2018
2
Forward Looking Statements
This presentation contains forward-looking statements as defined in the Private Securities Litigation Reform Act of 1995, as amended.
Forward-looking statements are statements that are not historical facts. These statements include projections and estimates and their
underlying assumptions, statements regarding plans, objectives, intentions and expectations with respect to future financial results, events,
operations, services, product development and potential, and statements regarding future performance. Forward-looking statements are
generally identified by the words "expects", "anticipates", "believes", "intends", "estimates", "plans" and similar expressions. Although
Sanofi's management believes that the expectations reflected in such forward-looking statements are reasonable, investors are cautioned
that forward-looking information and statements are subject to various risks and uncertainties, many of which are difficult to predict and
generally beyond the control of Sanofi, that could cause actual results and developments to differ materially from those expressed in, or
implied or projected by, the forward-looking information and statements. These risks and uncertainties include among other things, the
uncertainties inherent in research and development of new products, including future clinical trial results and analysis of clinical data
(including post-marketing data), decisions by regulatory authorities, such as the FDA or the EMA, regarding whether and when to approve
any drug, device or biological application that may be filed for any such product candidates as well as their decisions regarding labelling
and other matters that could affect the availability or commercial potential of such product candidates. There are additional risks that may
cause actual results to differ materially from those contemplated by the forward-looking statements, such as the lack of commercial
success of certain product candidates once approved, pricing pressures, both in the United States and abroad, including pharmaceutical
reimbursement and pricing, the future approval and commercial success of therapeutic alternatives, risks associated with intellectual
property and any related pending or future litigation and the ultimate outcome of such litigation, changes in applicable laws or regulations,
the impact of cost containment initiatives and subsequent changes thereto, as well as those risks and uncertainties discussed or identified
in the public filings with the SEC and the AMF made by Sanofi, including those listed under "Risk Factors" and "Cautionary Statement
Regarding Forward-Looking Statements" in Sanofi's annual report on Form 20-F for the year ended December 31, 2016. Other than as
required by applicable law, Sanofi does not undertake any obligation to update or revise any forward-looking information or statements.
3
Agenda
Key Highlights
• Olivier Brandicourt - Chief Executive Officer
Sustaining Innovation
• Elias Zerhouni - President, Global R&D
Financial Results
• Jérôme Contamine - Executive Vice President, Chief Financial Officer
Q&A Session
• Olivier Charmeil - Executive Vice President, General Medicines & Emerging Markets
• Karen Linehan - Executive Vice President, Legal Affairs and General Counsel
• David Loew - Executive Vice President, Sanofi Pasteur
• Alan Main - Executive Vice President, Consumer Healthcare
• Stefan Oelrich - Executive Vice President, Diabetes & Cardiovascular
• Bill Sibold - Executive Vice President, Sanofi Genzyme

Olivier Brandicourt Chief Executive Officer
KEY HIGHLIGHTS
5
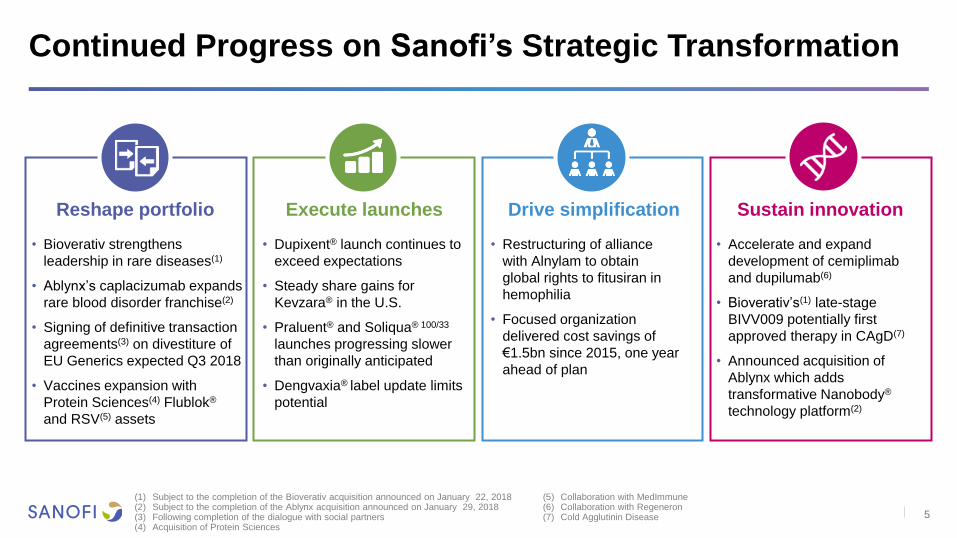
Continued Progress on Sanofi’s Strategic Transformation
(1) Subject to the completion of the Bioverativ acquisition announced on January 22, 2018 (2) Subject to the completion of the Ablynx acquisition announced on January 29, 2018 (3) Following completion of the dialogue with social partners (4) Acquisition of Protein Sciences
(5) Collaboration with MedImmune (6) Collaboration with Regeneron (7) Cold Agglutinin Disease
Sustain innovation
• Accelerate and expand
development of cemiplimab
and dupilumab(6)
• Bioverativ’s(1) late-stage
BIVV009 potentially first
approved therapy in CAgD(7)
• Announced acquisition of
Ablynx which adds
transformative Nanobody®
technology platform(2)
Drive simplification
• Restructuring of alliance
with Alnylam to obtain
global rights to fitusiran in
hemophilia
• Focused organization
delivered cost savings of
€1.5bn since 2015, one year
ahead of plan
Reshape portfolio
• Bioverativ strengthens
leadership in rare diseases(1)
• Ablynx’s caplacizumab expands
rare blood disorder franchise(2)
• Signing of definitive transaction
agreements(3) on divestiture of
EU Generics expected Q3 2018
• Vaccines expansion with
Protein Sciences(4) Flublok®
and RSV(5) assets
Execute launches
• Dupixent® launch continues to
exceed expectations
• Steady share gains for
Kevzara® in the U.S.
• Praluent® and Soliqua® 100/33
launches progressing slower
than originally anticipated
• Dengvaxia® label update limits
potential

6
Value Value
Creation
Build
Leadership
Position
Strengthen
Pipeline
Immediate
EPS
Accretion
(1) ROIC>WACC in 3 to 5 years
(2) Business EPS is a non-GAAP financial measure (see appendix to Sanofi quarterly financial release definitions)
Strategically and Financially Compelling M&A to Enhance Sanofi’s Growth Profile and Create Value
Transforming the lives of
people with hemophilia, cold
agglutinin disease and other
rare blood disorders
$11.6 bn
€3.9 bn
Nanobody technology to
develop therapeutics in
areas of high unmet medical
need
~
(1) (2)
7
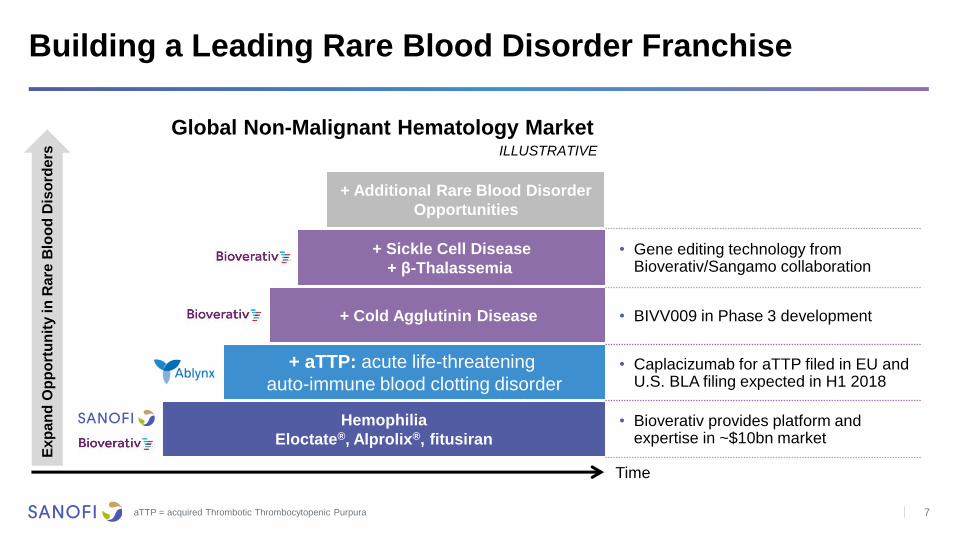
Building a Leading Rare Blood Disorder Franchise E
xp
an
d O
pp
ort
un
ity in
Ra
re B
loo
d D
iso
rde
rs
+ Sickle Cell Disease
+ β-Thalassemia
+ Additional Rare Blood Disorder
Opportunities
Time
Global Non-Malignant Hematology Market ILLUSTRATIVE
Hemophilia
Eloctate®, Alprolix®, fitusiran
+ Cold Agglutinin Disease
+ aTTP: acute life-threatening
auto-immune blood clotting disorder • Caplacizumab for aTTP filed in EU and
U.S. BLA filing expected in H1 2018
• BIVV009 in Phase 3 development
• Bioverativ provides platform and expertise in ~$10bn market
• Gene editing technology from Bioverativ/Sangamo collaboration
aTTP = acquired Thrombotic Thrombocytopenic Purpura

8
Sanofi Focuses on Leading Technology Platforms
Acquisition of Ablynx
internalizes platform for
Nanobodies®, a novel
class of next-generation
biologics
Addressing Multiple Disease Targets with Single Complex Molecules
siRNA
Conjugates
BioNTech
mRNA Mixture
PRR Antibody
Conjugates
Trigonal
Peptides Multispecific
Antibodies
(bi- & tri-specific)
Ablynx
Nanobodies
PRR = Pattern Recognition Receptor
CH2
CH3
VHH VHH
9
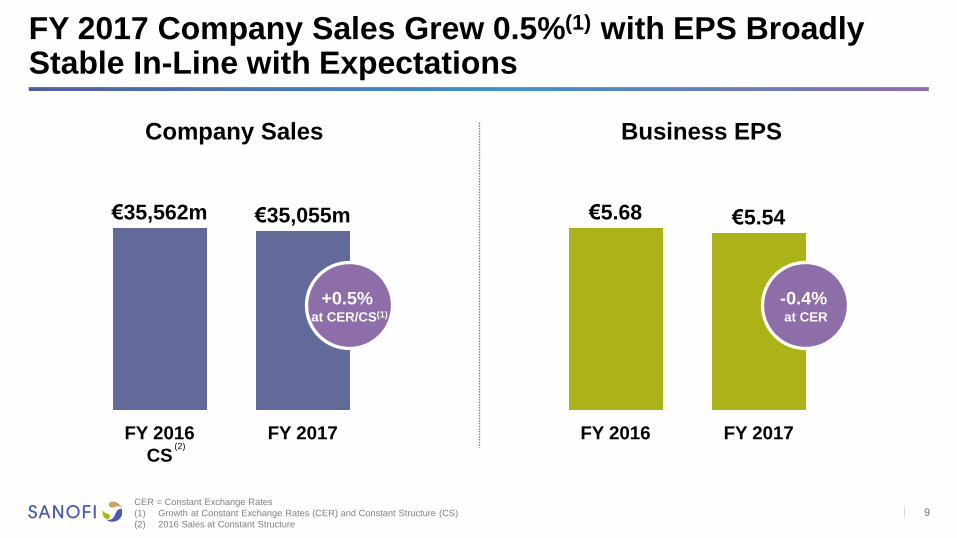
FY 2017 Company Sales Grew 0.5%(1) with EPS Broadly Stable In-Line with Expectations
Company Sales Business EPS
FY 2017
€5.54
FY 2016
€5.68
-0.4% at CER
€35,055m
FY 2016
CS
€35,562m
FY 2017
+0.5% at CER/CS(1)
CER = Constant Exchange Rates
(1) Growth at Constant Exchange Rates (CER) and Constant Structure (CS)
(2) 2016 Sales at Constant Structure
(2)

10
FY 2017 Sales Stable(1) Despite Losses of Exclusivity (LoE)
FY 2017 Company Sales
FY 2017
€1,741m
FY 2016
€33,821m
Six Key
Launches
-€299m
FY 2016
CS
Other
€35,562m
-€672m
BI CHC /
SPMSD
Fx
€35,055m
€464m
+0.5% at CER/CS(1)
(2) (3) (4)
(1) Growth at Constant Exchange Rates (CER) and Constant Structure (CS)
(2) Primarily includes SPMSD (€261m) and BI CHC (€1,544m on a Full Sales recognition
basis) in 2016. Minor disposal of CHC activities in China is also included.
(3) 2016 Sales at Constant Structure
(4) Sales including Dengvaxia, Dupixent, Kevzara Praluent, Soliqua 100/33 and
Toujeo, all at CER

11
Specialty Care Strong in Q4 while DCV Declines as Expected and Sevelamer Generics Impact GEM(1)
Q4 2017 Sales by Global Business Unit Growth
at CER/CS(2)
(1) General Medicines & Emerging Markets
(2) Growth at CER and Constant Structure on the basis of Q4 2016 sales including CHC
sales from Boehringer Ingelheim, SPMSD sales and others
(3) Does not include Emerging Markets sales
(4) On a CER basis, growth was +8.7%
(5) Consumer Healthcare includes sales in Emerging Markets
(6) On a CER basis, growth was +51.8%
(7) Includes Emerging Markets sales for Diabetes & Cardiovascular and Specialty Care
(8) Emerging Markets: World excluding U.S., Canada, Western & Eastern Europe
(except Eurasia), Japan, South Korea, Australia, New Zealand and Puerto Rico
(9) Excluding global Consumer Healthcare sales and Vaccines
Company Sales €8,691m
-1.6%
€1,297m
Diabetes & Cardiovascular -19.1%
€1,466m
Sanofi Genzyme (Specialty Care) +16.9%
€1,385m
Sanofi Pasteur (Vaccines) +1.2%
€3,347m
General Medicines & Emerging Markets -2.7% (7,8,9)
(3)
(3)
(5) €1,196m
Consumer Healthcare +2.5% (6)
(4)

12
Diversified Business Model Moderates Negative Effects from LoEs in Developed Markets and Dengvaxia in Q4
Q4 2017 Sales by Franchise
LoEs = Losses of Exclusivity
(1) Growth at CER and Constant Structure
(2) Excluding Dengvaxia, Q4 2017 sales were down -1.2%
(3) Pharmaceutical sales were up +4.0% at CER/CS in Emerging Markets in Q4 2017
Developed Markets Emerging Markets(3)
Growth at
CER/CS(1)
Total
Sales
Growth at
CER/CS(1) Sales
Specialty Care +16.6% €1,714m
+15.0% +16.9% €1,466m
€248m
Diabetes & Cardiovascular -14.2% €1,663m
+8.7% -19.1% €1,297m
€366m
Sales Growth at
CER/CS(1)
Vaccines +1.2% €1,385m
-6.1% +5.3% €914m
€471m
Established Rx Products -6.0% €2,298m
+3.3% -11.4% €1,397m
€901m
Generics -1.9% €435m
-3.8% -0.4% €252m
€183m
Consumer Healthcare +2.5% €1,196m
-0.5% +4.1% €796m
€400m
(2)

13
Immunology Franchise Emerges as Significant Growth Driver for Specialty Care in Q4 2017
Global Specialty Care Franchise Sales
Q4 2016 Q4 2017
Immunology
Rare Diseases
Multiple Sclerosis
Oncology
€716m
€1,714m
€726m +8.0%
€501m +10.5%
€484m
€369m €361m
+3.5%
€1,569m
+16.5% at CER
• Immunology franchise achieved sales of €126m
• Dupixent sales reached €118m
• Kevzara launch progressing well, capturing 15% of
NBRx market share in the U.S.(1)
• Rare Disease franchise grew 8% driven by solid
performance of our three core LSD franchises(2)
• Multiple Sclerosis franchise up +11% despite
increased competition in the U.S.
• Aubagio up +14% to €389m
• Lemtrada stable at €112m
€126m
All growth at CER
(1) Source: IMS NPA MD December 2017.
(2) Lysosomal Storage Disorder core franchise (Gaucher, Fabry, Pompe and MPS I). LSD products grew 8.5% at CER in Q4 2017
FY 2017 sales increased +14.5% at CER

14
Global Roll-Out in Atopic Dermatitis in 2018
AD = Atopic Dermatitis; DTC = Direct To Consumer
Launched in the U.S. in April 2017, Germany in December 2017, the Netherlands in January 2018 and Denmark in February 2018
(1) As of February 2, 2018
(2) Persistent, uncontrolled asthma in adults and adolescent
+ 8 Emerging Market
countries
2017 Launches and 2018 Expected Launches
• AD: U.S. launch continues to exceed
expectations
• >33,000 patients prescribed(1)
• Focus on prescribers depth
• Targeted awareness DTC campaign
• FDA submission in asthma completed(2)
• Pre-launch activities focused on
allergists / pulmonologists
H1 2017
H2 2017
H1 2018
H2 2018
15
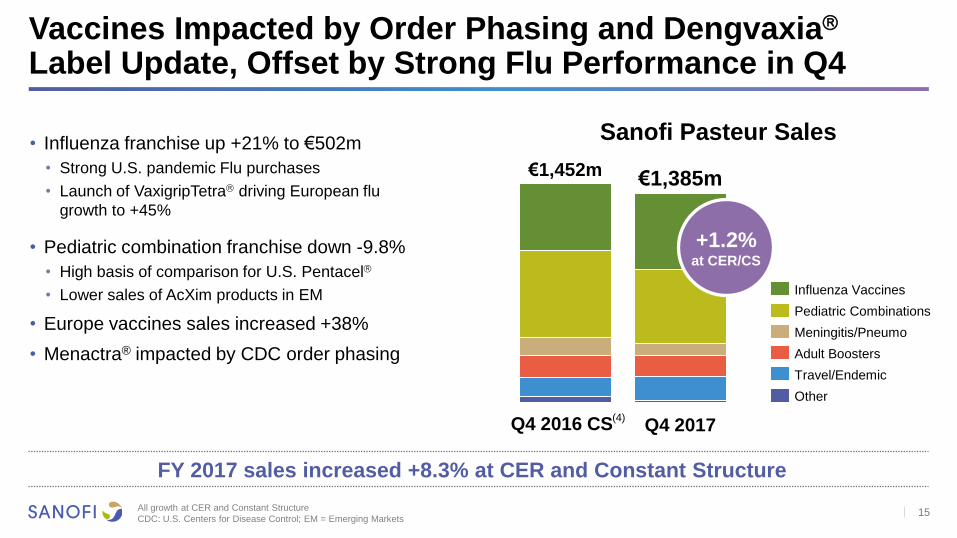
Vaccines Impacted by Order Phasing and Dengvaxia
Label Update, Offset by Strong Flu Performance in Q4
Sanofi Pasteur Sales • Influenza franchise up +21% to €502m
• Strong U.S. pandemic Flu purchases
• Launch of VaxigripTetra driving European flu
growth to +45%
• Pediatric combination franchise down -9.8%
• High basis of comparison for U.S. Pentacel
• Lower sales of AcXim products in EM
• Europe vaccines sales increased +38%
• Menactra® impacted by CDC order phasing
All growth at CER and Constant Structure
CDC: U.S. Centers for Disease Control; EM = Emerging Markets
Q4 2017
€1,385m €1,452m
Adult Boosters
Travel/Endemic
Other
Pediatric Combinations
Meningitis/Pneumo
Influenza Vaccines
+1.2% at CER/CS
(4)
FY 2017 sales increased +8.3% at CER and Constant Structure
Q4 2016 CS
16
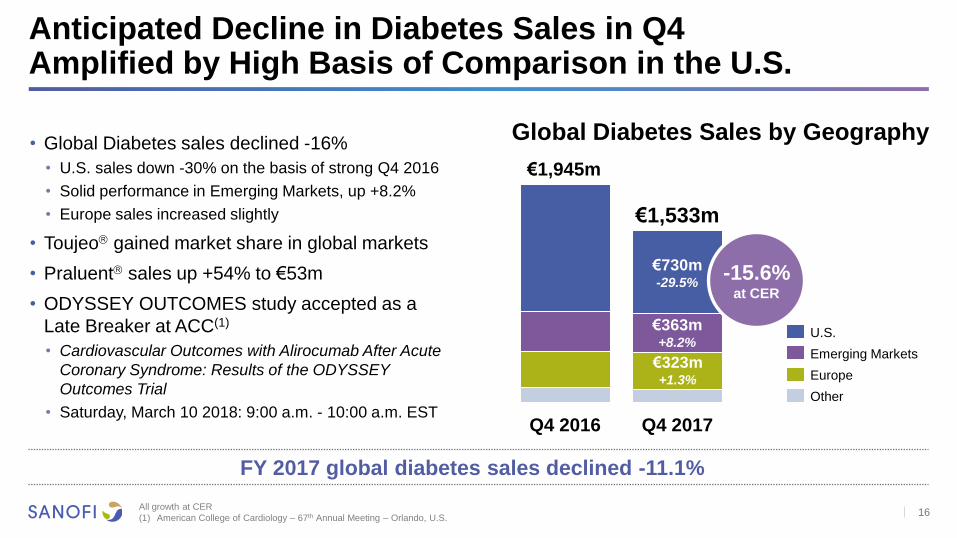
Anticipated Decline in Diabetes Sales in Q4 Amplified by High Basis of Comparison in the U.S.
Global Diabetes Sales by Geography
• Global Diabetes sales declined -16%
• U.S. sales down -30% on the basis of strong Q4 2016
• Solid performance in Emerging Markets, up +8.2%
• Europe sales increased slightly
• Toujeo gained market share in global markets
• Praluent sales up +54% to €53m
• ODYSSEY OUTCOMES study accepted as a
Late Breaker at ACC(1)
• Cardiovascular Outcomes with Alirocumab After Acute
Coronary Syndrome: Results of the ODYSSEY
Outcomes Trial
• Saturday, March 10 2018: 9:00 a.m. - 10:00 a.m. EST
All growth at CER
(1) American College of Cardiology – 67th Annual Meeting – Orlando, U.S.
Q4 2016
€1,533m
Q4 2017
Other
Emerging Markets
U.S.
Europe
FY 2017 global diabetes sales declined -11.1%
€730m -29.5%
€1,945m
€363m +8.2%
€323m +1.3%
-15.6% at CER

17
CHC Performance Supported by Mature Markets in Q4
Q4 2017 CHC Sales by Geography
• CHC franchise delivered sales of €1,196m, up
+2.5% at CER/CS
• U.S. sales increased +3.8% due to higher sales of
allergy franchise and Gold Bond brands
• Europe up +5.7% driven by Doliprane
• Emerging Markets (-0.5%) impacted by lower
sales in Mexico as well as Russia following change
in distribution agreement(1)
• BI CHC business integration nears completion
All growth at CER/CS
CHC = Consumer Healthcare
(1) Russia Q4 2017 sales were down -6% at CS but would have been up +6% excluding the change in distribution agreement
€251m +3.8%
€158m +1.2%
€387m +5.7%
€400m -0.5%
Emerging Markets
U.S.
Other
Europe
FY 2017 sales increased +2.1% at CER and Constant Structure
18
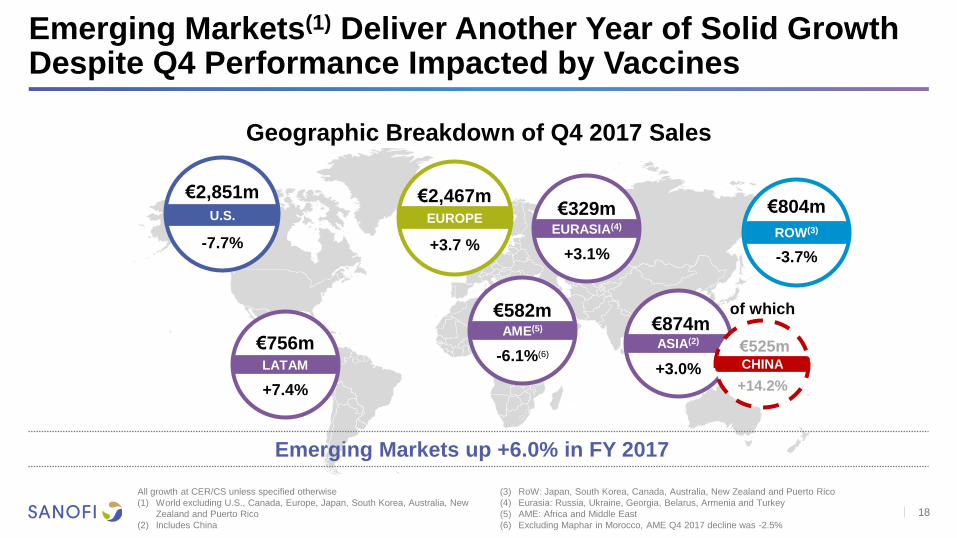
Emerging Markets(1) Deliver Another Year of Solid Growth Despite Q4 Performance Impacted by Vaccines
€2,467m €804m
EUROPE
+3.7 %
€874m ASIA(2)
+3.0%
ROW(3)
-3.7%
€756m LATAM
+7.4%
€2,851m U.S.
-7.7%
€582m AME(5)
-6.1%(6)
€329m EURASIA(4)
+3.1%
All growth at CER/CS unless specified otherwise
(1) World excluding U.S., Canada, Europe, Japan, South Korea, Australia, New
Zealand and Puerto Rico
(2) Includes China
(3) RoW: Japan, South Korea, Canada, Australia, New Zealand and Puerto Rico
(4) Eurasia: Russia, Ukraine, Georgia, Belarus, Armenia and Turkey
(5) AME: Africa and Middle East
(6) Excluding Maphar in Morocco, AME Q4 2017 decline was -2.5%
Emerging Markets up +6.0% in FY 2017
Geographic Breakdown of Q4 2017 Sales
€525m CHINA
+14.2%
of which

Elias Zerhouni President, Global R&D
SUSTAINING INNOVATION
20
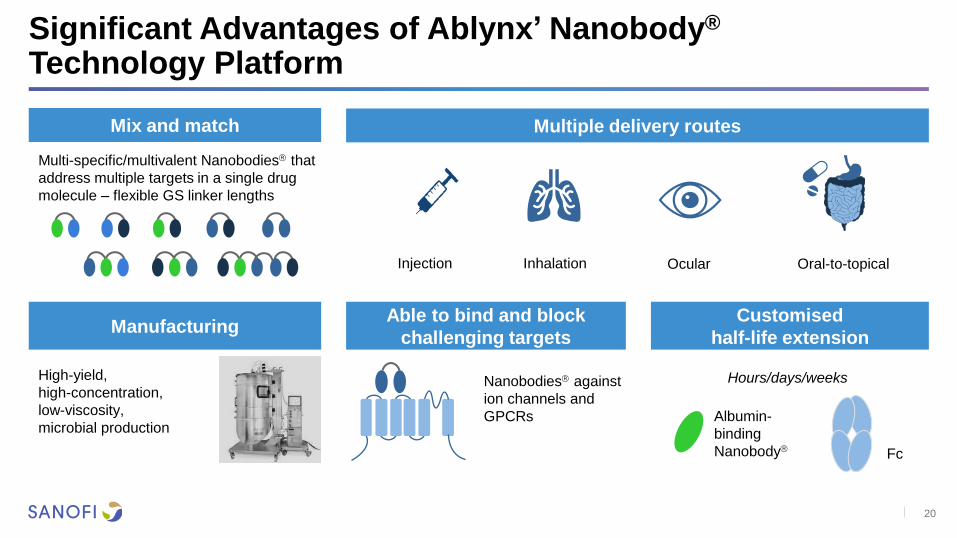
Significant Advantages of Ablynx’ Nanobody® Technology Platform
Albumin-
binding
Nanobody Fc
Hours/days/weeks
Customised
half-life extension
Nanobodies against
ion channels and
GPCRs
Able to bind and block
challenging targets
Mix and match
Multi-specific/multivalent Nanobodies that
address multiple targets in a single drug
molecule – flexible GS linker lengths
Manufacturing
High-yield,
high-concentration,
low-viscosity,
microbial production
Inhalation Oral-to-topical Ocular
Multiple delivery routes
Injection
21
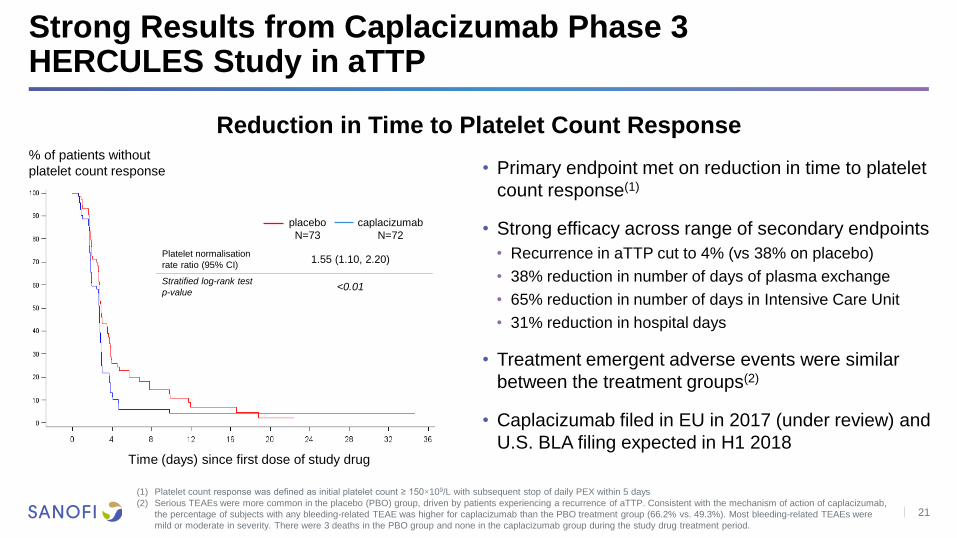
Strong Results from Caplacizumab Phase 3 HERCULES Study in aTTP
% of patients without
platelet count response
Time (days) since first dose of study drug
placebo
N=73
caplacizumab
N=72
Platelet normalisation
rate ratio (95% CI) 1.55 (1.10, 2.20)
Stratified log-rank test
p-value <0.01
Reduction in Time to Platelet Count Response
• Primary endpoint met on reduction in time to platelet
count response(1)
• Strong efficacy across range of secondary endpoints
• Recurrence in aTTP cut to 4% (vs 38% on placebo)
• 38% reduction in number of days of plasma exchange
• 65% reduction in number of days in Intensive Care Unit
• 31% reduction in hospital days
• Treatment emergent adverse events were similar
between the treatment groups(2)
• Caplacizumab filed in EU in 2017 (under review) and
U.S. BLA filing expected in H1 2018
(1) Platelet count response was defined as initial platelet count ≥ 150×109/L with subsequent stop of daily PEX within 5 days
(2) Serious TEAEs were more common in the placebo (PBO) group, driven by patients experiencing a recurrence of aTTP. Consistent with the mechanism of action of caplacizumab,
the percentage of subjects with any bleeding-related TEAE was higher for caplacizumab than the PBO treatment group (66.2% vs. 49.3%). Most bleeding-related TEAEs were
mild or moderate in severity. There were 3 deaths in the PBO group and none in the caplacizumab group during the study drug treatment period.

22
Bioverativ Acquisition Provides Platform for Expansion into Rare Blood Disorders(1)
CAgD = Cold Agglutinin Disease; MoA = Mechanism of Action; RBC = Red Blood Cells
(1) Subject to regulatory approvals and other customary closing conditions
• XTEN technology expected to offer once-weekly dosing or less
• rFVIIIFc-VWF-XTEN for Hemophilia A and rFVIXFC-XTEN for Hemophilia B
• XTEN polypeptides improve the pharmacokinetic profile and degrade naturally Hemophilia
Cold Agglutinin
Disease
Sickle Cell
Disease
β-Thalassemia
• An autoimmune hemolytic anemia that causes red blood cell destruction
• First in class potent and highly selective inhibitor of C1s for compliment mediated disease
• C1 is central for CAgD and inhibition does not affect lectin or alternative complement pathways
• FDA breakthrough therapy designation
• Genetic disorders resulting from the presence of a mutated form of hemoglobin
• Autologous, gene-edited cell therapies
• Uses genome editing technology to modify autologous Hematopoietic stem cells
• MoA blocks polymerization, allows for normal RBC function, and decreases RBC hemolysis
• Disorder characterized by a genetic deficiency in the synthesis of beta-globin chains
• Autologous, gene-edited cell therapies
• Uses genome editing technology to modify autologous Hematopoietic stem cells
• MoA allows for more normal RBC production and RBC lifespan

23
Expansion and Acceleration of Investments for Cemiplimab and Dupilumab Development Programs(1)
Products in development with Regeneron
COPD= Chronic Obstructive Pulmonary Disease
(1) For full disclosure please refer to Sanofi press release dated January 8, 2018. All products in this expansion are being developed in collaboration with Regeneron
(2) Also known as REGN35000
• Cemiplimab investment to be increased by ~$1bn
• Investment to increase from $650m to $1.64bn
• Sanofi to fund 50% of development costs
• Continued investment in other immuno-oncology programs under existing discovery agreement
• ~70% of the increased investment to be spent over 2018-2020 and ~30% over 2021-2023
Immunology
Oncology
• New studies in Immunology
• Dupilumab: accelerate planned new studies in COPD, peanut and grass allergy, and in
patients with multiple allergic disorders
• Anti-IL33(2): accelerate and expand development with studies expected to be conducted in
atopic dermatitis, asthma and COPD

24
2018 R&D Milestones
Q1 Q2 Q3 Q4
Potential
submissions for New Products
Cemiplimab(1,2) in locally advanced CSCC
Sotagliflozin(3) in T1D
Caplacizumab(4) to treat aTTP (U.S.)
Praluent®(1) ODYSSEY OUTCOMES label update
Dupilumab(1) in Atopic Dermatitis in Adolescents
Isatuximab in Relapsed-Refractory Multiple Myeloma
Expected Pivotal trial read-outs
Praluent(1) ODYSSEY OUTCOMES
Cemiplimab(1,2) in BCC
Dupilumab(1) in Nasal Polyps
Isatuximab in Relapsed-Refractory Multiple Myeloma
Expected Proof
of concept study read-outs
Dual Agonist in overweight to obese T2D
SP0232(6) in RSV prophylaxis
ALX-0171(4) tri-valent anti-RSV Nanobody in RSV infections
SERD in metastatic Breast Cancer
Anti-LAG3(5) monotherapy and combinations
aTTP = acquired Thrombotic thrombocytopenic purpura; BCC = Basal Cell Carcinoma;
CSCC = Cutaneous Squamous Cell Carcinoma; RSV = Respiratory Syncitial Virus; SERD =
Selective Estrogen Receptor Downregulators; T1D = Type 1 Diabetes; T2D = Type 2
Diabetes
(1) In collaboration with Regeneron
(2) Also known as SAR439684 and REGN2810
(3) In collaboration with Lexicon
(4) Subject to the completion of the Ablynx acquisition announced on January 29,2018
(5) Regeneron product for which Sanofi has opt-in right
(6) Also known as MEDI8897, in collaboration with MedImmune

Jérôme Contamine Executive Vice President,
Chief Financial Officer
FINANCIAL RESULTS

26
Significant Unfavorable FX Impact on Sales and EPS in Q4
Currency Impact
Company Sales(1) Business EPS
-6.1%
-€539m
-€0
.08
-6.4%
Q4 Q3 Q2 Q1
2016
Q4 Q3 Q2 Q1
2017
Q4 Q3 Q2 Q1
2016
Q4 Q3 Q2 Q1
2017
Note: Company sales and Business restated in 2016 to reclassify Vaxserve from sales to other revenue, and end of 2016 to exclude Animal Health sales
(1) Main currency impact on Company Sales in Q4 2017: US Dollar (-€272m), Japanese Yen (-€51m), Turkish Lira (-€30m), Chinese Yuan (-€29m), Egyptian Pound (-€19m),
Brazilian Real (-€18m) and Argentinian Peso (--€17m)
27
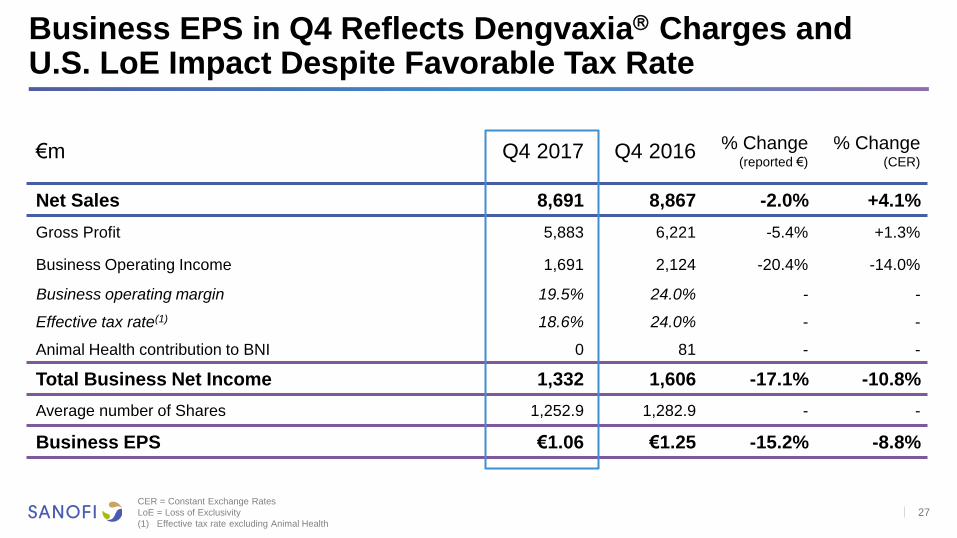
Business EPS in Q4 Reflects Dengvaxia Charges and U.S. LoE Impact Despite Favorable Tax Rate
CER = Constant Exchange Rates
LoE = Loss of Exclusivity
(1) Effective tax rate excluding Animal Health
€m Q4 2017 Q4 2016 % Change (reported €)
% Change (CER)
Net Sales 8,691 8,867 -2.0% +4.1%
Gross Profit 5,883 6,221 -5.4% +1.3%
Business Operating Income 1,691 2,124 -20.4% -14.0%
Business operating margin 19.5% 24.0% - -
Effective tax rate(1) 18.6% 24.0% - -
Animal Health contribution to BNI 0 81 - -
Total Business Net Income 1,332 1,606 -17.1% -10.8%
Average number of Shares 1,252.9 1,282.9 - -
Business EPS €1.06 €1.25 -15.2% -8.8%

28
Higher Operating Expenses Due to Investments in Priority R&D Programs and Launch Costs in Immunology
CER: = Constant Exchange Rates
(1) Constant Structure P&L
€m Q4 2017 Q4 2016 CS % Change (CER/CS)
Net Sales 8,691 9,380 -1.6%
Other revenues 290 304 +3.6%
Gross Profit 5,883 6,542 -3.7%
R&D (1,464) (1,461) +4.5%
SG&A (2,698) (2,780) +2.6%
Other current operating income & expenses (114) (70) -
Share of profit/loss of associates 114 40 -
Minority interests (30) (31) -
Business Operating Income 1,691 2,240 -18.5%
Business operating margin 19.5% 23.9%
(1)
29
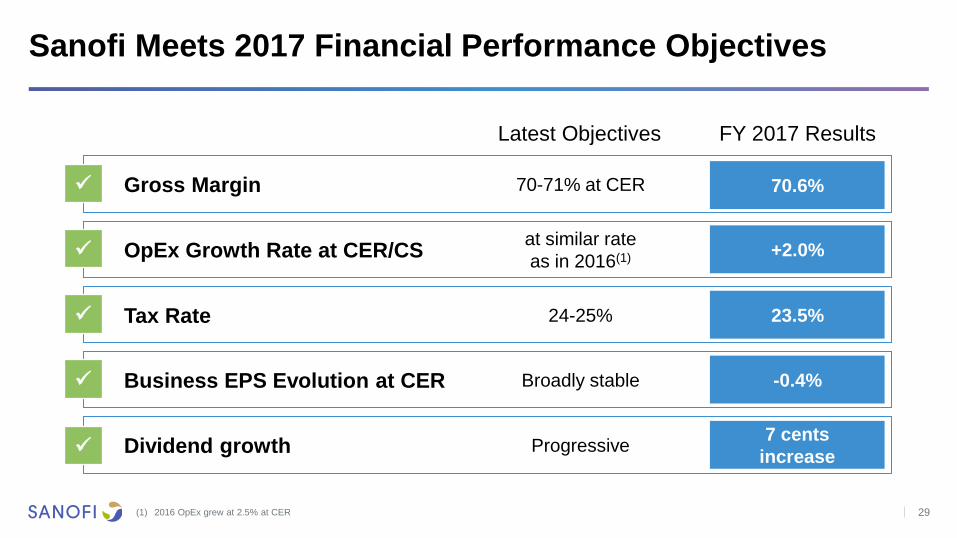
Sanofi Meets 2017 Financial Performance Objectives
(1) 2016 OpEx grew at 2.5% at CER
FY 2017 Results Latest Objectives
Gross Margin 70.6% 70-71% at CER
OpEx Growth Rate at CER/CS +2.0% at similar rate
as in 2016(1)
Tax Rate 23.5% 24-25%
Business EPS Evolution at CER -0.4% Broadly stable
Dividend growth 7 cents
increase Progressive
30
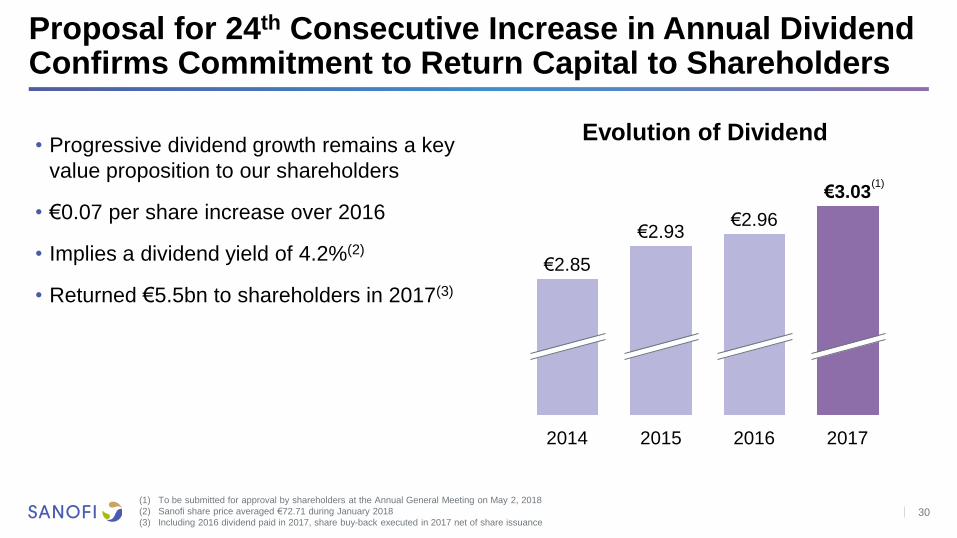
Proposal for 24th Consecutive Increase in Annual Dividend Confirms Commitment to Return Capital to Shareholders
2017
€3.03
2016
€2.96
2015
€2.93
2014
€2.85
(1)
Evolution of Dividend • Progressive dividend growth remains a key
value proposition to our shareholders
• €0.07 per share increase over 2016
• Implies a dividend yield of 4.2%(2)
• Returned €5.5bn to shareholders in 2017(3)
(1) To be submitted for approval by shareholders at the Annual General Meeting on May 2, 2018
(2) Sanofi share price averaged €72.71 during January 2018
(3) Including 2016 dividend paid in 2017, share buy-back executed in 2017 net of share issuance

Positive Net Sales Drivers Primarily in H2 2018
+ Dupixent® increasing contribution
- Vaccines phasing and supply constraint
- Sevelamer generic competition
- Reduced Part D coverage for U.S. diabetes and continued expected average net price decline
31
+ Dupixent® increasing contribution
+ Net sales from Bioverativ(1) post closing
+ Expected benefit from new product launches
including Flublok®, Admelog® and Kevzara®
+ Potential upside opportunity for Praluent® from
ODYSSEY OUTCOMES study results
- Reduced Part D coverage for U.S. diabetes and
continued expected average net price decline
H1 2018
H2 2018
(1) Subject to the completion of the Bioverativ acquisition announced on January 22, 2018

32
2018 Financial Guidance
Business EPS
-3% to -4%(4)
based on December 2017 average exchange rates
+2% to +5% at CER(1,2,3)
FY 2018
FX impact on Business EPS
(1) Including the anticipated contribution from the recently announced acquisitions
(2) Compared to FY2017 and barring major unforeseen adverse events
(3) FY 2017 Business EPS of €5.54
(4) Difference between variation on a reported basis and variation at CER
Olivier Brandicourt Chief Executive Officer
CLOSING REMARKS
34
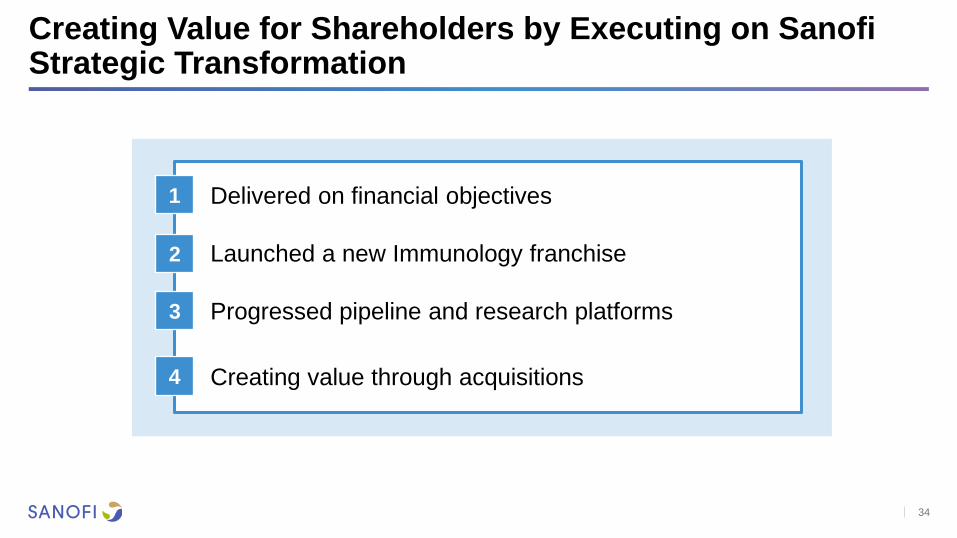
Creating Value for Shareholders by Executing on Sanofi Strategic Transformation
Delivered on financial objectives
Launched a new Immunology franchise
Progressed pipeline and research platforms
Creating value through acquisitions
1
2
3
4

APPENDICES FINANCE
36
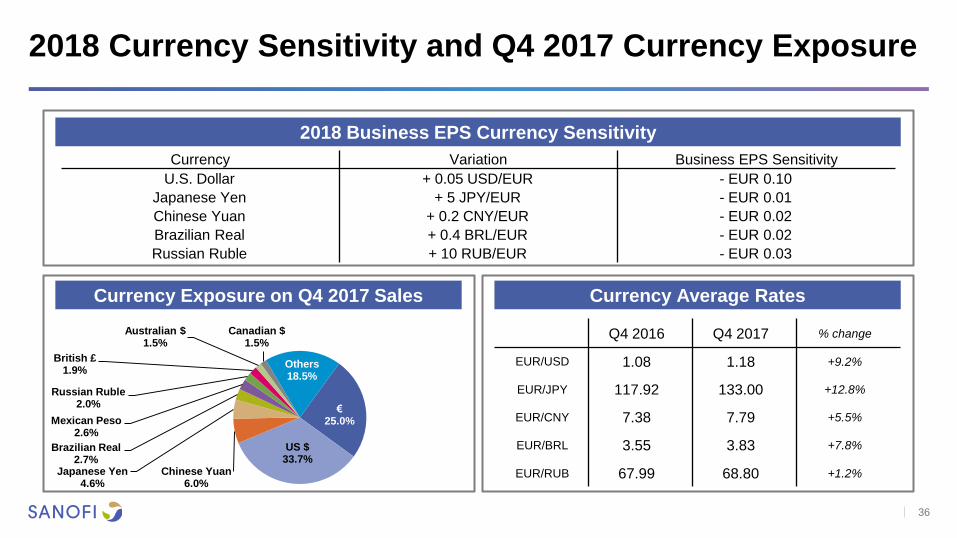
2018 Currency Sensitivity and Q4 2017 Currency Exposure
2018 Business EPS Currency Sensitivity
Currency Exposure on Q4 2017 Sales Currency Average Rates
Q4 2016 Q4 2017 % change
EUR/USD 1.08 1.18 +9.2%
EUR/JPY 117.92 133.00 +12.8%
EUR/CNY 7.38 7.79 +5.5%
EUR/BRL 3.55 3.83 +7.8%
EUR/RUB 67.99 68.80 +1.2%
Currency Variation Business EPS Sensitivity
U.S. Dollar + 0.05 USD/EUR - EUR 0.10
Japanese Yen + 5 JPY/EUR - EUR 0.01
Chinese Yuan + 0.2 CNY/EUR - EUR 0.02
Brazilian Real + 0.4 BRL/EUR - EUR 0.02
Russian Ruble + 10 RUB/EUR - EUR 0.03
€ 25.0%
US $ 33.7%
Chinese Yuan 6.0%
Japanese Yen 4.6%
Brazilian Real 2.7%
Mexican Peso 2.6%
Russian Ruble 2.0%
British £ 1.9%
Australian $ 1.5%
Canadian $ 1.5%
Others 18.5%
37
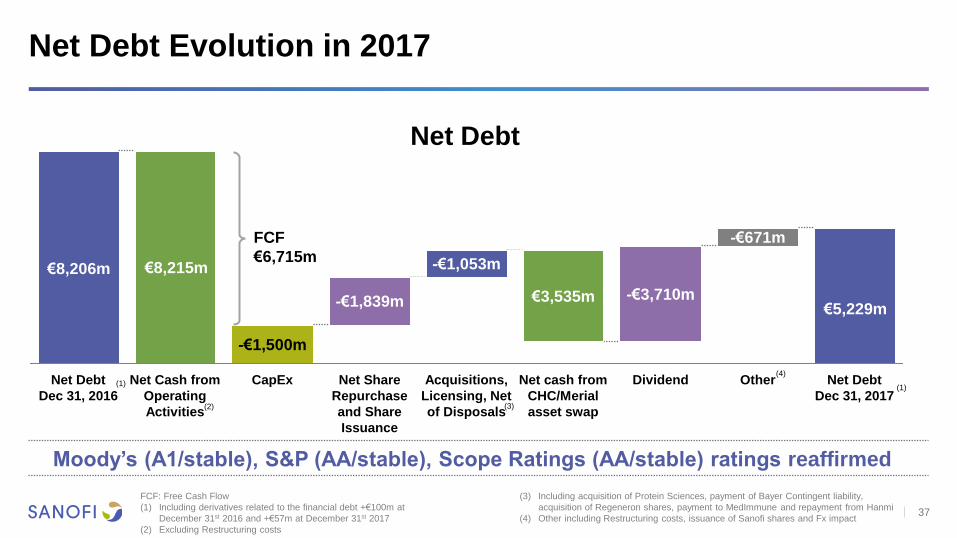
Net Debt Evolution in 2017
Net Debt
Dec 31, 2017
Other
-€671m
Dividend
-€3,710m
Net cash from
CHC/Merial
asset swap
€3,535m
Acquisitions,
Licensing, Net
of Disposals
-€1,053m
Net Share
Repurchase
and Share
Issuance
-€1,839m
CapEx
-€1,500m
Net Cash from
Operating
Activities
Net Debt
Dec 31, 2016 (1)
(2)
€8,206m
€5,229m
€8,215m
(4)
(1)
FCF
€6,715m
(3)
FCF: Free Cash Flow
(1) Including derivatives related to the financial debt +€100m at
December 31st 2016 and +€57m at December 31st 2017
(2) Excluding Restructuring costs
(3) Including acquisition of Protein Sciences, payment of Bayer Contingent liability,
acquisition of Regeneron shares, payment to MedImmune and repayment from Hanmi
(4) Other including Restructuring costs, issuance of Sanofi shares and Fx impact
Net Debt
Moody’s (A1/stable), S&P (AA/stable), Scope Ratings (AA/stable) ratings reaffirmed
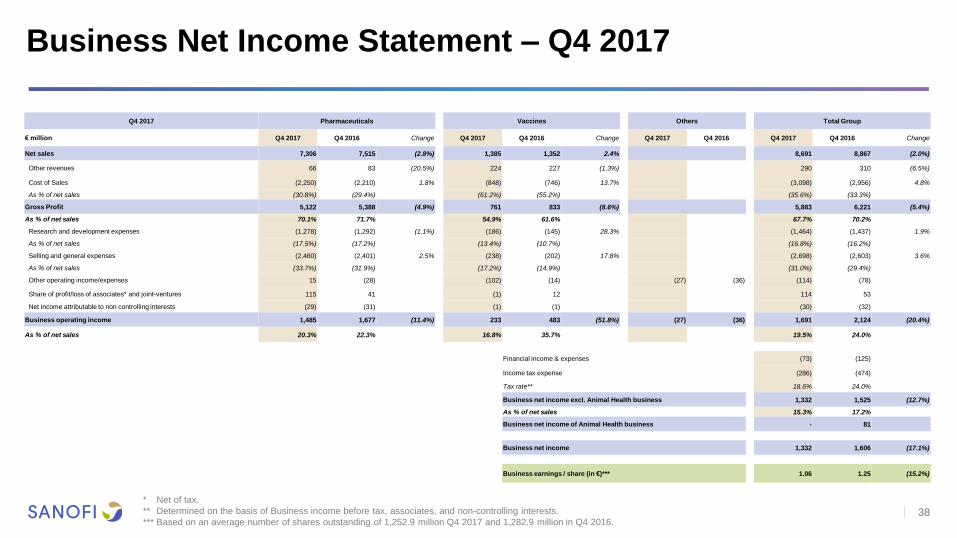
Business Net Income Statement – Q4 2017
*** Net of tax.
*** Determined on the basis of Business income before tax, associates, and non-controlling interests.
*** Based on an average number of shares outstanding of 1,252.9 million Q4 2017 and 1,282.9 million in Q4 2016.
Q4 2017 Pharmaceuticals Vaccines Others Total Group
€ million Q4 2017 Q4 2016 Change Q4 2017 Q4 2016 Change Q4 2017 Q4 2016 Q4 2017 Q4 2016 Change
Net sales 7,306 7,515 (2.8%) 1,385 1,352 2.4% 8,691 8,867 (2.0%)
Other revenues 66 83 (20.5%) 224 227 (1.3%) 290 310 (6.5%)
Cost of Sales (2,250) (2,210) 1.8% (848) (746) 13.7% (3,098) (2,956) 4.8%
As % of net sales (30.8%) (29.4%) (61.2%) (55.2%) (35.6%) (33.3%)
Gross Profit 5,122 5,388 (4.9%) 761 833 (8.6%) 5,883 6,221 (5.4%)
As % of net sales 70.1% 71.7% 54.9% 61.6% 67.7% 70.2%
Research and development expenses (1,278) (1,292) (1.1%) (186) (145) 28.3% (1,464) (1,437) 1.9%
As % of net sales (17.5%) (17.2%) (13.4%) (10.7%) (16.8%) (16.2%)
Selling and general expenses (2,460) (2,401) 2.5% (238) (202) 17.8% (2,698) (2,603) 3.6%
As % of net sales (33.7%) (31.9%) (17.2%) (14.9%) (31.0%) (29.4%)
Other operating income/expenses 15 (28) (102) (14) (27) (36) (114) (78)
Share of profit/loss of associates* and joint-ventures 115 41 (1) 12 114 53
Net income attributable to non controlling interests (29) (31) (1) (1) (30) (32)
Business operating income 1,485 1,677 (11.4%) 233 483 (51.8%) (27) (36) 1,691 2,124 (20.4%)
As % of net sales 20.3% 22.3% 16.8% 35.7% 19.5% 24.0%
Financial income & expenses
(73) (125)
Income tax expense
(286) (474)
Tax rate** 18.6% 24.0%
Business net income excl. Animal Health business 1,332 1,525 (12.7%)
As % of net sales 15.3% 17.2%
Business net income of Animal Health business - 81
Business net income 1,332 1,606 (17.1%)
Business earnings / share (in €)***
1.06 1.25 (15.2%)
38
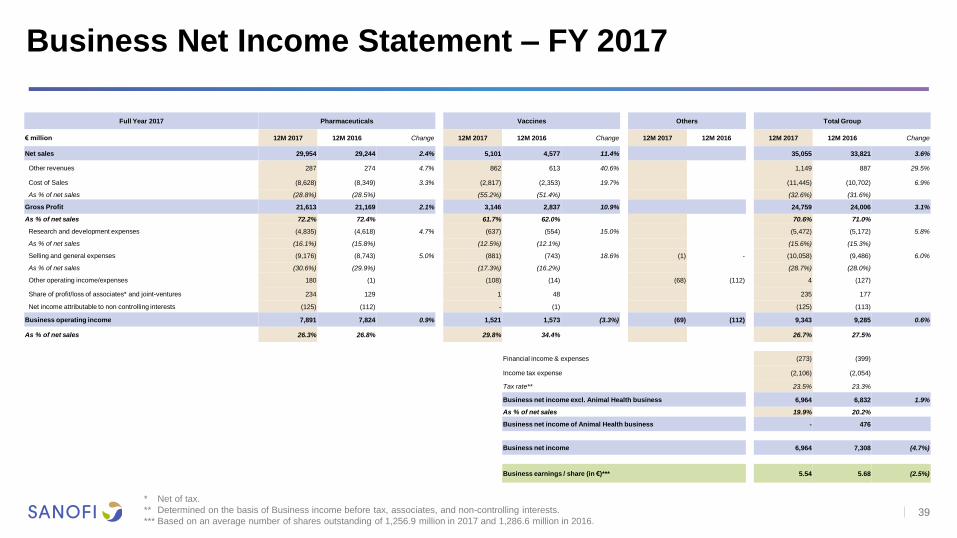
Business Net Income Statement – FY 2017
*** Net of tax.
*** Determined on the basis of Business income before tax, associates, and non-controlling interests.
*** Based on an average number of shares outstanding of 1,256.9 million in 2017 and 1,286.6 million in 2016.
Full Year 2017 Pharmaceuticals Vaccines Others Total Group
€ million 12M 2017 12M 2016 Change 12M 2017 12M 2016 Change 12M 2017 12M 2016 12M 2017 12M 2016 Change
Net sales 29,954 29,244 2.4% 5,101 4,577 11.4% 35,055 33,821 3.6%
Other revenues 287 274 4.7% 862 613 40.6% 1,149 887 29.5%
Cost of Sales (8,628) (8,349) 3.3% (2,817) (2,353) 19.7% (11,445) (10,702) 6.9%
As % of net sales (28.8%) (28.5%) (55.2%) (51.4%) (32.6%) (31.6%)
Gross Profit 21,613 21,169 2.1% 3,146 2,837 10.9% 24,759 24,006 3.1%
As % of net sales 72.2% 72.4% 61.7% 62.0% 70.6% 71.0%
Research and development expenses (4,835) (4,618) 4.7% (637) (554) 15.0% (5,472) (5,172) 5.8%
As % of net sales (16.1%) (15.8%) (12.5%) (12.1%) (15.6%) (15.3%)
Selling and general expenses (9,176) (8,743) 5.0% (881) (743) 18.6% (1) - (10,058) (9,486) 6.0%
As % of net sales (30.6%) (29.9%) (17.3%) (16.2%) (28.7%) (28.0%)
Other operating income/expenses 180 (1) (108) (14) (68) (112) 4 (127)
Share of profit/loss of associates* and joint-ventures 234 129 1 48 235 177
Net income attributable to non controlling interests (125) (112) - (1) (125) (113)
Business operating income 7,891 7,824 0.9% 1,521 1,573 (3.3%) (69) (112) 9,343 9,285 0.6%
As % of net sales 26.3% 26.8% 29.8% 34.4% 26.7% 27.5%
Financial income & expenses
(273) (399)
Income tax expense
(2,106) (2,054)
Tax rate** 23.5% 23.3%
Business net income excl. Animal Health business 6,964 6,832 1.9%
As % of net sales 19.9% 20.2%
Business net income of Animal Health business - 476
Business net income 6,964 7,308 (4.7%)
Business earnings / share (in €)***
5.54 5.68 (2.5%)
39

Consolidated Income Statements
(1) Animal Health results and gain on disposal are reported separately in accordance with IFRS 5 (Non-Current Assets Held for Sale and Discontinued Operations).
€ million Q4 2017 (1) Q4 2016 (1) 12M 2017 (1) 12M 2016 (1)
Net sales 8,691 8,867 35,055 33,821
Other revenues 290 310 1,149 887
Cost of sales (3,088) (2,956) (11,611) (10,702)
Gross profit 5,893 6,221 24,593 24,006
Research and development expenses (1,464) (1,437) (5,472) (5,172)
Selling and general expenses (2,698) (2,603) (10,058) (9,486)
Other operating income 10 56 237 355
Other operating expenses (124) (134) (233) (482)
Amortization of intangible assets (442) (412) (1,866) (1,692)
Impairment of intangible assets (262) (119) (293) (192)
Fair value remeasurement of contingent consideration 15 (41) (159) (135)
Restructuring costs and similar items (118) (189) (731) (879)
Other gains and losses, and litigation (61) 211 (215) 211
Operating income 749 1,553 5,803 6,534
Financial expenses (99) (422) (420) (924)
Financial income 26 1 147 68
Income before tax and associates and joint ventures 676 1,132 5,530 5,678
Income tax expense (700) (369) (1,722) (1,326)
Share of profit/(loss) of associates and joint ventures 24 30 104 134
Net income excluding the exchanged/held-for-exchange Animal Health business - 793 3,912 4,486
Net income/(loss) of the exchanged/held-for-exchange Animal Health business 159 18 4,643 314
Net income 159 811 8,555 4,800
Net income attributable to non-controlling interests 30 21 121 91
Net income attributable to equity holders of Sanofi 129 790 8,434 4,709
Average number of shares outstanding (million) 1,252.9 1,282.9 1,256.9 1,286.6
Earnings per share excluding the exchanged/held-for-exchange Animal Health business (in euros) (0.02) 0.60 3.02 3.42
IFRS Earnings per share (in euros) 0.10 0.62 6.71 3.66
40

Reconciliation of Consolidated Net Income Attributable to Equity Holders of Sanofi to Business Net Income – Q4 2017
(1) Of which related to amortization expense generated by the remeasurement of intangible assets as part of business combinations: €407m in Q4 2017 and €374m in Q4 2016.
(2) In 2016, gain on Sanofi Pasteur MSD investment in associates and joint-ventures upon termination of the joint-venture.
(3) In 2017, this line includes the impact of changes in corporate income tax rates, mainly in France (25% standard rate effective as of January 1, 2022).
(4) In 2016, this lines includes the impact on deferred tax assets and liabilities coming from the reconciliation items (in particular amortization and impairment of intangible assets and restructuring costs).
(5) Of which: +€562m litigation gain on French 3% tax on dividends and temporary exceptional surcharge and US tax reform (€1,193m).
(6) In 2017, net gain resulting from the divestment of the Animal Health business (including the closing in
Mexico in Q4 2017). (7) In 2016, includes the following items: impact of the discontinuation of depreciation and impairment of
Property, Plant & Equipment starting at IFRS 5 application (Non-current held for sale and discontinued operations), impact of the amortization and impairment of intangible assets until IFRS 5 application, costs incurred as a result of the divestment as well as the tax effect of these items.
(8) In 2016, includes the following items: impact of the discontinuation of the equity accounting of the Sanofi Pasteur MSD business net income since the announcement by Sanofi and Merck of their intent to end their joint vaccine operations in Europe.
(9) Based on an average number of shares outstanding of 1,252.9 million in Q4 2017 and 1,282.9 million in Q4 2016.
€ million Q4 2017 Q4 2016 Change
Net income attributable to equity holders of Sanofi 129 790 (83,7%)
Amortization of intangible assets (1) 442 412
Impairment of intangible assets 262 119
Fair value remeasurement of contingent consideration (15) 41
Expenses arising from the impact of acquisitions on inventories (10) -
Restructuring costs and similar items 118 189
Other gains and losses, and litigation (2) 61 (211)
Tax effect of items listed above (3)/(4): (217) (105)
Amortization & impairment of intangible assets (242) (221)
Fair value remeasurement of contingent consideration 37 (1)
Expenses arising from the impact of acquisitions on inventories 4 -
Restructuring costs and similar items 82 139
Other tax effects (98) (22)
Other tax items (5) 631 -
Share of items listed above attributable to non-controlling interests - (11)
Restructuring costs of associates and joint-ventures, and expenses arising from the impact of acquisitions on
associates and joint-ventures 90 9
Animal Health items (6)/(7) (159) 63
Other Sanofi Pasteur MSD items (8) - 14
Impairment loss on Alnylam investment - 296
Business net income 1,332 1,606 (17,1%)
IFRS earnings per share (9) (in euros) 0.10 0.62
41

Reconciliation of Consolidated Net Income Attributable to Equity Holders of Sanofi to Business Net Income – FY 2017
(1) Of which related to amortization expense generated by the remeasurement of intangible assets as part of business combinations: €1,726m in 2017 and €1,550m in 2016.
(2) In 2017, mainly adjustment to vendor's guarantee provision in connection with past divestment. (3) In 2016, gain on Sanofi Pasteur MSD investment in associates and joint-ventures upon termination of
the joint-venture. (4) In 2017, this line includes the impact of changes in corporate income tax rates, mainly in France (25%
standard rate effective as of January 1, 2022). (5) In 2016, this lines includes the impact on deferred tax assets and liabilities coming from the
reconciliation items (in particular amortization and impairment of intangible assets and restructuring costs).
(6) Of which: +€451m litigation gain on French 3% tax on dividends and temporary exceptional surcharge and US tax reform (€1,193m).
(7) In 2017, net gain resulting from the divestment of the Animal Health business (including the closing in Mexico in Q4 2017).
(8) In 2016, includes the following items: impact of the discontinuation of depreciation and impairment of Property, Plant & Equipment starting at IFRS 5 application (Non-current held for sale and discontinued operations), impact of the amortization and impairment of intangible assets until IFRS 5 application, costs incurred as a result of the divestment as well as the tax effect of these items.
(9) In 2016, includes the following items: impact of the discontinuation of the equity accounting of the Sanofi Pasteur MSD business net income since the announcement by Sanofi and Merck of their intent to end their joint vaccine operations in Europe.
(10) Based on an average number of shares outstanding of 1,256.9 million in 2017 and 1,286.6 million in 2016.
€ million 12M 2017 12M 2016 Change
Net income attributable to equity holders of Sanofi 8,434 4,709 79.1%
Amortization of intangible assets (1) 1,866 1,692
Impairment of intangible assets 293 192
Fair value remeasurement of contingent consideration 159 135
Expenses arising from the impact of acquisitions on inventories 166 -
Restructuring costs and similar items 731 879
Other gains and losses, and litigation (2)/(3) 215 (211)
Tax effect of items listed above (4)/(5): (1,126) (841)
Amortization & impairment of intangible assets (719) (694)
Fair value remeasurement of contingent consideration 4 (24)
Expenses arising from the impact of acquisitions on inventories (52) -
Restructuring costs and similar items (134) (95)
Other tax effects (225) (28)
Other tax items (6) 742 113
Share of items listed above attributable to non-controlling interests (4) (22)
Restructuring costs of associates and joint-ventures, and expenses arising from the impact of acquisitions on
associates and joint-ventures 131 (9)
Animal Health items (7)/(8) (4,643) 162
Other Sanofi Pasteur MSD items (9) - 52
Impairment loss on Alnylam investment - 457
Business net income 6,964 7,308 (4.7%)
IFRS earnings per share (10) (in euros) 6.71 3.66
42

Change in Net Debt
(1) Excluding restructuring costs and similar items.
(2) Excluding Animal Health business for the 2016 comparative period.
€ million 2017 2016
Business net income 6,964 7,308
Depreciation, amortization and impairment of property, plant and equipment and software 1,349 1,278
Gains and losses on disposals of non-current assets, net of tax (127) (34)
Other non cash items 618 (452)
Operating cash flow before changes in working capital (1)/(2) 8,804 8,100
Changes in working capital (1) (589) 727
Acquisitions of property, plant and equipment and software (1,500) (1,361)
Free cash flow (1)/(2) 6,715 7,466
Acquisitions of intangible assets excluding software (398) (715)
Acquisitions of investments including assumed debt (1,063) (533)
Restructuring costs and similar items paid (754) (729)
Proceeds from disposals of property, plant and equipment, intangible assets and other non-current assets net of tax 408 313
Issuance of Sanofi shares 319 306
Dividends paid to shareholders of Sanofi (3,710) (3,759)
Acquisition of treasury shares (2,158) (2,908)
Transactions with non-controlling interests including dividends (52) (31)
Foreign exchange impact 438 (192)
Net cash-flow from the swap between BI - CHC and Sanofi Animal Health business 3,535 -
Other items (303) (170)
Change in net debt 2,977 (952)
43

Simplified Consolidated Balance Sheet – FY 2017
ASSETS
€ million
Dec 31,
2017
Dec 31,
2016
LIABILITIES & EQUITY
€ million
Dec 31,
2017
Dec 31,
2016
Equity attributable to equity holders of Sanofi 58,089 57,554
Equity attributable to non-controlling interests 169 170
Total equity 58,258 57,724
Long-term debt 14,326 16,815
Property, plant and equipment 9,579 10,019 Non-current liabilities related to business combinations and to non-
controlling interests 1,026 1,378
Intangible assets (including goodwill) 53,344 51,166 Non-current provisions and other non-current liabilities 9,154 8,834
Non-current financial assets & investments in associates and
deferred tax assets 10,517 10,379 Deferred tax liabilities 1,605 2,292
Non-current assets 73,440 71,564 Non-current liabilities 26,111 29,319
Accounts payable & Other current liabilities 13,839 14,472
Inventories, accounts receivable and other current assets 16,037 16,414 Current liabilities related to business combinations and to non-
controlling interests 343 198
Cash and cash equivalents 10,315 10,273 Short-term debt and current portion of long-term debt 1,275 1,764
Current assets 26,352 26,687 Current liabilities 15,457 16,434
Assets held for sale or exchange 34 6,421 Liabilities related to assets held for sale or exchange - 1,195
TOTAL ASSETS 99,826 104,672 TOTAL EQUITY & LIABILITIES 99,826 104,672
44

APPENDICES RESEARCH & DEVELOPMENT
isatuximab Anti-CD38 mAb
Relapsing Refractory Multiple Myeloma (ICARIA)
46
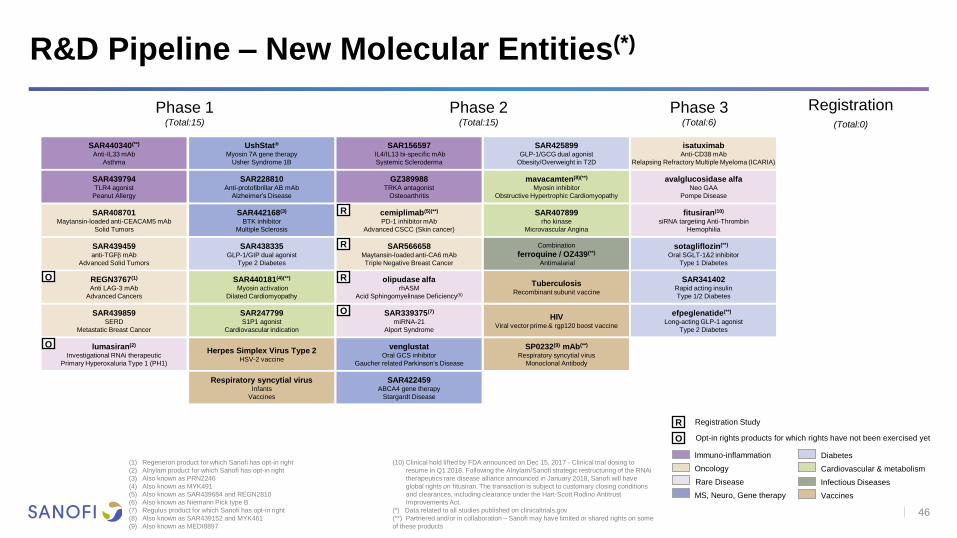
R&D Pipeline – New Molecular Entities(*)
Phase 1 (Total:15)
Phase 2 (Total:15)
Phase 3 (Total:6)
Registration (Total:0)
SAR247799 S1P1 agonist
Cardiovascular indication
UshStat® Myosin 7A gene therapy
Usher Syndrome 1B
Herpes Simplex Virus Type 2 HSV-2 vaccine
SAR422459 ABCA4 gene therapy
Stargardt Disease
efpeglenatide(**)n
Long-acting GLP-1 agonist
Type 2 Diabetes
SAR440340(**)
Anti-IL33 mAb
Asthma
venglustat
Oral GCS inhibitor
Gaucher related Parkinson’s Disease
HIV Viral vector prime & rgp120 boost vaccine
olipudase alfa rhASM
Acid Sphingomyelinase Deficiency(6)
avalglucosidase alfa Neo GAA
Pompe Disease
Respiratory syncytial virus Infants
Vaccines
Combination
ferroquine / OZ439(**) Antimalarial
SAR425899 GLP-1/GCG dual agonist
Obesity/Overweight in T2D
SAR156597 IL4/IL13 bi-specific mAb
Systemic Scleroderma
SAR439794 TLR4 agonist
Peanut Allergy
SAR440181(4)(**) Myosin activation
Dilated Cardiomyopathy
SP0232(9) mAb(**) Respiratory syncytial virus
Monoclonal Antibody
Tuberculosis Recombinant subunit vaccine
sotagliflozin(**) n
Oral SGLT-1&2 inhibitor
Type 1 Diabetes
SAR566658 Maytansin-loaded anti-CA6 mAb
Triple Negative Breast Cancer
SAR341402 Rapid acting insulin
Type 1/2 Diabetes
SAR439459 anti-TGFb mAb
Advanced Solid Tumors
GZ389988 TRKA antagonist
Osteoarthritis
mavacamten(8)(**)
Myosin inhibitor
Obstructive Hypertrophic Cardiomyopathy
SAR407899 rho kinase
Microvascular Angina
SAR408701 Maytansin-loaded anti-CEACAM5 mAb
Solid Tumors
fitusiran(10) siRNA targeting Anti-Thrombin
Hemophilia
Registration Study
SAR228810 Anti-protofibrillar AB mAb
Alzheimer’s Disease
SAR438335 GLP-1/GIP dual agonist
Type 2 Diabetes
cemiplimab(5)(**)
PD-1 inhibitor mAb
Advanced CSCC (Skin cancer)
REGN3767(1)
Anti LAG-3 mAb
Advanced Cancers
Infectious Diseases Rare Disease
Immuno-inflammation Diabetes
MS, Neuro, Gene therapy Vaccines
Oncology Cardiovascular & metabolism (1) Regeneron product for which Sanofi has opt-in right
(2) Alnylam product for which Sanofi has opt-in right
(3) Also known as PRN2246
(4) Also known as MYK491
(5) Also known as SAR439684 and REGN2810
(6) Also known as Niemann Pick type B
(7) Regulus product for which Sanofi has opt-in right
(8) Also known as SAR439152 and MYK461
(9) Also known as MEDI8897
(10) Clinical hold lifted by FDA announced on Dec 15, 2017 - Clinical trial dosing to
resume in Q1 2018. Following the Alnylam/Sanofi strategic restructuring of the RNAi
therapeutics rare disease alliance announced in January 2018, Sanofi will have
global rights on fitusiran. The transaction is subject to customary closing conditions
and clearances, including clearance under the Hart-Scott Rodino Antitrust
Improvements Act.
(*) Data related to all studies published on clinicaltrials.gov
(**) Partnered and/or in collaboration – Sanofi may have limited or shared rights on some
of these products
SAR339375(7)
miRNA-21
Alport Syndrome
R
SAR439859 SERD
Metastatic Breast Cancer
Opt-in rights products for which rights have not been exercised yet O
O
O
lumasiran(2)
Investigational RNAi therapeutic
Primary Hyperoxaluria Type 1 (PH1)
O
R
R
R
SAR442168(3)
BTK inhibitor
Multiple Sclerosis

Dupixent®(**) Anti-IL4Rα mAb
Atopic Dermatitis 6 months - 5 years old
cemiplimab(1)(**)
PD-1 inhibitor mAb
2nd line Cervical Cancer
cemiplimab(1)(**)
PD-1 inhibitor mAb
1st line NSCLC
47
Infectious Diseases Rare Disease
Immuno-inflammation Diabetes
MS, Neuro, Gene therapy Vaccines
Oncology Cardiovascular & metabolism (1) Also known as SAR439684 and REGN2810
(2) Cyclophosmamide + bortezomib (Velcade) + dexamethasone
(3) Regeneron product for which Sanofi has opt-in right
(*) Data related to all studies published on clinicaltrials.gov
(**) Partnered and/or in collaboration - Sanofi may have limited or shared rights
on some of these products - included in totals
Phase 1 (Total:5)
Phase 2 (Total:10)
Phase 3 (Total:16)
Registration (Total:3)
PR5i DTP-HepB-Polio-Hib
Pediatric hexavalent vaccines (U.S.)
VaxiGrip® QIV IM Quadrivalent inactivated
Influenza vaccine (6 - 35 months)
Additional Indications(*)
Adacel+ Tdap booster
Rabies VRVg Purified vero rabies vaccine
Shan 6 DTP-HepB-Polio-Hib
Pediatric hexavalent vaccine
dupilumab(**) Anti-IL4Rα mAb
Asthma 6 - 11 years old
Dupixent®(**) Anti-IL4Rα mAb
Atopic Dermatitis 6 – 11 years old
Dupixent®(**)
Anti-IL4Rα mAb
Atopic Dermatitis 12 – 17 years old
dupilumab(**) Anti-IL4Rα mAb
Nasal Polyposis
Pediatric pentavalent vaccine DTP-Polio-Hib
Japan
Fluzone® QIV HD Quadrivalent inactivated
Influenza vaccine - High dose
Men Quad TT Advanced generation meningococcal
ACYW conjugate vaccine
sotagliflozin(**) n Oral SGLT-1&2 inhibitor
Type 2 Diabetes
isatuximab + cemiplimab(1)(**) Anti-CD38 mAb + PD-1 inhibitor mAb
Relapsing Refractory Multiple Myeloma
isatuximab Anti-CD38 mAb + CyBord(2)
Newly Diagnosed Multiple Myeloma
sotagliflozin(**)
SGLT 1 & 2 inhibitor
Worsening Heart Failure in Diabetes
venglustat
Oral GCS inhibitor
Fabry Disease
dupilumab(**) Anti-IL4Rα mAb
Eosinophilic Esophagitis
venglustat
Oral GCS inhibitor
Gaucher Disease Type 3
cemiplimab(1)(**)
PD-1 inhibitor mAb
Advanced Basal Cell Carcinoma
SAR439459 + cemiplimab(1)(**) Anti-TGFb mAb + PD1 inhibitor mAb
Advanced Solid Tumors
sarilumab(**) Anti-IL6R mAb
Polyarticular Juvenile Idiopathic Arthritis
Praluent®(**) Anti-PCSK9 mAb
CV events reduction
Aubagio® teriflunomide
Relapsing Multiple Sclerosis - Pediatric
sarilumab(**) Anti-IL6R mAb
Systemic Juvenile Arthritis
dupilumab(**) Anti-IL4Rα mAb
Asthma 12y+ U.S.
isatuximab
Anti-CD38 mAb
1st line Newly Diagnosed Multiple Myeloma
(IMROZ)
cemiplimab(1)(**) + REGN3767(3)
PD-1 inhibitor mAb + anti LAG-3 mAb
Advanced Cancers
Opt-in rights products for which rights have not been exercised yet O
O
isatuximab Anti-CD38 mAb
Relapsing Refractory Multiple Myeloma (IKEMA)
Registration Study R
R Lemtrada® alemtuzumab
Relapsing Remitting Multiple Sclerosis - Pediatric
SAR439859 SERD + Palbociclib
Metastatic Breast Cancer
fitusiran(6)(**) siRNA inhibitor
Hemophilia A/B - U.S./EU/Jap
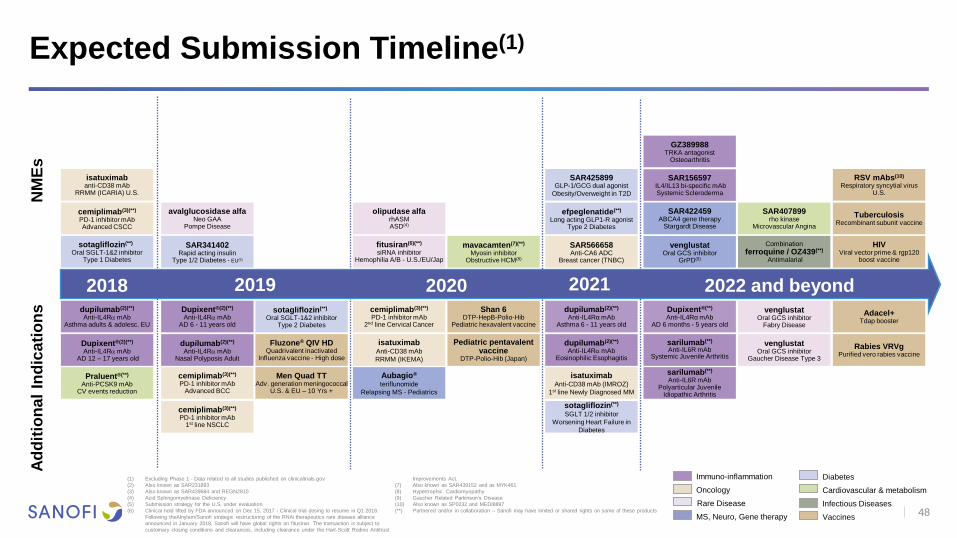
Expected Submission Timeline(1)
48
2022 and beyond 2018 2019 2020
(1) Excluding Phase 1 - Data related to all studies published on clinicaltrials.gov
(2) Also known as SAR231893
(3) Also known as SAR439684 and REGN2810
(4) Acid Sphingomyelinase Deficiency
(5) Submission strategy for the U.S. under evaluation
(6) Clinical hold lifted by FDA announced on Dec 15, 2017 - Clinical trial dosing to resume in Q1 2018.
Following theAlnylam/Sanofi strategic restructuring of the RNAi therapeutics rare disease alliance
announced in January 2018, Sanofi will have global rights on fitusiran. The transaction is subject to
customary closing conditions and clearances, including clearance under the Hart-Scott Rodino Antitrust
Improvements Act.
(7) Also known as SAR439152 and as MYK461
(8) Hypertrophic Cardiomyopathy
(9) Gaucher Related Parkinson’s Disease
(10) Also known as SP0232 and MEDI8897
(**) Partnered and/or in collaboration – Sanofi may have limited or shared rights on some of these products
NM
Es
A
dd
itio
nal
Ind
ica
tio
ns
Infectious Diseases Rare Disease
Immuno-inflammation Diabetes
MS, Neuro, Gene therapy Vaccines
Oncology Cardiovascular & metabolism
Dupixent®(**) Anti-IL4Rα mAb
AD 6 months - 5 years old
Tuberculosis Recombinant subunit vaccine
GZ389988 TRKA antagonist
Osteoarthritis
SAR425899
GLP-1/GCG dual agonist
Obesity/Overweight in T2D
isatuximab anti-CD38 mAb
RRMM (ICARIA) U.S.
cemiplimab(3)(**) PD-1 inhibitor mAb Advanced CSCC
HIV Viral vector prime & rgp120
boost vaccine
SAR156597 IL4/IL13 bi-specific mAb Systemic Scleroderma
efpeglenatide(**)
Long acting GLP1-R agonist Type 2 Diabetes
cemiplimab(3)(**) PD-1 inhibitor mAb
1st line NSCLC
cemiplimab(3)(**) PD-1 inhibitor mAb
2nd line Cervical Cancer
Men Quad TT Adv. generation meningococcal
U.S. & EU – 10 Yrs +
RSV mAbs(10) Respiratory syncytial virus
U.S.
SAR422459 ABCA4 gene therapy
Stargardt Disease
avalglucosidase alfa Neo GAA
Pompe Disease
SAR566658 Anti-CA6 ADC
Breast cancer (TNBC)
SAR407899 rho kinase
Microvascular Angina
dupilumab(2)(**)
Anti-IL4Ra mAb Nasal Polyposis Adult
sarilumab(**) Anti-IL6R mAb
Polyarticular Juvenile Idiopathic Arthritis
Dupixent®(2)(**)
Anti-IL4Ra mAb AD 12 – 17 years old
Rabies VRVg Purified vero rabies vaccine
venglustat
Oral GCS inhibitor Fabry Disease
cemiplimab(3)(**) PD-1 inhibitor mAb
Advanced BCC
Praluent®(**) Anti-PCSK9 mAb
CV events reduction
Shan 6 DTP-HepB-Polio-Hib
Pediatric hexavalent vaccine
dupilumab(2)(**) Anti-IL4Rα mAb
Asthma 6 - 11 years old
venglustat
Oral GCS inhibitor Gaucher Disease Type 3
Dupixent®(2)(**) Anti-IL4Ra mAb
AD 6 - 11 years old
dupilumab(2)(**) Anti-IL4Ra mAb
Eosinophilic Esophagitis
Fluzone® QIV HD Quadrivalent inactivated
Influenza vaccine - High dose
dupilumab(2)(**) Anti-IL4Ra mAb
Asthma adults & adolesc. EU
Adacel+ Tdap booster
sotagliflozin(**)n
Oral SGLT-1&2 inhibitor Type 2 Diabetes
olipudase alfa rhASM ASD(4)
mavacamten(7)(**)
Myosin inhibitor Obstructive HCM(8)
sotagliflozin(**)n Oral SGLT-1&2 inhibitor
Type 1 Diabetes
Combination
ferroquine / OZ439(**) Antimalarial
venglustat
Oral GCS inhibitor GrPD(9)
Aubagio® teriflunomide
Relapsing MS - Pediatrics
sarilumab(**) Anti-IL6R mAb
Systemic Juvenile Arthritis
SAR341402
Rapid acting insulin Type 1/2 Diabetes - EU(5)
Pediatric pentavalent vaccine
DTP-Polio-Hib (Japan)
isatuximab
Anti-CD38 mAb (IMROZ)
1st line Newly Diagnosed MM
isatuximab
Anti-CD38 mAb
RRMM (IKEMA)
2021
sotagliflozin(**)
SGLT 1/2 inhibitor
Worsening Heart Failure in
Diabetes

49
Additions to the pipeline
Pipeline Movements Since Q3 2017
Removals from the pipeline
SAR100842 LPA1 receptor antagonist
Systemic Sclerosis
SAR407899 rho kinase
Microvascular Angina
SAR341402 Rapid acting insulin
Type 2 Diabetes
cemiplimab(2)(**)
PD-1 inhibitor mAb
2nd line Cervical Cancer
Clostridium difficile
Toxoid vaccine
SAR428926 Maytansin-loaded anti-Lamp1 mAb
Cancer
efpeglenatide(**)n
Long-acting GLP-1 receptor agonist
Type 2 Diabetes
isatuximab Anti-CD38 mAb monotherapy
Acute Lymphoblastic Leukemia
GZ402668 GLD52 (anti-CD52 mAb)
Relapsing Multiple Sclerosis Phase 1
Phase 2
Phase 3
Registration
SAR156597 IL4/IL13 bi-specific mAb
Idiopathic Pulmonary Fibrosis
SAR439859 SERD
Metastatic Breast Cancer
SAR442168(1)
BTK inhibitor
Multiple Sclerosis
dupilumab(**) Anti-IL4Rα mAb
Asthma 12y+ U.S.
isatuximab
Anti-CD38
1st line Newly Diagnosed Multiple Myeloma
(IMROZ)
(1) Also known as PRN2246
(2) Also known as SAR439684 and REGN2810
(3) Following the Alnylam/Sanofi strategic restructuring of the RNAi therapeutics rare disease alliance announced in January 2018, Alnylam will have global rights on patisiran and Sanofi will receive royalties based on net sales of patisiran.
The transaction is subject to customary closing conditions and clearances, including clearance under the Hart-Scott Rodino Antitrust Improvements Act”.
(4) (**) Partnered and/or in collaboration – Sanofi may have limited or shared rights on some of these products
patisiran(3) siRNA inhibitor targeting TTR
Hereditary ATTR Amyloidosis
50
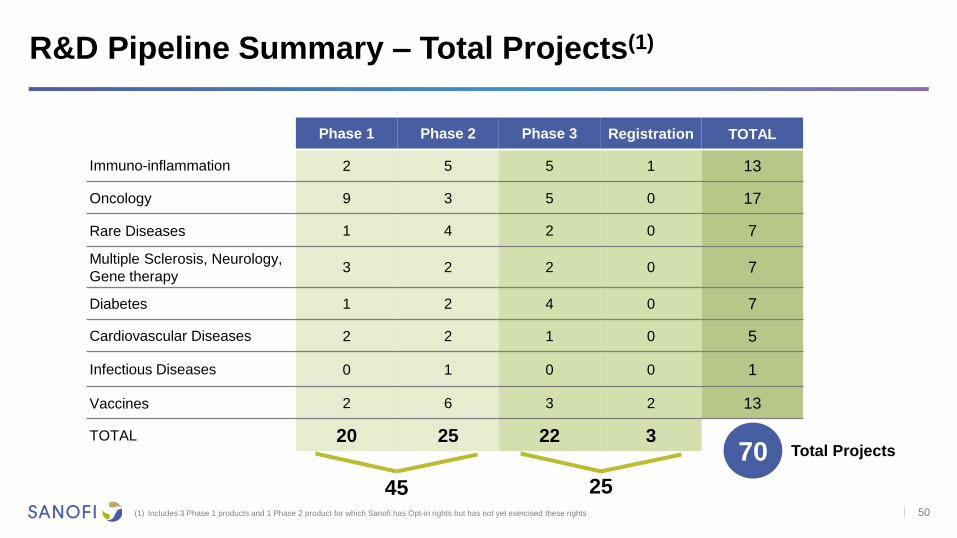
R&D Pipeline Summary – Total Projects(1)
Phase 1 Phase 2 Phase 3 Registration TOTAL
Immuno-inflammation 2 5 5 1 13
Oncology 9 3 5 0 17
Rare Diseases 1 4 2 0 7
Multiple Sclerosis, Neurology,
Gene therapy 3 2 2 0 7
Diabetes 1 2 4 0 7
Cardiovascular Diseases 2 2 1 0 5
Infectious Diseases 0 1 0 0 1
Vaccines 2 6 3 2 13
TOTAL 20
25 22 3
45 25
Total Projects 70
(1) Includes 3 Phase 1 products and 1 Phase 2 product for which Sanofi has Opt-in rights but has not yet exercised these rights