Q4 and Full Year 2012 Conference Call · Key P&L Line Items (Adjusted) Q4 2012 Q4 2011 ∆ vs....
58
Q4 and Full Year 2012 Conference Call J 24 2013 January 24, 2013
Transcript of Q4 and Full Year 2012 Conference Call · Key P&L Line Items (Adjusted) Q4 2012 Q4 2011 ∆ vs....

Q4 and Full Year 2012 Conference Call
J 24 2013January 24, 2013

Agenda
Patrick Flanigan VP Investor RelationsPatrick Flanigan, VP, Investor Relations
Bob Hugin Chief Executive OfficerBob Hugin, Chief Executive Officer
Jackie Fouse Chief Financial OfficerJackie Fouse, Chief Financial Officer
Mark Alles, Head of Hematology/Oncology
2
Q&A
Forward Looking Statements and Adjusted Financial Information
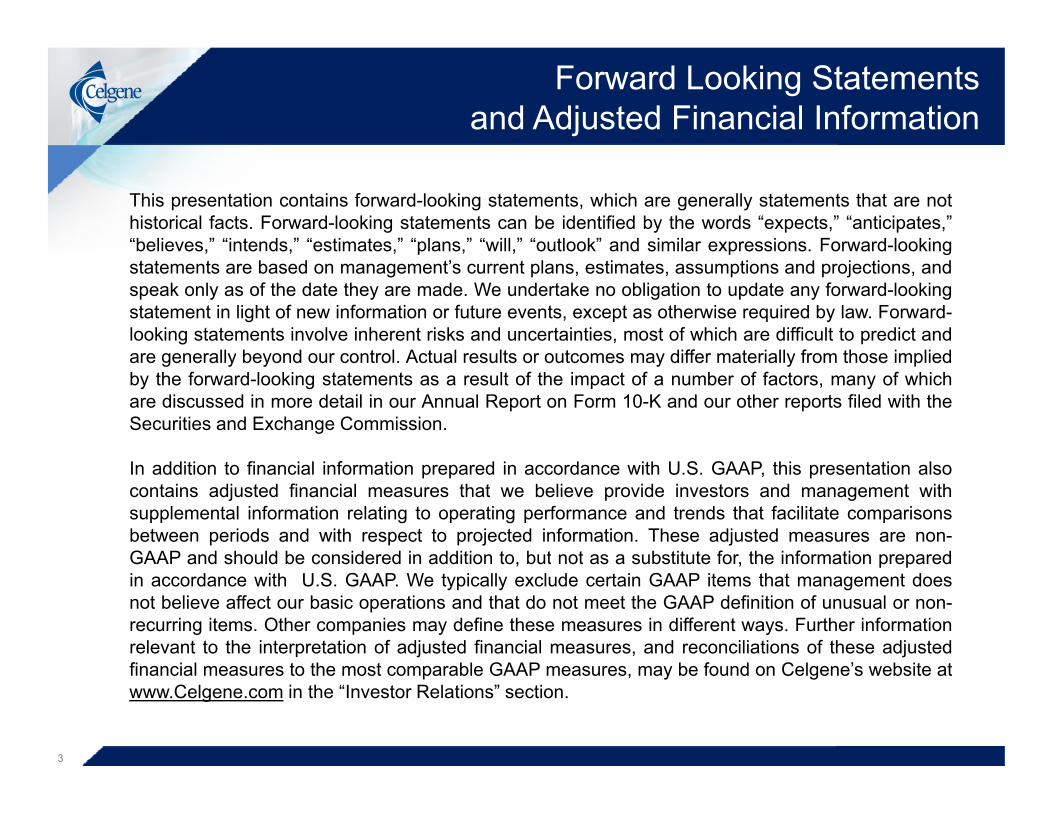
This presentation contains forward-looking statements, which are generally statements that are nothistorical facts. Forward-looking statements can be identified by the words “expects,” “anticipates,”“believes,” “intends,” “estimates,” “plans,” “will,” “outlook” and similar expressions. Forward-looking, , , p , , p gstatements are based on management’s current plans, estimates, assumptions and projections, andspeak only as of the date they are made. We undertake no obligation to update any forward-lookingstatement in light of new information or future events, except as otherwise required by law. Forward-looking statements involve inherent risks and uncertainties, most of which are difficult to predict andare generally beyond our control Actual results or outcomes may differ materially from those impliedare generally beyond our control. Actual results or outcomes may differ materially from those impliedby the forward-looking statements as a result of the impact of a number of factors, many of whichare discussed in more detail in our Annual Report on Form 10-K and our other reports filed with theSecurities and Exchange Commission.
In addition to financial information prepared in accordance with U.S. GAAP, this presentation alsocontains adjusted financial measures that we believe provide investors and management withsupplemental information relating to operating performance and trends that facilitate comparisonsbetween periods and with respect to projected information. These adjusted measures are non-GAAP and should be considered in addition to but not as a substitute for the information preparedGAAP and should be considered in addition to, but not as a substitute for, the information preparedin accordance with U.S. GAAP. We typically exclude certain GAAP items that management doesnot believe affect our basic operations and that do not meet the GAAP definition of unusual or non-recurring items. Other companies may define these measures in different ways. Further informationrelevant to the interpretation of adjusted financial measures, and reconciliations of these adjustedfi i l t th t bl GAAP b f d C l ’ b it t
3
financial measures to the most comparable GAAP measures, may be found on Celgene’s website atwww.Celgene.com in the “Investor Relations” section.

Bob Hugin

2012: A Year of Significant Achievements Positioning Us for Sustained Growth
Outstanding financial results:
Strong top- and bottom-line growth increasing global cash flowStrong top- and bottom-line growth increasing global cash flow Continued operating momentum with improving marginsAssertive management of balance sheet and capital structure
Strong performance across commercial metrics:
Growth across product lines driven by increased share and durationLaunches in new indications to serve more patients
Building for the future:
Launches in new indications to serve more patients Expanding access in new geographies
Building for the future:
Key regulatory filings including POMALYST® in US, EU; REVLIMID® MCL in USABRAXANE® positive data in pancreatic cancer and melanomaApremilast pivotal data in psoriatic arthritis and psoriasisAdvancing key early- to mid-stage pipeline programs
5
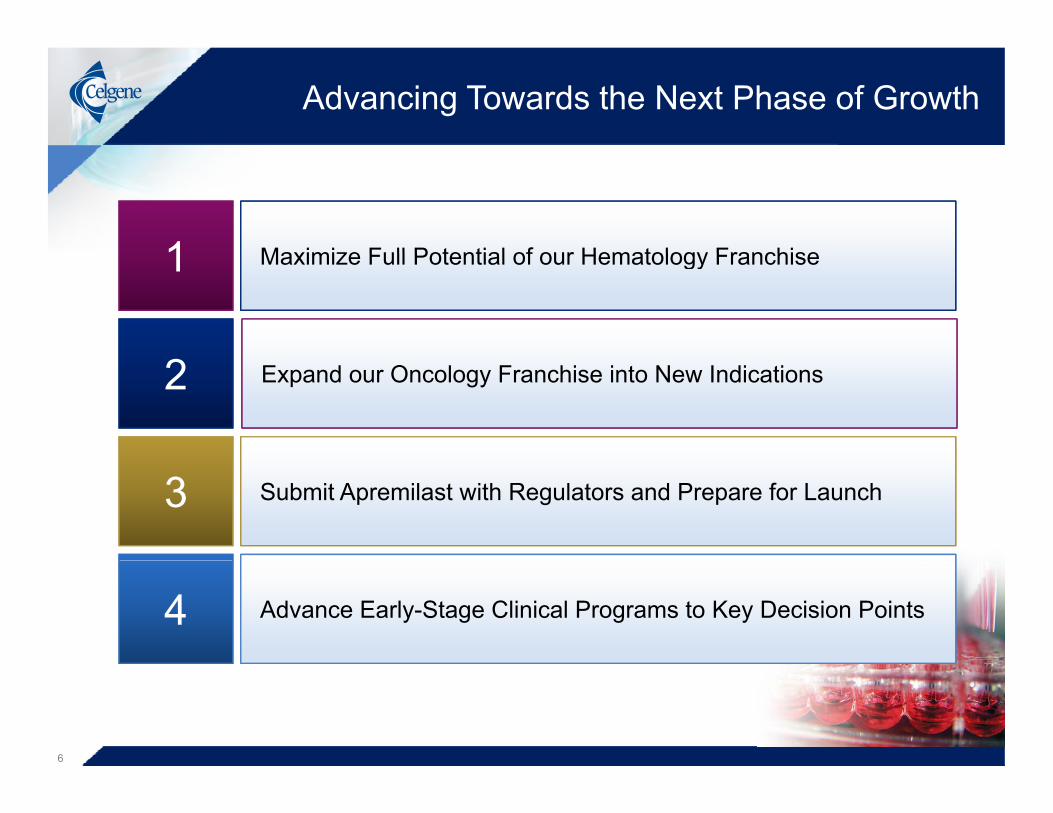
Advancing Towards the Next Phase of Growth
Maximize Full Potential of our Hematology Franchise1 Maximize Full Potential of our Hematology Franchise1
Expand our Oncology Franchise into New Indications2
Submit Apremilast with Regulators and Prepare for Launch3
Advance Early-Stage Clinical Programs to Key Decision Points4
6

Jackie Fouse

2012 Financial Highlights
Outstanding operating results:Year-over-year product sales grew 15% and fully diluted EPS grew 30%y p g y gImproved adjusted operating margins by 300 bps
Adding value with financial drivers:Adding value with financial drivers:28.6M shares repurchased in 2012 for $2.1B7.5M shares repurchased in Q4 for ~$580M
Excellent performance on operating metrics including:REVLIMID annual growth of 17% Approval for ABRAXANE in NSCLCApproval for ABRAXANE in NSCLC
Investing for the future:Advanced >30 pivotal/phase III trials and accelerated early- to mid-stage pipelineEntered into new collaborations and expanded existing partnerships
8

Components of Revenues
∆ vs. ∆ vs.(in millions) Q4:12
∆ vs.Q4:11 FY 2012
∆ vs.FY11
Total Net Product Sales $1,416 ↑14% $5,386 ↑15%
Collaborative Revenue $2 ↓18% $11 ↓45%
Royalty Revenue $29 ↓23% $110 ↓10%
Total Revenue $1 447 ↑13% $5 507 ↑14%Total Revenue $1,447 ↑13% $5,507 ↑14%
9

Total Product Sales(Growth Rates = Growth vs. Prior Year Period)
$5,386
Q4 Full Year
$1,241
$1,416 $4,673
,
$1,023$3,484
Mill
ions
↑21% ↑14% ↑34% ↑15%↑42% ↑36%
Q4:10 Q4:11 Q4:12 2010 2011 2012
10
2010 and 2011 figures are adjusted
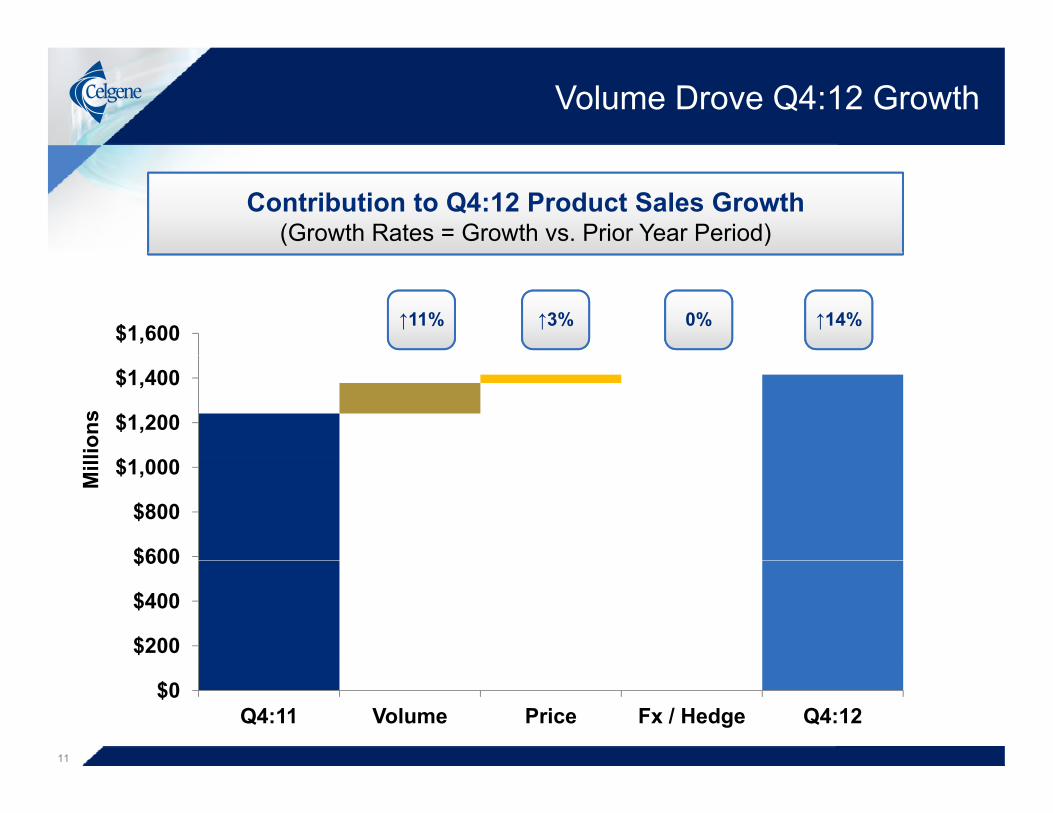
Volume Drove Q4:12 Growth
Contribution to Q4:12 Product Sales Growth(Growth Rates = Growth vs. Prior Year Period)
$1,600 ↑14%0%↑11% ↑3%
$
$1,200
$1,400
lions
$600
$800
$1,000Mill
$200
$400
$600
$0Q4:11 Volume Price Fx / Hedge Q4:12
11
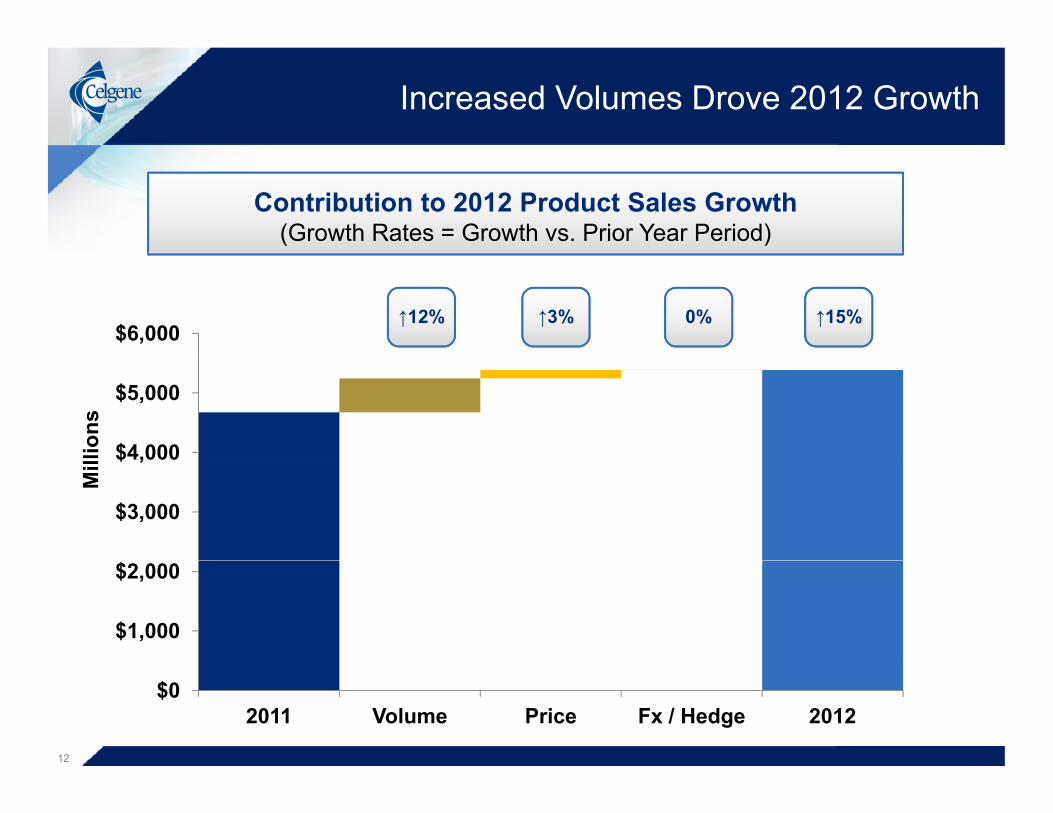
Increased Volumes Drove 2012 Growth
Contribution to 2012 Product Sales Growth(Growth Rates = Growth vs. Prior Year Period)
$6,000↑15%0%↑12% ↑3%
$4,000
$5,000
lions
$3,000
$4,000
Mill
$1,000
$2,000
$02011 Volume Price Fx / Hedge 2012
12
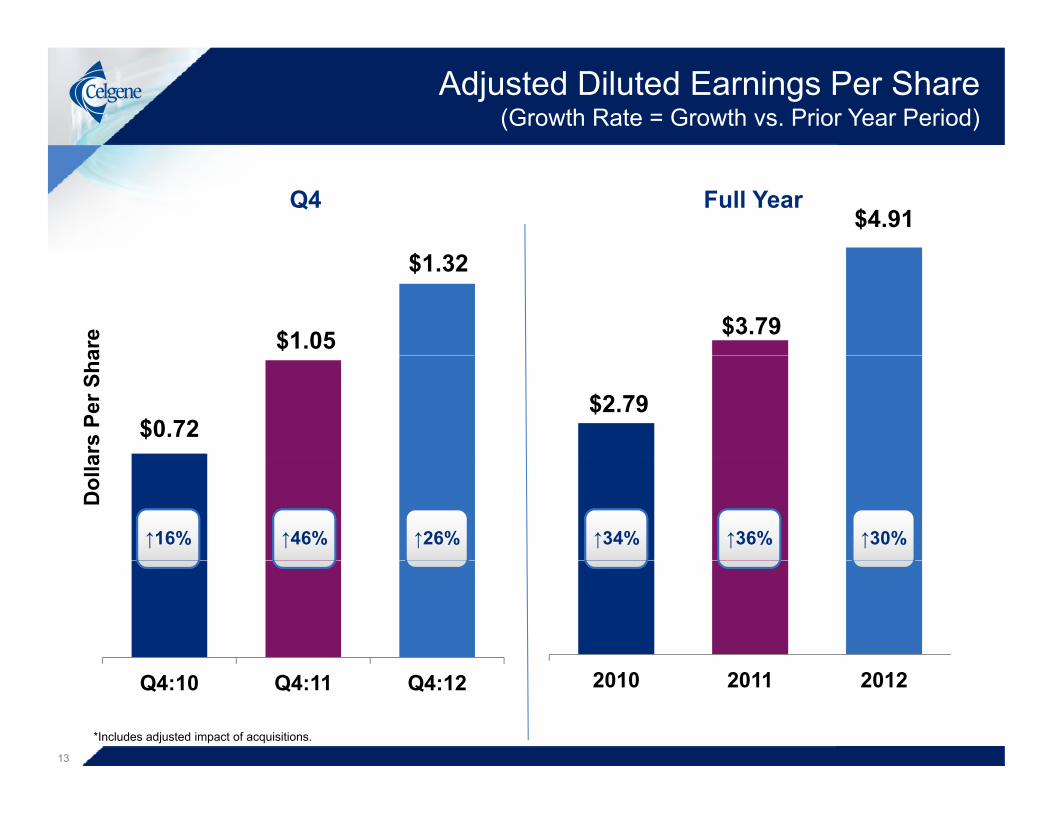
Adjusted Diluted Earnings Per Share (Growth Rate = Growth vs. Prior Year Period)
$
Q4 Full Year$4.91
$1.05
$1.32
$3.79
are
$0.72$2.79
ars
Per S
ha
↑46% ↑26% ↑36% ↑30%↑16% ↑34%
Dol
la
Q4:10 Q4:11 Q4:12 2010 2011 2012
*Includes adjusted impact of acquisitions.
13

Adjusted Diluted EPS Growth Driven by Increased Operating Income
Contribution to Q4:12 Adjusted Diluted EPS
$1.32($0.05)$0.23$1.05 $0.04 $0.05
Shar
eD
olla
rs P
er
D
Q4:11 Operating Income
Financial Income / Expense
Tax Rate Share Count Q4:12
14

Adjusted Diluted EPS Growth Driven by Increased Operating Income
Contribution to 2012 Adjusted Diluted EPS
$4.91($0.07)$0.85$3.79 $0.11 $0.23
Sha
reDo
llars
Per
D
2011 Operating Income
Financial Income / Expense
Tax Rate Share Count 2012
15
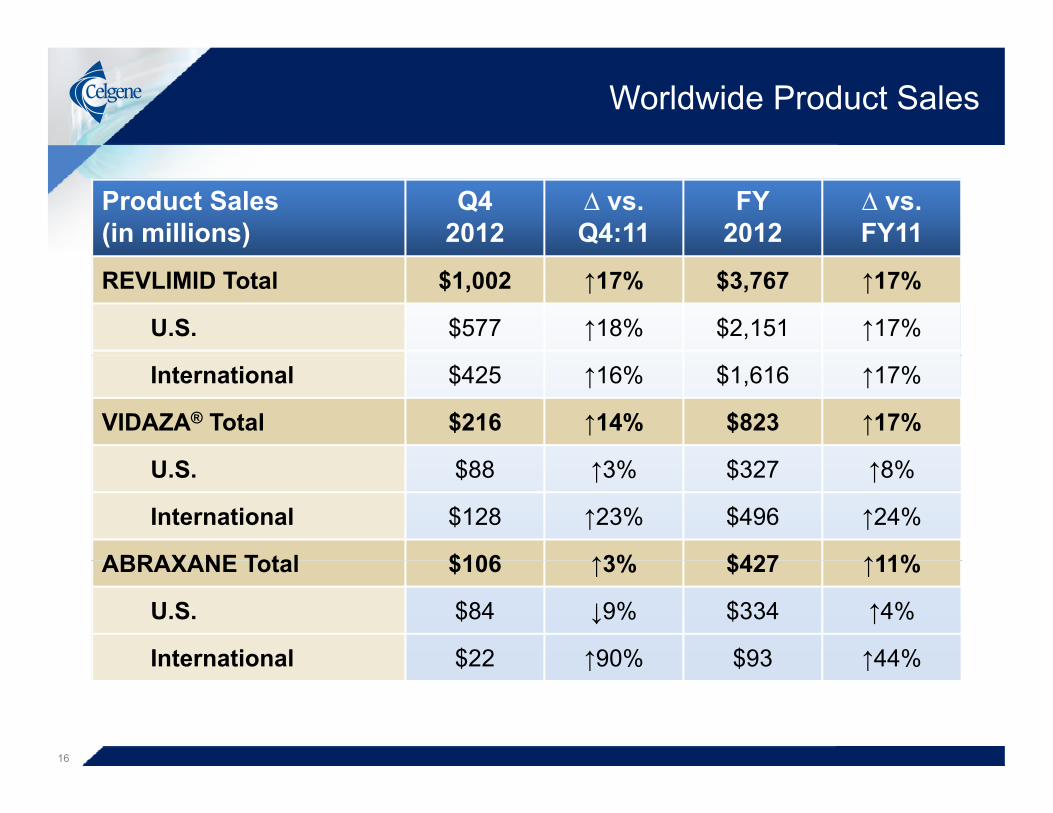
Worldwide Product Sales
Product Sales(in millions)
Q4 2012
∆ vs.Q4:11
FY2012
∆ vs.FY11
REVLIMID Total $1,002 ↑17% $3,767 ↑17%
U.S. $577 ↑18% $2,151 ↑17%
International $425 ↑16% $1,616 ↑17%
VIDAZA® Total $216 ↑14% $823 ↑17%
U.S. $88 ↑3% $327 ↑8%
International $128 ↑23% $496 ↑24%
ABRAXANE Total $106 ↑3% $427 ↑11%ABRAXANE Total $106 ↑3% $427 ↑11%
U.S. $84 ↓9% $334 ↑4%
International $22 ↑90% $93 ↑44%International $22 ↑90% $93 ↑44%
16

Total REVLIMID Sales (Growth Rates = Sequential Quarterly Growth)
$738
$861$795
$934
$820
$970
$855
$1,002
$530
$738
$397
$587
$450
$641
$497
$710
s $363 $397
Milli
ons
2009 2010 2011 2012Q1 Q2 Q3 Q4
+7% +11% +9% +11% +1%+8% +3% +4%+4% +8% +4% +3%-2% +9% +13% +10%
17
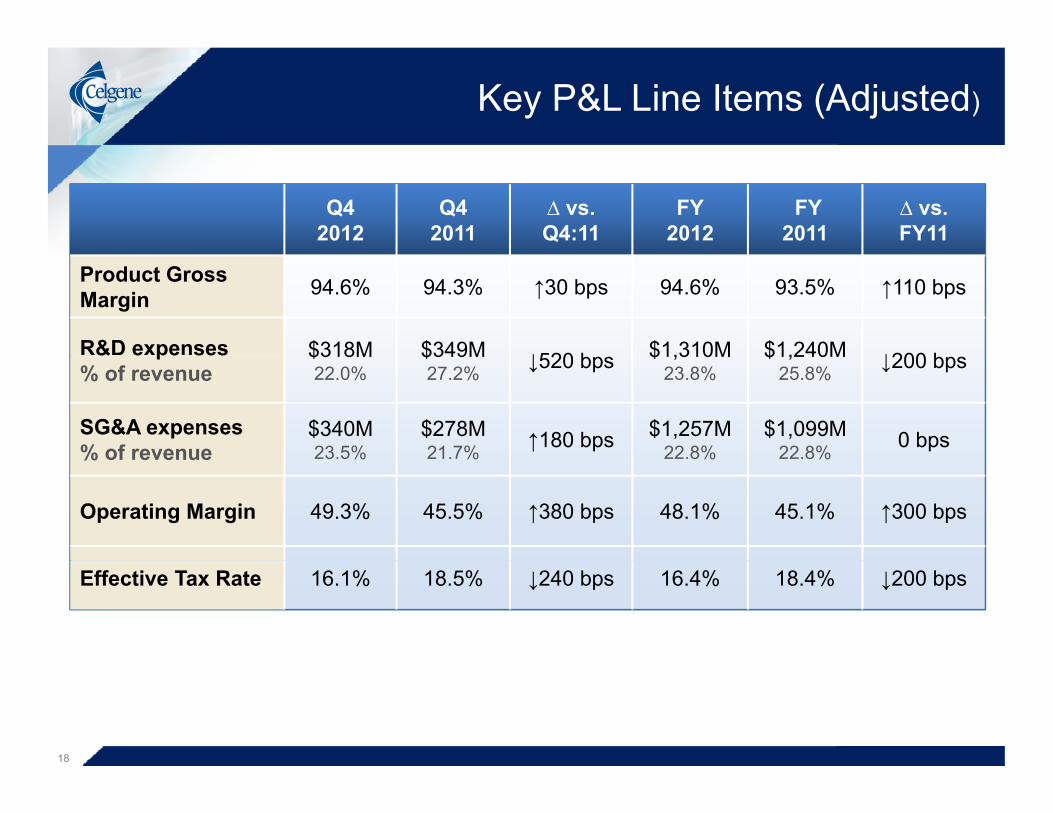
Key P&L Line Items (Adjusted)
Q42012
Q42011
∆ vs.Q4:11
FY2012
FY 2011
∆ vs.FY11
Product Gross Margin 94.6% 94.3% ↑30 bps 94.6% 93.5% ↑110 bps
R&D expenses $318M $349M ↓520 b $1,310M $1,240M ↓200 b& e pe ses% of revenue
$318M 22.0%
$349M 27.2% ↓520 bps $1,310M
23.8%$1,240M
25.8% ↓200 bps
SG&A expenses% of revenue
$340M 23.5%
$278M 21.7% ↑180 bps $1,257M
22.8%$1,099M
22.8% 0 bps% of revenue 23.5% 21.7% 22.8% 22.8%
Operating Margin 49.3% 45.5% ↑380 bps 48.1% 45.1% ↑300 bps
Effective Tax Rate 16.1% 18.5% ↓240 bps 16.4% 18.4% ↓200 bps
18
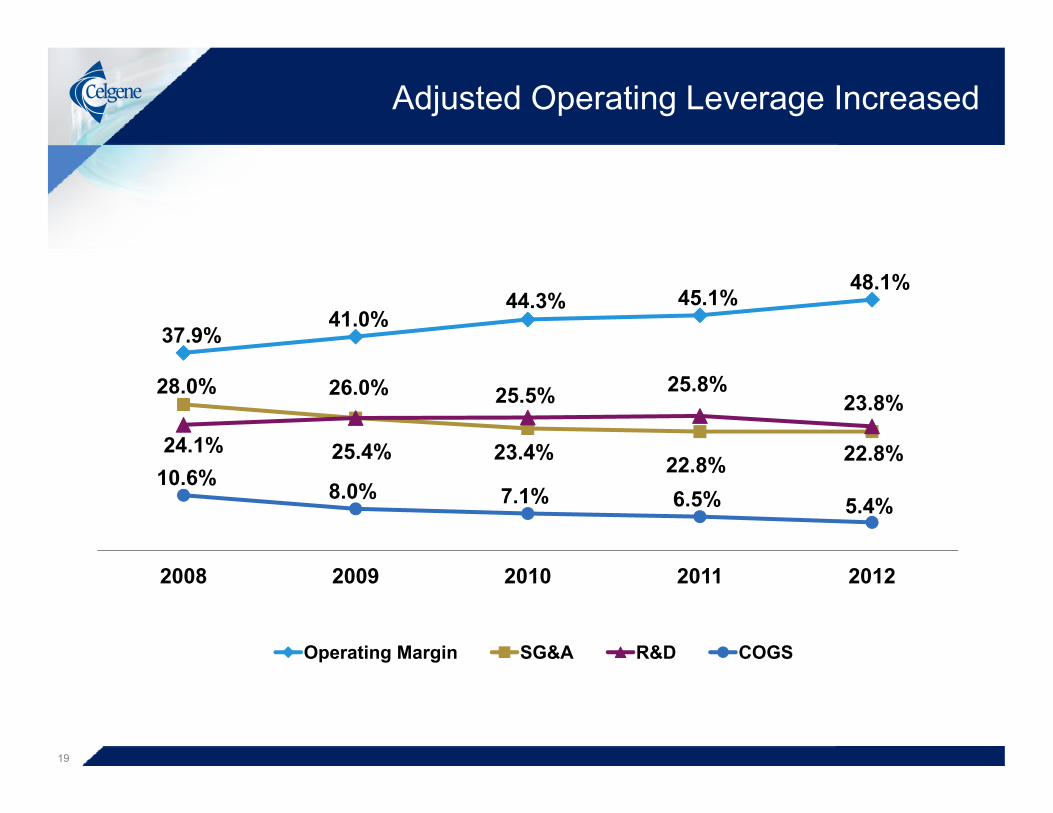
Adjusted Operating Leverage Increased
37.9%41.0%
44.3% 45.1%48.1%
28.0%
25.4% 23.4% 22 8% 22.8%24.1%
26.0% 25.5% 25.8%23.8%
25.4% 23.4% 22.8% 22.8%10.6% 8.0% 7.1% 6.5% 5.4%
2008 2009 2010 2011 2012
Operating Margin SG&A R&D COGS
19
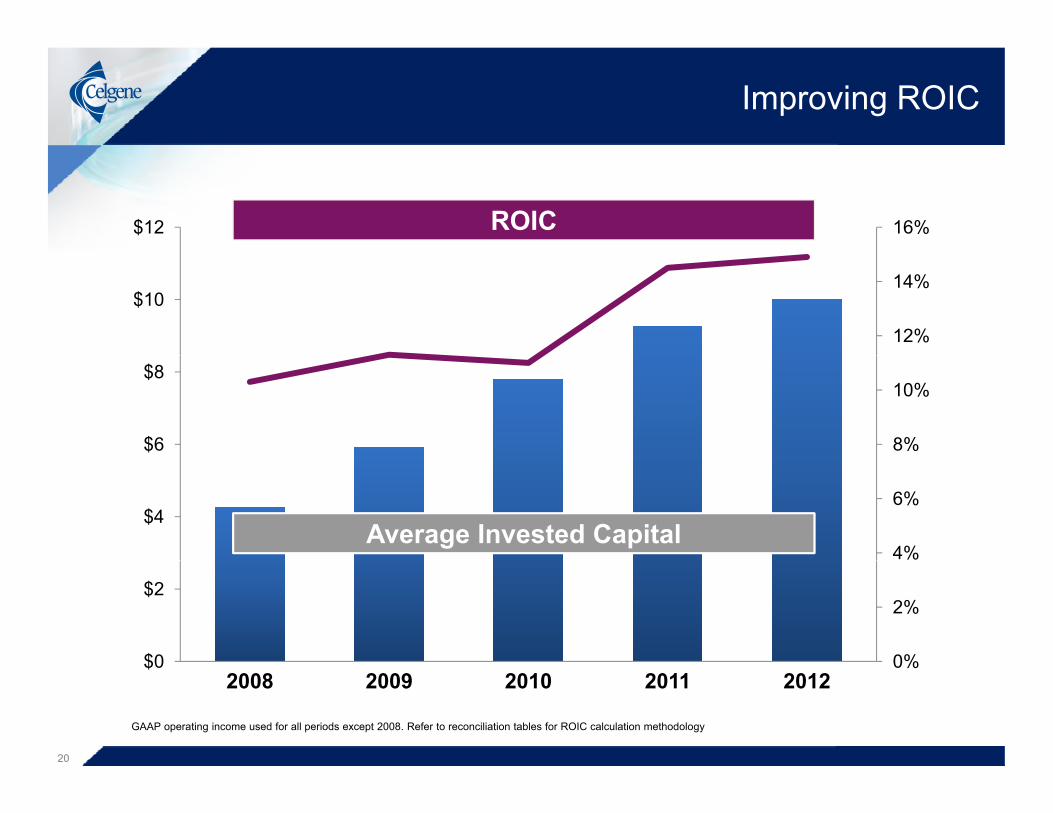
Improving ROIC
16%$12 ROIC
12%
14%$10
8%
10%
$6
$8
4%
6%$4
Average Invested Capital
0%
2%
$0
$2
0%$02008 2009 2010 2011 2012
20
GAAP operating income used for all periods except 2008. Refer to reconciliation tables for ROIC calculation methodology

Cash and Marketable Securities
(in billions) 12/30/12 12/31/11( )
Cash and Marketable Securities $3.90 $2.65
• Cash flow from operations was $2,031M during 20121
• Authorized repurchase of aggregate of $6.5B in common sharesp gg g $– In 2012, purchased 28.6M shares for total cost ~$2.1B– In Q4:12, purchased 7.5M shares for total cost of ~$580M– ~$1.8B remaining under existing stock repurchase program
$• Issued $1.5B in five- and ten-year bonds• In Q4, paid $121M of up front payments for collaborations and
investments
21
1 net of $190 million of payments related to collaboration agreements
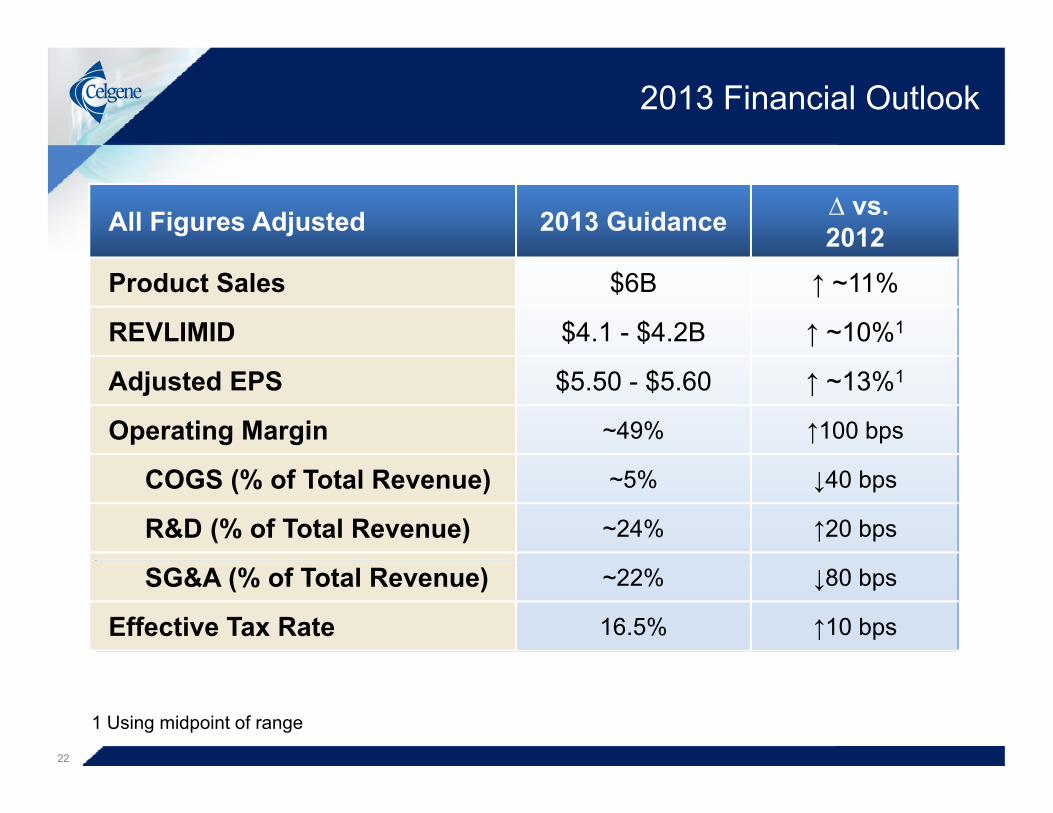
2013 Financial Outlook
All Figures Adjusted 2013 Guidance ∆ vs.2012
Product Sales $6B ↑ ~11%
REVLIMID $4.1 - $4.2B ↑ ~10%1
Adjusted EPS $5.50 - $5.60 ↑ ~13%1
Operating Margin ~49% ↑100 bps
COGS (% of Total Revenue) ~5% ↓40 bps
R&D (% of Total Revenue) ~24% ↑20 bps
SG&A (% of Total Revenue) ~22% ↓80 bps
Effective Tax Rate 16.5% ↑10 bps
1 Using midpoint of range
22
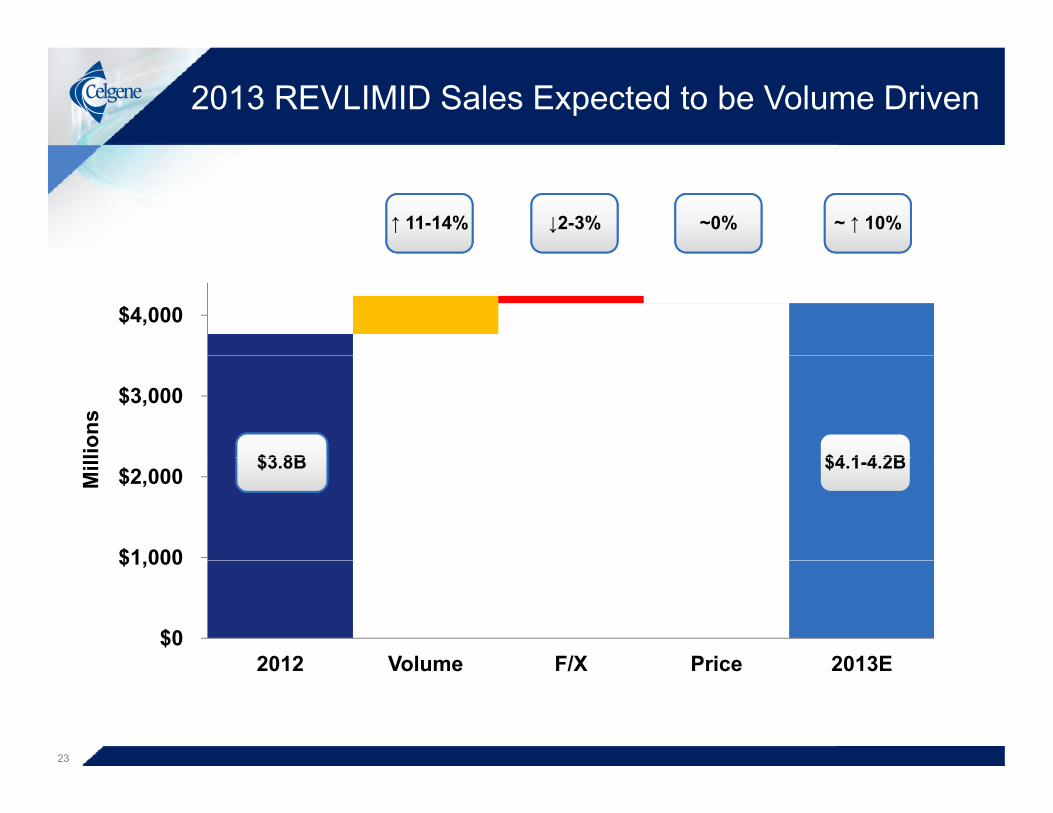
2013 REVLIMID Sales Expected to be Volume Driven
~ ↑ 10%↑ 11-14% ↓2-3% ~0%
$4,000
$3,000
lions
$3 8B $4 1 4 2B
$1 000
$2,000 Mill $3.8B $4.1-4.2B
$0
$1,000
2012 Volume F/X Price 2013E2012 Volume F/X Price 2013E
23
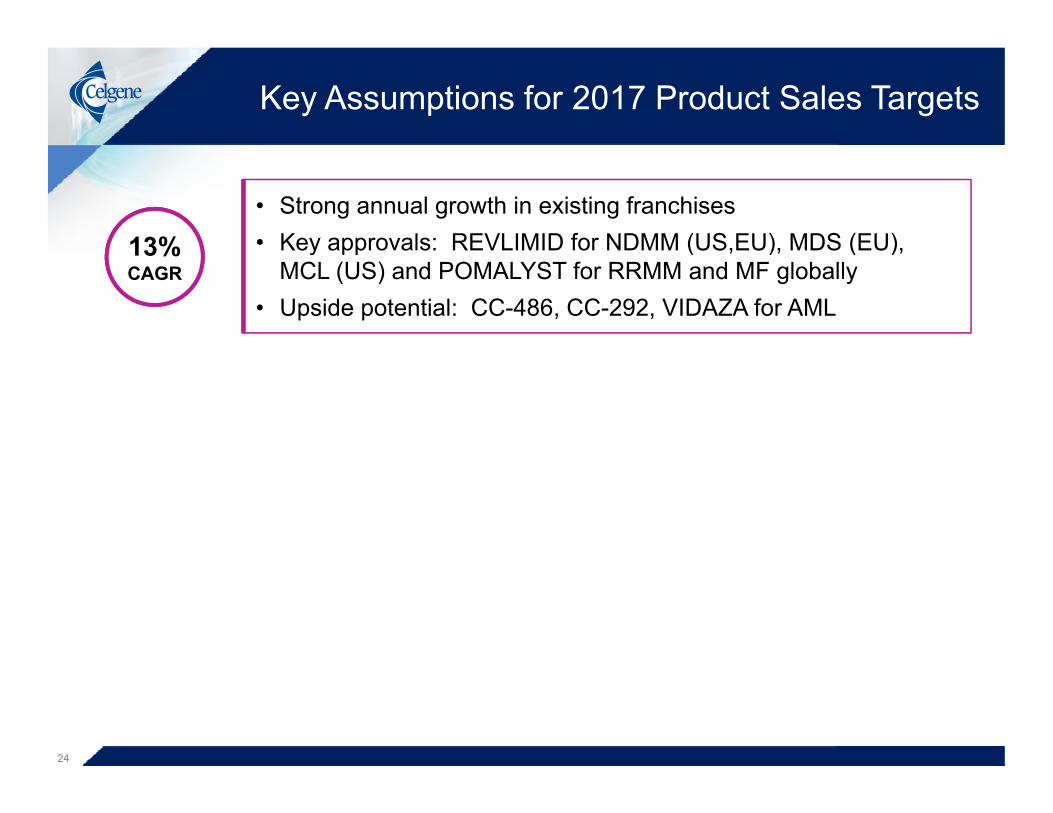
Key Assumptions for 2017 Product Sales Targets
• Strong annual growth in existing franchises• Key approvals: REVLIMID for NDMM (US,EU), MDS (EU), 13% y pp ( , ), ( ),
MCL (US) and POMALYST for RRMM and MF globally• Upside potential: CC-486, CC-292, VIDAZA for AML
13%CAGR
24

Key Assumptions for 2017 Product Sales Targets
• Strong annual growth in existing franchises• Key approvals: REVLIMID for NDMM (US,EU), MDS (EU), 13% y pp ( , ), ( ),
MCL (US) and POMALYST for RRMM and MF globally• Upside potential: CC-486, CC-292, VIDAZA for AML
13%CAGR
+2% points
• ABRAXANE in pancreatic enhances annual growth• Key approvals: pancreatic cancer globally15%
CAGR
+2% points
• Upside potential: melanoma and other cancersCAGR
25

Key Assumptions for 2017 Product Sales Targets
• Strong annual growth in existing franchises• Key approvals: REVLIMID for NDMM (US,EU), MDS (EU), 13% y pp ( , ), ( ),
MCL (US) and POMALYST for RRMM and MF globally• Upside potential: CC-486, CC-292, VIDAZA for AML
13%CAGR
+2% points
• ABRAXANE in pancreatic enhances annual growth• Key approvals: pancreatic cancer globally15%
CAGR
+2% points
• Upside potential: melanoma and other cancersCAGR
+4% points
• Apremilast accelerates annual growth• Key approvals: psoriatic arthritis and psoriasis globally• Upside potential: ankylosing spondylitis and other indications
19%CAGR
Upside potential: ankylosing spondylitis and other indications
26

Key Assumptions for 2017 Earnings Targets
EPS2
($)Hematology
~$12B+
Revenue($B)
25%CAGR1
Oncology
I&I/Other
$12B+
$1.5-2.0B
$1.5-2.0B$13.00 -$14.00
$5 50~$6B
~$8-9B
$1.0-1.25B$0.25-1.0B
$
$8.00 -$9.00
$5.50 -$5.60
$5.3-5.4B
$0.6-0.7B
$6.0-6.5B $8.3-8.8B
2013E 2015E 2017E2013E 2015E 2017E 2013E 2015E 2017E
27
Notes: 1) CAGR calculated using 2013E and 2017 midpoints. 2)Adjusted.
2013E 2015E 2017E

Key Assumptions for 2017 Earnings Targets
EPS2
($)Key Assumptions
25%CAGR1
• Investment in I&I infrastructure
$13.00 -$14.00
$5 50
infrastructure
• Continuous operating margin improvement
$8.00 -$9.00
$5.50 -$5.60
g pthrough 2017
• Tax rate: 16.5%
2013E 2015E 2017E
• Fully diluted sharesoutstanding: 430M
2013E 2015E 2017E
28
Notes: 1) CAGR calculated using 2013E and 2017 midpoints. 2)Adjusted.

2012: Strong Momentum and Investing For The Future
• Performance driven by top line growth and• Performance driven by top-line growth and operating efficiency
• Strength across all operational and financial metrics• Strength across all operational and financial metrics
– Growth rates, Margins, Balance Sheet
• Robust cash flow generation and return of capital to shareholders
R&D i li d l b l i f i i• R&D pipeline and global infrastructure position Celgene well for long-term growth and ongoing P&L leverageg
29

Mark Alles
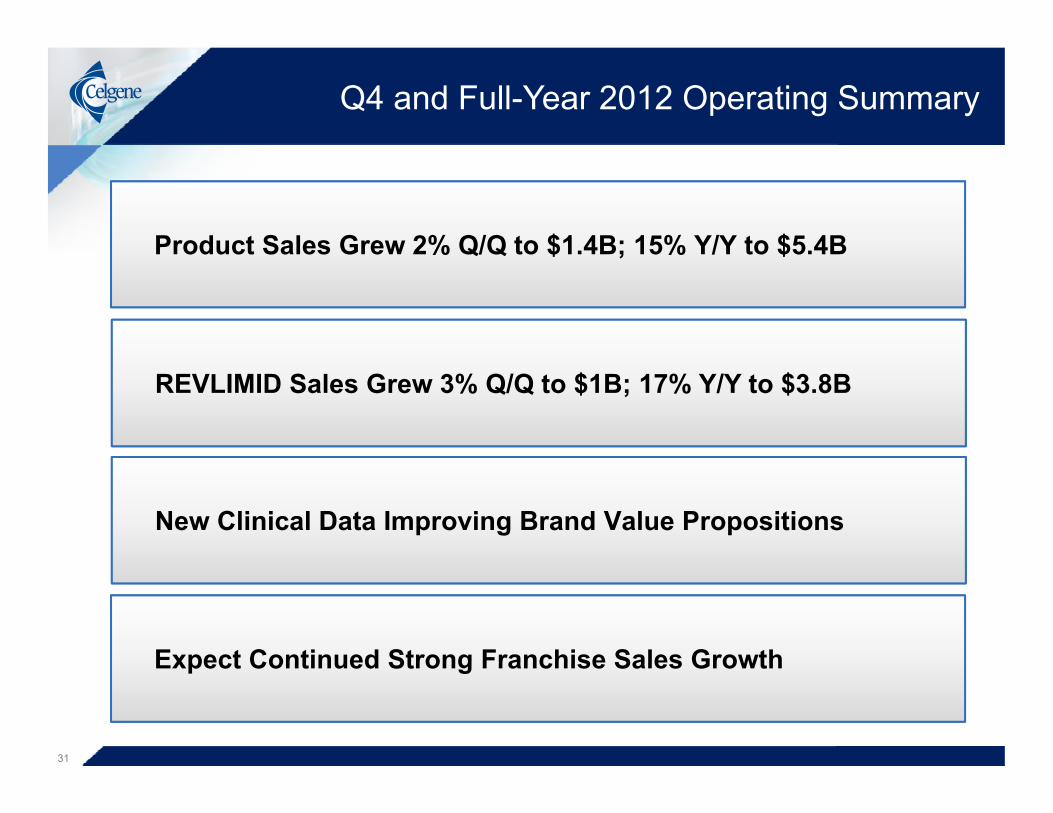
Q4 and Full-Year 2012 Operating Summary
Product Sales Grew 2% Q/Q to $1.4B; 15% Y/Y to $5.4BProduct Sales Grew 2% Q/Q to $1.4B; 15% Y/Y to $5.4B
REVLIMID Sales Grew 3% Q/Q to $1B; 17% Y/Y to $3.8B
New Clinical Data Improving Brand Value Propositions
Expect Continued Strong Franchise Sales GrowthExpect Continued Strong Franchise Sales Growth
31
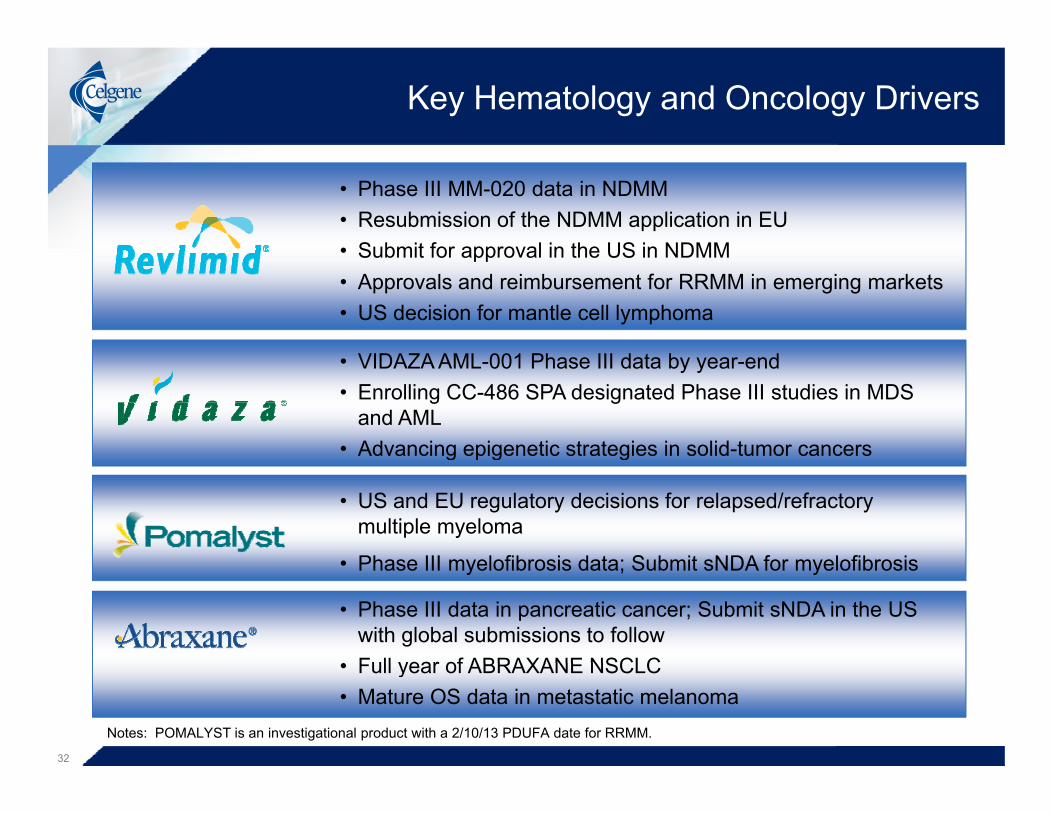
Key Hematology and Oncology Drivers
• Phase III MM-020 data in NDMM• Resubmission of the NDMM application in EU• Submit for approval in the US in NDMM
VIDAZA AML 001 Ph III d t b d
Submit for approval in the US in NDMM• Approvals and reimbursement for RRMM in emerging markets• US decision for mantle cell lymphoma
• VIDAZA AML-001 Phase III data by year-end• Enrolling CC-486 SPA designated Phase III studies in MDS
and AML• Advancing epigenetic strategies in solid-tumor cancers g p g g
• US and EU regulatory decisions for relapsed/refractorymultiple myeloma
• Phase III myelofibrosis data; Submit sNDA for myelofibrosis• Phase III myelofibrosis data; Submit sNDA for myelofibrosis
• Phase III data in pancreatic cancer; Submit sNDA in the US with global submissions to follow
• Full year of ABRAXANE NSCLC• Full year of ABRAXANE NSCLC• Mature OS data in metastatic melanoma
Notes: POMALYST is an investigational product with a 2/10/13 PDUFA date for RRMM.
32
Key Hematology and Oncology Drivers
• Phase III MM-020 data in NDMM• Resubmission of the NDMM application in EU• Submit for approval in the US in NDMM
VIDAZA AML 001 Ph III d t b d
Submit for approval in the US in NDMM• Approvals and reimbursement for RRMM in emerging markets• US decision for mantle cell lymphomaNear-term Milestones• VIDAZA AML-001 Phase III data by year-end• Enrolling CC-486 SPA designated Phase III studies in MDS
and AML• Advancing epigenetic strategies in solid-tumor cancers
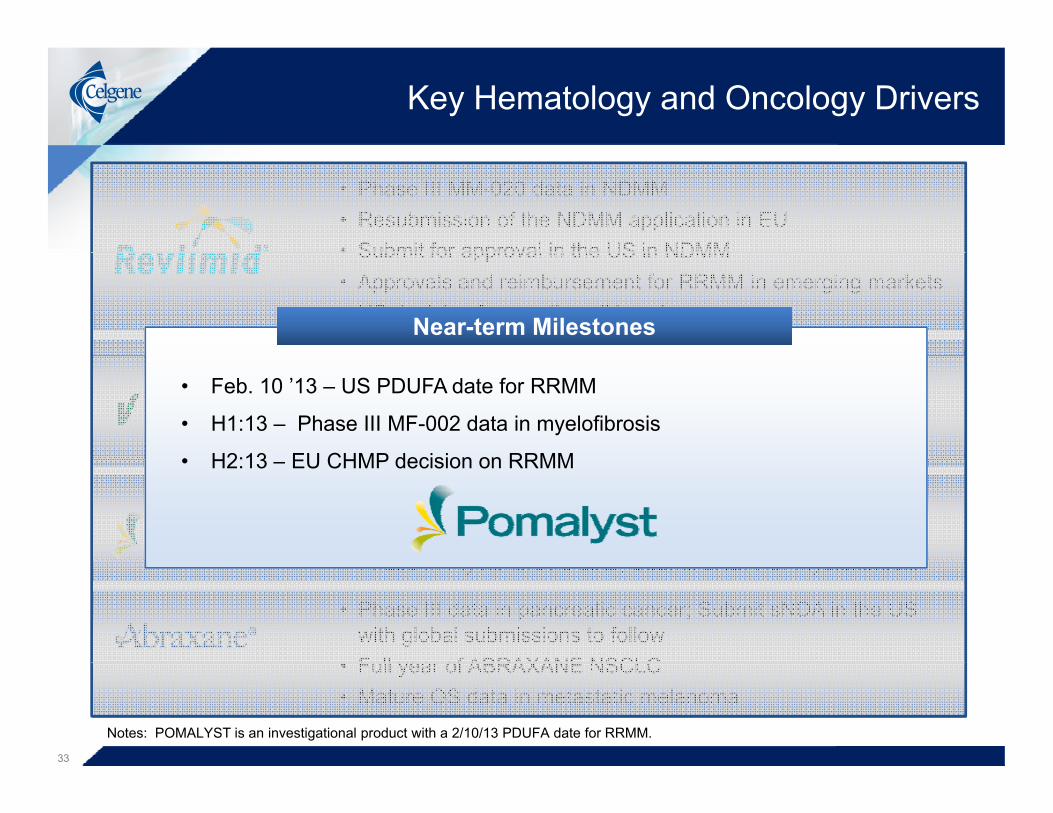
• Feb. 10 ’13 – US PDUFA date for RRMM
• H1:13 – Phase III MF-002 data in myelofibrosis
H2:13 EU CHMP decision on RRMMg p g g
• US and EU regulatory decisions for relapsed/refractorymultiple myeloma
• Phase III myelofibrosis data; Submit sNDA for myelofibrosis
• H2:13 – EU CHMP decision on RRMM
• Phase III myelofibrosis data; Submit sNDA for myelofibrosis
• Phase III data in pancreatic cancer; Submit sNDA in the US with global submissions to follow
• Full year of ABRAXANE NSCLC• Full year of ABRAXANE NSCLC• Mature OS data in metastatic melanoma
Notes: POMALYST is an investigational product with a 2/10/13 PDUFA date for RRMM.
33
Key Hematology and Oncology Drivers
• Phase III MM-020 data in NDMM• Resubmission of the NDMM application in EU• Submit for approval in the US in NDMM
VIDAZA AML 001 Ph III d t b d
Submit for approval in the US in NDMM• Approvals and reimbursement for RRMM in emerging markets• US decision for mantle cell lymphoma
• VIDAZA AML-001 Phase III data by year-end• Enrolling CC-486 SPA designated Phase III studies in MDS
and AML• Advancing epigenetic strategies in solid-tumor cancers
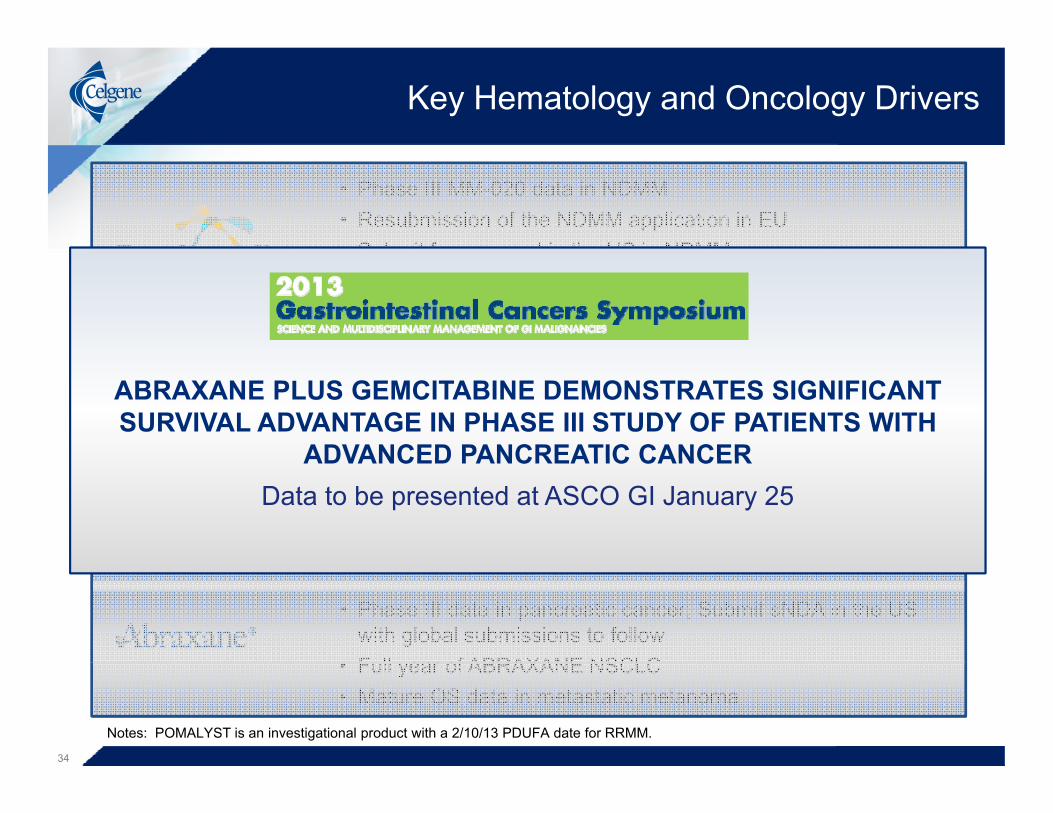
ABRAXANE PLUS GEMCITABINE DEMONSTRATES SIGNIFICANT SURVIVAL ADVANTAGE IN PHASE III STUDY OF PATIENTS WITH
ADVANCED PANCREATIC CANCERg p g g
• US and EU regulatory decisions for relapsed/refractorymultiple myeloma
• Phase III myelofibrosis data; Submit sNDA for myelofibrosis
ADVANCED PANCREATIC CANCERData to be presented at ASCO GI January 25
• Phase III myelofibrosis data; Submit sNDA for myelofibrosis
• Phase III data in pancreatic cancer; Submit sNDA in the US with global submissions to follow
• Full year of ABRAXANE NSCLC• Full year of ABRAXANE NSCLC• Mature OS data in metastatic melanoma
Notes: POMALYST is an investigational product with a 2/10/13 PDUFA date for RRMM.
34
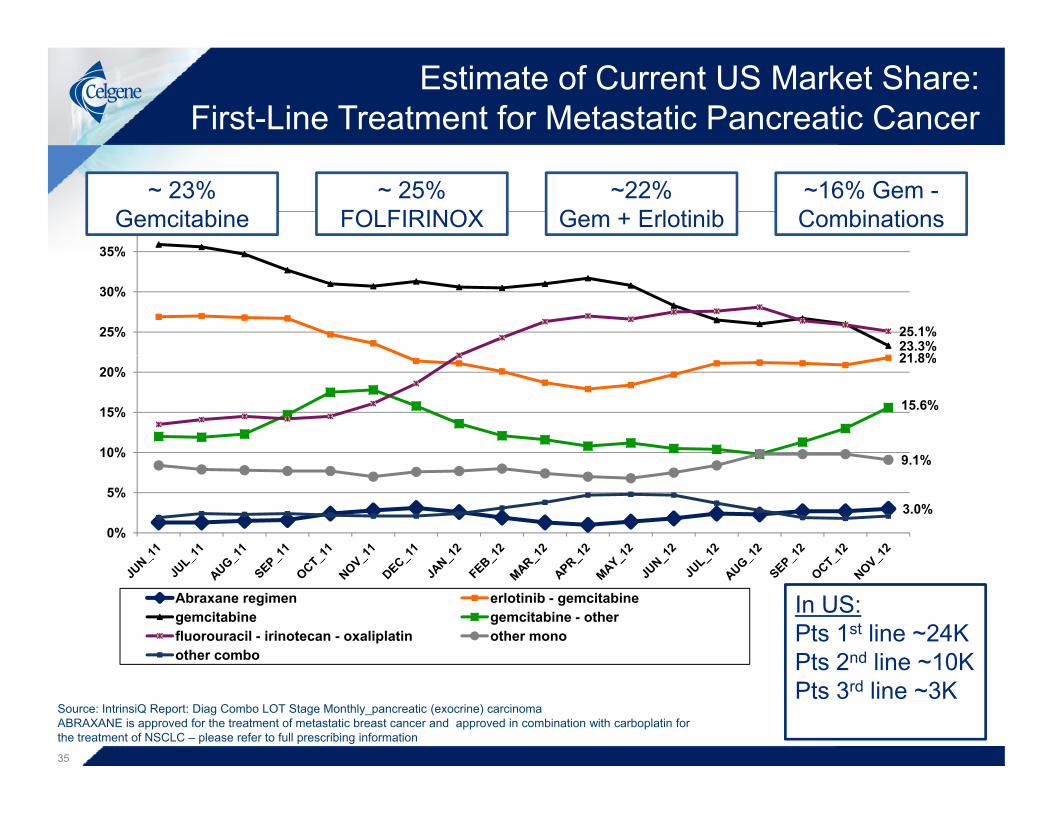
Estimate of Current US Market Share: First-Line Treatment for Metastatic Pancreatic Cancer
35%
40%~ 23%
Gemcitabine~ 25%
FOLFIRINOX~22%
Gem + Erlotinib~16% Gem -Combinations
21 8%23.3%25.1%25%
30%
35%
21.8%
15.6%
9 1%10%
15%
20%
3.0%
9.1%
0%
5%
Abraxane regimen erlotinib - gemcitabinegemcitabine gemcitabine - otherfluorouracil - irinotecan - oxaliplatin other monoother combo
In US:Pts 1st line ~24KPts 2nd line ~10K
Source: IntrinsiQ Report: Diag Combo LOT Stage Monthly_pancreatic (exocrine) carcinomaABRAXANE is approved for the treatment of metastatic breast cancer and approved in combination with carboplatin for the treatment of NSCLC – please refer to full prescribing information
Pts 2 line ~10KPts 3rd line ~3K
35
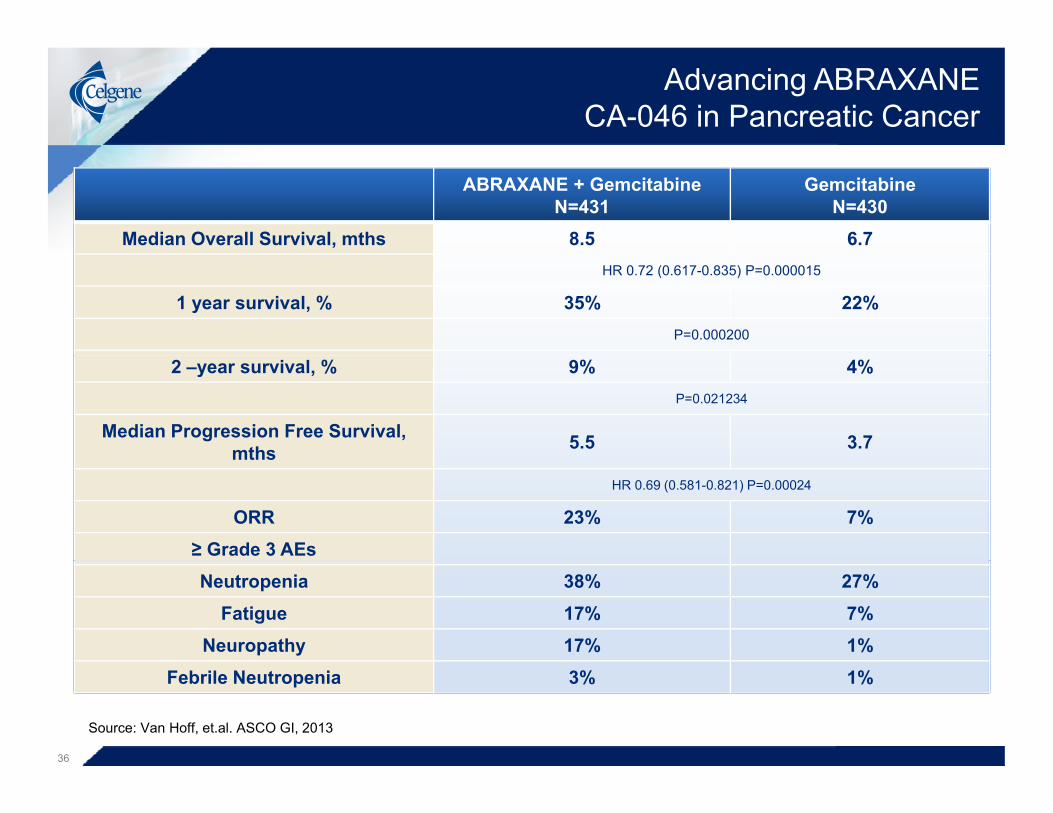
Advancing ABRAXANECA-046 in Pancreatic Cancer
ABRAXANE + GemcitabineN=431
GemcitabineN=430
Median Overall Survival, mths 8.5 6.7HR 0.72 (0.617-0.835) P=0.000015
1 year survival, % 35% 22%P=0.000200
2 –year survival, % 9% 4%P=0.021234
Median Progression Free Survival, mths 5.5 3.7mths
HR 0.69 (0.581-0.821) P=0.00024
ORR 23% 7%≥ Grade 3 AEsNeutropenia 38% 27%
Fatigue 17% 7%Neuropathy 17% 1%
Febrile Neutropenia 3% 1%
Source: Van Hoff, et.al. ASCO GI, 2013
36
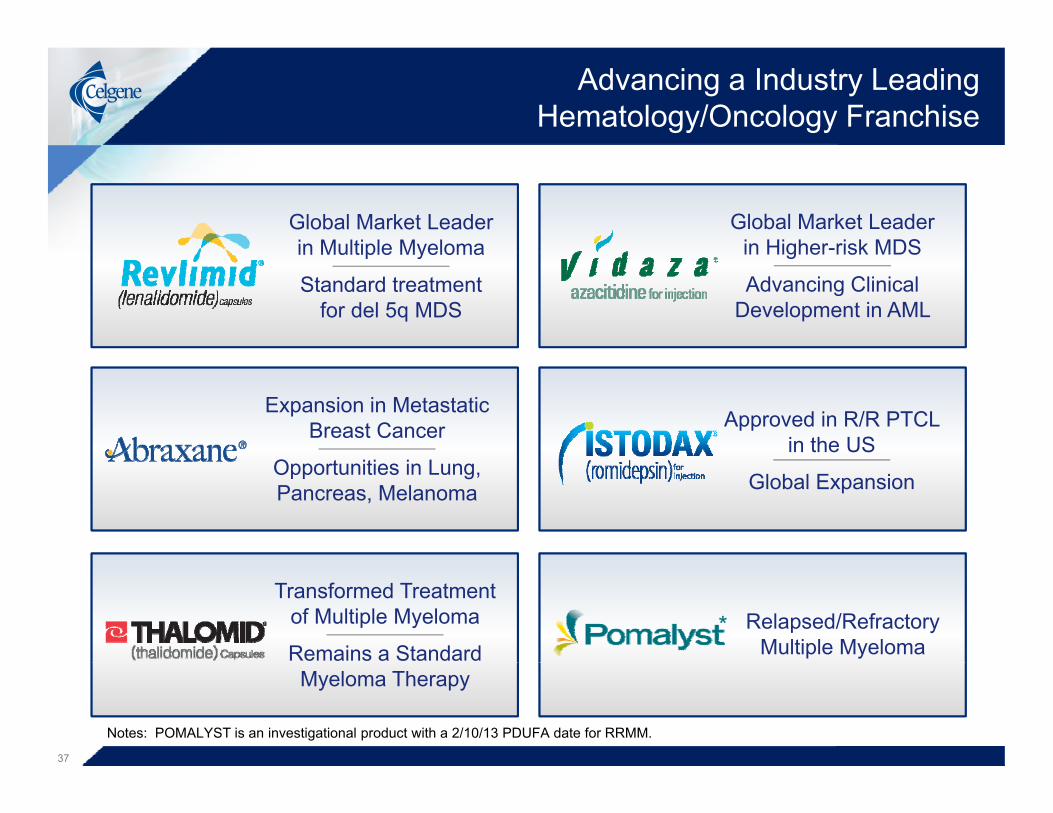
Advancing a Industry Leading Hematology/Oncology Franchise
Global Market Leader in Multiple Myeloma
Global Market Leader in Higher-risk MDSin Multiple Myeloma
Standard treatment for del 5q MDS
in Higher risk MDS
Advancing Clinical Development in AML
Expansion in Metastatic Breast Cancer Approved in R/R PTCL
in the USOpportunities in Lung, Pancreas, Melanoma Global Expansion
Transformed Treatment of Multiple Myeloma
Remains a Standard Relapsed/Refractory
Multiple Myeloma*
Myeloma Therapy
Notes: POMALYST is an investigational product with a 2/10/13 PDUFA date for RRMM.
37

Bob Hugin
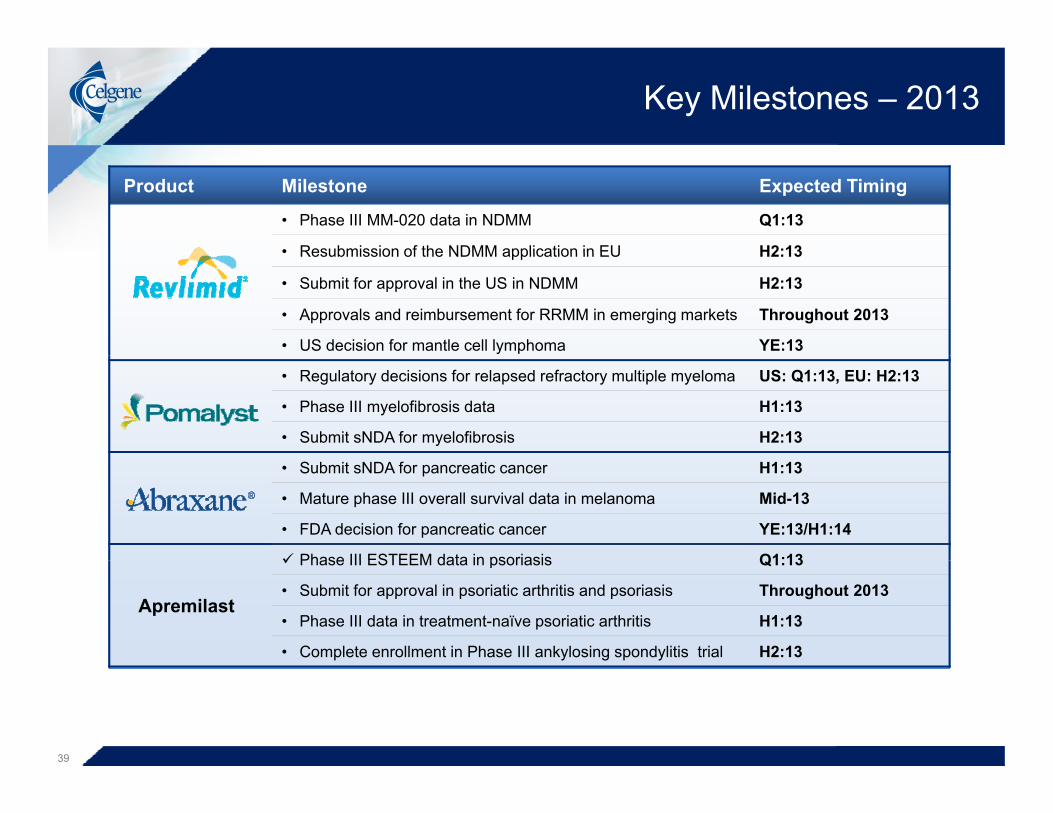
Key Milestones – 2013
Product Milestone Expected Timing
• Phase III MM-020 data in NDMM Q1:13
• Resubmission of the NDMM application in EU H2:13• Resubmission of the NDMM application in EU H2:13
• Submit for approval in the US in NDMM H2:13
• Approvals and reimbursement for RRMM in emerging markets Throughout 2013
• US decision for mantle cell lymphoma YE:13
• Regulatory decisions for relapsed refractory multiple myeloma US: Q1:13, EU: H2:13
• Phase III myelofibrosis data H1:13
• Submit sNDA for myelofibrosis H2:13
• Submit sNDA for pancreatic cancer H1:13
• Mature phase III overall survival data in melanoma Mid-13
• FDA decision for pancreatic cancer YE:13/H1:14
Phase III ESTEEM data in psoriasis Q1:13
Apremilast
Phase III ESTEEM data in psoriasis Q1:13
• Submit for approval in psoriatic arthritis and psoriasis Throughout 2013
• Phase III data in treatment-naïve psoriatic arthritis H1:13
• Complete enrollment in Phase III ankylosing spondylitis trial H2:13
39

Appendix
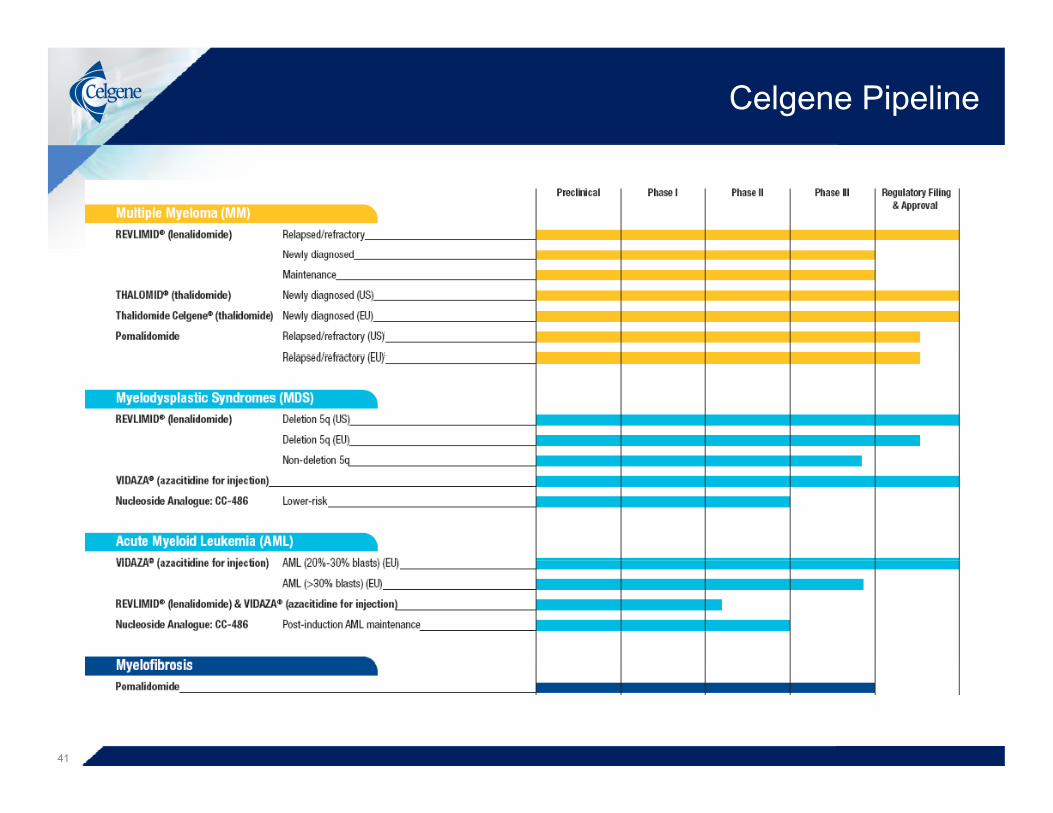
Celgene Pipeline
41

Celgene Pipeline
42

Celgene Pipeline
43

Multiple Myeloma Late Stage Programs
Molecule Revlimid(lenalidomide)
Revlimid(lenalidomide)
Revlimid(lenalidomide)
Revlimid(lenalidomide)
Pomalyst (Pomalidomide)
MM-020 MM-007Trial Name MM-015 CALGB 100104 IFM 2005-02 MM-020FIRST
MM-007OPTIMISMM
Phase Phase III Phase III Phase III Phase III Phase III
dMM & P t ASCT P t ASCTIndication ndMM & maintenance
Post-ASCTmaintenance
Post-ASCT maintenance ndMM RRMM
Target Enrollment 459 460 614 1,623 782
DesignArm A: MPR+R
Arm B: MPRArm C: MP
Arm A: RevlimidArm B: Placebo
Arm A: RevlimidArm B: Placebo
Arm A: Rd to progression
Arm B: Rd fixed
Arm C: MPT
Arm A: PVdArm B: Vd
Arm C: MPT
Primary Endpoint PFS TTP PFS PFS PFS
Completed; Completed; Completed; Enrollment Status Continuing
follow-upContinuing follow-up
Continuing follow-up
complete; Data in Q1:13(E)
Enrolling
44

Multiple Myeloma Late Stage Programs
Molecule Pomalyst (Pomalidomide)
Pomalyst (Pomalidomide)
Pomalyst (Pomalidomide)
MM-003 MM-009 MM-010Trial Name MM-003NIMBUS
MM-009PEXIUS
MM-010STRATUS
Phase Phase III EAP Phase III
Indication RRMM RRMM RRMM
Target Enrollment 426 507
Design Arm A: PdArm B: HiDex Pd Pd
Primary Endpoint PFS Early access
protocol Adverse Events
Status
Enrollment complete; Data
presented at ASH 2012
Enrolling Enrolling
45
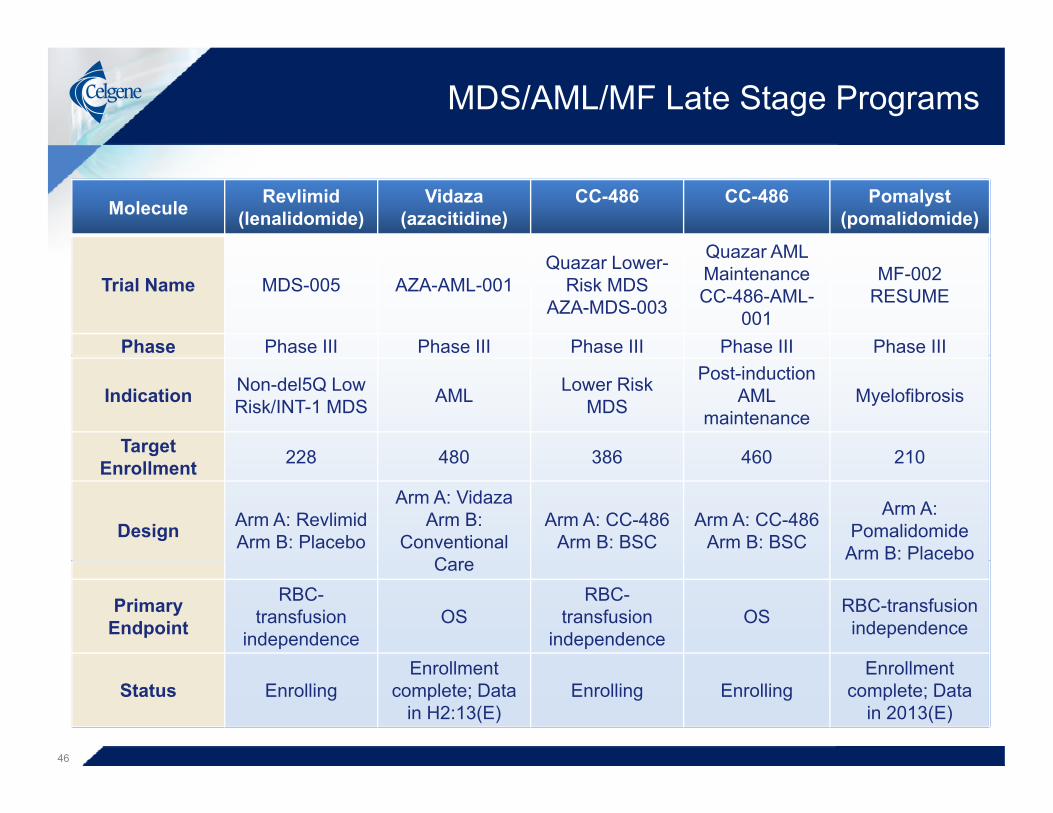
MDS/AML/MF Late Stage Programs
Molecule Revlimid(lenalidomide)
Vidaza(azacitidine)
CC-486 CC-486 Pomalyst(pomalidomide)
Quazar AML
Trial Name MDS-005 AZA-AML-001Quazar Lower-
Risk MDSAZA-MDS-003
Quazar AML Maintenance CC-486-AML-
001
MF-002RESUME
Phase Phase III Phase III Phase III Phase III Phase III
Indication Non-del5Q Low Risk/INT-1 MDS AML Lower Risk
MDS
Post-induction AML
maintenanceMyelofibrosis
Target 228 480 386 460 210Enrollment 228 480 386 460 210
Design Arm A: RevlimidArm B: Placebo
Arm A: VidazaArm B:
Conventional C
Arm A: CC-486Arm B: BSC
Arm A: CC-486Arm B: BSC
Arm A: Pomalidomide
Arm B: PlaceboCare
Primary Endpoint
RBC-transfusion
independenceOS
RBC-transfusion
independenceOS RBC-transfusion
independence
E ll t E ll tStatus Enrolling
Enrollment complete; Data
in H2:13(E)Enrolling Enrolling
Enrollment complete; Data
in 2013(E)
46
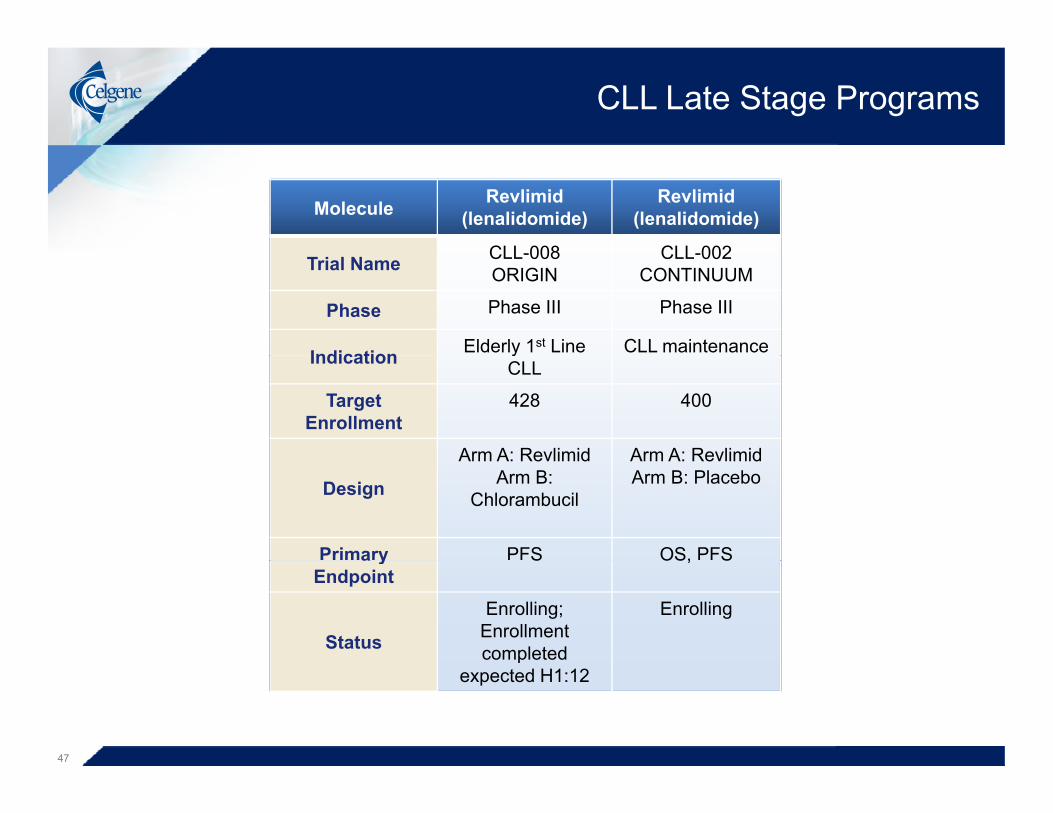
CLL Late Stage Programs
Molecule Revlimid(lenalidomide)
Revlimid(lenalidomide)
CLL 008 CLL 002Trial Name CLL-008ORIGIN
CLL-002CONTINUUM
Phase Phase III Phase III
Indication Elderly 1st Line CLL maintenanceIndication yCLL
Target Enrollment
428 400
Arm A: Revlimid Arm A: Revlimid
Design
Arm A: RevlimidArm B:
Chlorambucil
Arm A: RevlimidArm B: Placebo
Primary PFS OS, PFSa yEndpoint
S OS, S
Status
Enrolling; Enrollment completed
Enrolling
pexpected H1:12
47
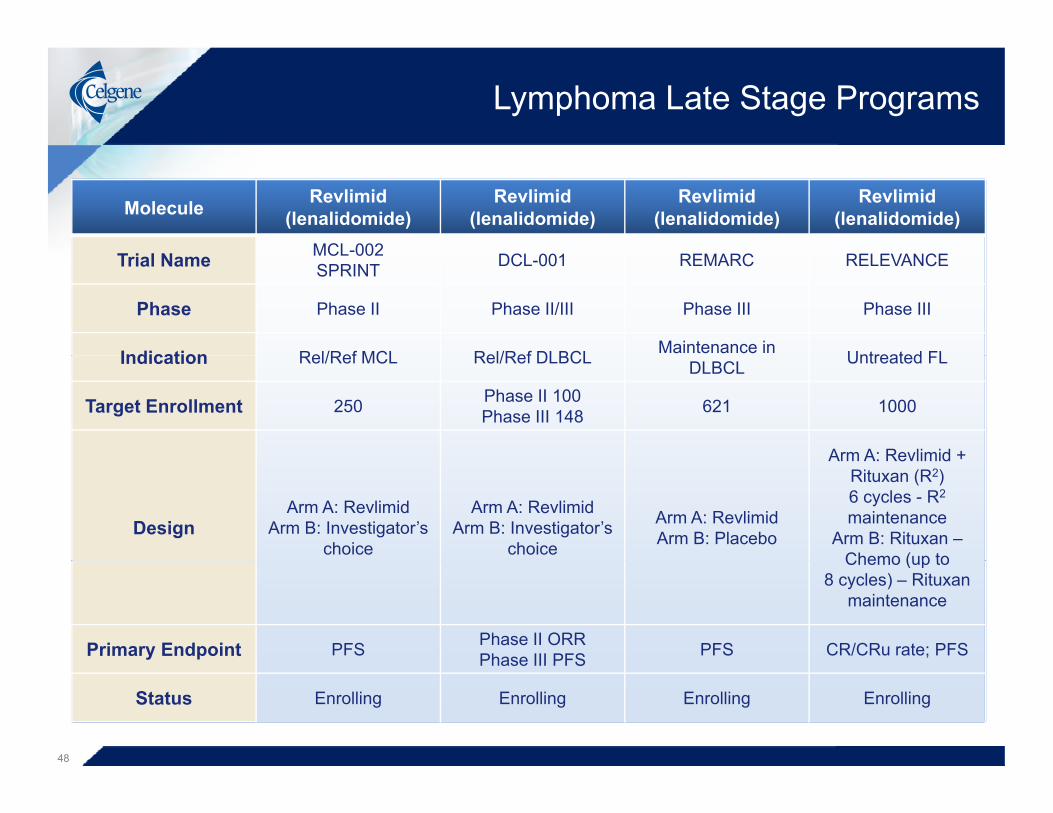
Lymphoma Late Stage Programs
Molecule Revlimid(lenalidomide)
Revlimid(lenalidomide)
Revlimid(lenalidomide)
Revlimid(lenalidomide)
MCL-002Trial Name MCL 002SPRINT DCL-001 REMARC RELEVANCE
Phase Phase II Phase II/III Phase III Phase III
Indication Rel/Ref MCL Rel/Ref DLBCL Maintenance in Untreated FLIndication Rel/Ref MCL Rel/Ref DLBCL DLBCL Untreated FL
Target Enrollment 250 Phase II 100Phase III 148 621 1000
Arm A: Revlimid +
DesignArm A: Revlimid
Arm B: Investigator’s choice
Arm A: RevlimidArm B: Investigator’s
choice
Arm A: RevlimidArm B: Placebo
Arm A: Revlimid + Rituxan (R2) 6 cycles - R2
maintenanceArm B: Rituxan –
Chemo (up toChemo (up to 8 cycles) – Rituxan
maintenance
Primary Endpoint PFS Phase II ORRPhase III PFS PFS CR/CRu rate; PFSPhase III PFS
Status Enrolling Enrolling Enrolling Enrolling
48
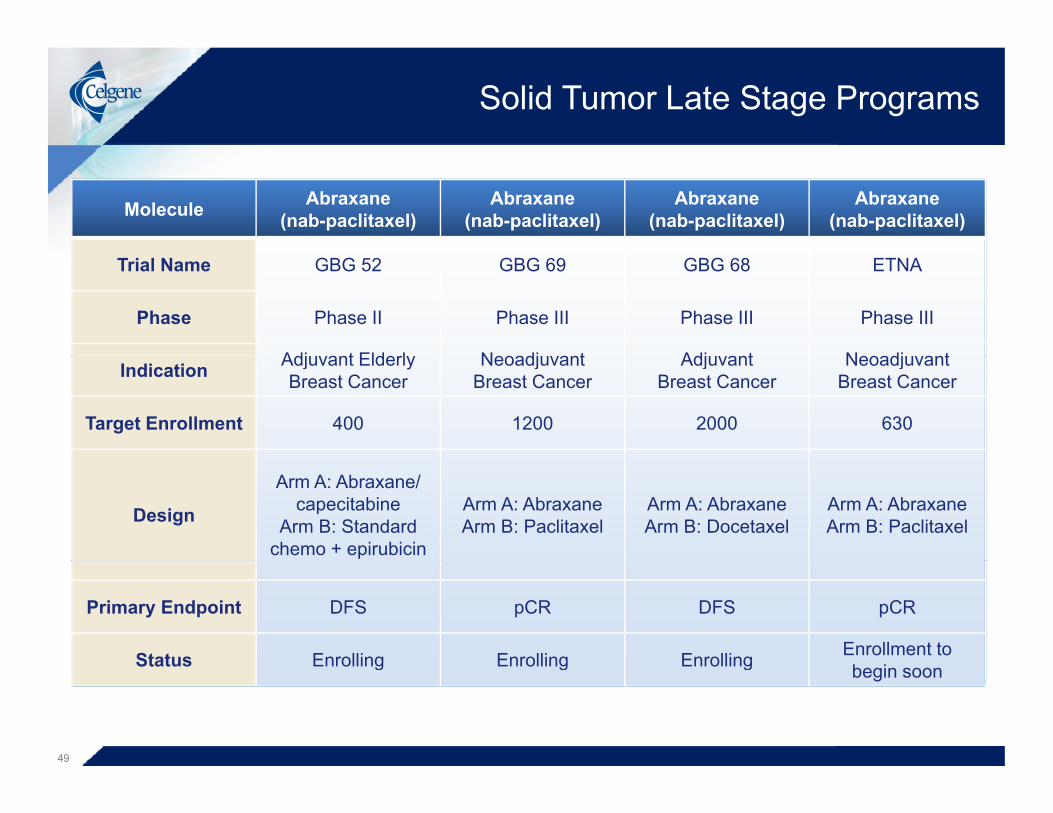
Solid Tumor Late Stage Programs
Molecule Abraxane(nab-paclitaxel)
Abraxane(nab-paclitaxel)
Abraxane(nab-paclitaxel)
Abraxane(nab-paclitaxel)
Trial Name GBG 52 GBG 69 GBG 68 ETNA
Phase Phase II Phase III Phase III Phase III
Adj t Eld l N dj t Adj t N dj tIndication Adjuvant Elderly Breast Cancer
Neoadjuvant Breast Cancer
Adjuvant Breast Cancer
Neoadjuvant Breast Cancer
Target Enrollment 400 1200 2000 630
Design
Arm A: Abraxane/ capecitabine
Arm B: Standard chemo + epirubicin
Arm A: AbraxaneArm B: Paclitaxel
Arm A: AbraxaneArm B: Docetaxel
Arm A: AbraxaneArm B: Paclitaxel
Primary Endpoint DFS pCR DFS pCR
Status Enrolling Enrolling Enrolling Enrollment to Status Enrolling Enrolling Enrolling begin soon
49
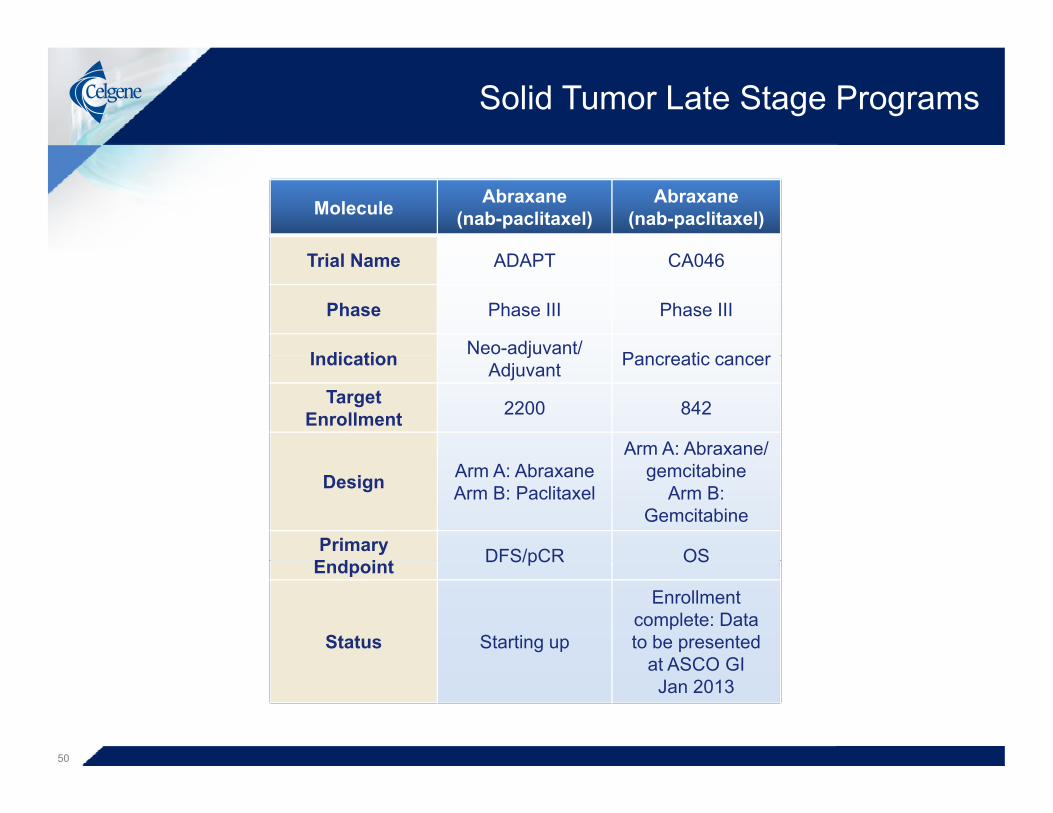
Solid Tumor Late Stage Programs
Molecule Abraxane(nab-paclitaxel)
Abraxane(nab-paclitaxel)
Trial Name ADAPT CA046
Phase Phase III Phase III
Indication Neo-adjuvant/ Pancreatic cancerIndication jAdjuvant Pancreatic cancer
Target Enrollment 2200 842
Arm A: Abraxane/
Design Arm A: AbraxaneArm B: Paclitaxel
gemcitabineArm B:
GemcitabinePrimary
E d i t DFS/pCR OSEndpoint DFS/pCR OS
Status Starting up
Enrollment complete: Data to be presented
at ASCO GIat ASCO GI Jan 2013
50

I&I Late Stage Programs
Molecule Apremilast Apremilast Apremilast Apremilast
PALACE-1 PALACE-2 PALACE-3 ESTEEM-1Trial Name PALACE 1PSA-002
PALACE 2PSA-003
PALACE 3PSA-004
ESTEEM 1PSOR-008
Phase Phase III Phase III Phase III Phase III
I di ti P i ti A th iti P i ti A th iti Psoriatic Arthritis P i iIndication Psoriatic Arthritis Psoriatic Arthritis with skin lesions Psoriasis
Target Enrollment 495 495 495 825
Arm A: Arm A: Arm A:
DesignApremilast 30mg
Arm B: Apremilast 20mgArm C: Placebo
Apremilast 30mgArm B:
Apremilast 20mgArm C: Placebo
Apremilast 30mgArm B:
Apremilast 20mgArm C: Placebo
Arm A: ApremilastArm B: Placebo
Primary Endpoint ACR20 ACR20 ACR20 PASI75
Status
Enrollmentcomplete;
P t d t
Enrollmentcomplete; Top line
Enrollmentcomplete; Top line
Top line data in Jan 2013: Data to b t d iStatus Presented at
ACR 2012
complete; Top line data Sep 2012
complete; Top line data Sep 2012 be presented in
2013
51

I&I Late Stage Programs
Molecule Apremilast Apremilast Apremilast Apremilast
Trial Name ESTEEM-2PSOR-009
PALACE-4PSA-005
POSTUREAS-001 PSOR-010
Phase Phase III Phase III Phase III Phase IIIb
Indication Psoriasis Untreatedpsoriatic arthritis
AnklylosingSpondylitis
Moderate to severe plaque psoriatic arthritis Spondylitis psoriasis
Target Enrollment 413 495 456 240
Arm A: Arm A:Apremilast Arm A:
DesignArm A:
ApremilastArm B: Placebo
Apremilast 30mgArm B:
Apremilast 20mgArm C: Placebo
Apremilast 30mgArm B:
Apremilast 20mgArm C: Placebo
Apremilast 30mgArm B:
Entanercept 50mg
Primary Endpoint PASI75 ACR20 ASAS20 PASI75
Status
Top line data in Jan 2013: Data Enrollment
Complete; Data Enrolling; Data EnrollingStatus to be presented in 2013
Complete; Data expected Q1:13 expected Q1:14 Enrolling
52

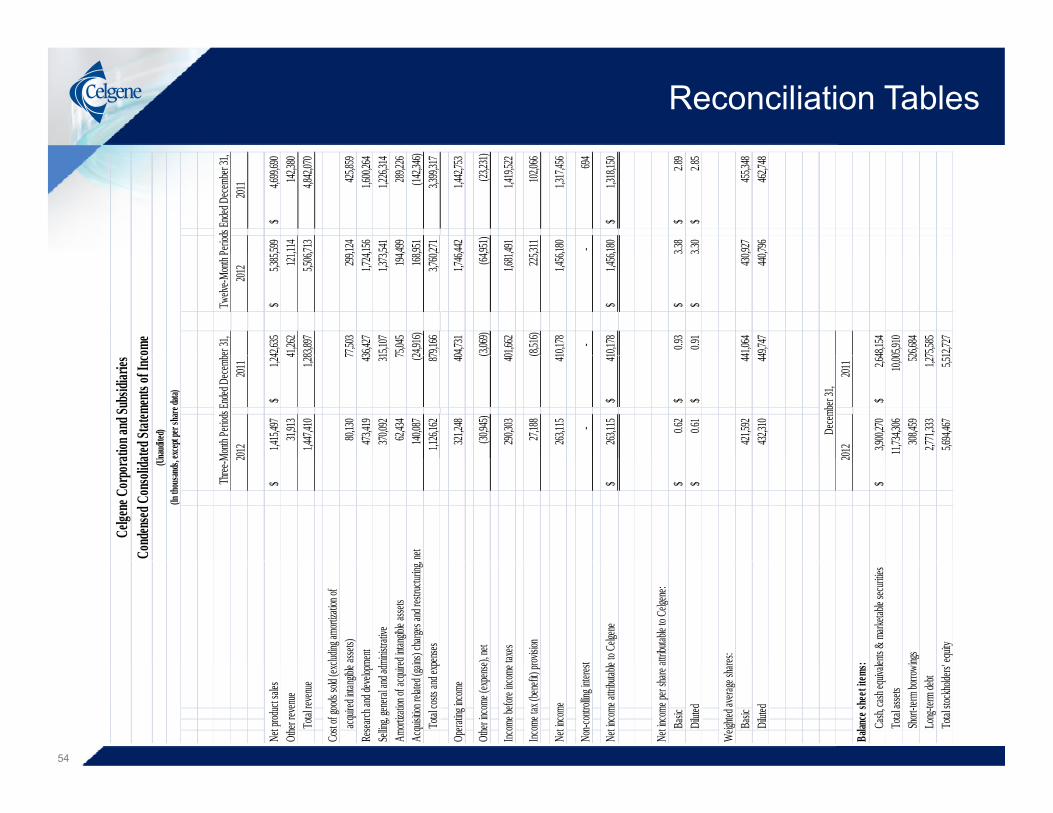
Reconciliation Tables
Reconciliation Tables
2011
,599
4,699,
690$
,11
4142
,380
,71
34,8
42,070
,124
425,85
9
,156
1,600,
264
,54
11,2
26,314
,499
289,22
6
,951
(142,3
46)
,271
3,399,
317
,442
1,442,
753
,951)
(23,23
1)
,491
1,419,
522
,311
102,06
6
,180
1,317,
456
- 694
,180
1,318,
150$
3.38
2.89
$
3.30
2.85
$
,927
455,34
8
,796
462,74
8
Perio
ds En
ded D
ecemb
er 31,
2012
42,635
5,385,
$
41,262
121,
83,
8975,5
06,
77,503
299,
36,
4271,7
24,
15,
1071,3
73,
75,
045194
,
24,916
)168
,
79,166
3,760,
04,731
1,746,
(3,069
)(64
,
01,662
1,681,
(8,516
)225
,
10,178
1,456,
-
10,178
1,456,
$
0.93
3
$
0.91
3
$
41,064
430,
49,
747440
,
48,154
05,910
26,684
75,585
12,727om
e
er 31,
Twelv
e-Mont
h P201
2201
1
1,415,
497
1,24
$
31,913
4
1,447,
410
1,28
80,130
7
473,41
9
43
370
,092
31
62,434
7
140,08
7
(2
1,1
26,162
8 7
321,24
8
4 0
(30,94
5)
(
290,30
3
4 0
27,188
(
263,11
5
4 1
-
263,11
5
41
$
0.62
$
0.6
1
$
421,59
2
44
432
,310
44
2012
2011
3,900,
270
2,64
$
11,734
,306
10,
00
308
,459
5 2
2,771,
333
1,27
5,694,
467
5,51
Decem
ber 31
,
ation
and S
ubsid
iaries
ated S
tatem
ents
of Inc
naud
ited)
except
per s
hare
data)
Month
Perio
ds En
ded D
ecemb
2
$
net
$
$
$
2
$
Celge
ne C
orpo
raCo
nden
sed C
onso
lida (Un
(In th
ousan
ds, e
Three
-M
cludin
g amo
rtizatio
n of
assets
)me
ntmin
istrativ
eed
intangi
ble as
sets
ins) c
harges
and r
estruc
turing
, pen
ses
e), ne
t
taxes
rovisio
n
t e to C
elgene
attrib
utable
to Ce
lgene:
res:
: ents &
mark
etable
secur
ities
ings equ
it y
54
Net p
roduct
sales
Other
reven
ueTo
tal rev
enue
Cost o
f good
s sold
(exc
acquir
ed inta
ngible
Re
search
and d
evelop
mSe
lling, g
eneral
and a
dmAm
ortiza
tion of
acqui
reAc
quisiti
on rel
ated (
gain
Total
costs a
nd exp
Opera
ting inc
ome
Other
incom
e (exp
ense
Incom
e befo
re inc
ome
Incom
e tax
(benef
it) p r
Net in
come
Non-c
ontrol
ling int
eres t
Net in
come a
ttribut
able
Net in
come p
er sha
re a
Basic
Dilute
d
Weigh
ted av
erage
shar
Basic
Dilute
d
Balan
ce sh
eet it
ems :
Cash,
cash
equiva
leTo
tal ass
etsSh
ort-te
rm bo
rrow in
Long-
term
debt
Total
stockh
olders
'
Reconciliation Tables
2011
180
1,318
,150
$
-(26
,688)
-
(1,71
4)
413
9,762
-90
,278
55
3)23
,032
413
104,7
04
-8,7
28
50
911
8,000
50
012
8,479
217
102,7
36
-15
,065
-
9,814
499
289,2
26
374
(147,4
63)
57
75,1
17
-64
4
-
2,036
-(2,
931)
-(69
4)
643)
(293,3
73)
486
1,752
,908
$
.023.8
5$
.91
3.79
$
res t
hat w
e beli
eve
sons
betw
een p
eriod
s and
or
matio
n pre
pare
d in
nd th
at do
not m
eet th
e
eriod
s End
ed D
ecem
ber 3
1,20
12
10,17
81,4
56,1
$
(1,75
2)-
-
-
2,708
12
, 4
-
3,744
(1,
5
24,70
510
2,4
-
-
-
122, 5
62
,497
189,5
26,83
111
6,2
-
-
9,814
-
75,04
519
4,4
24,91
6)16
6,3
-
2, 5
102
-
-
-
-
-
-
-
15,89
8)(19
8,6
73,05
82,1
62,4
$
1.07
5
$
1.05
4
$
ains a
djus
ted fi
nanc
ial m
easu
trend
s tha
t fac
ilitate
comp
aris
ot as
a su
bstitu
te fo
r, the
info
ffect
our b
asic
oper
ation
s an
ent w
ays.
come
er 31
,Tw
elve-M
onth
P20
1220
11
263,1
15
41
$
-
(
-
3,240
-
44
1
26,55
5
2
-
69,15
6
59
,500
6
30,20
7
2
-
-
62,43
4
7
140,0
87
(2
-
-
-
-
-
(82,52
1)
(1 1
572,2
14
4 7
$
1.36
$
1.3
2
$
this
pres
s rele
ase a
lso co
ntaop
erati
ng pe
rform
ance
and t
nside
red i
n add
ition t
o, bu
t no
anag
emen
t doe
s not
belie
ve af
fine t
hese
mea
sure
s in d
iffer
e
ation
and S
ubsid
iaries
AP to
Adj
usted
Net
Inc
exce
pt pe
r sha
re da
ta)
Mon
th Pe
riods
End
ed D
ecem
be2
$
(1)
(2)
(3)
(4)
(2)
(3)
(2)
(5)
(6)
(3)
(2)
(7)
(8)
uctur
ing, n
et:era
tion
(9)
(9)
(10)
(2)
(11
)
(2)
(12)
$
sted:
$
$
acco
rdan
ce w
ith U
.S. G
AAP,
ental
info
rmati
on re
lating
to o
usted
mea
sure
s sho
uld be
con
de ce
rtain
GAAP
items
that
mams
. Othe
r com
panie
s may
def
Celge
ne C
orpo
raRe
conc
iliatio
n of G
AA(In
thou
sand
s,
Three
-M
ble to
Celg
ene -
GAA
P
ments
:s: od
ucts
exite
d or t
o be e
xited
n-core
othe
r rev
enue
s
sold
(exclu
ding a
mortiz
ation
ntang
ible a
ssets)
:ed
comp
ensa
tion e
xpen
seve
ntory
step-u
pxit
ed or
to be
exite
d
deve
lopme
nt:ed
comp
ensa
tion e
xpen
sen-c
ore ac
tivitie
smp
airme
ntslla
borat
ion pa
ymen
ts
al an
d adm
inistr
ative
:ed
comp
ensa
tion e
xpen
sen-c
ore ac
tivitie
spri
cing s
ettlem
ent
of ac
quire
d inta
ngibl
e asse
ts
lated
(gain
s) ch
arges
and r
estru
fair v
alue o
f con
tinge
nt co
nside
n and
restr
uctur
ing co
sts
(expe
nse),
net
Inc. e
quity
meth
od lo
ssn-c
ore ac
tivitie
sve
stmen
t of n
on-co
re ac
tivitie
s
g inte
rest -
Abrax
is
x adju
stmen
ts
ble to
Celg
ene -
Adju
sted
e attr
ibutab
le to
Celge
ne -A
djus
cial in
form
ation
prep
ared
in a
nd m
anag
emen
t with
supp
leme
ected
info
rmati
on. T
hese
adju
S. GA
AP. W
e typ
ically
exclu
dun
usua
l or n
on-re
curri
ng ite
m
55
Net in
come
attrib
utab
Befor
e tax
adjus
tmTo
tal re
venu
esSa
les of
pro
Abrax
is no
n
Cost
of go
ods
of a
cquir
ed i n
Share
-base
Abrax
is inv
Prod
ucts
ex
Rese
arch a
nd
Share
-bas e
Abrax
is no
nIP
R&D
imUp
front
col
Sellin
g, ge
nera
Share
-base
Abrax
is no
nCa
nadia
n p
Amort
izatio
n o
Acqu
isition
rel
Chan
ge in
fAc
quisit
ion
Othe
r inco
me
Entre
Med
, Ab
raxis
non
Gain
on di
v
Non-c
ontro
lling
Net in
come
tax
Net in
come
attrib
utab
Net in
come
per s
hare
Basic
Dilut
ed
In ad
dition
to fi
nan c
prov
ide in
vesto
rs an
with
resp
ect to
proj
eac
cord
ance
with
U.S
GAAP
defin
ition o
f u
Reconciliation Tables
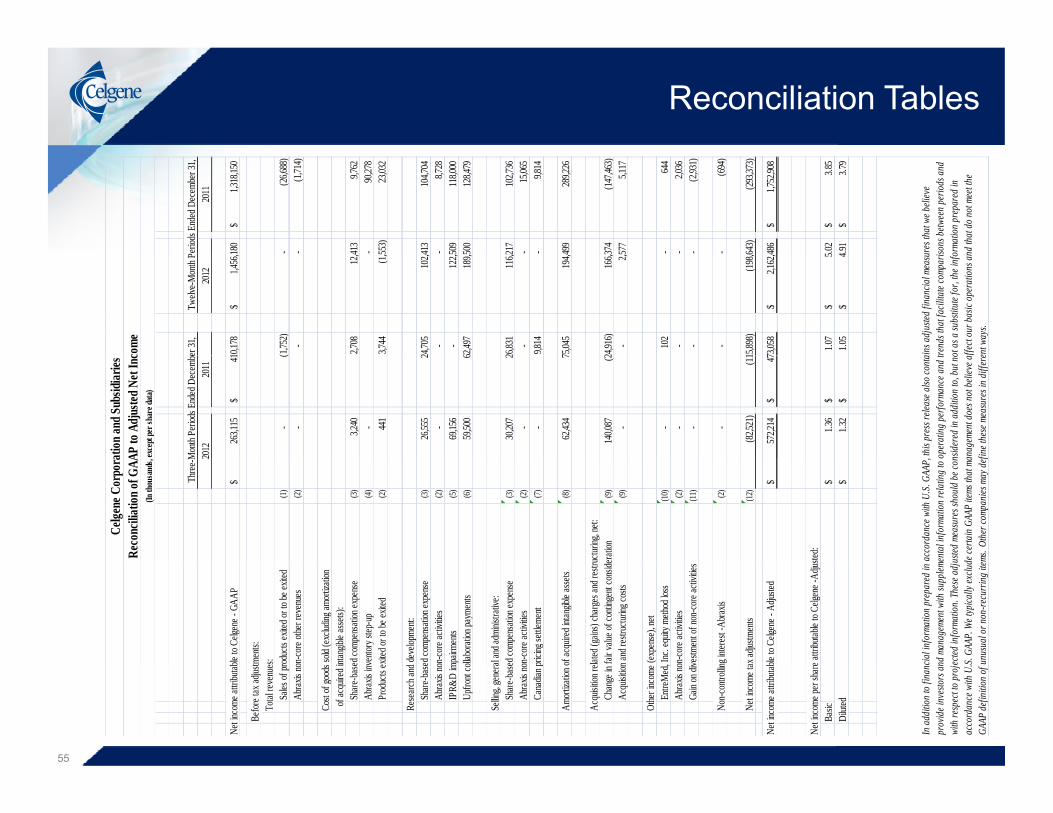
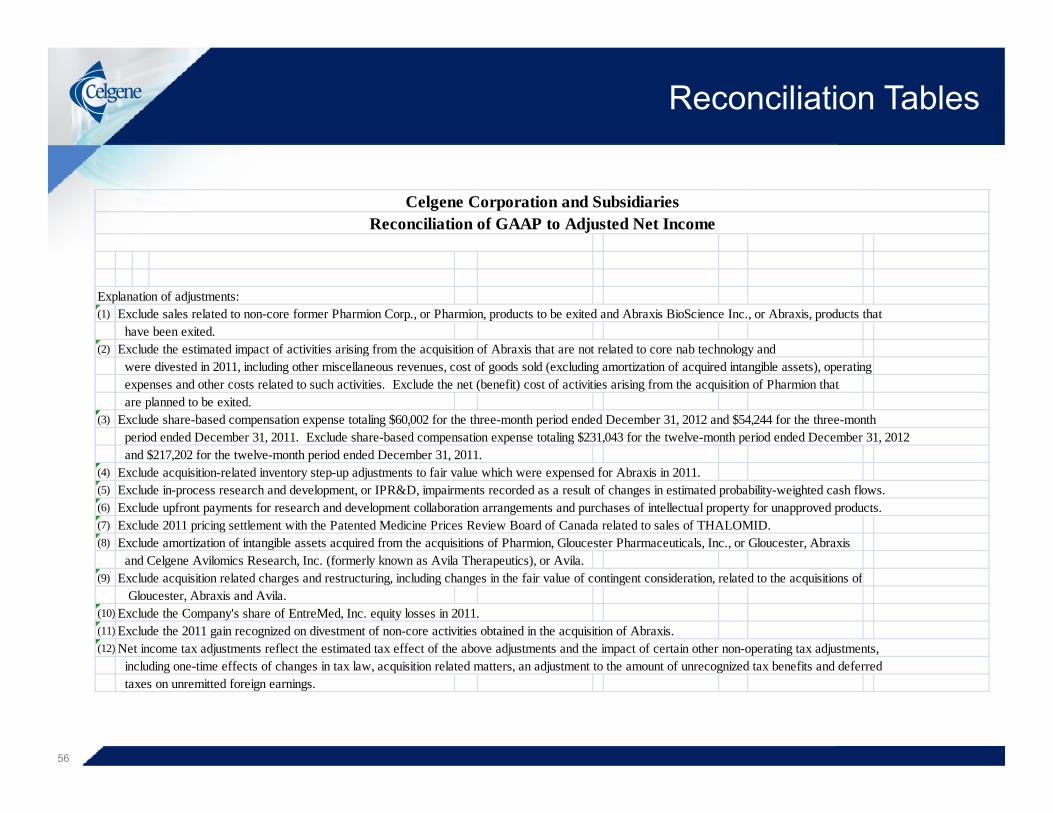
Celgene Corporation and SubsidiariesReconciliation of GAAP to Adjusted Net Income
Explanation of adjustments:(1) Exclude sales related to non-core former Pharmion Corp., or Pharmion, products to be exited and Abraxis BioScience Inc., or Abraxis, products that
have been exited.(2) Exclude the estimated impact of activities arising from the acquisition of Abraxis that are not related to core nab technology andp g q gy
were divested in 2011, including other miscellaneous revenues, cost of goods sold (excluding amortization of acquired intangible assets), operating expenses and other costs related to such activities. Exclude the net (benefit) cost of activities arising from the acquisition of Pharmion that are planned to be exited.
(3) Exclude share-based compensation expense totaling $60,002 for the three-month period ended December 31, 2012 and $54,244 for the three-month period ended December 31, 2011. Exclude share-based compensation expense totaling $231,043 for the twelve-month period ended December 31, 2012
and $217,202 for the twelve-month period ended December 31, 2011. and $217,202 for the twelve month period ended December 31, 2011. (4) Exclude acquisition-related inventory step-up adjustments to fair value which were expensed for Abraxis in 2011.(5) Exclude in-process research and development, or IPR&D, impairments recorded as a result of changes in estimated probability-weighted cash flows.(6) Exclude upfront payments for research and development collaboration arrangements and purchases of intellectual property for unapproved products.(7) Exclude 2011 pricing settlement with the Patented Medicine Prices Review Board of Canada related to sales of THALOMID.(8) Exclude amortization of intangible assets acquired from the acquisitions of Pharmion, Gloucester Pharmaceuticals, Inc., or Gloucester, Abraxis
and Celgene Avilomics Research Inc (formerly known as Avila Therapeutics) or Avila and Celgene Avilomics Research, Inc. (formerly known as Avila Therapeutics), or Avila.(9) Exclude acquisition related charges and restructuring, including changes in the fair value of contingent consideration, related to the acquisitions of
Gloucester, Abraxis and Avila.(10) Exclude the Company's share of EntreMed, Inc. equity losses in 2011. (11) Exclude the 2011 gain recognized on divestment of non-core activities obtained in the acquisition of Abraxis.(12) Net income tax adjustments reflect the estimated tax effect of the above adjustments and the impact of certain other non-operating tax adjustments,
i l di ti ff t f h i t l i iti l t d tt dj t t t th t f i d t b fit d d f d
56
including one-time effects of changes in tax law, acquisition related matters, an adjustment to the amount of unrecognized tax benefits and deferred taxes on unremitted foreign earnings.

Reconciliation Tables
(In thousands, except per share data)
Celgene Corporation and SubsidiariesReconciliation of Full-Year 2013 Projected GAAP to Adjusted Net Income
Low High
Projected net income - GAAP (1) 2,006,000$ 2,058,000$
Before tax adjustments:
Range
Before tax adjustments: Cost of goods sold (excluding amortization of acquired intangible assets): Share-based compensation expense 14,000 14,000
Research and development: Share-based compensation expense 119,000 114,000
Selling general and administrative: Selling, general and administrative: Share-based compensation expense 135,000 130,000
Amortization of acquired intangible assets 265,000 263,000
Acquisition related (gains) charges and restructuring, net: Change in fair value of contingent consideration 11,000 11,000
Net income tax adjustments (185 000) (182 000)Net income tax adjustments (185,000) (182,000)
Projected net income - Adjusted 2,365,000$ 2,408,000$
Projected net income per diluted common share - GAAP 4.67$ 4.79$
Projected net income per diluted common share - Adjusted 5.50$ 5.60$
57
Projected weighted average diluted shares 430,000 430,000
(1) Our projected earnings do not include the effect of any 2013 business combinations, collaboration agreements, asset acquisitions, intangible asset impairments, or changes in the fair value of our CVRs issued as part of the acquisition of Abraxis.
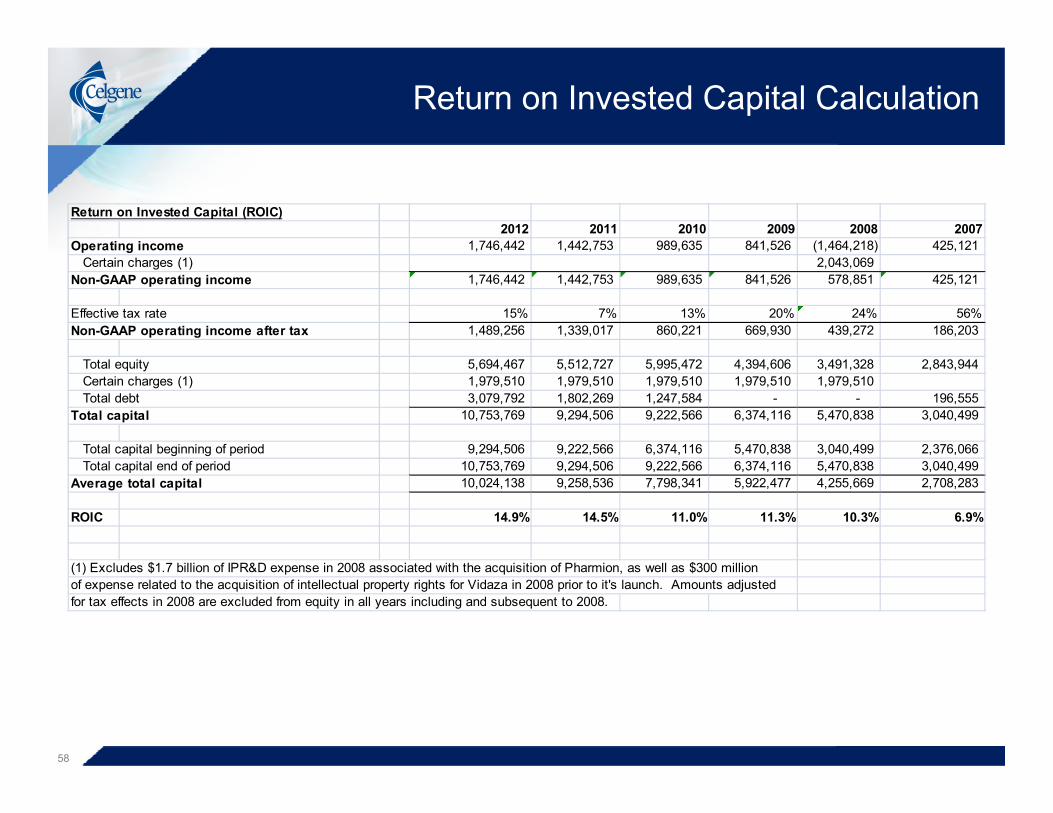
Return on Invested Capital Calculation
Return on Invested Capital (ROIC)2012 2011 2010 2009 2008 2007
Operating income 1,746,442 1,442,753 989,635 841,526 (1,464,218) 425,121 Certain charges (1) 2,043,069
Non-GAAP operating income 1,746,442 1,442,753 989,635 841,526 578,851 425,121
Effective tax rate 15% 7% 13% 20% 24% 56%Non-GAAP operating income after tax 1,489,256 1,339,017 860,221 669,930 439,272 186,203
Total equity 5,694,467 5,512,727 5,995,472 4,394,606 3,491,328 2,843,944 Certain charges (1) 1,979,510 1,979,510 1,979,510 1,979,510 1,979,510 Total debt 3,079,792 1,802,269 1,247,584 - - 196,555
Total capital 10,753,769 9,294,506 9,222,566 6,374,116 5,470,838 3,040,499
Total capital beginning of period 9,294,506 9,222,566 6,374,116 5,470,838 3,040,499 2,376,066 Total capital end of period 10,753,769 9,294,506 9,222,566 6,374,116 5,470,838 3,040,499
Average total capital 10,024,138 9,258,536 7,798,341 5,922,477 4,255,669 2,708,283
ROIC 14.9% 14.5% 11.0% 11.3% 10.3% 6.9%
(1) Excludes $1.7 billion of IPR&D expense in 2008 associated with the acquisition of Pharmion, as well as $300 millionof expense related to the acquisition of intellectual property rights for Vidaza in 2008 prior to it's launch. Amounts adjustedfor tax effects in 2008 are excluded from equity in all years including and subsequent to 2008.
58