Q4 & Full Year 2019
48
January 30, 2020 Financial Results and Business Update Q4 & Full Year 2019
Transcript of Q4 & Full Year 2019

January 30, 2020
Financial Results and Business Update
Q4 & Full Year 2019

2
Forward-looking statementsThis presentation contains forward-looking statements, including statements made pursuant to the safe harbor provisions of the Private Securities Litigation Reform Act of 1995, relating to: our
strategy and plans; potential of our commercial business and pipeline programs; capital allocation and investment strategy; clinical development programs, clinical trials, and data readouts and
presentations; regulatory filings and the timing thereof; the potential benefits, safety, and efficacy of our products and investigational therapies; anticipated benefits and potential of investments,
collaborations, and business development activities; our future financial and operating results; our 2020 financial guidance; the potential benefits and results that may be achieved through the
proposed transaction with Pfizer Inc. (Pfizer); and the anticipated completion and timing of the proposed transaction with Pfizer. These forward-looking statements may be accompanied by such
words as “aim,” “anticipate,” “believe,” “could,” “estimate,” “expect,” “forecast,” “goal,” “intend,” “may,” “plan,” “potential,” “possible,” “will,” “would,” and other words and terms of similar meaning.
Drug development and commercialization involve a high degree of risk, and only a small number of research and development programs result in commercialization of a product. Results in early
stage clinical trials may not be indicative of full results or results from later stage or larger scale clinical trials and do not ensure regulatory approval. You should not place undue reliance on these
statements or the scientific data presented.
These statements involve risks and uncertainties that could cause actual results to differ materially from those reflected in such statements, including: our dependence on sales from our
products; difficulties in obtaining and maintaining adequate coverage, pricing, and reimbursement for our products; failure to protect and enforce our data, intellectual property, and other
proprietary rights and the risks and uncertainties relating to intellectual property claims and challenges; uncertainty of long-term success in developing, licensing, or acquiring other product
candidates or additional indications for existing products; failure to compete effectively due to significant product competition in the markets for our products; failure to successfully execute or
realize the anticipated benefits of our strategic and growth initiatives; the risk that positive results in a clinical trial may not be replicated in subsequent or confirmatory trials or success in early
stage clinical trials may not be predictive of results in later stage or large scale clinical trials or trials in other potential indications; risks associated with clinical trials, including our ability to
adequately manage clinical activities, unexpected concerns that may arise from additional data or analysis obtained during clinical trials, regulatory authorities may require additional information
or further studies, or may fail to approve or may delay approval of our drug candidates; the occurrence of adverse safety events, restrictions on use with our products, or product liability claims;
risks relating to technology failures or breaches; our dependence on collaborators, joint venture partners, and other third parties for the development, regulatory approval, and commercialization
of products and other aspects of our business, which are outside of our full control; risks associated with current and potential future healthcare reforms; risks relating to management and key
personnel changes, including attracting and retaining key personnel; failure to comply with legal and regulatory requirements; the risks of doing business internationally, including currency
exchange rate fluctuations; risks relating to investment in our manufacturing capacity; problems with our manufacturing processes; risks related to commercialization of biosimilars; fluctuations in
our operating results; fluctuations in our effective tax rate; risks related to investment in properties; the market, interest, and credit risks associated with our portfolio of marketable securities; risks
relating to share repurchase programs; risks relating to access to capital and credit markets; risks related to indebtedness; environmental risks; risks relating to the distribution and sale by third
parties of counterfeit or unfit versions of our products; risks relating to the use of social media for our business; change in control provisions in certain of our collaboration agreements; risks that
the proposed transaction with Pfizer will be completed in a timely manner or at all; the possibility that certain closing conditions to the proposed transaction with Pfizer will not be satisfied;
uncertainty as to whether the anticipated benefits of the proposed transaction with Pfizer can be achieved; and the other risks and uncertainties that are described in the Risk Factors section of
our most recent annual or quarterly report and in other reports we have filed with the U.S. Securities and Exchange Commission (SEC).
These statements are based on our current beliefs and expectations and speak only as of the date of this presentation. We do not undertake any obligation to publicly update any forward-
looking statements.
Note regarding trademarks: AVONEX®, PLEGRIDY®, RITUXAN®, SPINRAZA®, TECFIDERA®, TYSABRI®, and VUMERITY® are registered trademarks of Biogen. BENEPALI™, FLIXABI™,
FUMADERM™, and IMRALDI™ are trademarks of Biogen. The following are trademarks of the respective companies listed: FAMPYRA™ – Acorda Therapeutics, Inc.; GAZYVA® and
OCREVUS® – Genentech, Inc. Other trademarks referenced in this presentation are the property of their respective owners.

3
Q4 & FY 2019 earnings call agenda
IntroductionJoe MaraVP, Investor Relations
Overview Michel VounatsosChief Executive Officer
R&D Update Al Sandrock, M.D., Ph.D.EVP, Research & Development
Financial UpdateJeff CapelloEVP, Chief Financial Officer
Closing RemarksMichel VounatsosChief Executive Officer

4
Michel Vounatsos
Chief Executive Officer
Overview
4

5
Strong performance in 2019
TOTAL
$13,453 $14,378
2018 2019
+7% +5%
PRODUCT NON-GAAPGAAP
+28%+46%
$10,887$11,380
2018 2019
$21.58
$31.42
2018 2019
$26.20
$33.57
2018 2019
A reconciliation of our GAAP to Non-GAAP financial results is at the end of this presentation.
Revenues ($M) Diluted EPS ($)

6
Strong progress implementing strategy
Full year MS revenues, including OCREVUS, increased 2% to $9.2 billion
Global MS patients increased 3% versus 2018
Launched VUMERITY* in the U.S.; important new oral treatment option
Full year SPINRAZA revenues increased 22% to $2.1 billion
2019 SPINRAZA performance driven by growth in both U.S. and ex-U.S.
Over 10,000 patients on therapy globally as of December 31, 2019#
Full year biosimilars revenues increased 35% to $738 million
New transaction with Samsung Bioepis provides commercialization rights to two potential ophthalmology biosimilars and to anti-TNFs in China
Maximizing the resilience
of our MS core business
Accelerating our neuromuscular
franchise
Unlocking the potential of
biosimilars
*VUMERITY was developed in collaboration with Alkermes.#Includes patients on therapy across the post-marketing setting, the expanded access program, and clinical trials.

7
Strong progress implementing strategy
Positive Phase 2 data for BIIB059 (anti-BDCA2) in lupus
Seven new clinical programs in MS, ALS, Parkinson’s disease, ophthalmology, and brain contusion
Multiple opportunities for near-term value-creation
Generated ~ $7.1 billion in cash flow from operations in 2019
Repurchased ~ 24 million shares for a total value of ~ $5.9 billion in 2019
Executed four business development transactions over past three months
Developing and expanding
our neuroscience portfolio and
pursuing therapeutic adjacencies
Leading in Alzheimer’s disease
Continuous improvement and
diligent capital allocation
Sufficient exposure to high dose aducanumab reduced clinical decline
Actively engaging with the FDA as well as regulators in Europe and Japan
Working to complete a regulatory filing in the U.S. as soon as possible

8
Al Sandrock, M.D., Ph.D.
EVP, Research & Development
R&D Update
8
9
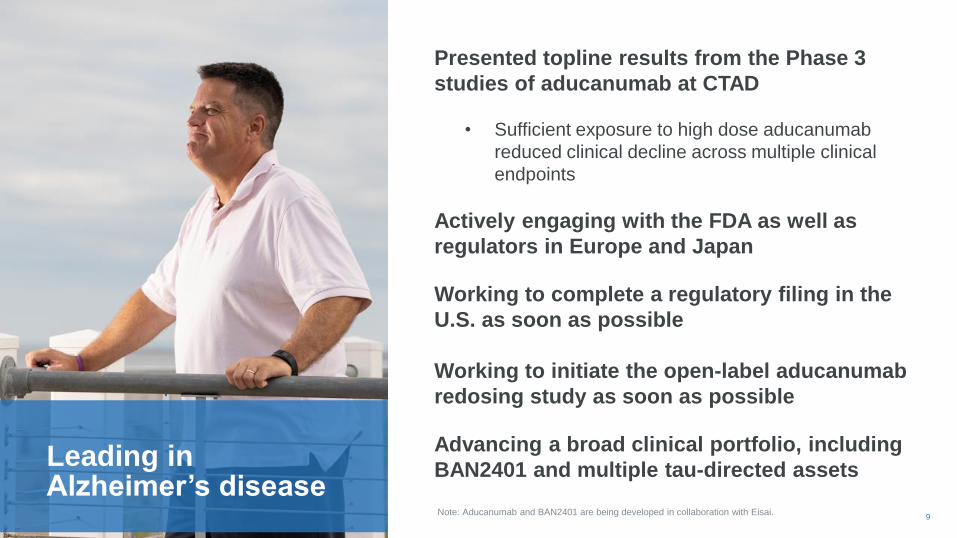
Leading in Alzheimer’s disease
Presented topline results from the Phase 3
studies of aducanumab at CTAD
• Sufficient exposure to high dose aducanumab
reduced clinical decline across multiple clinical
endpoints
Actively engaging with the FDA as well as
regulators in Europe and Japan
Working to complete a regulatory filing in the
U.S. as soon as possible
Working to initiate the open-label aducanumab
redosing study as soon as possible
Advancing a broad clinical portfolio, including
BAN2401 and multiple tau-directed assets
Note: Aducanumab and BAN2401 are being developed in collaboration with Eisai.

10
Continued to expand our market-leading MS portfolio
VUMERITY is approved by the FDA
Presented positive results from EVOLVE-MS-2, a Phase 3 study of VUMERITY, at the Annual Meeting of the European Charcot Foundation
• VUMERITY was statistically superior to TECFIDERA on the pre-specified primary endpoint, the Individual Gastrointestinal Symptom and Impact Scale (IGISIS) (p=0.0003)
• Proportion of patients who discontinued due to gastrointestinal (GI) adverse events: 0.8% for VUMERITY and 4.8% for TECFIDERA
Note: VUMERITY was developed in collaboration with Alkermes.

11
• Large market opportunity (~ 800,000 individuals
in G7) with limited treatment options
• Cutaneous lupus erythematosus (CLE): skin disorder
• Systemic lupus erythematosus (SLE): systemic
disease with joint involvement
• BIIB059: monoclonal antibody designed to
reduce production of inflammatory cytokines
(e.g., type-I interferon)
• Phase 2 LILAC study met its primary endpoints
for both CLE and SLE:
• CLE: Dose response of BIIB059 on percent change
from baseline in CLASI-A* score at week 16 (p<0.001)
• SLE: Reduction in change from baseline in total active
joint count at week 24 (p=0.037)
• Planning to advance BIIB059 to Phase 3
Positive phase 2 results for BIIB059 in lupus
BIIB059 (anti-BDCA2)
*CLASI-A = Cutaneous Lupus Erythematosus Disease Area and Severity Index Activity
Skin lesions in CLE
(Uva et al., 2012)

12
Biogen, Ionis Pharmaceuticals, and
collaborators awarded Healy Center
International Prize for Innovation in ALS
Presented final data from Phase 1/2
study of tofersen (BIIB067) in SOD1 ALS
at International Symposium on
ALS/Motor Neuron Disease
• Tofersen treatment was associated with
reduced CSF SOD1 levels, trends toward
slowing of clinical decline, and reduced
neurofilament levelsBuilding depth in neuromuscular disorders

13
Completed enrollment of Phase 3
STAR study of BIIB111 (timrepigene
emparvovec) in choroideremia
• BIIB111 aims to address underlying
cause of choroideremia by expressing
AAV2-packaged REP1 transgene
Data expected towards end of 2020
Data from Phase 2/3 study of BIIB112
(RPGR gene therapy) in XLRP
expected in mid-2021Progress in ophthalmology
XLRP = X-linked retinitis pigmentosa

14
Progress in movement disorders
Progress in stroke
*Option agreement
Continue to advance Phase 3 study of
BIIB093 (glibenclamide IV) for large
hemispheric infarction
• Data expected by end of 2021
Phase 2 study progressing for TMS-007*
in acute ischemic stroke
• Data expected by end of 2020

15
Updates in movement disorders and neurocognitive disorders
Expect data from Phase 2 study of
BIIB054 (cinpanemab), an anti-α-
synuclein antibody for Parkinson’s
disease, in 2H 2020
Reported topline results from Phase 2
study of BIIB092 (gosuranemab) in PSP
Continuing Phase 2 study of
gosuranemab in early Alzheimer’s
disease
Continue to advance Phase 2b study of
BIIB104 (AMPA) for cognitive impairment
associated with schizophrenia
• Data expected in 2H 2021

16
Agreement with Catalyst Biosciences to
develop and commercialize CB 2782-PEG
for potential treatment of geographic
atrophy (GA)
• GA has no approved therapies and affects
~ 1 million individuals in the U.S. alone
• CB 2782-PEG: novel protease that
selectively cleaves complement component
3 (C3), a genetically validated target in AMD
• Complements our portfolio in ophthalmology
Initiated collaboration with CAMP4 to
potentially identify druggable targets in
microglial signaling pathways known to
play causal role in diseases
Continued progress in business development
AMD = age-related macular degeneration

17
Agreement to acquire PF-05251749, a
novel CNS-penetrant small molecule
inhibitor of casein kinase 1 (CK1), from
Pfizer
• CK1 regulates circadian rhythms, which
can become dysregulated and contribute to
irregular sleep wake rhythm disorder in
Parkinson’s disease and sundowning in
Alzheimer’s disease
• Phase 1a study of PF-05251749
demonstrated an acceptable safety profile
and proof of mechanism
• Expect to initiate a Phase 1b study of PF-
05251749 by the end of 2020Continued progress in business development
This transaction is subject to customary closing conditions, including the expiration of the applicable waiting period under the Hart-Scott-Rodino Antitrust Improvements Act of 1976 in the U.S.
18
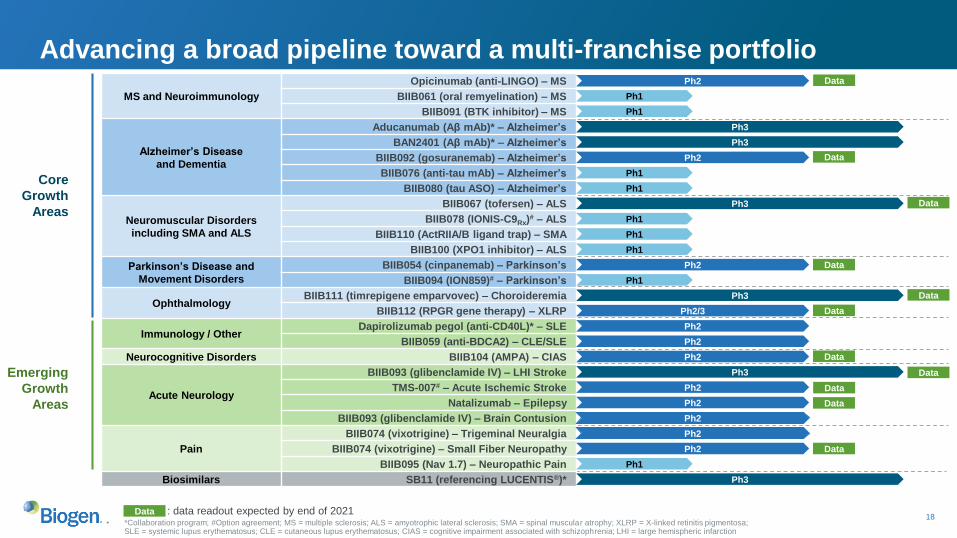
Core
Growth
Areas
Emerging
Growth
Areas
MS and Neuroimmunology
Opicinumab (anti-LINGO) – MS
BIIB061 (oral remyelination) – MS
BIIB091 (BTK inhibitor) – MS
Alzheimer’s Disease
and Dementia
Aducanumab (Aβ mAb)* – Alzheimer’s
BAN2401 (Aβ mAb)* – Alzheimer’s
BIIB092 (gosuranemab) – Alzheimer’s
BIIB076 (anti-tau mAb) – Alzheimer’s
BIIB080 (tau ASO) – Alzheimer’s
Neuromuscular Disorders
including SMA and ALS
BIIB067 (tofersen) – ALS
BIIB078 (IONIS-C9Rx)# – ALS
BIIB110 (ActRIIA/B ligand trap) – SMA
BIIB100 (XPO1 inhibitor) – ALS
Parkinson’s Disease and
Movement Disorders
BIIB054 (cinpanemab) – Parkinson’s
BIIB094 (ION859)# – Parkinson’s
OphthalmologyBIIB111 (timrepigene emparvovec) – Choroideremia
BIIB112 (RPGR gene therapy) – XLRP
Immunology / OtherDapirolizumab pegol (anti-CD40L)* – SLE
BIIB059 (anti-BDCA2) – CLE/SLE
Neurocognitive Disorders BIIB104 (AMPA) – CIAS
Acute Neurology
BIIB093 (glibenclamide IV) – LHI Stroke
TMS-007# – Acute Ischemic Stroke
Natalizumab – Epilepsy
BIIB093 (glibenclamide IV) – Brain Contusion
Pain
BIIB074 (vixotrigine) – Trigeminal Neuralgia
BIIB074 (vixotrigine) – Small Fiber Neuropathy
BIIB095 (Nav 1.7) – Neuropathic Pain
Biosimilars SB11 (referencing LUCENTIS®)*
: data readout expected by end of 2021Data• *Collaboration program; #Option agreement; MS = multiple sclerosis; ALS = amyotrophic lateral sclerosis; SMA = spinal muscular atrophy; XLRP = X-linked retinitis pigmentosa;
SLE = systemic lupus erythematosus; CLE = cutaneous lupus erythematosus; CIAS = cognitive impairment associated with schizophrenia; LHI = large hemispheric infarction
Ph2
Ph1
Data
Ph1
Ph1
Ph1
Ph3
Ph1
Ph2
Ph3
Ph2
Ph1
Ph1
Ph3
Ph2/3
Ph2
Ph2
Ph2
Ph3
Ph2
Ph2
Data
Data
Ph2
Ph2
Ph1
Data
Advancing a broad pipeline toward a multi-franchise portfolio
Ph3
Ph1
Ph2
Ph3
Data
Data
Data
Data
Data
Data
Data

19
Jeff Capello
EVP, Chief Financial Officer
FinancialUpdate
19

20
Strong performance in 2019
TOTAL
$13,453 $14,378
2018 2019
+7% +5%
PRODUCT NON-GAAPGAAP
+28%+46%
$10,887$11,380
2018 2019
$21.58
$31.42
2018 2019
$26.20
$33.57
2018 2019
A reconciliation of our GAAP to Non-GAAP financial results is at the end of this presentation.
Revenues ($M) Diluted EPS ($)

21
• Revenues vs. FY 2018
MS Revenues ($M)
• Revenues vs. Q4 2018 and Q3 2019
• Increase in channel inventory in the U.S. of
~ $135 million in Q4 2019 compared to increase
of ~ $105 million in Q4 2018 and decrease of
~ $30 million in Q3 2019
Global multiple sclerosis performance
∆Y/Y ∆Q/Q
Total + 2% and + 2%
U.S. Product - 2% and + 3%
ROW Product + 3% and - 3%
OCREVUS
Royalties+ 35% and + 9%
$2,346
$2,095
$2,387 $2,348 $2,388
Q4-18 Q1-19 Q2-19 Q3-19 Q4-19
FAMPYRA
OCREVUSRoyalties
TYSABRI
Interferon
Fumarate
Q4 2019 Highlights
Numbers may not foot due to rounding.
FY 2019 Highlights
∆Y/Y
Total + 2%
U.S. Product - 3%
ROW Product + 4%
OCREVUS
Royalties+ 44%

22
Q4 2019 HighlightsFumarate Revenues ($M)
• Revenues vs. Q4 2018 and Q3 2019
• Increase in channel inventory in the U.S.
of ~ $105 million in Q4 2019 compared to
increase of ~ $60 million in Q4 2018 and
decrease of ~ $15 million in Q3 2019
Global fumarate performance
∆Y/Y ∆Q/Q
WW + 5% and + 4%
U.S. + 3% and + 5%
ROW + 12% and + 1%
Numbers may not foot due to rounding.
$856$718
$870 $842 $877
$5
$254
$281
$280 $280$284
$1,110
$999
$1,150 $1,122$1,167
Q4-18 Q1-19 Q2-19 Q3-19 Q4-19
TECFIDERAROW
VUMERITYU.S.
TECFIDERAU.S.
FY 2019 Highlights
• Revenues vs. FY 2018
∆Y/Y
WW + 4%
U.S. + 2%
ROW + 10%
23
Interferon Revenues ($M)
• Revenues vs. Q4 2018 and Q3 2019
• Increase in channel inventory in the U.S.
of ~ $30 million in Q4 2019 compared to
increase of ~ $35 million in Q4 2018 and
decrease of ~ $5 million in Q3 2019
Global interferon performance
∆Y/Y ∆Q/Q
WW - 14% and - 3%
U.S. - 17% and - 0%
ROW - 5% and - 7%
$363
$278$318 $303 $303
$68
$49
$62$58 $56
$118
$119
$120$117 $108
$48
$55
$55$52 $49
$597
$501
$554$530 $516
Q4-18 Q1-19 Q2-19 Q3-19 Q4-19
PLEGRIDYROW
AVONEXROW
PLEGRIDYU.S.
AVONEXU.S.
Q4 2019 Highlights
Numbers may not foot due to rounding.
FY 2019 Highlights
• Revenues vs. FY 2018
∆Y/Y
WW - 11%
U.S. - 14%
ROW - 3%
24
Q4 2019 HighlightsTYSABRI Revenues ($M)
• Revenues vs. Q4 2018 and Q3 2019
• Relatively stable channel inventory in the
U.S. in Q4 2019 compared to increase of
~ $10 million in Q4 2018 and decrease of
~ $10 million in Q3 2019
Global TYSABRI performance
∆Y/Y ∆Q/Q
WW + 2% and - 2%
U.S. + 5% and + 3%
ROW - 2% and - 8%
$257 $245 $264 $263 $270
$208 $215$211 $221 $203
$464 $460$475 $484 $473
Q4-18 Q1-19 Q2-19 Q3-19 Q4-19
ROW
U.S.
Numbers may not foot due to rounding.
FY 2019 Highlights
• Revenues vs. FY 2018
∆Y/Y
WW + 2%
U.S. + 2%
ROW + 1%

25
Global SPINRAZA performance
Numbers may not foot due to rounding.
SPINRAZA Revenues ($M)
Approved in over 50 countries
Formal reimbursement in 40
countries
$236 $223 $231 $237 $243
$234$295 $258
$310 $300
$470
$518$488
$547 $543
Q4-18 Q1-19 Q2-19 Q3-19 Q4-19
ROW
U.S.

26
Highlights
SPINRAZA patient dynamics
• As of December 31, 2019, > 10,000
patients on therapy across the post-
marketing setting, the EAP, and clinical
trials
• In the U.S. more than 50% of new
starts in Q4 2019 were adults; growth
in adults exceeded overall patient
growth
• Continued strong patient growth
outside the U.S. with significant
remaining opportunity
Numbers may not foot due to rounding. U.S. and Ex-U.S. SPINRAZA patients represent the total estimated number of patients on therapy in the post-marketing setting as of the end of each quarter, including free patients in the U.S. EAP patients represent patients actively enrolled in the Expanded Access Program (EAP) as of the end of each quarter.
SPINRAZA Patients
2,620 2,740 2,850 2,950 3,010
3,4604,440
5,2006,080
6,710260
210
170
70
40
300
300
300
300
290
6,640
7,6908,520
9,39010,040
Q4-18 Q1-19 Q2-19 Q3-19 Q4-19
Clinical Trial EAP ROW U.S.

27
Biosimilars business
• Equity stake to ~49.9%
• > 200,000 patients currently on biosimilars*
• Biogen contributed ~ €1.8 billion of healthcare
savings in 2019 across Europe#
Biosimilars Revenues ($M)
$125 $124 $120 $116 $126
$14 $15 $17 $18$18
$17$36 $47 $49
$52$156
$175$184 $184
$196
Q4-18 Q1-19 Q2-19 Q3-19 Q4-19
IMRALDI
FLIXABI
BENEPALI
*Biogen data on file as of December 31, 2019. Includes ~ 105,000 patients on BENEPALI, ~ 75,000 patients on IMRALDI, and ~ 25,000 patients on FLIXABI.#Biogen data on file.^Company reported sales, EvaluatePharma.
Commercialization in Europe
Samsung Bioepis Joint Venture
• Biogen to commercialize potential ophthalmology
biosimilars referencing LUCENTIS and EYLEA across
the U.S., Canada, Europe, Japan, and Australia
• Global market of almost $11 billion in 2018^
• Commercialization rights to anti-TNFs in China
New Commercialization Agreement

28
Q4 & FY 2019 financial results summary: revenues
$ in Millions Q4 2019 Q3 2019 Q4 2018 Q/Q Y/Y FY 2019 FY 2018 FY/FY
Total MS Product Revenues1 $2,182 $2,160 $2,195 1% (1%) $8,529 $8,595 (1%)
SPINRAZA U.S. $243 $237 $236 3% 3% $933 $854 9%
SPINRAZA ROW1 $300 $310 $234 (3%) 28% $1,164 $870 34%
Total SPINRAZA Revenues1 $543 $547 $470 (1%) 16% $2,097 $1,724 22%
Biosimilars Revenues $196 $184 $156 7% 25% $738 $545 35%
FUMADERM Revenues $4 $4 $5 (3%) (28%) $15 $22 (32%)
Total Product Revenues1 $2,925 $2,895 $2,826 1% 4% $11,380 $10,887 5%
RITUXAN/GAZYVA Revenues $395 $408 $383 (3%) 3% $1,603 $1,502 7%
OCREVUS Royalties $205 $188 $152 9% 35% $688 $478 44%
Revenues from Anti-CD20
Therapeutic Programs$601 $596 $535 1% 12% $2,290 $1,980 16%
Other Revenues $146 $110 $166 33% (12%) $708 $586 21%
Total Revenues1 $3,671 $3,600 $3,526 2% 4% $14,378 $13,453 7%
Numbers may not foot due to rounding. Percent changes represented as favorable/(unfavorable). For all periods, there were noadjustments between GAAP and Non-GAAP revenues. 1Net of hedge

29
$ in Millions Q4 2019 Q3 2019 Q4 2018 Q/Q Y/Y FY 2019 FY 2018 FY/FY
GAAP Cost of Sales $447 $430 $489 (4%) 8% $1,955 $1,816 (8%)
% of Total Revenues 12% 12% 14% 14% 14%
Non-GAAP Cost of Sales $447 $430 $489 (4%) 8% $1,955 $1,816 (8%)
% of Total Revenues 12% 12% 14% 14% 14%
GAAP R&D Expenses $692 $540 $612 (28%) (13%) $2,281 $2,597 12%
% of Total Revenues 19% 15% 17% 16% 19%
Non-GAAP R&D Expenses $692 $540 $602 (28%) (15%) $2,273 $2,425 6%
% of Total Revenues 19% 15% 17% 16% 18%
GAAP SG&A Expenses $665 $555 $591 (20%) (12%) $2,376 $2,106 (13%)
% of Total Revenues 18% 15% 17% 17% 16%
Non-GAAP SG&A Expenses $662 $547 $591 (21%) (12%) $2,325 $2,095 (11%)
% of Total Revenues 18% 15% 17% 16% 16%
GAAP Divestiture of Assets ($40) ($18) $0 127% NMF $55 $0 NMF
GAAP Amortization of Acquired Intangibles
$68 $284 $254 76% 73% $490 $747 34%
Collaboration Profit (Loss) Sharing
$60 $60 $56 1% (7%) $242 $185 (31%)
Q4 & FY 2019 financial results summary
Numbers may not foot due to rounding. Percent changes represented as favorable/(unfavorable). A reconciliation of our GAAP to Non-GAAP financial results is at the end of this presentation.

30
$ in Millions except EPSShares in Millions
Q4 2019
Q3 2019
Q4 2018
Q/Q
Y/Y
FY 2019
FY 2018
FY/FY
GAAP Other Income (Expense) ($49) ($27) ($29) (81%) (72%) $83 $11 655%
Non-GAAP Other Income (Expense) ($50) ($23) ($16) (121%) (206%) ($110) ($117) 6%
GAAP Tax Rate 16% 12% 33% 16% 24%
Non-GAAP Tax Rate 16% 16% 21% 16% 21%
GAAP JV Equity Income (Loss) ($13) ($22) $0 42% NMF ($79) $0 NMF
Non-GAAP JV Equity Income (Loss) $8 ($1) $0 NMF NMF ($1) $0 NMF
GAAP Net Income (Loss) Attributable to Noncontrolling Interests
$0 $0 ($2) NMF (100%) $0 $43 NMF
Non-GAAP Net Income (Loss) Attributable to Noncontrolling Interests
$0 $0 ($0) NMF (100%) $0 ($0) NMF
Weighted average diluted shares used in calculating diluted EPS
178 184 200 3% 11% 187 205 9%
GAAP Net Income Attributable to Biogen Inc.
$1,440 $1,546 $947 (7%) 52% $5,889 $4,431 33%
GAAP Diluted EPS $8.08 $8.39 $4.73 (4%) 71% $31.42 $21.58 46%
Non-GAAP Net Income Attributable to Biogen Inc.
$1,486 $1,689 $1,400 (12%) 6% $6,291 $5,378 17%
Non-GAAP Diluted EPS $8.34 $9.17 $6.99 (9%) 19% $33.57 $26.20 28%
Q4 & FY 2019 financial results summary
Numbers may not foot due to rounding. Percent changes represented as favorable/(unfavorable). A reconciliation of our GAAP to Non-GAAP financial results is at the end of this presentation.

31
Biogen 2020 full year financial guidance
Expense ratios and tax rates apply to both GAAP and Non-GAAP 2020 Full Year Guidance 2019 Actual 2020 Guidance
Revenues $14.4 billion $14.0 to $14.3 billion
R&D Expense(as a % of revenues)
16% 15% to 16%
SG&A Expense(as a % of revenues)
17% (GAAP)16% (Non-GAAP)
19.5% to 20.5%
Tax Rate 16% 18% to 19%
GAAP Diluted EPS $31.42 $29.50 to $31.50
Non-GAAP Diluted EPS $33.57 $31.50 to $33.50
Additional 2020 Assumptions:
• Does not include any impact from potential acquisitions or large business development transactions, as both are hard to predict.
• Assumes no generic competition in the U.S. for TECFIDERA in 2020 and no change in foreign exchange rates.
• Assumes additional commercial and R&D expenses related to aducanumab, a stable share count, and that the proposed
transaction with Pfizer closes.
• Expect capital expenditures to be between $350 million and $400 million.
Biogen may incur charges, realize gains or losses, or experience other events or circumstances in 2020 that could cause actual results to vary from this financial guidance. A reconciliation of our GAAP to non-GAAP financial guidance is at the end of this presentation.

32
Michel Vounatsos
Chief Executive Officer
Closing Remarks
32

33
YESTERDAY TODAY EARLY 2020s OUR VISION
MULTIPLE SCLEROSIS
SMA
STROKE
OPHTHALMOLOGY
LUPUS
ALZHEIMER’S DISEASE
NEUROCOGNITIVE
DISORDERS
PAIN
MULTIPLE SCLEROSIS MULTIPLE SCLEROSIS MULTIPLE SCLEROSIS
NEUROMUSCULAR (SMA + ALS)
NEUROMUSCULAR (SMA + ALS)
ACUTE NEUROLOGY
IMMUNOLOGY / OTHER
BIOSIMILARSBIOSIMILARS BIOSIMILARS
MOVEMENT DISORDERS
OPHTHALMOLOGY
Continuing to build a multi-franchise portfolio
ALZHEIMER’S DISEASE
Near-term value
creation opportunities

34
11 Readouts Expected by End of 2021
Significant opportunity for value creation
Phase 3 readouts
Stroke: 5th leading cause
of death in the U.S.
<5 years average life expectancy
for patients with ALS
~50M patients with dementia
Near-Term Opportunities
Up to 200,000 patients with inherited
retinal disorders in the U.S.
~800,000 individuals with lupus*
Source: World Health Organization; The ALS Association; American Heart Association; Biogen data on file.*Represents patients with CLE and/or SLE in the G7
Tofersen
SOD1 ALS
BIIB111
Choroideremia
BIIB093
LHI
Opicinumab
MS
Gosuranemab
Alzheimer’s
Cinpanemab
Parkinson’s
BIIB112
XLRP
BIIB104
CIAS
TMS-007#
AIS
Natalizumab
Epilepsy
Vixotrigine
SFN
Phase 2 readouts
#Option agreement; SOD1 = superoxide dismutase 1; ALS = amyotrophic lateral sclerosis; LHI = large hemispheric infarction; MS = multiple sclerosis; XLRP = X-linked retinitis pigmentosa; CIAS = cognitive impairment associated with schizophrenia; AIS = acute ischemic stroke; SFN = small fiber neuropathy

35
Continuing to create value through pioneering science
The leader in neuroscience
Building breadth and depth
across the pipeline
11 data readouts expected by
end of 2021
Significant market opportunity
with high unmet need
Working to create multiple
franchises
Multiple value creation
inflection points

36
COMMUNITYENVIRONMENTEMPLOYEESPATIENTS
^Biogen data on file as of December 31, 2019; #Health Technology Assessment; ^^Biogen data on file as of September 30, 2019; *DJSI World and DJSI North America
PIONEERING SCIENCE
TO TRANSFORM
PEOPLE’S LIVES
Early Access Programs in over 40 countries^
~200,000 Patients treated with biosimilars^
100% HTAs#
pricing approval
Innovating Digital Tools to help patients (Aby/CLEO)
IGNITING THE WORLD’S
LEADING SCIENTIFIC MINDS
IN AN INCLUSIVE WORKPLACE
46% women in director-level
positions and above^^
25% ethnic or racial minorities in U.S. director-level roles
and above^^
‘Best Place to Work
for Disability Inclusion’3 consecutive years
Driving Health Equity in the disease areas we treat
FOLLOWING THE SCIENCE
TO OPERATE SUSTAINABLY
AND SET BOLD TARGETS
#1 Biotech Company on Dow Jones
Sustainability Index*
Carbon neutral company since 2014
100% renewable power commitment
Green chemistry principles adopted
INSPIRING THE NEXT
GENERATION OF SCIENTISTS
IN OUR COMMUNITIES
$10M 4-year STEM commitment from Biogen Foundation
53k+ students engaged in
Community Lab since inception^
54% summer Community Lab
students from underrepresented
and/or low-income household groups^
3k+ employees volunteeredin 30+ countries
for Care Deeply Day
Where science meets humanity

37
Questions& Answers
37

38
Appendix
38

39
Q4 & FY 2019 financial results summary: MS revenues$ in Millions Q4 2019 Q3 2019 Q4 2018 Q/Q Y/Y FY 2019 FY 2018 FY/FY
TECFIDERA U.S. $877 $842 $856 4% 2% $3,307 $3,253 2%
TECFIDERA ROW1 $284 $280 $254 1% 12% $1,126 $1,021 10%
Total TECFIDERA Revenues1 $1,161 $1,122 $1,110 3% 5% $4,433 $4,274 4%
VUMERITY U.S. $5 $0 $0 NMF NMF $5 $0 NMF
Total Fumarate Revenues1 $1,167 $1,122 $1,110 4% 5% $4,438 $4,274 4%
AVONEX U.S. $303 $303 $363 0% (16%) $1,202 $1,420 (15%)
AVONEX ROW1 $108 $117 $118 (8%) (9%) $464 $495 (6%)
Total AVONEX Revenues1 $411 $420 $481 (2%) (15%) $1,666 $1,915 (13%)
PLEGRIDY U.S. $56 $58 $68 (3%) (18%) $225 $248 (10%)
PLEGRIDY ROW1 $49 $52 $48 (6%) 2% $211 $199 6%
Total PLEGRIDY Revenues1 $106 $110 $116 (4%) (9%) $436 $448 (3%)
Total Interferon Revenues1 $516 $530 $597 (3%) (14%) $2,102 $2,363 (11%)
TYSABRI U.S. $270 $263 $257 3% 5% $1,042 $1,025 2%
TYSABRI ROW1 $203 $221 $208 (8%) (2%) $850 $839 1%
Total TYSABRI Revenues1 $473 $484 $464 (2%) 2% $1,892 $1,864 2%
FAMPYRA1 $26 $24 $23 6% 14% $97 $93 5%
ZINBRYTA ROW $0 $0 $0 NMF NMF $0 $1 (100%)
Total MS Product Revenues1 $2,182 $2,160 $2,195 1% (1%) $8,529 $8,595 (1%)
OCREVUS Royalties $205 $188 $152 9% 35% $688 $478 44%
MS Product Revenues1 + OCREVUS Royalties $2,388 $2,348 $2,346 2% 2% $9,217 $9,073 2%
Numbers may not foot due to rounding. Percent changes represented as favorable/(unfavorable). For all periods there were no
adjustments between GAAP and Non-GAAP revenues. 1Net of hedge
40
Q4 2019 impact of foreign exchange and hedging
ActualsHedge Gains (Losses)
in the Quarter
FX Impact w/o
Hedge Favorable/
(Unfavorable)
Hedge Impact
Favorable/
(Unfavorable)
Total Impact
Favorable/
(Unfavorable)
Q4’19 Q4’19 Q3’19 Q4’18Vs.
Q3’19
Vs.
Q4’18
Vs.
Q3’19
Vs.
Q4’18
Vs.
Q3’19
Vs.
Q4’18
Total Revenues $3,671 $32 $35 $13 ($7) ($28) ($3) $21 ($10) ($7)
TECFIDERA $1,161 $16 $16 $5 ($1) ($5) ($1) $10 ($1) $5
Interferon $516 $7 $8 $3 ($1) ($4) ($1) $3 ($3) ($1)
TYSABRI $473 $10 $11 $4 ($1) ($6) ($1) $6 ($2) $0
SPINRAZA $543 ($0) ($0) N/A ($4) ($7) $0 ($0) ($4) ($7)
Biosimilars $196 N/A N/A N/A $1 ($4) - - $1 ($4)
Amounts are in millions and are GAAP and Non-GAAP. Numbers may not foot due to rounding.
41
FY 2019 impact of foreign exchange and hedging
Amounts are in millions and are GAAP and Non-GAAP. Numbers may not foot due to rounding.
ActualsHedge Gains (Losses)
in the Year
FX Impact w/o Hedge
Favorable/
(Unfavorable)
Hedge Impact
Favorable/
(Unfavorable)
Total Impact
Favorable/
(Unfavorable)
FY 19 FY 19 FY 18 Vs. FY 18 Vs. FY 18 Vs. FY 18
Total Revenues $14,378 $118 ($32) ($208) $153 ($55)
TECFIDERA $4,433 $54 ($12) ($49) $65 $17
Interferon $2,102 $27 ($9) ($35) $36 $1
TYSABRI $1,892 $37 ($11) ($45) $48 $3
SPINRAZA $2,097 ($0) N/A ($43) ($0) ($43)
Biosimilars $738 N/A N/A ($28) - ($28)

42
$170$127
$199 $203 $220
$365 $391 $377 $393 $381
$535 $517$576 $596 $601
$1,133
$1,227$1,165 $1,190 $1,166
Q4-18 Q1-19 Q2-19 Q3-19 Q4-19
Other Anti-CD20 Revenues U.S. Profit Share
Total Anti-CD20 Revenues RITUXAN/GAZYVA U.S. Net Sales
Anti-CD20 performance
Note: In collaboration with Genentech, Inc., a wholly-owned member of the Roche Group. Numbers may not foot due to rounding. 1U.S. profit share = U.S. profit share + expense reimbursement.
HighlightsRevenues from Anti-CD20 Therapeutic Programs ($M)
• Revenues vs. Q4 2018 and Q3 2019
• Other anti-CD20 revenues consist of
royalty revenues on sales of
OCREVUS and our share of pre-tax
copromotion profits on RITUXAN in
Canada
∆Y/Y ∆Q/Q
U.S. Net Sales + 3% and - 2%
U.S. Profit
Share1 + 4% and - 3%
Other Anti-
CD20+ 29% and + 8%
Total
Anti-CD20
Revenues
+ 12% and + 1%
43
GAAP to Non-GAAP ReconciliationNet Income Attributable to Biogen Inc. and Diluted Earnings Per Share(unaudited, in millions, except per share amounts)
Footnotes referenced in the tables above are included at the end of this presentation.

44
GAAP to Non-GAAP ReconciliationNet Income Attributable to Biogen Inc. and Diluted Earnings Per Share(unaudited, in millions, except per share amounts)
Footnotes referenced in the table above are included at the end of this presentation.
45
Notes to GAAP to Non-GAAP ReconciliationA Amortization and impairment of acquired intangible assets for the three months ended September 30, 2019, and the twelve months ended December 31, 2019, reflects the impact of a $215.9
million impairment charge related to certain in-process research and development (IPR&D) assets associated with the Phase 2b study of BG00011 (STX-100) for the potential treatment of idiopathic
pulmonary fibrosis, which was discontinued during the third quarter of 2019.
Amortization and impairment of acquired intangible assets for the twelve months ended December 31, 2018, includes the impact of impairment charges related to certain IPR&D assets associated
with our vixotrigine (BIIB074) program totaling $189.3 million that were recognized during the third quarter of 2018. During the third quarter of 2018 we completed a Phase 2b study of vixotrigine
for the potential treatment of painful lumbosacral radiculopathy (PLSR). The study did not meet its primary or secondary efficacy endpoints and we discontinued development of vixotrigine for the
potential treatment of PLSR. As a result, we recognized an impairment charge of approximately $60.0 million during the third quarter of 2018 to reduce the fair value of the IPR&D intangible asset to
zero. In addition, we delayed the initiation of the Phase 3 studies of vixotrigine for the potential treatment of trigeminal neuralgia (TGN) as we awaited the outcome of ongoing interactions with the
U.S. Food and Drug Administration (FDA) regarding the design of the Phase 3 studies, a more detailed review of the data from the Phase 2b study of vixotrigine for the potential treatment of PLSR
and insights from the Phase 2 study of vixotrigine for the potential treatment of small fiber neuropathy. We reassessed the fair value of the TGN program using reduced expected lifetime revenues,
higher expected clinical development costs and a lower cumulative probability of success. As a result of that reassessment, we recognized an impairment charge of $129.3 million during the third
quarter of 2018 to reduce the fair value of the TGN IPR&D intangible asset to $41.8 million.
B In January 2017 we entered into a settlement and license agreement among Biogen Swiss Manufacturing GmbH, Biogen International Holding Ltd., Forward Pharma A/S (Forward Pharma) and
certain related parties, which was effective as of February 1, 2017. Pursuant to this agreement, we obtained U.S. and rest of world licenses to Forward Pharma’s intellectual property, including
Forward Pharma’s intellectual property related to TECFIDERA. In exchange, we paid Forward Pharma $1.25 billion in cash, of which $795.2 million was recognized within intangible assets in the first
quarter of 2017.
We had an intellectual property dispute with Forward Pharma in the U.S. concerning intellectual property related to TECFIDERA.
In March 2017 the U.S. intellectual property dispute was decided in our favor. Forward Pharma appealed to the U.S. Court of Appeals for the Federal Circuit. We evaluated the recoverability of the
U.S. asset acquired from Forward Pharma and recorded a $328.2 million impairment charge in the first quarter of 2017 to adjust the carrying value of the acquired U.S. asset to fair value reflecting
the impact of the developments in the U.S. legal dispute and continued to amortize the remaining net book value of the U.S. intangible asset in our consolidated statements of income utilizing an
economic consumption model. The U.S. Court of Appeals for the Federal Circuit upheld the U.S. Patent and Trademark Office's March 2017 ruling and in January 2019 denied Forward Pharma's
petition for rehearing. We evaluated the recoverability of the U.S. asset based upon these most recent developments and recorded a $176.8 million impairment charge in the fourth quarter of 2018
to reduce the remaining net book value of the U.S. asset to zero.
We have an intellectual property dispute with Forward Pharma in the European Union concerning intellectual property related to TECFIDERA.
In March 2018 the European Patent Office (EPO) revoked Forward Pharma’s European Patent No. 2 801 355. Forward Pharma has filed an appeal to the Technical Boards of Appeal of the EPO and
the appeal is pending. Based upon our assessment of this ruling, we continue to amortize the remaining net book value of the rest of world intangible asset in our consolidated statements of income
utilizing an economic consumption model. The remaining net book value of the TECFIDERA rest of world intangible asset as of December 31, 2019, was $36.1 million.

46
Notes to GAAP to Non-GAAP Reconciliation (Continued)
For the twelve months ended December 31, 2019, compared to the prior year period, the decrease in amortization of acquired intangible assets, excluding impairment charges, was primarily due to a
net overall decrease in our expected rate of amortization for acquired intangible assets. This decrease was primarily due to lower amortization subsequent to the impairment in the fourth quarter of
2018 of the U.S. license to Forward Pharma intellectual property, including Forward Pharma's intellectual property related to TECFIDERA, and higher expected lifetime revenues of TYSABRI.
C (Gain) loss on fair value remeasurement of contingent consideration for the three months ended September 30, 2019, and the twelve months ended December 31, 2019, reflects our adjustment to
the value of our contingent consideration obligations related to the BG00011 asset, resulting in a gain of $61.2 million during the third quarter of 2019.
(Gain) loss on fair value remeasurement of contingent consideration for the twelve months ended December 31, 2018, reflects our adjustment to the fair value of our contingent consideration
obligations related to our vixotrigine program for the potential treatment of TGN.
In the third quarter of 2018 we decided to delay the initiation of the Phase 3 studies of vixotrigine for the potential treatment of TGN. As a result of that decision, we adjusted the value of our contingent
consideration obligations related to the TGN program to reflect the lower cumulative probabilities of success resulting in a gain of $89.6 million in the third quarter of 2018.
In the fourth quarter of 2018 we received feedback from the FDA regarding the design of the Phase 3 studies of vixotrigine for the potential treatment of TGN. Following this feedback, we adjusted the
fair value of our contingent consideration obligations related to our vixotrigine program for the treatment of TGN to reflect the increased probabilities of success and recognized a loss of $80.6 million in
the fourth quarter of 2018.
D In August 2019 we completed the sale of all of the outstanding shares of our subsidiary that owned our biologics manufacturing operations in Hillerød, Denmark to FUJIFILM Corporation (FUJIFILM).
Upon the closing of this transaction, we received approximately $881.9 million in cash, which may be adjusted based on other contractual terms, which are discussed below. We determined that the
operations disposed of in this transaction did not meet the criteria to be classified as discontinued operations under the applicable guidance.
As part of this transaction, we have provided FUJIFILM with certain minimum batch production commitment guarantees. There is a risk that the minimum contractual batch production commitments will
not be met. Based upon current estimates we expect to incur an adverse commitment obligation of approximately $74.0 million associated with such guarantees. We may adjust this estimate based
upon changes in business conditions, which may result in the increase or reduction of this adverse commitment obligation in subsequent periods. We also may be obligated to indemnify FUJIFILM for
liabilities that existed relating to certain business activities incurred prior to the closing of this transaction.
In addition, we may earn certain contingent payments based on future manufacturing activities at the Hillerød facility. For the disposition of a business, our policy is to recognize contingent consideration
when the consideration is realizable. We currently believe the probability of earning these payments is remote and therefore we did not include these contingent payments in our calculation of the fair
value of the operations.
As part of this transaction, we entered into certain manufacturing services agreements with FUJIFILM pursuant to which FUJIFILM will use the Hillerød facility to produce commercial products for us,
such as TYSABRI, as well as other third-party products.

47
Notes to GAAP to Non-GAAP Reconciliation (Continued)
In connection with this transaction we recognized a total net loss of approximately $164.4 million in our consolidated statements of income. This loss included a pre-tax loss of $95.5 million, which was
recorded in loss on divestiture of Hillerød, Denmark manufacturing operations. The loss recognized was based on exchange rates and business conditions on the closing date of this transaction, and
included costs to sell our Hillerød, Denmark manufacturing operations of approximately $11.2 million and our estimate of the fair value of an adverse commitment of approximately $114.0 million
associated with the guarantee of future minimum batch production at the Hillerød facility. The value of this adverse commitment was determined using a probability-weighted estimate of future
manufacturing activity. We also recorded a tax expense of $68.9 million related to this transaction. During the fourth quarter of 2019 we recorded a $40.2 million reduction in our estimate of the future
minimum batch commitment utilizing our current manufacturing forecast, which reflects the impact of forecasted aducanumab batches, resulting in a reduction in the pre-tax loss on divestiture from
$95.5 million to $55.3 million.
E 2017 corporate strategy implementation and restructuring charges are related to our efforts to create a leaner and simpler operating model.
F The Tax Cuts and Jobs Act of 2017 (2017 Tax Act) resulted in significant changes to the U.S. corporate income tax system. These changes include a federal statutory rate reduction from 35% to 21%,
the elimination or reduction of certain domestic deductions and credits and limitations on the deductibility of interest expense and executive compensation. The 2017 Tax Act also transitions
international taxation from a worldwide system to a modified territorial system, which has the effect of subjecting certain earnings of our foreign subsidiaries and collaborations to immediate U.S.
taxation as global intangible low-taxed income (GILTI) or Subpart F income, and includes base erosion prevention measures on U.S. earnings and the reduced effective tax rate on income that comes
from U.S. exports, called Foreign Derived Intangible Income. During the fourth quarter of 2018 we elected to recognize deferred taxes for the basis differences expected to reverse as GILTI is incurred
and have established initial deferred tax balances, as of the enactment date of the 2017 Tax Act.
U.S. tax reform amounts for the three and twelve months ended December 31, 2018, reflects the effect of an expense of $135.8 million related to the establishment of GILTI deferred taxes.
Tax reform amounts for the twelve months ended December 31, 2018, reflects the effect of a net reduction of $34.6 million to our 2017 preliminary estimate associated with a one-time mandatory
deemed repatriation tax on accumulated foreign subsidiaries' previously untaxed foreign earnings (the Transition Toll Tax), an expense of $12.7 million for the remeasurement of our deferred tax
balances and an $11.0 million expense to reflect other aspects of the 2017 Tax Act.
G During the third quarter of 2019 a new taxing regime in the country and certain cantons of Switzerland was enacted and we refer to this as Swiss Tax Reform. As a result of the impact of Swiss Tax
Reform, we recorded an income tax benefit of approximately $54.3 million resulting from a remeasurement of our deferred tax assets and liabilities in the third quarter of 2019.
H Amortization included in equity in loss of investee, net of tax reflects the amortization of the differences between the fair value of our investment in Samsung Bioepis Co., Ltd. and the carrying value of
our interest in the underlying net assets of the investee. These basis differences are amortized over their economic life.
I Stock option expense reflects the accelerated vesting of stock options previously granted to Nightstar Therapeutics plc (NST) employees as a result of our acquisition of NST in the second quarter of
2019.

48
J In June 2018 we closed a 10-year exclusive collaboration agreement with Ionis Pharmaceuticals, Inc. (Ionis) to develop novel antisense oligonucleotide drug candidates for a broad range of
neurological diseases (the 2018 Ionis Agreement) for a total payment of $1.0 billion, consisting of an upfront payment of $375.0 million and the purchase of approximately 11.5 million shares of Ionis
common stock at a cost of $625.0 million.
The 11.5 million shares of Ionis common stock were purchased at a premium to their fair value at the transaction closing date. The premium consisted of acquiring the shares at a price above the fair
value based on the trailing 10-day weighted-average close price prior to entering into the 2018 Ionis Agreement in April 2018 and the effect of certain holding period restrictions. We recorded an asset
of $462.9 million in investments and other assets in our condensed consolidated balance sheets reflecting the fair value of the common stock as of the purchase date and a charge of $162.1 million to
research and development expense in our condensed consolidated statements of income in the second quarter of 2018 reflecting the premium paid for the common stock.
K Net distribution to noncontrolling interests reflects the $50.0 million payment to Neurimmune SubOne AG (Neurimmune), net of Neurimmune's tax, to further reduce the previously negotiated royalty
rates payable on products developed under our amended collaboration and license agreement with Neurimmune, including royalties payable on potential commercial sales of aducanumab, an
investigational treatment for early Alzheimer's disease, by an additional 5%.
Notes to GAAP to Non-GAAP Reconciliation (Continued)