Q4 2014 Webcast Presentation
20
Q4 2014 Financial Results – February 20, 2015 TSX; NYSE: AUQ www.auricogold.com Built for SUCCESS All amounts are in US dollars unless otherwise indicated
-
Upload
aurico-gold -
Category
Documents
-
view
450 -
download
2
Transcript of Q4 2014 Webcast Presentation
Q4 2014 Financial Results – February 20, 2015 TSX; NYSE: AUQ
www.auricogold.com
Built for SUCCESS
All amounts are in US dollars unless otherwise indicated
Forward Looking Statements Cautionary Statement
This presentation contains certain information that constitutes “forward-looking information” and “forward-looking statements” as defined under Canadian and U.S. securities laws. All statements in this press release, other than statements of historical fact, are forward-looking statements. The words “expect”, “believe”, “anticipate”, “contemplate”, “may”, “could”, “will”, “intend”, “estimate”, “forecast”, “target”, “budget”, “schedule” and similar expressions identify forward-looking statements. Forward-looking statements in this presentation include, without limitation, statements with respect to our expectations on underground productivity levels, underground unit mining cost, underground development, mill facility processing rate, cash flow, free cash flow, cash costs, capital investment and timing to completion on the final leg of the Northgate production shaft, information as to our strategy, plans and future financial and operating performance, such as our expansion plans, project timelines, production plans, projected cash flows or capital expenditure levels, cost estimates, mining or milling methods, projected exploration results, resource and reserve estimates, other statements that express our expectations or estimates of future performance, the success of exploration activities, the Company’s ability to delineate additional resources and reserves as a result of such programs, statements regarding the advancement of the Lynn Lake district, the completion of a feasibility study on the Lynn Lake Project within the indicated timeframe, mineral reserves and mineral resources and anticipated grades, exploration expenditures, costs and timing of any future development, costs and timing of future exploration and the Company’s intentions regarding its investment in Carlisle, the presence of and continuity of metals at Kemess East at modeled grades. Forward-looking statements are necessarily based upon a number of factors and assumptions that, while considered reasonable by management at the time of making such statements, are inherently subject to significant business, economic and competitive uncertainties and contingencies. Known and unknown factors could cause actual results to differ materially from those projected in the forward-looking statements. Such factors and assumptions underlying the forward-looking statements in this press release include, but are not limited to: changes to current estimates of mineral reserves and resources; fluctuations in the price of gold; changes in foreign exchange rates (particularly the Canadian dollar, Mexican peso and U.S. dollar); the impact of inflation; changes in our credit rating; any decision to declare a quarterly dividend; employee relations; litigation; disruptions affecting operations; availability of and increased costs associated with mining inputs and labor; development delays at the Young-Davidson mine; operating or technical difficulties in connection with mining or development activities; inherent risks associated with mining and mineral processing; the risk that the Young-Davidson and El Chanate mines may not perform as planned; uncertainty with the Company’s ability to secure capital to execute its business plans; the speculative nature of mineral exploration and development, including the risks of obtaining necessary licenses, permits, authorizations and/or approvals from the appropriate regulatory authorities for the Kemess Underground project; contests over title to properties; changes in national and local government legislation in Canada, Mexico and other jurisdictions in which the Company does or may carry on business in the future; risk of loss due to sabotage and civil disturbances; the impact of global liquidity and credit availability and the values of assets and liabilities based on projected future cash flows; risks arising from holding derivative instruments; business opportunities that may be pursued by the Company, as well as those factors discussed under “Risk Factors” in the Company’s most recent Annual Information Form. Actual results and developments are likely to differ, and may differ materially, from those expressed or implied by the forward-looking statements contained in this presentation. Such statements are based on a number of assumptions which may prove to be incorrect, including, but not limited to, the assumptions set forth in our most recent Form 40-F/Annual Information Form. Readers are cautioned that forward-looking statements are not guarantees of future performance. All of the forward-looking statements made in this press release are qualified by these cautionary statements. Specific reference is made to the most recent Form 40-F/Annual Information Form on file with the SEC and Canadian provincial securities regulatory authorities for a discussion of some of the factors underlying forward-looking statements. There can be no assurance that forward-looking statements or information will prove to be accurate, accordingly, investors should not place undue reliance on the forward-looking statements or information contained herein. The Company disclaims any intention or obligation to update or revise any forward-looking statements whether as a result of new information, future events or otherwise, except as required by applicable law.
Cautionary Note to U.S. Investors Concerning Measured, Indicated and Inferred Resources
This presentation uses the terms "measured", "indicated" and "inferred” resources. We advise investors that while those terms are recognized and required by Canadian regulations, the United States Securities and Exchange Commission does not recognize them. “Inferred resources” have a great amount of uncertainty as to their existence and as to their economic and legal feasibility. It cannot be assumed that all or any part of an inferred resource will ever be upgraded to a higher category. Under Canadian rules, estimates of inferred mineral resources may not form the basis of feasibility or other economic studies. United States investors are cautioned not to assume that all or any part of measured or indicated mineral resources will ever be converted into mineral reserves. United States investors are also cautioned not to assume that all or any part of an inferred mineral resource exists, or is economically or legally mineable.
2

Scott Perry, CEO

Corporate Highlights
STRONG SAFETY PERFORMANCE › Young-Davidson: 21 months of incident free operations
ELEVENTH CONSECUTIVE QUARTER OF PRODUCTION GROWTH AT YOUNG-DAVIDSON › Young-Davidson achieves high end of production guidance and in-line underground cash costs
YOUNG-DAVIDSON TRANSITIONS TO FREE CASH FLOW STATUS › Reports $9 million of net free cash flow in Q4
YOUNG-DAVIDSON UNDERGROUND RAMP-UP ON TRACK › Well positioned to achieve 2015 guidance levels
KEMESS EAST: INITITAL RESOURCE OF 5.5 MILLION GOLD EQ. OUNCES › Kemess Property resource has doubled to 10.6 million gold eq. ounces
STRATEGIC 25% JOINT VENTURE AGREEMENT ON THE LYNN LAKE GOLD CAMP › 60% interest by funding up to C$20 million over 3 years and delivering a feasibility study
RESTRUCTURED ROYALTY AGREEMENT COMPLETED › Upfront payment of C$20M and ongoing royalty stream with Crocodile Gold
AuRico Delivers Another Year of Consolidated Production that Achieves Guidance
4

Transitioned to Positive Net Free Cash Flow in Q4-2014
Young-Davidson Production Growth
Q1/13 Q2/13 Q3/13 Q4/13 Q1/14 Q2/14 Q3/14 Q4/14 2014 Gold ounces produced 28,281 29,252 30,099 33,106 35,104 40,166 40,538 40,945 156,753
Underground cash costs per oz. - - - $663 $808 $803 $656 $656 $719 Open pit cash costs per oz. $694 $716 $666 $983 $1,350 $974 $923 $994 $1,071
Total cash costs per oz. $694 $716 $666 $850 $1,009 $871 $723 $719 $825 Underground mine
Tonnes mined per day 1,130 1,611 1,417 2,590 2,611 3,595 3,752 4,140 3,530 Grades (g/t) 2.7 2.5 2.8 3.1 2.8 3.3 3.1 3.0 3.1 Development metres 1,941 2,445 2,620 2,986 3,772 3,545 3,269 3,438 14,024
Mill processing facility Tonnes processed per day 6,466 7,017 6,747 6,969 7,163 8,230 7,670 7,757 7,707 Grades (incl. open pit stockpile) 1.8 1.7 1.7 2.0 1.8 2.2 1.9 2.0 2.0 Recoveries (%) 86% 85% 89% 88% 87% 88% 90% 88% 88%
Young-Davidson Quarterly Operational Results
11,950 17,825
26,363 28,281 29,252 30,099 33,106 35,104
40,166 40,538 40,945
Q2 12 Q3 12 Q4 12 Q1 13 Q2 13 Q3 13 Q4 13 Q1 14 Q2 14 Q3 14 Q4 14
Gol
d O
unce
s P
rodu
ced(5
)
Young-Davidson: Growing Production
5

El Chanate: Consistent Production
OPEN PIT PRODUCTIVITY › Q4 Average of 89,602 tonnes per day
RELIABLE AND CONSISTENT OPERATIONAL PERFORMANCE › Production of 67,279 ounces at $669 per gold ounce
REDUCED STRIPPING REQUIREMENTS › Capital investment decrease of up to 30% in 2015
EXPLORATION POTENTIAL › Drilling on the expanded land package along the El Chanate trend in 2015
-
10,000
20,000
30,000
40,000
50,000
60,000
70,000
2011 2012 2013 2014 2015E
Gol
d pr
oduc
tion
ounc
es
Consistent Gold Production
6

2014 Reserves and Resources
P&P 6,524
P&P 6,275
M&I 2,484
M&I 4,083
Inferred 472
Inferred 2,404
72
321
1,599
1,932
-
2,000
4,000
6,000
8,000
10,000
12,000
14,000
EOY 2013 P&P Increase M&I Increase Inf. Increase Production Depletion EOY 2014
Gol
d O
unce
s (0
00’s
)
AuRico Gold Mineral Inventory
Initial Kemess East Resource and Lynn Lake JV Increased 2014 Mineral Inventory by 35%
7
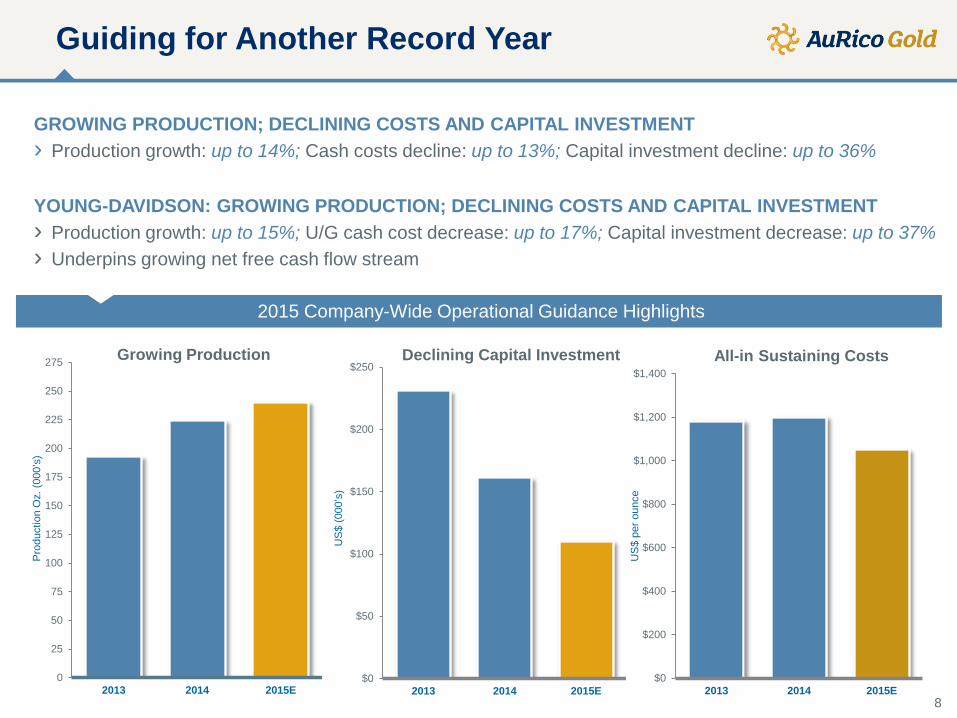
Guiding for Another Record Year
0
25
50
75
100
125
150
175
200
225
250
275
2013 2014 2015E
Pro
duct
ion
Oz.
(000
’s)
Growing Production
$0
$50
$100
$150
$200
$250
2013 2014 2015E
US
$ (0
00’s
)
Declining Capital Investment
$0
$200
$400
$600
$800
$1,000
$1,200
$1,400
2013 2014 2015E
US
$ pe
r oun
ce
All-in Sustaining Costs
2015 Company-Wide Operational Guidance Highlights
GROWING PRODUCTION; DECLINING COSTS AND CAPITAL INVESTMENT › Production growth: up to 14%; Cash costs decline: up to 13%; Capital investment decline: up to 36%
YOUNG-DAVIDSON: GROWING PRODUCTION; DECLINING COSTS AND CAPITAL INVESTMENT › Production growth: up to 15%; U/G cash cost decrease: up to 17%; Capital investment decrease: up to 37% › Underpins growing net free cash flow stream
8

Robert Chausse, CFO

Quarter Ended Quarter Ended (in thousands, except ounces, per share amounts, and average realized price) December 31, 2014 December 31, 2013
Revenue from mining operations $71,194 $50,782
Total gold ounces sold (excluding pre-production ounces)(3) 58,649 39,855
Total gold ounces produced (excluding pre-production ounces)(3)
56,583 46,017
Adjusted operating cash flow(1) $18,367 $17,508
Adjusted operating cash flow per share, basic(1) $0.07 $0.07
Net loss ($108,259) ($106,412)
Net loss per share, basic ($0.43) ($0.43)
Adjusted net loss(2) ($9,492) ($5,484)
Adjusted net loss per share, basic(2) ($0.04) ($0.02)
Average realized gold price per ounce $1,202 $1,257
1. See the table on slide 20 for a reconciliation of adjusted operating cash flow and refer to the discussion of Non-GAAP measures in the Company’s Q4 2014 Financial Results Press Release.
2. See the table on slide 11 for a reconciliation of adjusted net earnings and refer to the discussion of Non-GAAP measures in the Company’s Q4 2014 Financial Results Press Release. 3. The Young-Davidson underground mine declared commercial production on October 31, 2013.
Financial Highlights
10

Adjusted Net Earnings Reconciliation
11
December 31, 2014
December 31, 2013
December 31, 2014
December 31, 2013
Net loss per financial statements ($108,259) ($106,412) ($169,648) ($176,770)Adjustments:
Deferred income tax expense related to foreign exchange 14,128 12,826 16,913 9,783 Foreign exchange loss 2,017 3,223 5,238 4,289 Net realizable value adjustments on inventory 16,437 37,196 23,534 42,069 Impairment charges 91,006 59,886 91,622 158,574 Unrealized and realized loss on investments - - (6,589) - Loss on retained interest royalty 3,033 - 10,825 - Loss on convertible notes tender offer - - 15,645 - Loss on corporate restructuring - - 2,716 - Gain on transfer of litigation claim - - (3,177) - Other (including tax effect of adjustments) (27,854) (12,203) (25,047) (24,893)
Adjusted net (loss) / earnings ($9,492) ($5,484) ($37,968) $13,052Adjusted net (loss) / earnings, per share ($0.04) ($0.02) ($0.15) $0.05
(in thousands, except per share metrics)
Quarter Ended Year Ended

Operational Highlights
(in thousands, except ounces, average realized prices and total cash costs)
Young-Davidson El Chanate Q4 2014 Q4 2013
Gold ounces produced 40,945 15,638 56,583 46,017
Pre-production gold ounces produced(3) - - - 3,509
Total gold ounces produced 40,945 15,638 56,583 49,526
Gold ounces sold 42,143 16,506 58,649 39,855
Pre-production gold ounces sold(3) - - - 3,416
Total gold ounces sold 42,143 16,506 58,649 43,271
Cash costs per ounce, before NRV(1),(2),(3) $719 $816 $746 $771
Revenue from mining operations $51,057 $20,137 $71,194 $50,782
1. Cash costs for the El Chanate mine and Young-Davidson mine are calculated on a per gold ounce basis, using by-product revenues as a cost credit. 2. For the three months and year ended December 31, 2014, cash costs per gold ounce are calculated using gold ounces sold at the El Chanate mine and Young-Davidson mine. For
the three months and year ended December 31, 2013, cash costs per gold ounce are calculated using gold ounces sold at the El Chanate mine and ounces produced at the Young-Davidson mine.
3. The Young-Davidson underground mine declared commercial production on October 31, 2013. Pre-production ounces produced and sold are excluded from the calculation of cash costs as they are credited against capitalized project costs.
12

Scott Perry, CEO

North American Portfolio of Quality Assets
Producing Assets in Top Mining Jurisdictions
Feasibility: Kemess Provides Significant Option Value
Pre-Feasibility: Lynn Lake JV (25%) - a Strategic Low-Risk Opportunity
Low cost assets with an organic growth profile and free cash flow stream
Young-Davidson: One of Canada’s largest underground gold mines
El Chanate: Consistent, low cost open pit mine in Mexico
Kemess: Advanced development project in B.C.
Kemess Reserve and Resource Inventory: 10.6M Aue oz.
Permitting: Kemess Underground in Phase 2 of 3 Phases
Advanced high-grade open pit gold mine in Manitoba
60% ownership by delivering a Feasibility Study
Commenced Feasibility Study
14

Appendix

2015 Operational Estimates
Gold Production (ounces) Low High
Young-Davidson 160,000 180,000
El Chanate 65,000 75,000
Total Production 225,000 255,000
Cash Costs per Ounce Young-Davidson
Underground Mine $600 $700
Historical Open Pit Stockpile Inventory (see note below) $1,100 $1,200
Young-Davidson Total $675 $775
El Chanate $675 $775
Total Cash Costs per Ounce $675 $775
Note: For cash flow purposes, cost to process historical open pit stockpile inventory is approx. $800 per ounce
All-in Sustaining Costs per Ounce Young-Davidson $950 $1,050
El Chanate $950 $1,050
Total All-in Sustaining Costs per Ounce2,3 $1,000 $1,100
Capital Investment Program ($000s) Young-Davidson
Growth Capital $40,000 $45,000
Sustaining Capital $45,000 $50,000
Total Capital Investment – Young-Davidson $85,000 $95,000
El Chanate Sustaining Capital $17,500 $20,000
Total Capital Investment – El Chanate $17,500 $20,000
Total Capital Investment $102,500 $115,000
Exploration Drilling Programs ($000s) Kemess Development Project $5,000 $10,000
Lynn Lake Development Project $5,000 $10,000
Mexico Properties $2,000 $3,000
General and Administrative ($000s)4 Corporate G&A $15,000
Crocodile Gold Royalty Asset Upfront Cash Receipt (January 2015) $17,000
Annual NSR Revenue Estimates (Payable in Quarterly Instalments) $2,500
16

Year Ended Year Ended (in thousands, except ounces, per share amounts, and average realized price) December 31, 2014 December 31, 2013
Revenue from mining operations $291,182 $227,631
Total gold ounces sold (excluding pre-production ounces)(3) 227,966 160,913
Total gold ounces produced (excluding pre-production ounces)(3)
224,032 161,100
Adjusted operating cash flow(1) $64,709 $78,079
Adjusted operating cash flow per share, basic(1) $0.26 $0.31
Net loss ($169,648) ($176,770)
Net loss per share, basic ($0.68) ($0.71)
Adjusted net (loss) / earnings(2) ($37,968) $13,052
Adjusted net (loss) / earnings per share, basic(2) ($0.15) $0.05
Average realized gold price per ounce $1,265 $1,395
1. See the table on slide 20 for a reconciliation of adjusted operating cash flow and refer to the discussion of Non-GAAP measures in the Company’s Q4 2014 Financial Results Press Release.
2. See the table on slide 11 for a reconciliation of adjusted net earnings and refer to the discussion of Non-GAAP measures in the Company’s Q4 2014 Financial Results Press Release. 3. The Young-Davidson underground mine declared commercial production on October 31, 2013.
Financial Highlights
17

Operational Highlights
(in thousands, except ounces, average realized prices and total cash costs)
Young-Davidson El Chanate 2014 2013
Gold ounces produced 156,753 67,279 224,032 161,100
Pre-production gold ounces produced(3) - - - 31,502
Total gold ounces produced 156,753 67,279 224,032 192,602
Gold ounces sold 161,591 66,375 227,966 160,913
Pre-production gold ounces sold(3) - - - 31,839
Total gold ounces sold 161,591 66,375 227,966 192,752
Cash costs per ounce, before NRV(1),(2),(3) $825 $669 $779 $676
Revenue from mining operations $204,923 $86,259 $291,182 $227,631
1. Cash costs for the El Chanate mine and Young-Davidson mine are calculated on a per gold ounce basis, using by-product revenues as a cost credit. 2. For the three months and year ended December 31, 2014, cash costs per gold ounce are calculated using gold ounces sold at the El Chanate mine and Young-Davidson mine. For
the three months and year ended December 31, 2013, cash costs per gold ounce are calculated using gold ounces sold at the El Chanate mine and ounces produced at the Young-Davidson mine.
3. The Young-Davidson underground mine declared commercial production on October 31, 2013. Pre-production ounces produced and sold are excluded from the calculation of cash costs as they are credited against capitalized project costs.
18

Capital Expenditures
(in thousands) Young-
Davidson El Chanate Corporate and Other Q4 2014 Q4 2013 2014 2013
Site infrastructure $9,609 $402 $84 $10,095 $22,134 $59,370 $123,194
Underground development
$13,304 - - $13,304 $31,937 $78,559 $102,056
Capital stripping $ - $7,601 - $7,601 $6,580 $23,505 $46,655
Pre-production revenue credits
$ - - - $ - $(4,539) $ - $(45,464)
$22,913 $8,003 $84 $31,000 $56,112 $161,434 $226,441
Capitalized borrowing costs
$ - $ - $ - $ - $867 $2,964 $5,422
Exploration $ - $686 $9,738 $10,424 $6,593 $24,431 $17,559
Total capital expenditures
$22,913 $8,689 $9,822 $41,424 $63,572 $188,829 $249,422
19

Adjusted Operating Cash Flow
December 31, 2014
December 31, 2013
December 31, 2014
December 31, 2013
Operating cash flow per financial statements $28,486 $11,954 $60,414 $63,266Add back: Non-cash change in operating working capital (10,119) 5,554 4,295 14,813
Operating cash flow (before changes in working capital) 18,367$ $17,508 $64,709 $78,079Operating cash flow (before changes in working capital), per share 0.07$ $0.07 $0.26 $0.31
(in thousands, except per share metrics)
Quarter Ended Year Ended
20