Q3 2016 Stockholder Presentation - Stock Market Insights | …€¦ · ·...
29
© 2016 AGNC Investment Corp. All Rights Reserved. Q3 2016 Stockholder Presentation October 25, 2016
Transcript of Q3 2016 Stockholder Presentation - Stock Market Insights | …€¦ · ·...
© 2016 AGNC Investment Corp. All Rights Reserved.
Q3 2016 Stockholder Presentation
October 25, 2016

Safe harbor statement under the private securities litigation reform act of 1995
2
Safe Harbor Statement
This presentation contains statements that, to the extent they are notrecitations of historical fact, constitute "forward-looking statements" withinthe meaning of the Private Securities Litigation Reform Act of 1995 (the“Reform Act”). All such forward-looking statements are intended to besubject to the safe harbor protection provided by the Reform Act. Actualoutcomes and results could differ materially from such forecasts due to theimpact of many factors beyond the control of AGNC Investment Corp.(“AGNC” or the “Company”). All forward-looking statements included in thispresentation are made only as of the date of this presentation and aresubject to change without notice. Certain important factors that could causeactual results to differ materially from those contained in the forward-looking statements are included in our periodic reports filed with theSecurities and Exchange Commission (“SEC”). Copies are available on theSEC’s website at www.sec.gov. AGNC disclaims any obligation to update suchforward-looking statements unless required by law.
The following slides contain summaries of certain financial and statisticalinformation about AGNC. They should be read in conjunction with ourperiodic reports that are filed from time to time with the SEC. Historicalresults discussed in this presentation are not indicative of future results.
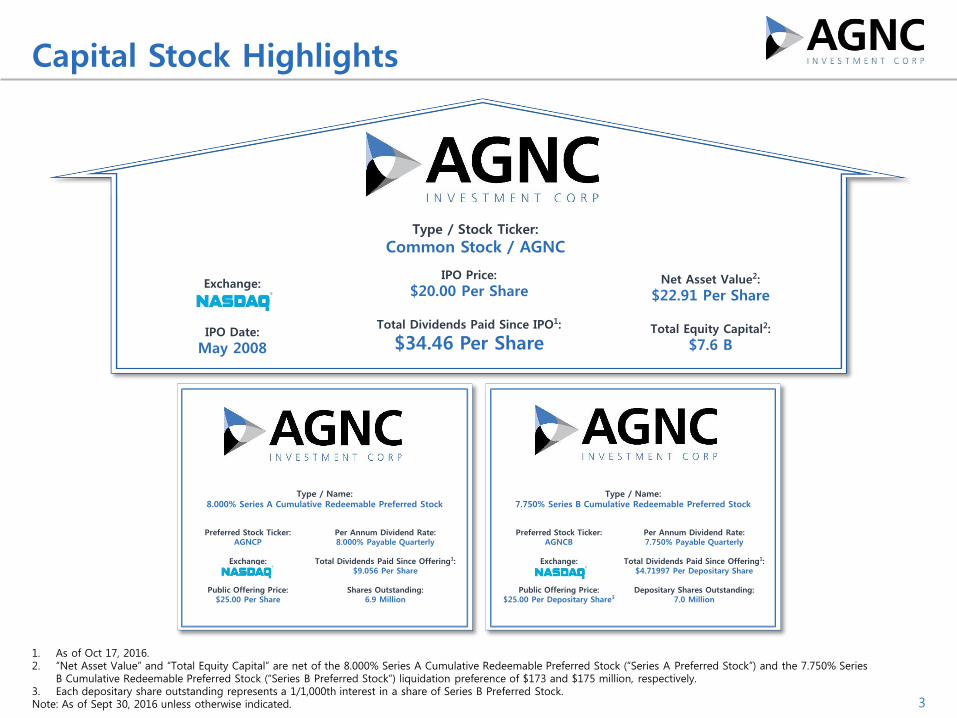
Capital Stock Highlights
1. As of Oct 17, 2016.2. “Net Asset Value” and “Total Equity Capital” are net of the 8.000% Series A Cumulative Redeemable Preferred Stock (“Series A Preferred Stock”) and the 7.750% Series
B Cumulative Redeemable Preferred Stock (“Series B Preferred Stock”) liquidation preference of $173 and $175 million, respectively.3. Each depositary share outstanding represents a 1/1,000th interest in a share of Series B Preferred Stock.Note: As of Sept 30, 2016 unless otherwise indicated. 3
Type / Name:8.000% Series A Cumulative Redeemable Preferred Stock
Preferred Stock Ticker:AGNCP
Exchange:
Public Offering Price:$25.00 Per Share
Per Annum Dividend Rate:8.000% Payable Quarterly
Total Dividends Paid Since Offering1:$9.056 Per Share
Shares Outstanding:6.9 Million
Preferred Stock Ticker:AGNCB
Exchange:
Public Offering Price:$25.00 Per Depositary Share3
Per Annum Dividend Rate:7.750% Payable Quarterly
Total Dividends Paid Since Offering1:$4.71997 Per Depositary Share
Depositary Shares Outstanding:7.0 Million
Type / Name:7.750% Series B Cumulative Redeemable Preferred Stock
Type / Stock Ticker:
Common Stock / AGNC
Exchange:
IPO Date:
May 2008
Net Asset Value2:
$22.91 Per Share
Total Equity Capital2:
$7.6 B
IPO Price:
$20.00 Per Share
Total Dividends Paid Since IPO1:
$34.46 Per Share

Note: Per share amounts included throughout this presentation are per share of common stock, unless otherwise indicated1. Represents a non-GAAP measure. Refer to the supplemental slides later in this presentation for a reconciliation and further discussion of non-GAAP measures2. Dollar roll income (loss) is based on our net long (short) TBA position and is recognized in gain (loss) on derivative instruments and other securities, net. TBA position
includes forward purchases of Agency MBS specified pools 4
Q3 2016 Highlights
$1.25 Comprehensive Income per Share, Comprised of: $1.52 net income per share
$(0.27) other comprehensive loss (“OCI”) per share
Includes net unrealized losses on investments marked-to-market through OCI
$0.64 Net Spread and Dollar Roll Income per Share, Excluding Estimated “Catch-Up” Premium Amortization Cost 1
Includes $0.16 of dollar roll income per share associated with a $10.7 B average net long position in forward purchases and sales of Agency MBS in the “to-be-announced” (“TBA”) market 2
Excludes $(0.02) of estimated “catch-up” premium amortization cost per share due to change in projected constant prepayment rate (“CPR”) estimates
$22.91 Net Book Value per Share as of Sept 30, 2016 Increased $0.69 per share, or 3.1%, from $22.22 per share as of June 30, 2016
$21.23 Tangible Net Book Value per Share as of Sept 30, 2016 Excludes $555 million, or $1.68 per share, of goodwill and other intangible assets recognized in
connection with AGNC’s acquisition of AGNC Mortgage Management, LLC (formerly known as American Capital Mortgage Management, LLC) on July 1, 2016
$0.56 Dividend Declared per Share
5.6% Economic Return on Common Equity for the Quarter, or 22.4% Annualized Comprised of $0.56 dividend per share and $0.69 increase in net book value per share

1. TBA mortgage position includes $2.6 billion of forward purchases of Agency MBS specified pools2. Tangible net book value “at risk” leverage calculated as sum of Agency MBS repurchase agreements (“Agency repo”), FHLB advances, net TBA position (at cost), net payable/receivable for
Agency securities not yet settled, and other debt divided by the sum of total stockholders’ equity less goodwill and other intangible assets, net. Leverage excludes U.S. Treasury repo3. Net interest rate spread and TBA dollar roll income calculated as the average asset yield, less average cost of funds (actual and implied). Average cost of funds includes Agency MBS repo,
TBA implied cost of funds, other debt and periodic swap interest costs. Cost of funds excludes other supplemental hedges (such as swaptions), U.S. Treasury positions and U.S. Treasuryrepurchase agreements 5
Q3 2016 Other Highlights
$62.9 B Investment Portfolio as of Sept 30, 2016
$47.2 B Agency MBS
$15.6 B TBA mortgage position 1
$0.1 B AAA non-Agency MBS and GSE credit risk transfer (“CRT”) securities
7.7x Tangible Net Book Value “At Risk” Leverage as of Sept 30, 2016 2
Unchanged from pro-forma tangible net book value “at risk” leverage as of June 30, 2016
7.6x average tangible net book value “at risk” leverage for the quarter
14.3% Portfolio CPR for the Quarter
10.6% average projected portfolio life CPR as of Sept 30, 2016, a decrease from 10.8% projected CPR as of June 30, 2016 due to portfolio repositioning
1.47% Annualized Net Interest Rate Spread and TBA Dollar Roll Income for the Quarter, Excluding Estimated “Catch-Up” Premium Amortization Cost 3
Excludes -5 bps of “catch-up” premium amortization cost due to change in projected CPR estimates
Increased from 1.38% for the prior quarter, excluding -22 bps of “catch-up” premium amortization cost

1. Note: Price information is provided for illustrative purposes only. Pricing information is as of 3:00 PM on such date, is for generic instruments and is not meant to be reflective of securities held by AGNC. Prices can vary materially depending on the source. Source: Barclays; Change in Treasury and swap prices derived from Constant Maturity Treasury and Constant Maturity Swap and DV01 from JPM
2. Source: Unweighted average of Citi, JP Morgan, Credit Suisse and Barclays daily OAS close valuations 6
Market Update
Security 9/30/15 12/31/15 3/31/16 6/30/16 9/30/16Q3 2016
∆ Rate % / Price1 Security 9/30/15 12/31/15 3/31/16 6/30/16 9/30/16Q3 2016
∆ Rate % / Price1
Treasury Rates Swap Rates
2 Yr UST 0.64% 1.06% 0.73% 0.59% 0.76% 0.17% / -0.35 2 Yr Swap 0.76% 1.17% 0.85% 0.74% 1.01% 0.27% / -0.54
3 Yr UST 0.92% 1.32% 0.86% 0.70% 0.87% 0.17% / -0.50 3 Yr Swap 0.99% 1.41% 0.96% 0.81% 1.07% 0.26% / -0.75
5 Yr UST 1.37% 1.77% 1.22% 1.01% 1.15% 0.14% / -0.68 5 Yr Swap 1.40% 1.73% 1.18% 0.99% 1.18% 0.19% / -0.94
10 Yr UST 2.06% 2.27% 1.78% 1.49% 1.61% 0.12% / -1.01 10 Yr Swap 2.01% 2.19% 1.64% 1.38% 1.46% 0.08% / -0.76
30 Yr UST 2.88% 3.01% 2.62% 2.31% 2.33% 0.02% / -0.44 30 Yr Swap 2.53% 2.62% 2.13% 1.84% 1.78% -0.06% / +1.41
15 Year Fixed Rate Mortgages 30 Year Fixed Rate Mortgages
2.50% 101.94 100.80 102.66 103.48 103.56 +0.08 3.00% 101.34 100.01 102.59 103.75 103.95 +0.20
3.00% 104.11 103.02 104.47 104.84 104.99 +0.15 3.50% 104.31 103.18 104.86 105.50 105.53 +0.03
3.50% 105.61 104.72 105.59 105.97 105.41 -0.56 4.00% 106.67 105.83 106.86 107.23 107.41 +0.18
4.00% 104.77 104.41 104.31 103.81 103.73 -0.08 4.50% 108.41 108.00 108.82 109.17 109.52 +0.35
15 Year 3.0% MBS OAS 2 30 Year 3.5% MBS OAS 2
-2.9
-3.9
1.3
7.19.6
1.0
-7.7
-12.7
-10.7
-12.0
-18.2
-14.6
-0.8
9.2
16.0
9.75.4
-25
-15
-5
5
15
25
35
Qtrly Avg. 15 Yr 3.0% OAS Avg. 15 Yr 3.0% OAS
-4.4
-8.5
1.2
9.8
21.2
14.9 15.112.8
10.4
-0.4
-8.0
3.3
15.7
24.1 25.9
19.0
12.2
-25
-15
-5
5
15
25
35
Qtrly Avg. 30 Yr 3.5% OAS Avg. 30 Yr 3.5% OAS
Note: Amounts may not total due to rounding1. Wtd/avg actual 1 mth annualized CPR released at the beginning of the mth based on the securities held as of the preceding mth-end, excluding net TBA position2. Lower balance (“LB”) loans defined as pools backed by original loan balances of up to $150K. Wtd/avg original loan balance of $97 K for ≤15-year and $100 K for 30-year securities as of Sept 30,
20163. HARP defined as pools backed by 100% refinance loans with original LTVs ≥ 80%. Wtd/avg original LTV of 113% for ≤ 15-year and 135% for 30-year securities as of Sept 30, 20164. WALA represents the weighted average loan age presented in mths, excluding net TBA position5. Average projected life CPR as of Sept 30, 2016, excluding net TBA position6. Includes $2.6 billion of forward purchases of Agency MBS specified pools
7
Q3 2016 Portfolio UpdateAs of 9/30/16
$62.9 B Portfolio
MBS ($47.4 B, 75%) & Net TBA Position ($15.6 B, 25%)
As of 6/30/16
$61.5 B Portfolio
MBS ($54.5 B, 89%) & Net TBA Position ($7.1 B, 11%)AGNC Actual CPR 1
≤15 Year - $16.2 B Portfolio (26% of Total) as of 9/30/16 30 Year - $44.1 B Portfolio (70% of Total) as of 9/30/16
($ In Millions)
Coupon FMV %% LB /
HARP 2,3 WALA 4
Oct ‘161 M Actual
CPR 1
LifeForecast CPR 5
($ in Millions)
Coupon FMV %% LB /
HARP 2,3 WALA 4
Oct ‘161 M Actual
CPR 1
LifeForecast CPR 5
2.5% $3,323 20% 41% 47 11% 10% ≤ 3.0% $2,783 6% 5% 40 14% 8%
3.0% 3,528 22% 79% 52 14% 11% 3.5% 15,978 36% 81% 36 13% 9%
3.5% 3,724 23% 91% 60 14% 12% 4.0% 10,384 24% 91% 42 18% 11%
≥ 4.0% 3,367 21% 90% 70 16% 13% ≥ 4.5% 1,643 4% 87% 72 20% 13%
≤ 15 Year MBS 13,942 86% 76% 57 14% 11% 30 Year MBS 30,788 70% 78% 40 15% 10%
Net Long TBA 2,306 14% N/A N/A N/A N/A Net Long TBA 6 13,280 30% N/A N/A N/A N/A
Total ≤ 15 Year $16,248 100% N/A N/A N/A N/A Total 30 Year $44,068 100% N/A N/A N/A N/A
11%13%
14%13%
16%15%
0%
2%
4%
6%
8%
10%
12%
14%
16%
18%
5/1/16 6/1/16 7/1/16 8/1/16 9/1/16 10/1/16

Our financing position is very strong, with significant access to attractive funding across a wide range of counterparties and financing terms
8
Financing Summary
Weighted average agency repo cost totaled 0.83% as of Sept 30, 2016, compared to 0.78% as of June 30, 2016
38 repo counterparties as of Sept 30, 2016
Agency repo weighted average days to maturity totaled 199 days as of Sept 30, 2016, compared to 202 days as of June 30, 2016
FHLB advances totaled $3.0 B with a weighted average maturity of 123 days as of Sept 30, 2016 ²
1. Table excludes Treasury repurchase agreements of $45 M and $10 M associated with U.S. Treasury positions as of Sept 30, 2016 and June 30, 2016, respectively, and$0.5 B of debt of consolidated VIE’s as of Sept 30, 2016 and June 30, 2016
2. On January 12, 2016, the Federal Housing Finance Agency ("FHFA") released its final rule on FHLB membership, which requires the termination of the Company'scaptive insurance subsidiary's FHLB membership and repayment of all FHLB advances after a one year period ending in February 2017
Agency Repurchase Agreements 1
As of Sept 30, 2016
Maturity %
Amount
($ MM)
Interest
Rate
Avg. Days
to Maturity
≤ 3 Mths 70% $26,516 0.75% 25
> 3 to ≤ 6 10% 3,617 0.90% 126
> 6 to ≤ 9 2% 765 0.85% 221
> 9 to ≤ 12 2% 615 0.95% 309
> 1 to ≤ 3 Yrs 8% 3,085 1.13% 649
> 3 to ≤ 5 8% 3,025 1.18% 1,321
Total / Wtd Avg 100% $37,623 0.83% 1990
As of June 30, 2016
Total / Wtd Avg 100% $41,937 0.78% 202
Mortgage Funding 1
As of Sept 30, 2016
%Amount($ MM)
Interest
Rate
Avg. Days
to Maturity
Agency Repo 67% $37,623 0.83% 199
FHLB Advances 2 5% 3,037 0.63% 123
Total Bal. Sheet - Mortgage Funding 72% 40,660 0.82% 193
TBA Dollar Roll - Mortgage Funding 28% 15,540 N/A N/A
Total Mortgage Funding 100% $56,200 N/A N/A0
As of June 30, 2016
Total Mortgage Funding 100% $51,949 N/A N/A

Source: Bloomberg, Credit Suisse and management estimates.1. Represents monthly average of generic Agency 3 month repo cost relative to 3 month LIBOR
Generic Repo Cost Spread to LIBOR 1
9
Our Funding Outlook Has Improved
Money Market Fund Assets
$1.5
$1.0
($ trillions)
$2.0
$0.6
(bps)
Recent money market reform has caused a shift from prime funds to government funds
Since mid-2015, government funds have gained approximately $1 trillion in assets, while prime funds have lost a corresponding amount
The shift to government assets is supportive of the Agency MBS repo market and thus favorable to AGNC’s business model
Agency MBS funding costs have decreased substantially relative to LIBOR
Within the past year, the spread differential between the cost of Agency repo and LIBOR has decreased over 30 bps to a negative spread of approximately 7 bps as of Sept 2016

Source: Bloomberg. 10
Quantifying AGNC’s Funding Improvement
Favorable funding dynamics have benefited AGNC’s overall cost of funds on the portion of our debt that is hedged with pay fixed swaps
$34.2 billion notional pay fixed swaps as of Sept 30, 2016
AGNC’s weighted average repo cost relative to 3-month LIBOR has improved by approximately 15 bps from the historical average
As a result, the spread differential between AGNC’s weighted average repo cost and the floating rate receive leg of our pay fixed swaps narrowed to 5 bps in the 3rd
quarter
Changes in the receive floating leg occur gradually as swaps reset
AGNC Repo Cost Spread to Swap Receive RateAGNC Repo Cost Spread to LIBOR
(bps)(bps)
Average
Pay Repo Rate
Receive Floating LIBOR
Funding Differential
Spread: 20 bps
Spread: 5 bps

11
Hedging Summary
Our interest rate hedge portfolio totaled $42.7 B and covered 75% of our funding liabilities (repo, FHLB advances, other debt and net TBA position) as of Sept 30, 2016, compared to 79% as of June 30, 2016
Interest Rate Swaps $34.2 B notional pay fixed swaps as of Sept 30,
2016
$2.4 B of swaps added during the quarter
$3.4 B of swaps terminated or expired during the quarter
Covered 60% of funding liabilities as of Sept 30, 2016
Payer Swaptions $0.7 B notional payer swaptions
Decrease of $0.4 B from prior quarter
U.S. Treasury Securities and Futures $7.9 B net short treasury position market value
Increase of $2.4 B from June 30, 2016
1. Duration is a model estimate of interest rate sensitivity measured in years as of a point in time2. Net hedge gains/losses exclude periodic swap costs and TBA dollar roll income/loss (both components of net spread income) and mark-to-market gains/losses on our net TBA dollar roll position3. Total duration is expressed in the asset unit equivalent4. Notional amount includes forward starting swaps of $2.2 B and $2.7 B as of Sept 30 and June 30, 2016, respectively, with an average forward start date of 0.5 and 0.7 years, respectively, and an average maturity of 6.8 and
7.1 years from Sept 30 and June 30, 2016, respectively 5. Weighted average pay rate includes forward starting swaps. Excluding forward starting swaps, the weighted average pay rate was 1.40% and 1.51% as of Sept 30 and June 30, 2016, respectively6. Weighted average receive rate excludes forward starting swaps7. Average maturity includes forwarding starting swaps
Hedge Portfolio SummaryAs of Sept 30, 2016
$ in MM
Notional/
Market Value
9/30/2016
Duration
9/30/2016 1
Net Hedge Gains/
(Losses)Q3 2016 2
Net Hedge Gains/
(Losses) Per Share
Q3 2016
Interest Rate Swaps $(34,150) (3.3) $211 $0.64
Payer Swaptions (700) (0.8) (1) --
U.S. Treasuries (7,878) (5.8) 30 0.09
Total / Q3 2016 3 $(42,728) (2.6) $240 $0.73
0
As of June 30, 2016 / Q2 2016
Total / Q2 2016 3 $(41,656) (2.8) $(395) $(1.19)
Interest Rate SwapsAs of Sept 30, 2016
Years to Maturity
Notional
Amount
($ MM) 4Pay
Rate 5
Receive
Rate 6
Average
Maturity (Years) 7
≤ 3 Years $19,025 1.05% 0.79% 1.4
> 3 to ≤ 5 5,050 1.55% 0.76% 3.5
> 5 to ≤ 7 7,075 2.23% 0.76% 5.8
> 7 to ≤ 10 1,825 2.46% 0.83% 8.6
> 10 1,175 3.20% 0.80% 14.0
Total / Wtd Avg $34,150 1.52% 0.78% 3.5
As of June 30, 2016
Total / Wtd Avg $35,125 1.64% 0.64% 4.0

We do not eliminate interest rate risk or lock in a particular net interest margin, but we instead seek to maintain our net book value within reasonable bands over a range of interest rate scenarios
12
Duration Risk
1. Duration is a model estimate of interest rate sensitivity measured in years as of a point in time. The sensitivity analysis assumes an instantaneous parallel shift ininterest rates and, consequently, does not include the potential impact of ongoing portfolio rebalancing actions
2. Durations are expressed in years. Liability and hedge durations are expressed in asset unit equivalents3. Mortgage assets include net TBA position. 15-year MBS position includes 20-year fixed rate MBS, AAA non-agency MBS, CRT, ARMs and CMOs
Duration Gap Sensitivity 1,2
As of Sept 30, 2016
Rates Duration Rates
- 100 bps 9/30/2016 + 100 bps
Mortgage Assets: 3
30-Year MBS 1.4 3.2 5.3
15-Year MBS 1.4 2.6 3.5
Total Mortgage Assets 1.4 3.0 4.7
Liabilities and Hedges (2.8) (2.7) (2.6)
Net Duration Gap (1.4) 0.3 2.1
As of June 30, 2016
Net Duration Gap (1.5) 0.0 1.8
Note: For additional detail, refer to endnotes on slide 14. AGNC data as of Sept 30, 2016 unless otherwise noted.Source: Company SEC filings and SNL Financial. 13
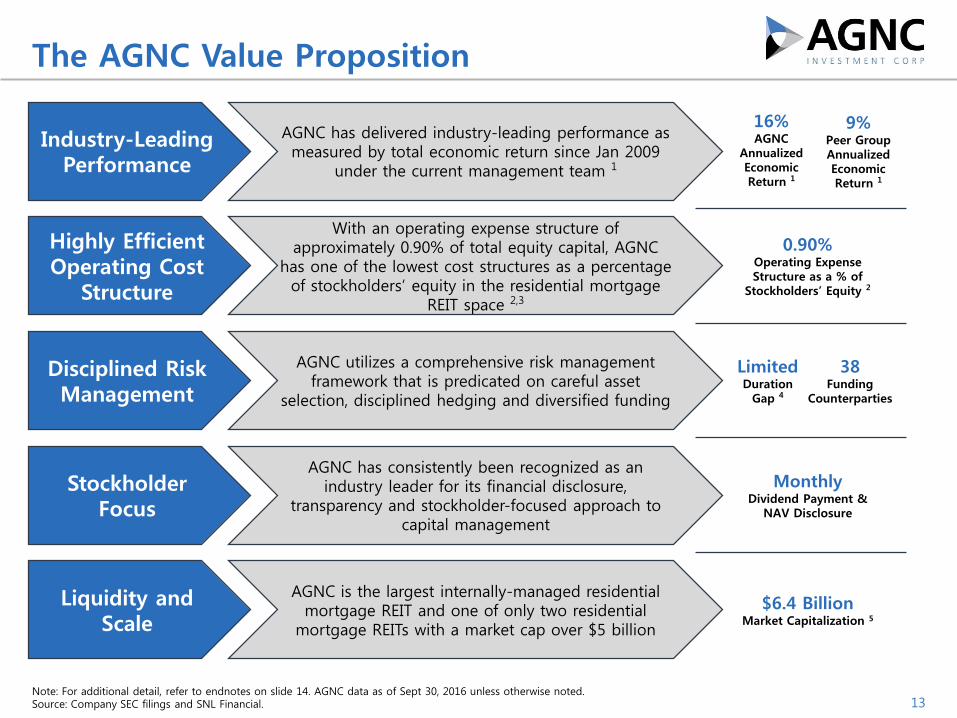
The AGNC Value Proposition
Industry-Leading Performance
Highly Efficient Operating Cost
Structure
Disciplined Risk Management
Stockholder Focus
Liquidity and Scale
AGNC has delivered industry-leading performance as measured by total economic return since Jan 2009
under the current management team 1
9%Peer Group Annualized Economic Return 1
16%AGNC
Annualized Economic Return 1
0.90%Operating Expense Structure as a % of
Stockholders’ Equity 2
MonthlyDividend Payment &
NAV Disclosure
$6.4 BillionMarket Capitalization 5
LimitedDuration
Gap 4
38Funding
Counterparties
With an operating expense structure of approximately 0.90% of total equity capital, AGNC
has one of the lowest cost structures as a percentage of stockholders’ equity in the residential mortgage
REIT space 2,3
AGNC utilizes a comprehensive risk management framework that is predicated on careful asset
selection, disciplined hedging and diversified funding
AGNC is the largest internally-managed residential mortgage REIT and one of only two residential
mortgage REITs with a market cap over $5 billion
AGNC has consistently been recognized as an industry leader for its financial disclosure,
transparency and stockholder-focused approach to capital management

Endnotes to slide 13
14
Endnotes
1) Annualized economic return measured from Dec 31, 2008 through June 30, 2016. Total economic return represents the changein net book value (“net asset value” or “NAV”) per common share and dividends declared on common stock during the periodover the beginning NAV per common share. For agency-focused residential mortgage REIT peer comparison purposes, AGNC’speer group is comprised of ANH, ARR, CMO, CYS and NLY.
2) AGNC’s operating expense structure projection is based on total stockholders’ equity as of Sep 30, 2016 and excludesnonrecurring transaction-related charges (including retention or stay bonuses), other one-time or transitionary expenses, andnon-cash expenses, such as non-cash amortization charges, associated with the internalization transaction. Projection alsoexcludes the net economic benefit associated with receipt of the MTGE management fee and incremental G&A expensesassociated with AGNC’s management of MTGE that will be reimbursed by MTGE.
3) Mortgage REIT universe comprised of AJX, ANH, ARR, CHMI, CIM, CMO, CYS, DX, EARN, IVR, MFA, MITT, MTGE, NLY, NRZ,NYMT, OAKS, ORC, PMT, RWT, TWO and WMC. Mortgage REIT cost structures based on last twelve months’ operatingexpenses and average stockholders’ equity over the same period as publicly reported by such REITs. Operating costs includeexpenses for compensation and benefits, management fees and G&A and may include one-time or nonrecurring expenses.Operating costs exclude direct costs such as loan acquisition costs, securitization costs, servicing expenses, etc. to the extentpublicly disclosed by such REITs.
4) The duration of an asset or liability measures how much its price is expected to change if interest rates move in a parallelmanner; it is a model estimate and is measured in years as of a point in time. Duration gap is a measure of the difference inthe interest rate exposure, or estimated price sensitivity, of our assets and our liabilities (including hedges). AGNC uses a riskmanagement system and models provided by BlackRock Solutions to generate these calculations and as a tool for helping usto measure other exposures, including exposure to larger interest rate moves and yield curve changes. The inputs and resultsfrom these models are not audited by our independent auditors.
5) Market capitalization as of Oct 19, 2016.

Financial Results

1. TBAs are reported in derivative assets/liabilities in the above balance sheet at their net carrying value (fair value less cost basis)2. Tangible net book value “at risk” leverage is calculated as sum of Agency MBS repurchase agreements, FHLB advances, net payable/receivable for Agency MBS not yet settled, net TBA dollar roll position (at cost)
and debt of consolidated variable interest entities (“other debt”) divided by the sum of total stockholders’ equity less goodwill and other intangible assets, net and the fair value of investments in REIT equitysecurities. Tangible “at risk” leverage excludes U.S. Treasury repurchase agreements of $45 M, $10 M, $0, $25 M and $0.5 B as of Sept, Jun 30, Mar 31, 2016 and Dec 31 and Sept 30, 2015, respectively
3. Tangible Net book value per common share calculated as stockholders’ equity, less goodwill and other intangible assets, net and the Series A and Series B Preferred Stock liquidation preference, divided by totalcommon shares outstanding 16
Balance Sheets($ in millions, except per share data, unaudited except 12/31/15) 9/30/16 6/30/16 3/31/16 12/31/15 9/30/15
Agency Securities, at Fair Value $46,328 $53,418 $54,950 $51,331 $53,729
Agency Securities Transferred to Consolidated Variable Interest Entities, at Fair Value 890 945 993 1,029 1,088
Non-Agency Securities, at Fair Value 102 107 112 113 --
Agency Credit Risk Transfer Securities, at Fair Value 36 -- -- -- --
U.S. Treasury Securities, at Fair Value 45 62 -- 25 787
REIT Equity Securities, at Fair Value -- 19 38 33 34
Cash and Cash Equivalents 1,254 1,131 1,109 1,110 1,505
Restricted Cash 681 1,399 1,686 1,281 1,413
Derivative Assets, at Fair Value 61 111 55 81 143
Receivable for Securities Sold 228 -- -- -- 147
Receivable under Reverse Repurchase Agreements 5,441 2,982 3,163 1,713 1,463
Goodwill and Other Intangible Assets, Net 555 -- -- -- --
Other Assets 268 301 290 305 300
Total Assets $55,889 $60,475 $62,396 $57,021 $60,609
Repurchase Agreements $37,668 $41,947 $45,276 $41,754 $41,014
Federal Home Loan Bank Advances 3,037 3,037 3,037 3,753 3,502
Debt of Consolidated Variable Interest Entities, at Fair Value 494 528 562 595 626
Payable for Securities Purchased 251 2,581 889 182 4,178
Derivative Liabilities, at Fair Value 947 1,519 1,652 935 1,536
Dividends Payable 66 73 73 74 76
Obligation to Return Securities Borrowed under Reverse Repurchase Agreements, at Fair Value 5,424 3,017 3,175 1,696 1,309
Accounts Payable and Other Accrued Liabilities 71 71 72 61 52
Total Liabilities 47,958 52,773 54,736 49,050 52,293
Preferred Equity at Aggregate Liquidation Preference 348 348 348 348 348
Common Equity 7,583 7,354 7,312 7,623 7,968
Total Stockholders’ Equity 7,931 7,702 7,660 7,971 8,316
Total Liabilities and Stockholders’ Equity $55,889 $60,475 $62,396 $57,021 $60,609
Other Supplemental Data:
Net TBA Long, at Fair Value 1 $15,586 $7,072 $6,024 $7,444 $7,385
Tangible Net Book Value “At Risk” Leverage 2 7.7x 7.2x 7.3x 6.8x 6.8x
Tangible Net Book Value Per Common Share 3 $21.23 $22.22 $22.09 $22.59 $23.00

Note: Amounts may not total due to rounding 17
Income Statements
($ in millions, except per share data) (Unaudited) Q3 2016 Q2 2016 Q1 2016 Q4 2015 Q3 2015
Interest Income $315 $318 $295 $374 $295
Interest Expense (96) (101) (99) (86) (77)
Net Interest Income 219 217 196 288 218
Gain (Loss) on Sale of Agency Securities, Net 61 55 (2) 2 (39)
Gain (Loss) on Derivative Instruments and Other Securities, Net 242 (367) (933) 331 (778)
Management Fee Income 4 -- -- -- --
Total Other Gain (Loss), Net 307 (312) (935) 333 (817)
Management Fee Expense -- (25) (27) (28) (29)
Compensation and Benefits (9) -- -- -- --
Other Operating Expenses (6) (15) (6) (5) (5)
Total Operating Expenses (15) (40) (33) (33) (34)
Net Income (Loss) 511 (135) (772) 588 (633)
Dividend on Preferred Stock (7) (7) (7) (7) (7)
Net Income (Loss) Available (Attributable) to Common Stockholders $504 $(142) $(779) $581 $(640)
Net Income (Loss) $511 $(135) $(772) $588 $(633)
Unrealized Gain (Loss) on Available-for-Sale Securities, Net (97) 370 765 (583) 467
Unrealized Gain on Derivative Instruments, Net 7 12 19 22 24
Other Comprehensive Income (Loss) (90) 382 784 (561) 491
Comprehensive Income (Loss) 421 247 12 27 (142)
Dividend on Preferred Stock (7) (7) (7) (7) (7)
Comprehensive Income (Loss) Available (Attributable) to Common Stockholders $414 $240 $5 $20 $(149)
Weighted Average Common Shares Outstanding – Basic and Diluted 331.0 331.0 334.4 341.6 347.8
Net Income (Loss) per Common Share $1.52 $(0.43) $(2.33) $1.70 $(1.84)
Comprehensive Income (Loss) per Common Share $1.25 $0.73 $0.01 $0.06 $(0.43)
Dividends Declared per Common Share $0.56 $0.60 $0.60 $0.60 $0.60

Note: Amounts may not total due to rounding1. Table includes non-GAAP financial measures. Please refer to additional information regarding non-GAAP financial measures at the end of this presentation2. We voluntarily discontinued hedge accounting under GAAP as of Sept 30, 2011. Accumulated OCI on de-designated interest rate swaps is being amortized on a straight-line basis over the remaining swap terms into
interest expense. All other periodic interest costs, termination fees and mark-to-market adjustments associated with interest rate swaps are reported in other income (loss), net pursuant to GAAP3. Other interest rate swap periodic costs represent periodic interest costs on the Company’s interest rate swap portfolio in excess of amortized amounts reclassified from accumulated OCI into interest expense. Other
interest rate swap periodic costs exclude interest rate swap termination fees and mark-to-market adjustments on interest rate swaps4. Reported in gain (loss) on derivative instruments and other securities, net in the accompanying income statement 18
Reconciliation of GAAP Net Interest Income to Net Spread and Dollar Roll Income ¹($ in millions, except per share data) (Unaudited) Q3 2016 Q2 2016 Q1 2016 Q4 2015 Q3 2015
Interest Income $315 $318 $295 $374 $295
Interest Expense:
Repurchase Agreements and Other Debt (89) (89) (80) (64) (53)
Interest Rate Swap Periodic Costs 2 (7) (12) (19) (22) (24)
Interest Expense (96) (101) (99) (86) (77)
Net Interest Income 219 217 196 288 218
Other Interest Rate Swap Periodic Costs 3,4 (51) (69) (89) (102) (107)
TBA Dollar Roll Income, Net 4 54 44 50 53 73
Dividend on REIT Equity Securities 4 -- 1 1 1 1
Management Fee Income 4 -- -- -- --
Adjusted Net Interest and Dollar Roll Income 226 193 158 240 185
Operating Expenses:
Total Operating Expenses (15) (40) (33) (33) (34)
Less Non-Recurring Transaction Costs -- 9 -- -- --
Adjusted Total Operating Expenses (15) (31) (33) (33) (34)
Net Spread and Dollar Roll Income 211 162 125 207 151
Dividend on Preferred Stock (7) (7) (7) (7) (7)
Net Spread and Dollar Roll Income Available to Common Stockholders 204 155 118 200 144
Estimated “Catch Up” Premium Amortization Cost (Benefit) due to Change in CPR Forecast 8 32 55 (14) 33
Net Spread and Dollar Roll Income, Excluding “Catch Up” Amortization, Available to Common Stockholders
$212 $187 $173 $186 $177
Weighted Average Common Shares Outstanding – Basic and Diluted 331.0 331.0 334.4 341.6 347.8
Net Spread and Dollar Roll Income per Common Share $0.62 $0.46 $0.36 $0.58 $0.41
Net Spread and Dollar Roll Income, Excluding “Catch Up” Amortization, per Common Share
$0.64 $0.56 $0.52 $0.54 $0.51
Amounts may not total due to rounding
1. Table includes non-GAAP financial measures. Please refer to information regarding non-GAAP financial measures at the end of this presentation
2. Capital losses in excess of capital gains are not deductible from ordinary taxable income, but may be carried forward for up to five years and applied against future net capital gains. As of Sept 30, 2016, $0.4 B of netcapital losses were available through Dec 2018 19
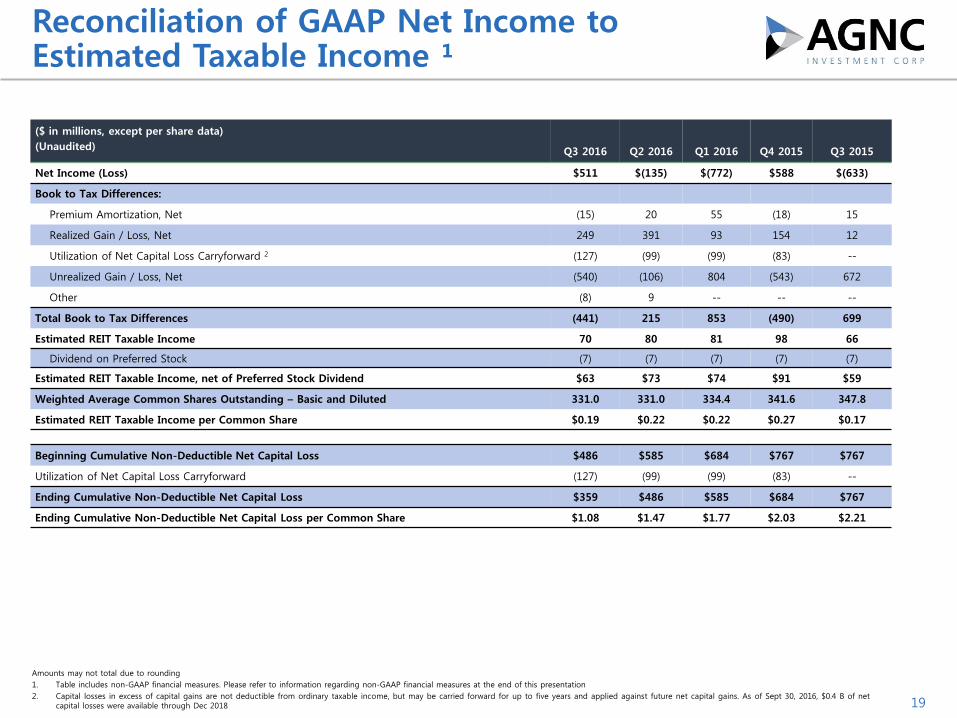
Reconciliation of GAAP Net Income to Estimated Taxable Income ¹
($ in millions, except per share data)
(Unaudited) Q3 2016 Q2 2016 Q1 2016 Q4 2015 Q3 2015
Net Income (Loss) $511 $(135) $(772) $588 $(633)
Book to Tax Differences:
Premium Amortization, Net (15) 20 55 (18) 15
Realized Gain / Loss, Net 249 391 93 154 12
Utilization of Net Capital Loss Carryforward 2 (127) (99) (99) (83) --
Unrealized Gain / Loss, Net (540) (106) 804 (543) 672
Other (8) 9 -- -- --
Total Book to Tax Differences (441) 215 853 (490) 699
Estimated REIT Taxable Income 70 80 81 98 66
Dividend on Preferred Stock (7) (7) (7) (7) (7)
Estimated REIT Taxable Income, net of Preferred Stock Dividend $63 $73 $74 $91 $59
Weighted Average Common Shares Outstanding – Basic and Diluted 331.0 331.0 334.4 341.6 347.8
Estimated REIT Taxable Income per Common Share $0.19 $0.22 $0.22 $0.27 $0.17
Beginning Cumulative Non-Deductible Net Capital Loss $486 $585 $684 $767 $767
Utilization of Net Capital Loss Carryforward (127) (99) (99) (83) --
Ending Cumulative Non-Deductible Net Capital Loss $359 $486 $585 $684 $767
Ending Cumulative Non-Deductible Net Capital Loss per Common Share $1.08 $1.47 $1.77 $2.03 $2.21
Amounts may not total due to rounding
1. Common equity is net of the Company’s Series A and Series B Preferred Stock liquidation preference 20
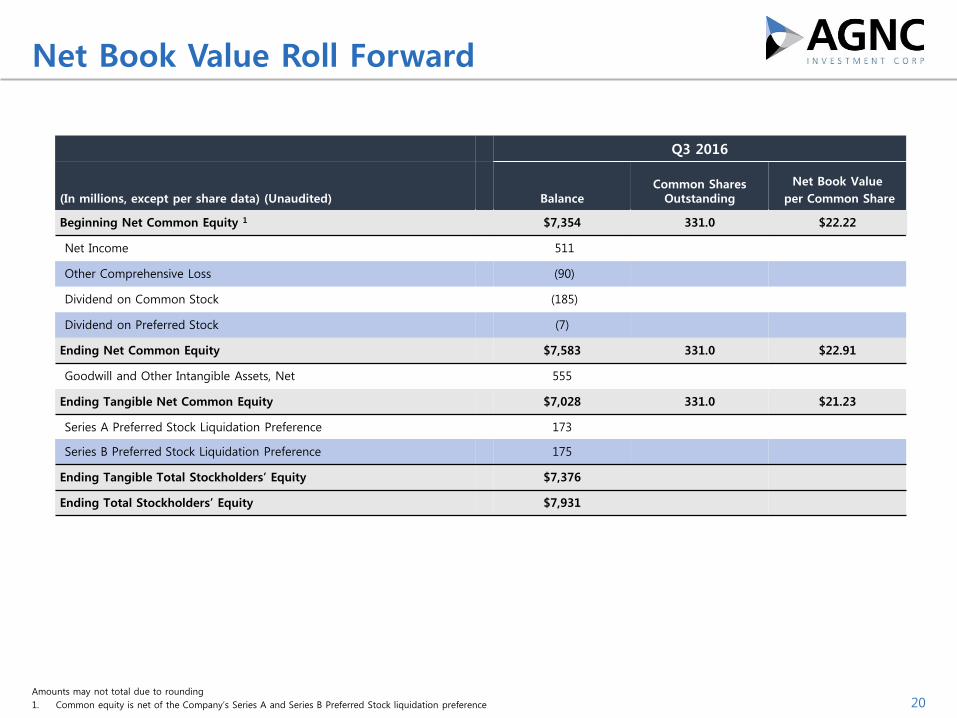
Net Book Value Roll Forward
Q3 2016
(In millions, except per share data) (Unaudited) BalanceCommon Shares
Outstanding
Net Book Value
per Common Share
Beginning Net Common Equity 1 $7,354 331.0 $22.22
Net Income 511
Other Comprehensive Loss (90)
Dividend on Common Stock (185)
Dividend on Preferred Stock (7)
Ending Net Common Equity $7,583 331.0 $22.91
Goodwill and Other Intangible Assets, Net 555
Ending Tangible Net Common Equity $7,028 331.0 $21.23
Series A Preferred Stock Liquidation Preference 173
Series B Preferred Stock Liquidation Preference 175
Ending Tangible Total Stockholders’ Equity $7,376
Ending Total Stockholders’ Equity $7,931

Supplemental Slides
$62.2 $59.9 $62.1 $61.5 $62.9
$54.8 $52.5 $56.1 $54.5 $47.4
$7.4 $7.4
$6.0 $7.1 $15.6
$-
$10.0
$20.0
$30.0
$40.0
$50.0
$60.0
$70.0
$80.0
9/30/15 12/31/15 3/31/16 6/30/16 9/30/16
MBS TBA
96%
87%83%
79%75%
0%
20%
40%
60%
80%
100%
$0
$10
$20
$30
$40
$50
$60
$70
9/30/15 12/31/15 3/31/16 6/30/16 9/30/16
Swaps Payer Swaptions Treasury, Net % Hedge Ratio
1. MBS includes Agency MBS, AAA non-agency MBS and GSE credit risk transfer securities2. TBA includes forward purchase’s of Agency MBS specified pools. Amount is net of short TBA position3. Tangible net book value “at risk” leverage includes the components of “at risk” leverage with stockholders equity adjusted to exclude goodwill and other intangible assets, net4. “At risk” leverage calculated as sum of Agency MBS repurchase agreements, FHLB advances, net payable/receivable for Agency MBS not yet settled, TBA dollar roll position (at cost) and other
debt divided by the sum of total stockholders’ equity less the fair value of investments in REIT equity securities. Leverage excludes U.S. Treasury repurchase agreements of $45 M, $10 M, $0,$25 M and $0.5 B as of Sept 30, June 30 and Mar 31, 2016 and Dec 31 and Sept 30, 2015, respectively
5. Measured as the ratio of interest rate swaps, swaptions and net U.S. Treasury position over repo agreements, FHLB advances, other debt and net TBA position, at cost 22
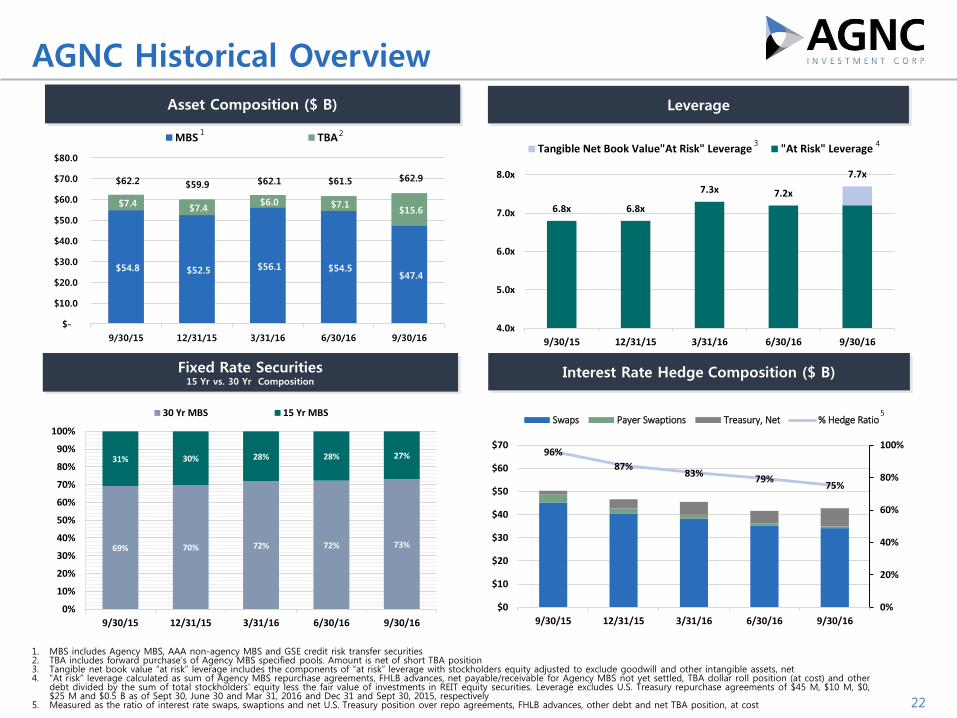
AGNC Historical Overview
Asset Composition ($ B) Leverage
Fixed Rate Securities15 Yr vs. 30 Yr Composition
Interest Rate Hedge Composition ($ B)
69% 70% 72% 72% 73%
31% 30% 28% 28% 27%
0%
10%
20%
30%
40%
50%
60%
70%
80%
90%
100%
9/30/15 12/31/15 3/31/16 6/30/16 9/30/16
30 Yr MBS 15 Yr MBS
7.7x
6.8x 6.8x
7.3x 7.2x
4.0x
5.0x
6.0x
7.0x
8.0x
9/30/15 12/31/15 3/31/16 6/30/16 9/30/16
Tangible Net Book Value"At Risk" Leverage "At Risk" Leverage
1 23 4
5

1. Tangible net book value per common share excludes goodwill and other intangible assets, net 2. Economic return represents the change in NAV per share plus dividends declared. 23
AGNC Historical Overview
Comprehensive Income per Share Dividend per Share
Net Book Value per Share Economic Return 2
$0.54
$(0.94)$(0.73)
$1.43
$(1.84)
$1.70
$(2.33)
$(0.43)
$1.52
-$3.00
-$2.50
-$2.00
-$1.50
-$1.00
-$0.50
$0.00
$0.50
$1.00
$1.50
$2.00
Q3-14 Q4-14 Q1-15 Q2-15 Q3-15 Q4-15 Q1-16 Q2-16 Q3-16
$25.54 $25.74 $25.53 $24.00
$23.00 $22.59 $22.09 $22.22 $22.91
$21.23
$0
$5
$10
$15
$20
$25
$30
Net Book Value Tangible Net Book Value
-0.3%
3.4%
1.7%
-3.6%
-1.7%
0.8% 0.4%
3.3%
5.6%
-6%
-4%
-2%
0%
2%
4%
6%
8%
$0.65 $0.66 $0.66 $0.62 $0.60 $0.60 $0.60 $0.60
$0.56
$-
$0.10
$0.20
$0.30
$0.40
$0.50
$0.60
$0.70
$0.80
Q3-14 Q4-14 Q1-15 Q2-15 Q3-15 Q4-15 Q1-16 Q2-16 Q3-16
1

1.44% 1.39%1.28%
1.43%
1.70%1.60% 1.64%
1.46%1.32%
0.0%
0.5%
1.0%
1.5%
2.0%
Q3-14 Q4-14 Q1-15 Q2-15 Q3-15 Q4-15 Q1-16 Q2-16 Q3-16
Repo/FHLB Swaps
24
AGNC Historical Overview
Average Asset Yield(Excludes “Catch-up” Premium Amortization and TBAs)
Average Cost of Funds(Excludes TBAs)
Net Interest Rate Spread(Excludes “Catch-up” Premium Amortization)
Net Spread and TBA Dollar Roll Income per Common Share(Excludes “Catch-up” Premium Amortization)
$0.86 $0.92
$0.70
$0.60
$0.51 $0.54 $0.52
$0.56
$0.64
$-
$0.20
$0.40
$0.60
$0.80
$1.00
$1.20
Q3-14 Q4-14 Q1-15 Q2-15 Q3-15 Q4-15 Q1-16 Q2-16 Q3-16
2.73% 2.76% 2.70% 2.69% 2.69% 2.76% 2.75% 2.70% 2.66%
1.0%
1.5%
2.0%
2.5%
3.0%
3.5%
Q3-14 Q4-14 Q1-15 Q2-15 Q3-15 Q4-15 Q1-16 Q2-16 Q3-16
1.29%1.37%
1.42%
1.26%
0.99%
1.16%1.11%
1.24%1.34%
1.91%1.99%
1.65%
1.50%
1.36% 1.38%1.31%
1.38%1.47%
0.5%
0.7%
0.9%
1.1%
1.3%
1.5%
1.7%
1.9%
2.1%
Q3-14 Q4-14 Q1-15 Q2-15 Q3-15 Q4-15 Q1-16 Q2-16 Q3-16
W/out TBAs W/ TBAs
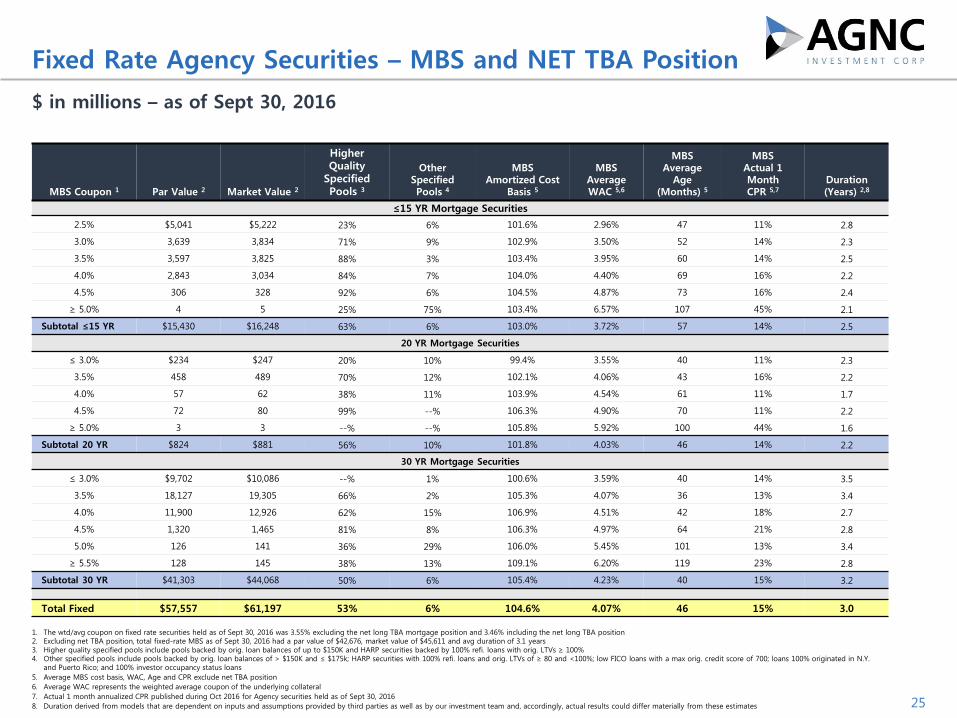
$ in millions – as of Sept 30, 2016
25
Fixed Rate Agency Securities – MBS and NET TBA Position
1. The wtd/avg coupon on fixed rate securities held as of Sept 30, 2016 was 3.55% excluding the net long TBA mortgage position and 3.46% including the net long TBA position2. Excluding net TBA position, total fixed-rate MBS as of Sept 30, 2016 had a par value of $42,676, market value of $45,611 and avg duration of 3.1 years3. Higher quality specified pools include pools backed by orig. loan balances of up to $150K and HARP securities backed by 100% refi. loans with orig. LTVs ≥ 100%4. Other specified pools include pools backed by orig. loan balances of > $150K and ≤ $175k; HARP securities with 100% refi. loans and orig. LTVs of ≥ 80 and <100%; low FICO loans with a max orig. credit score of 700; loans 100% originated in N.Y.
and Puerto Rico; and 100% investor occupancy status loans
5. Average MBS cost basis, WAC, Age and CPR exclude net TBA position
6. Average WAC represents the weighted average coupon of the underlying collateral
7. Actual 1 month annualized CPR published during Oct 2016 for Agency securities held as of Sept 30, 2016
8. Duration derived from models that are dependent on inputs and assumptions provided by third parties as well as by our investment team and, accordingly, actual results could differ materially from these estimates
MBS Coupon 1 Par Value 2 Market Value 2
Higher Quality
Specified Pools 3
Other Specified Pools 4
MBSAmortized Cost
Basis 5
MBSAverage WAC 5,6
MBSAverage
Age(Months) 5
MBSActual 1 MonthCPR 5,7
Duration(Years) 2,8
≤15 YR Mortgage Securities
2.5% $5,041 $5,222 23% 6% 101.6% 2.96% 47 11% 2.8
3.0% 3,639 3,834 71% 9% 102.9% 3.50% 52 14% 2.3
3.5% 3,597 3,825 88% 3% 103.4% 3.95% 60 14% 2.5
4.0% 2,843 3,034 84% 7% 104.0% 4.40% 69 16% 2.2
4.5% 306 328 92% 6% 104.5% 4.87% 73 16% 2.4
≥ 5.0% 4 5 25% 75% 103.4% 6.57% 107 45% 2.1
Subtotal ≤15 YR $15,430 $16,248 63% 6% 103.0% 3.72% 57 14% 2.5
20 YR Mortgage Securities
≤ 3.0% $234 $247 20% 10% 99.4% 3.55% 40 11% 2.3
3.5% 458 489 70% 12% 102.1% 4.06% 43 16% 2.2
4.0% 57 62 38% 11% 103.9% 4.54% 61 11% 1.7
4.5% 72 80 99% --% 106.3% 4.90% 70 11% 2.2
≥ 5.0% 3 3 --% --% 105.8% 5.92% 100 44% 1.6
Subtotal 20 YR $824 $881 56% 10% 101.8% 4.03% 46 14% 2.2
30 YR Mortgage Securities
≤ 3.0% $9,702 $10,086 --% 1% 100.6% 3.59% 40 14% 3.5
3.5% 18,127 19,305 66% 2% 105.3% 4.07% 36 13% 3.4
4.0% 11,900 12,926 62% 15% 106.9% 4.51% 42 18% 2.7
4.5% 1,320 1,465 81% 8% 106.3% 4.97% 64 21% 2.8
5.0% 126 141 36% 29% 106.0% 5.45% 101 13% 3.4
≥ 5.5% 128 145 38% 13% 109.1% 6.20% 119 23% 2.8
Subtotal 30 YR $41,303 $44,068 50% 6% 105.4% 4.23% 40 15% 3.2
Total Fixed $57,557 $61,197 53% 6% 104.6% 4.07% 46 15% 3.0

26
Repo Counterparty Credit Risk
Our repo funding is well diversified by counterparty and geography
Less than 5% of our equity at risk with any one counterparty
Less than 12% of our equity at risk with top 5 counterparties
Note: All figures as of Sept 30, 2016 1. Excludes FHLB advances and other debt in connection with the consolidation of a structured transaction under GAAP2. Counterparty exposure with regard to Agency collateral pledged under repo agreements. Amounts do not include exposure with regard to collateral pledged under
derivative agreements, prime brokerage agreements and other debt
Counterparty Region
Counterparty Rank
Counterparty Exposure as a% of NAV 1,2
NorthAmerica
1 4.8%2 2.0%3 1.6%4 1.4%5 1.3%
6-19 7.7%
Asia
1 1.3%2 0.9%3 0.8%4 0.7%5 0.3%
Europe
1 2.0%2 1.5%3 0.9%4 0.7%5 0.7%
6-13 1.7%
Total Exposure 30.3%
Top 5 Exposure 11.9%
Counterparty Region
Number of Counterparties
Percent of Agency Repo
Funding
North America
20 63%
Asia 5 12%
Europe 13 25%
Total 38 100%

27
Other Hedge and Derivative Instruments
U.S. Treasury Position $5.4 B net short U.S. Treasury securities $2.5 B short U.S Treasury futures
Payer Swaptions
$0.7 B notional payer swaptions as of Sept 30, 2016
$0.4 B payer swaptions expired during the quarter
0.4 year average remaining option term, 7.0 years average underlying swap term
TBA Mortgages $15.6 B net long position market value 1
U.S. Treasury PositionAs of Sept 30, 2016 ($ MM)
Maturity
Face Amount
Net Long / (Short)
Market Value
Net Long / (Short)
5 Year $(2,400) $(2,575)
7 Year (2,941) (2,959)
10 Year (1,930) (2,344)
Total $(7,271) $(7,878)
As of June 30, 2016
Total $(4,828) $(5,481)
1. Includes $2.6 billion of forward purchases of Agency MBS specified pools
Payer SwaptionsAs of Sept 30, 2016 ($ in MM)
Years to Expiration
Notional
Amount Cost
Market
Value
Pay
Rate
Swap Term
(Years)
≤ 1 Year $700 $44 $6 3.10% 7.0
As of June 30, 2016
Total / Wtd Avg $1,050 $55 $7 3.38% 6.7
Net TBA Position As of Sept 30, 2016 ($ MM)
TermFace Amount
Net Long / (Short)
Market Value
Net Long / (Short)
15 Year $2,227 $2,306
30 Year 1 12,654 13,280
Total $14,881 $15,586
As of June 30, 2016
Total $6,756 $7,072

Changes in interest rates and changes in MBS spreads relative to Treasury and swap rates can impact the market value of our equity
28
NAV Sensitivity to Rates and MBS Spreads
Interest Rate Sensitivity Interest rate sensitivity is the sensitivity
of our assets to changes in interest rates
The estimated change in the market value of our asset portfolio, net of hedges, incorporates the dual effects of both duration and convexity and assumes no portfolio rebalancing actions
MBS Spread Sensitivity (“Basis Risk”) The MBS spread sensitivity is the
sensitivity of our assets to changes in MBS spreads
Our estimated spread sensitivity is based on model predictions and assumes a spread duration of 4.5 years, which is based on interest rates and MBS prices as of Sept 30, 2016
The spread sensitivity is also sensitive to interest rates and increases as interest rates rise and prepayments slow
1. Interest rate and MBS spread sensitivity are derived from models that are dependent on inputs and assumptions provided by third parties as well as by ourinvestment team and, accordingly, actual results could differ materially from these estimates
2. Estimated dollar change in value expressed as a percentage of the total market value of “at risk” assets3. Estimated change as a percentage of NAV incorporates the impact of leverage
Interest Rate Sensitivity 1
As of Sept 30, 2016
(based on instantaneous parallel shift in interest rates)
Interest Rate Shock (bps)
Estimated Change in Portfolio
Market Value 2
Estimated Change as a % of NAV 3
-100 -0.6% -5.3%
-50 -0.1% -0.8%
+50 -0.4% -3.4%
+100 -1.3% -10.5%
MBS Spread Sensitivity (“Basis Risk”) 1
As of Sept 30, 2016
MBS SpreadShock (bps)
Estimated Change in Portfolio
Market Value 2
Estimated Change as a% of NAV 3
-25 1.1% 9.3%
-10 0.5% 3.7%
+10 -0.5% -3.7%
+25 -1.1% -9.3%

29
Use of Non-GAAP Financial Information
In addition to the results presented in accordance with GAAP, our results of operations discussed in this presentation include certain non-GAAP financial information, including “adjusted net interest expense,” “net spread and dollar roll income,” “net spread and dollar rollincome, excluding ‘catch-up’ premium amortization,” “estimated taxable income" and the related per common share measures and certainfinancial metrics derived from such non-GAAP information, such as “cost of funds” and “net interest rate spread.”
“Adjusted net interest expense” is measured as interest expense (GAAP measure) adjusted to include other interest rate swap periodiccosts. “Net spread and dollar roll income” is measured as (i) net interest income (GAAP measure) adjusted to include other interest rateswap periodic costs, TBA dollar roll income, dividends on REIT equity securities and management fee income (referred to as “adjusted netinterest and dollar roll income”) less (ii) total operating expenses (GAAP measure) adjusted to exclude non-recurring transaction costs(referred to as “adjusted operating expenses”). “Net spread and dollar roll income, excluding ‘catch-up’ premium amortization,” furtherexcludes retrospective “catch-up” adjustments to premium amortization cost or benefit due to changes in projected CPR estimates.
By providing users of our financial information with such measures in addition to the related GAAP measures, we believe users will havegreater transparency into the information used by our management in its financial and operational decision-making. We also believe thatit is important for users of our financial information to consider information related to our current financial performance without theeffects of certain measures that are not necessarily indicative of our current investment portfolio performance and operations.
Specifically, in the case of “adjusted net interest and dollar roll income,” we believe the inclusion of TBA dollar roll income is meaningfulas TBAs, which are accounted for under GAAP as derivative instruments with gains and losses recognized in other gain (loss) in ourstatement of operations, are economically equivalent to holding and financing generic agency MBS using short-term repurchaseagreements. Similarly, we believe that the inclusion of periodic interest rate swap settlements in such measure and in “adjusted netinterest expense,” which are recognized under GAAP in other gain (loss), is meaningful as interest rate swaps are the primary instrumentwe use to economically hedge against fluctuations in our borrowing costs and inclusion of all periodic interest rate swap settlement cost ismore indicative of our total cost of funds than interest expense alone. In the case of “net spread and dollar roll income, excluding ‘catch-up’ premium amortization,” we believe the exclusion of “catch-up” adjustments to premium amortization cost or benefit is meaningful asit excludes the cumulative effect from prior reporting periods due to current changes in future prepayment expectations and, therefore,exclusion of such cost or benefit is more indicative of the current earnings potential of our investment portfolio. We also believe theexclusion of non-recurring transactions costs reported in operating expense under GAAP is meaningful as they represent non-recurringtransaction costs associated with our acquisition of AGNC Mortgage Management, LLC (formerly known as American Capital MortgageManagement, LLC) and are not representative of ongoing operating costs. In the case of estimated taxable income, we believe it ismeaningful information as it is directly related to the amount of dividends we are required to distribute in order to maintain our REITqualification status.
However, because such measures are incomplete measures of our financial performance and involve differences from results computed inaccordance with GAAP, they should be considered as supplementary to, and not as a substitute for, results computed in accordance withGAAP. In addition, because not all companies use identical calculations, our presentation of such non-GAAP measures may not becomparable to other similarly-titled measures of other companies. Furthermore, estimated taxable income can include certain informationthat is subject to potential adjustments up to the time of filing our income tax returns, which occurs after the end of our fiscal year.
A reconciliation of GAAP net interest income to non-GAAP “net spread and dollar roll income, excluding ‘catch-up’ premium amortization”and a reconciliation of GAAP net income to non-GAAP “estimated taxable income” is included in this presentation.