Q3-2016 FS - cgi.com · Title: Q3-2016 FS Author: CGI Group Inc. Subject: Investors Created Date:...
18
Interim Condensed Consolidated Financial Statements of CGI GROUP INC. For the three and nine months ended June 30, 2016 and 2015 (unaudited)
-
Upload
truongcong -
Category
Documents
-
view
214 -
download
0
Transcript of Q3-2016 FS - cgi.com · Title: Q3-2016 FS Author: CGI Group Inc. Subject: Investors Created Date:...

Interim Condensed Consolidated Financial Statements of
CGI GROUP INC.
For the three and nine months ended June 30, 2016 and 2015 (unaudited)

Interim Consolidated Statements of EarningsFor the three and nine months ended June 30(in thousands of Canadian dollars, except per share data) (unaudited)
CGI Group Inc. – Interim Condensed Consolidated Financial Statements for the three and nine months ended June 30, 2016 and 2015 1
Three months ended June 30 Nine months ended June 302016 2015 2016 2015
$ $ $ $
Revenue 2,667,109 2,559,358 8,100,835 7,701,821Operating expenses
Costs of services, selling and administrative 2,277,982 2,189,462 6,933,836 6,616,283Restructuring costs (Note 4) — — 29,100 —Net finance costs 18,059 20,822 60,803 68,873Foreign exchange (gain) loss (1,365) (1,283) 1,767 7,194
2,294,676 2,209,001 7,025,506 6,692,350Earnings before income taxes 372,433 350,357 1,075,329 1,009,471Income tax expense (Note 5) 98,600 93,120 281,048 264,804Net earnings 273,833 257,237 794,281 744,667Earnings per share (Note 7C)Basic earnings per share 0.91 0.82 2.60 2.39Diluted earnings per share 0.89 0.80 2.53 2.31

Interim Consolidated Statements of Comprehensive IncomeFor the three and nine months ended June 30 (in thousands of Canadian dollars) (unaudited)
CGI Group Inc. – Interim Condensed Consolidated Financial Statements for the three and nine months ended June 30, 2016 and 2015 2
Three months ended June 30 Nine months ended June 302016 2015 2016 2015
$ $ $ $
Net earnings 273,833 257,237 794,281 744,667Items that will be reclassified subsequently to net earnings (net of incometaxes):
Net unrealized (losses) gains on translating financial statements of foreignoperations (189,279) 70,299 (371,756) 195,248
Net gains (losses) on derivative financial instruments and on translatinglong-term debt designated as hedges of net investments in foreignoperations 20,390 15,210 49,164 (124,773)
Net unrealized gains (losses) on cash flow hedges 378 (6,300) (14,532) 16,591Net unrealized gains (losses) on available-for-sale investments 329 (828) 225 1,089
Items that will not be reclassified subsequently to net earnings (net of incometaxes):
Net remeasurement (losses) gains on defined benefit plans (9,903) 26,271 (6,634) 432Other comprehensive (loss) income (178,085) 104,652 (343,533) 88,587Comprehensive income 95,748 361,889 450,748 833,254
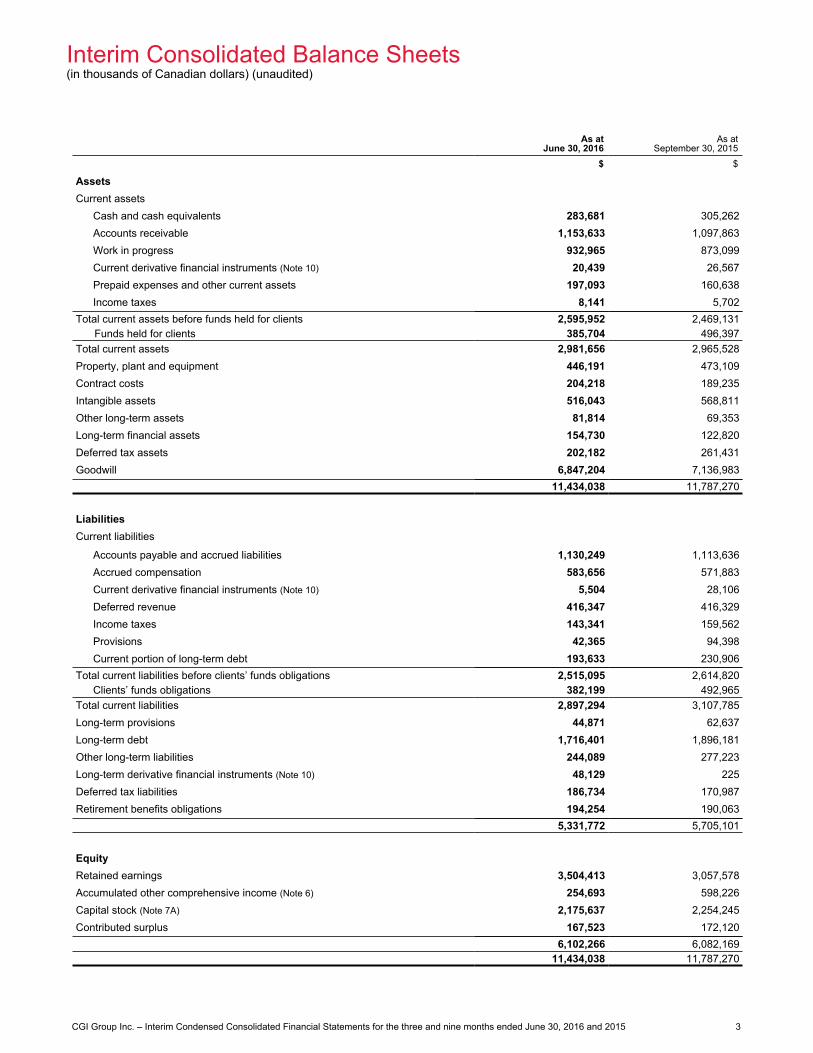
Interim Consolidated Balance Sheets(in thousands of Canadian dollars) (unaudited)
CGI Group Inc. – Interim Condensed Consolidated Financial Statements for the three and nine months ended June 30, 2016 and 2015 3
As atJune 30, 2016
As at September 30, 2015
$ $
AssetsCurrent assets
Cash and cash equivalents 283,681 305,262Accounts receivable 1,153,633 1,097,863Work in progress 932,965 873,099Current derivative financial instruments (Note 10) 20,439 26,567Prepaid expenses and other current assets 197,093 160,638Income taxes 8,141 5,702
Total current assets before funds held for clients 2,595,952 2,469,131Funds held for clients 385,704 496,397
Total current assets 2,981,656 2,965,528Property, plant and equipment 446,191 473,109Contract costs 204,218 189,235Intangible assets 516,043 568,811Other long-term assets 81,814 69,353Long-term financial assets 154,730 122,820Deferred tax assets 202,182 261,431Goodwill 6,847,204 7,136,983
11,434,038 11,787,270
LiabilitiesCurrent liabilities
Accounts payable and accrued liabilities 1,130,249 1,113,636Accrued compensation 583,656 571,883Current derivative financial instruments (Note 10) 5,504 28,106Deferred revenue 416,347 416,329Income taxes 143,341 159,562Provisions 42,365 94,398Current portion of long-term debt 193,633 230,906
Total current liabilities before clients’ funds obligations 2,515,095 2,614,820Clients’ funds obligations 382,199 492,965
Total current liabilities 2,897,294 3,107,785Long-term provisions 44,871 62,637Long-term debt 1,716,401 1,896,181Other long-term liabilities 244,089 277,223Long-term derivative financial instruments (Note 10) 48,129 225Deferred tax liabilities 186,734 170,987Retirement benefits obligations 194,254 190,063
5,331,772 5,705,101
EquityRetained earnings 3,504,413 3,057,578Accumulated other comprehensive income (Note 6) 254,693 598,226Capital stock (Note 7A) 2,175,637 2,254,245Contributed surplus 167,523 172,120
6,102,266 6,082,16911,434,038 11,787,270

Interim Consolidated Statements of Changes in EquityFor the nine months ended June 30 (in thousands of Canadian dollars) (unaudited)
CGI Group Inc. – Interim Condensed Consolidated Financial Statements for the three and nine months ended June 30, 2016 and 2015 4
Retainedearnings
Accumulated other
comprehensive income
Capital stock
Contributedsurplus
Total equity
$ $ $ $ $
Balance as at September 30, 2015 3,057,578 598,226 2,254,245 172,120 6,082,169
Net earnings 794,281 — — — 794,281Other comprehensive loss — (343,533) — — (343,533)Comprehensive income 794,281 (343,533) — — 450,748Share-based payment costs — — — 24,606 24,606Income tax impact associated with stock options — — — 10,161 10,161Exercise of stock options (Note 7A) — — 92,311 (18,114) 74,197Exercise of performance share units (“PSUs”) (Note 7A) — — 21,250 (21,250) —Repurchase of Class A subordinate shares (Note 7A) (347,446) — (170,374) — (517,820)Purchase of Class A subordinate shares held in trust (Note 7A) — — (21,795) — (21,795)Balance as at June 30, 2016 3,504,413 254,693 2,175,637 167,523 6,102,266
Retainedearnings
Accumulated other
comprehensive income
Capital stock
Contributedsurplus
Total equity
$ $ $ $ $
Balance as at September 30, 2014 2,356,008 228,624 2,246,197 157,896 4,988,725
Net earnings 744,667 — — — 744,667Other comprehensive income — 88,587 — — 88,587Comprehensive income 744,667 88,587 — — 833,254Share-based payment costs — — — 21,827 21,827Income tax impact associated with stock options — — — 5,695 5,695Exercise of stock options (Note 7A) — — 57,827 (11,398) 46,429Exercise of PSUs (Note 7A) — — 8,668 (8,668) —Repurchase of Class A subordinate shares (Note 7A) (78,724) — (15,304) — (94,028)Purchase of Class A subordinate shares held in trust (Note 7A) — — (11,099) — (11,099)Balance as at June 30, 2015 3,021,951 317,211 2,286,289 165,352 5,790,803

Interim Consolidated Statements of Cash FlowsFor the three and nine months ended June 30 (in thousands of Canadian dollars) (unaudited)
CGI Group Inc. – Interim Condensed Consolidated Financial Statements for the three and nine months ended June 30, 2016 and 2015 5
Three months ended June 30 Nine months ended June 302016 2015 2016 2015
$ $ $ $
Operating activitiesNet earnings 273,833 257,237 794,281 744,667Adjustments for:
Amortization and depreciation 98,854 102,378 301,675 316,479Deferred income taxes 41,216 41,328 66,424 52,477Foreign exchange gain (1,029) (2,225) (755) (3,100)Share-based payment costs 6,876 4,701 24,606 21,827
Net change in non-cash working capital items (Note 8) (68,072) (189,329) (254,963) (294,350)Cash provided by operating activities 351,678 214,090 931,268 838,000
Investing activitiesBusiness acquisitions — — (38,442) —Purchase of property, plant and equipment (40,711) (22,239) (123,938) (90,018)Proceeds from sale of property, plant and equipment 7,486 — 9,274 15,255Additions to contract costs (29,840) (19,766) (73,829) (51,212)Additions to intangible assets (26,760) (15,666) (72,161) (50,653)Purchase of long-term investments (2,188) (2,725) (12,128) (8,235)Proceeds from sale of long-term investments 2,086 — 29,629 3,719Payments received from long-term receivables — 1,329 164 3,356Cash used in investing activities (89,927) (59,067) (281,431) (177,788)
Financing activitiesNet change in unsecured committed revolving credit facility (150,000) — — —Increase of long-term debt 12,132 4,962 34,479 39,606Repayment of long-term debt (22,116) (21,299) (200,412) (820,400)Settlement of derivative financial instruments — — (24,057) (98,322)Purchase of Class A subordinate shares held in trust (Note 7A) — — (21,795) (11,099)Repurchase of Class A subordinate shares (Note 7A) — (94,028) (527,286) (94,028)Issuance of Class A subordinate shares 21,218 4,679 74,240 46,672Cash used in financing activities (138,766) (105,686) (664,831) (937,571)Effect of foreign exchange rate changes on cash and cash equivalents (8,223) (8,148) (6,587) 6,339Net increase (decrease) in cash and cash equivalents 114,762 41,189 (21,581) (271,020)Cash and cash equivalents, beginning of period 168,919 223,506 305,262 535,715Cash and cash equivalents, end of period 283,681 264,695 283,681 264,695
Supplementary cash flow information (Note 8).
Notes to the Interim Condensed Consolidated Financial StatementsFor the three and nine months ended June 30, 2016 and 2015(tabular amounts only are in thousands of Canadian dollars, except per share data) (unaudited)
CGI Group Inc. – Interim Condensed Consolidated Financial Statements for the three and nine months ended June 30, 2016 and 2015 6
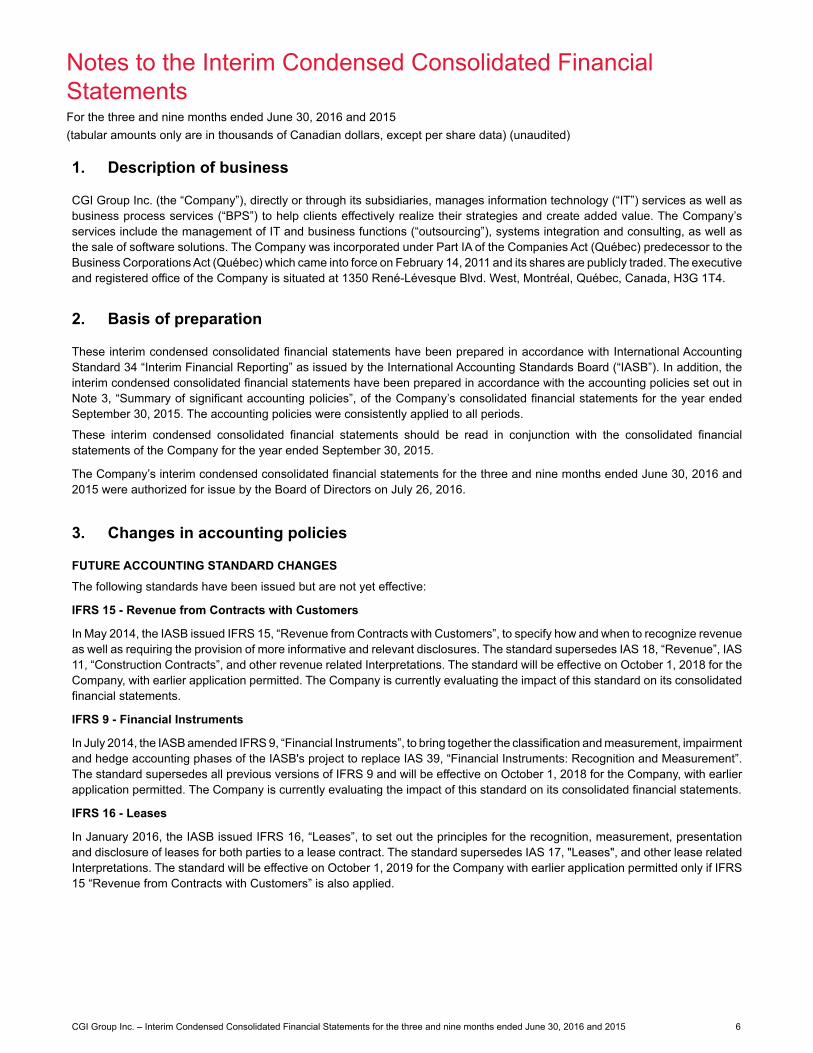
1. Description of business
CGI Group Inc. (the “Company”), directly or through its subsidiaries, manages information technology (“IT”) services as well as business process services (“BPS”) to help clients effectively realize their strategies and create added value. The Company’s services include the management of IT and business functions (“outsourcing”), systems integration and consulting, as well as the sale of software solutions. The Company was incorporated under Part IA of the Companies Act (Québec) predecessor to the Business Corporations Act (Québec) which came into force on February 14, 2011 and its shares are publicly traded. The executive and registered office of the Company is situated at 1350 René-Lévesque Blvd. West, Montréal, Québec, Canada, H3G 1T4.
2. Basis of preparation
These interim condensed consolidated financial statements have been prepared in accordance with International Accounting Standard 34 “Interim Financial Reporting” as issued by the International Accounting Standards Board (“IASB”). In addition, the interim condensed consolidated financial statements have been prepared in accordance with the accounting policies set out in Note 3, “Summary of significant accounting policies”, of the Company’s consolidated financial statements for the year ended September 30, 2015. The accounting policies were consistently applied to all periods.
These interim condensed consolidated financial statements should be read in conjunction with the consolidated financial statements of the Company for the year ended September 30, 2015.
The Company’s interim condensed consolidated financial statements for the three and nine months ended June 30, 2016 and 2015 were authorized for issue by the Board of Directors on July 26, 2016.
3. Changes in accounting policies
FUTURE ACCOUNTING STANDARD CHANGES
The following standards have been issued but are not yet effective:
IFRS 15 - Revenue from Contracts with Customers
In May 2014, the IASB issued IFRS 15, “Revenue from Contracts with Customers”, to specify how and when to recognize revenue as well as requiring the provision of more informative and relevant disclosures. The standard supersedes IAS 18, “Revenue”, IAS 11, “Construction Contracts”, and other revenue related Interpretations. The standard will be effective on October 1, 2018 for the Company, with earlier application permitted. The Company is currently evaluating the impact of this standard on its consolidated financial statements.
IFRS 9 - Financial Instruments
In July 2014, the IASB amended IFRS 9, “Financial Instruments”, to bring together the classification and measurement, impairment and hedge accounting phases of the IASB's project to replace IAS 39, “Financial Instruments: Recognition and Measurement”. The standard supersedes all previous versions of IFRS 9 and will be effective on October 1, 2018 for the Company, with earlier application permitted. The Company is currently evaluating the impact of this standard on its consolidated financial statements.
IFRS 16 - Leases
In January 2016, the IASB issued IFRS 16, “Leases”, to set out the principles for the recognition, measurement, presentation and disclosure of leases for both parties to a lease contract. The standard supersedes IAS 17, "Leases", and other lease related Interpretations. The standard will be effective on October 1, 2019 for the Company with earlier application permitted only if IFRS 15 “Revenue from Contracts with Customers” is also applied.
Notes to the Interim Condensed Consolidated Financial StatementsFor the three and nine months ended June 30, 2016 and 2015(tabular amounts only are in thousands of Canadian dollars, except per share data) (unaudited)
CGI Group Inc. – Interim Condensed Consolidated Financial Statements for the three and nine months ended June 30, 2016 and 2015 7
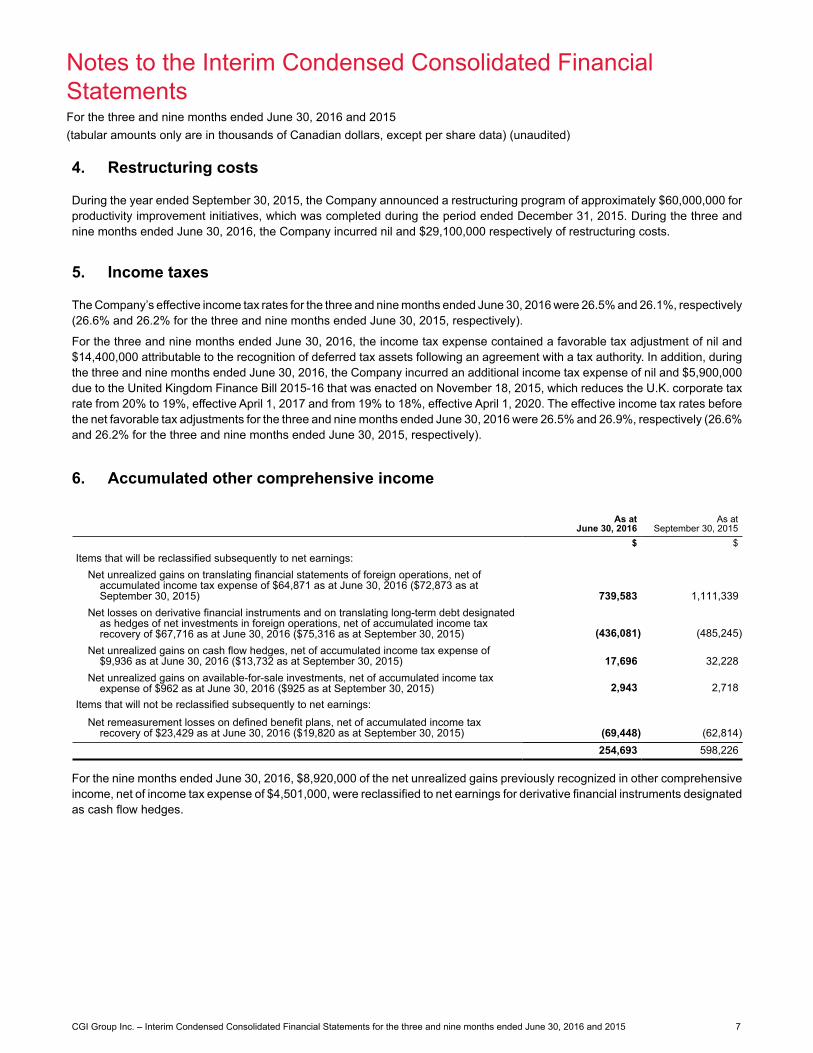
4. Restructuring costs
During the year ended September 30, 2015, the Company announced a restructuring program of approximately $60,000,000 for productivity improvement initiatives, which was completed during the period ended December 31, 2015. During the three and nine months ended June 30, 2016, the Company incurred nil and $29,100,000 respectively of restructuring costs.
5. Income taxes
The Company’s effective income tax rates for the three and nine months ended June 30, 2016 were 26.5% and 26.1%, respectively (26.6% and 26.2% for the three and nine months ended June 30, 2015, respectively).
For the three and nine months ended June 30, 2016, the income tax expense contained a favorable tax adjustment of nil and $14,400,000 attributable to the recognition of deferred tax assets following an agreement with a tax authority. In addition, during the three and nine months ended June 30, 2016, the Company incurred an additional income tax expense of nil and $5,900,000 due to the United Kingdom Finance Bill 2015-16 that was enacted on November 18, 2015, which reduces the U.K. corporate tax rate from 20% to 19%, effective April 1, 2017 and from 19% to 18%, effective April 1, 2020. The effective income tax rates before the net favorable tax adjustments for the three and nine months ended June 30, 2016 were 26.5% and 26.9%, respectively (26.6% and 26.2% for the three and nine months ended June 30, 2015, respectively).
6. Accumulated other comprehensive income
As atJune 30, 2016
As at
September 30, 2015$ $
Items that will be reclassified subsequently to net earnings:Net unrealized gains on translating financial statements of foreign operations, net of
accumulated income tax expense of $64,871 as at June 30, 2016 ($72,873 as atSeptember 30, 2015) 739,583 1,111,339
Net losses on derivative financial instruments and on translating long-term debt designatedas hedges of net investments in foreign operations, net of accumulated income taxrecovery of $67,716 as at June 30, 2016 ($75,316 as at September 30, 2015) (436,081) (485,245)
Net unrealized gains on cash flow hedges, net of accumulated income tax expense of$9,936 as at June 30, 2016 ($13,732 as at September 30, 2015) 17,696 32,228
Net unrealized gains on available-for-sale investments, net of accumulated income taxexpense of $962 as at June 30, 2016 ($925 as at September 30, 2015) 2,943 2,718
Items that will not be reclassified subsequently to net earnings:
Net remeasurement losses on defined benefit plans, net of accumulated income taxrecovery of $23,429 as at June 30, 2016 ($19,820 as at September 30, 2015) (69,448) (62,814)
254,693 598,226
For the nine months ended June 30, 2016, $8,920,000 of the net unrealized gains previously recognized in other comprehensive income, net of income tax expense of $4,501,000, were reclassified to net earnings for derivative financial instruments designated as cash flow hedges.

Notes to the Interim Condensed Consolidated Financial StatementsFor the three and nine months ended June 30, 2016 and 2015(tabular amounts only are in thousands of Canadian dollars, except per share data) (unaudited)
CGI Group Inc. – Interim Condensed Consolidated Financial Statements for the three and nine months ended June 30, 2016 and 2015 8
7. Capital stock, share-based payments and earnings per share
A) CAPITAL STOCK
Class A subordinate shares Class B shares Total
NumberCarrying
value NumberCarrying
value NumberCarrying
value$ $ $
As at September 30, 2015 275,773,284 2,207,826 33,272,767 46,419 309,046,051 2,254,245Issued upon exercise of stock options1 4,358,669 92,311 — — 4,358,669 92,311PSUs exercised2 — 21,250 — — — 21,250Repurchased and cancelled3 (9,519,875) (170,374) — — (9,519,875) (170,374)Purchased and held in trust4 — (21,795) — — — (21,795)Conversion of shares5 420,019 586 (420,019) (586) — —As at June 30, 2016 271,032,097 2,129,804 32,852,748 45,833 303,884,845 2,175,637
1 The carrying value of Class A subordinate shares includes $18,114,000 ($11,398,000 as at June 30, 2015), which corresponds to a reduction in contributed surplus representing the value of accumulated compensation costs associated with the stock options exercised during the period.
2 During the nine months ended June 30, 2016, 969,241 PSUs (316,857 during the nine months ended June 30, 2015) were exercised with a recorded value of $21,250,000 ($8,668,000 as at June 30, 2015) that was removed from contributed surplus. As at June 30, 2016, 1,192,308 Class A subordinate shares were held in trust under the PSU plan (1,719,827 as at June 30, 2015) (Note 7B).
3 On January 27, 2016, the Company’s Board of Directors authorized the renewal of the Normal Course Issuer Bid (“NCIB”) for the purchase of up to 21,425,992 Class A subordinate shares for cancellation on the open market through the Toronto Stock Exchange (“TSX”). The Class A subordinate shares are available for purchase commencing February 11, 2016 until no later than February 3, 2017, or on such earlier date when the Company completes its purchases or elects to terminate the bid.
During the nine months ended June 30, 2016, the Company repurchased 7,112,375 Class A subordinate shares from the Caisse de dépôt et placement du Québec for a cash consideration of $400,000,000. The excess of the purchase price over the carrying value in the amount of $247,893,000 was charged to retained earnings. In accordance with the requirements of TSX, the repurchase is considered in the annual aggregate limit that the Company is entitled to repurchase under its current NCIB. In addition, during the nine months ended June 30, 2016, the Company repurchased 2,207,500 Class A subordinate shares under the previous NCIB for cash consideration of $117,820,000 and the excess of the purchase price over the carrying value in the amount of $99,553,000 was charged to retained earnings. During the nine months ended June 30, 2015 the Company repurchased 1,875,333 Class A subordinate shares under the previous NCIB for cash consideration of $94,028,000 and the excess of the purchase price over the carrying value in the amount of $78,724,000 was charged to retained earnings.
As of September 30, 2015, 200,000 of repurchased Class A subordinate shares with a carrying value of $1,631,000 and a purchase value of $9,466,000 were held by the Company and were paid and cancelled during the nine months ended June 30, 2016 under the previous NCIB.
4 The trustee, in accordance with the terms of the PSU plan and a Trust Agreement, purchased 441,772 Class A subordinate shares of the Company on the open market for cash consideration $21,795,000 during the nine months ended June 30, 2016 (288,535 Class A subordinate shares for $11,099,000 during the nine months ended June, 2015).
5 During the nine months ended June 30, 2016, a shareholder converted 420,019 Class B shares into 420,019 Class A subordinate shares.

Notes to the Interim Condensed Consolidated Financial StatementsFor the three and nine months ended June 30, 2016 and 2015(tabular amounts only are in thousands of Canadian dollars, except per share data) (unaudited)
CGI Group Inc. – Interim Condensed Consolidated Financial Statements for the three and nine months ended June 30, 2016 and 2015 9
7. Capital stock, share-based payments and earnings per share (continued)
B) SHARE-BASED PAYMENTS
i) Stock options
Under the Company’s stock option plan, the Board of Directors may grant, at its discretion, stock options to purchase Class A subordinate shares to certain employees, officers and directors of the Company and its subsidiaries. The exercise price is established by the Board of Directors and is equal to the closing price of the Class A subordinate shares on the TSX on the day preceding the date of the grant. Stock options generally vest over four years from the date of grant conditionally upon achievement of objectives and must be exercised within a ten-year period, except in the event of retirement, termination of employment or death.
The following table presents information concerning the number of outstanding stock options granted by the Company:
Outstanding as at September 30, 2015 20,629,392Granted 263,977Exercised (4,358,669)Forfeited (2,486,725)Outstanding as at June 30, 2016 14,047,975
The weighted average fair value of stock options granted during the nine months ended June 30 and the weighted average assumptions used in the calculation of their fair value on the date of grant using the Black-Scholes option pricing model were as follows:
2016 2015Grant date fair value ($) 11.16 8.61Dividend yield (%) 0.00 0.00Expected volatility (%)1 24.97 24.70Risk-free interest rate (%) 0.83 1.33Expected life (years) 4.00 4.00Exercise price ($) 52.97 39.68Share price ($) 52.97 39.68
1 Expected volatility was determined using statistical formulas and based on the weekly historical average of closing daily share prices over the period of the expected life of stock options.

Notes to the Interim Condensed Consolidated Financial StatementsFor the three and nine months ended June 30, 2016 and 2015(tabular amounts only are in thousands of Canadian dollars, except per share data) (unaudited)
CGI Group Inc. – Interim Condensed Consolidated Financial Statements for the three and nine months ended June 30, 2016 and 2015 10
7. Capital stock, share-based payments and earnings per share (continued)
B) SHARE-BASED PAYMENTS (CONTINUED)
ii) Performance share units
Under the PSU plan, the Board of Directors may grant PSUs to senior executives and other key employees (“participants”) which entitle them to receive one Class A subordinate share for each PSU. The vesting performance conditions are determined by the Board of Directors at the time of each grant. PSUs expire on the business day preceding December 31 of the third calendar year following the end of the fiscal year during which the PSU award was made, except in the event of retirement, termination of employment or death. Granted PSUs vest annually over a period of four years from the date of grant conditionally upon achievement of objectives.
Class A subordinate shares purchased in connection with the PSU plan are held in trust for the benefit of the participants. The trust, considered as a structured entity, is consolidated in the Company’s consolidated financial statements with the cost of the purchased shares recorded as a reduction of capital stock (Note 7A).
The following table presents information concerning the number of outstanding PSUs granted by the Company:
Outstanding as at September 30, 2015 1,719,827Granted1 570,000Exercised (969,241)Forfeited (128,278)Outstanding as at June 30, 2016 1,192,308
1 The PSUs granted in the period had a grant date fair value of $48,35 per unit.
C) EARNINGS PER SHARE
The following tables set forth the computation of basic and diluted earnings per share for the three and nine months ended June 30:
Three months ended June 302016 2015
Netearnings
Weighted average number of shares outstanding1
Earningsper share
Netearnings
Weighted average number of shares outstanding1
Earnings per share
$ $ $ $
Basic 273,833 301,941,641 0.91 257,237 312,771,723 0.82Net effect of dilutive stock options and PSUs2 7,044,350 9,890,185
273,833 308,985,991 0.89 257,237 322,661,908 0.80
Nine months ended June 302016 2015
Netearnings
Weighted average number of shares outstanding1
Earningsper share
Netearnings
Weighted average number of shares outstanding1
Earnings per share
$ $ $ $
Basic 794,281 305,346,895 2.60 744,667 312,198,807 2.39Net effect of dilutive stock options and PSUs2 8,194,563 9,935,830
794,281 313,541,458 2.53 744,667 322,134,637 2.311 During the three months ended June 30, 2016, the Company did not repurchase any Class A subordinate shares and 1,192,308 Class A subordinate shares
held in trust were excluded from the calculation of weighted average number of shares outstanding as of the date of transaction (1,875,333 and 1,719,827, respectively, during the three months ended June 30, 2015). During the nine months ended June 30, 2016, 9,519,875 Class A subordinate shares repurchased and 1,192,308 Class A subordinate shares held in trust were excluded from the calculation of weighted average number of shares outstanding as of the date of transaction (1,875,333 and 1,719,827, respectively, during the nine months ended June 30, 2015).
2 The calculation of the diluted earnings per share excluded 228,800 stock options for the three and nine months ended June 30, 2016 (42,594 and 149,969 for the three and nine months ended June 30, 2015), as they were anti-dilutive.

Notes to the Interim Condensed Consolidated Financial StatementsFor the three and nine months ended June 30, 2016 and 2015(tabular amounts only are in thousands of Canadian dollars, except per share data) (unaudited)
CGI Group Inc. – Interim Condensed Consolidated Financial Statements for the three and nine months ended June 30, 2016 and 2015 11
8. Supplementary cash flow information
a) Net change in non-cash working capital items is as follows for the three and nine months ended June 30:
Three months ended June 30 Nine months ended June 302016 2015 2016 2015
$ $ $ $
Accounts receivable (77,536) (55,196) (101,265) 3,035Work in progress (11,326) (57,785) (108,735) (64,751)Prepaid expenses and other assets (18,402) 3,396 (59,041) (4,270)Long-term financial assets (1,688) (3,416) (3,685) (6,460)Accounts payable and accrued liabilities 62,491 9,556 44,714 (8,191)Accrued compensation 63,894 26,775 24,873 2,948Deferred revenue (62,123) (54,017) 25,844 (67,820)Provisions (14,201) (22,857) (63,323) (84,616)Long-term liabilities (5,218) (18,389) (3,496) (50,721)Retirement benefits obligations (386) 3,885 (4,461) 582Derivative financial instruments (534) (1,730) (458) (1,618)Income taxes (3,043) (19,551) (5,930) (12,468)
(68,072) (189,329) (254,963) (294,350)
b) Net interest paid and income taxes paid are classified within operating activities and are as follows for the three and nine months ended June 30:
Three months ended June 30 Nine months ended June 302016 2015 2016 2015
$ $ $ $
Net interest paid 17,877 18,532 58,374 63,909Income taxes paid 63,876 68,892 212,368 215,591
Notes to the Interim Condensed Consolidated Financial StatementsFor the three and nine months ended June 30, 2016 and 2015(tabular amounts only are in thousands of Canadian dollars, except per share data) (unaudited)
CGI Group Inc. – Interim Condensed Consolidated Financial Statements for the three and nine months ended June 30, 2016 and 2015 12
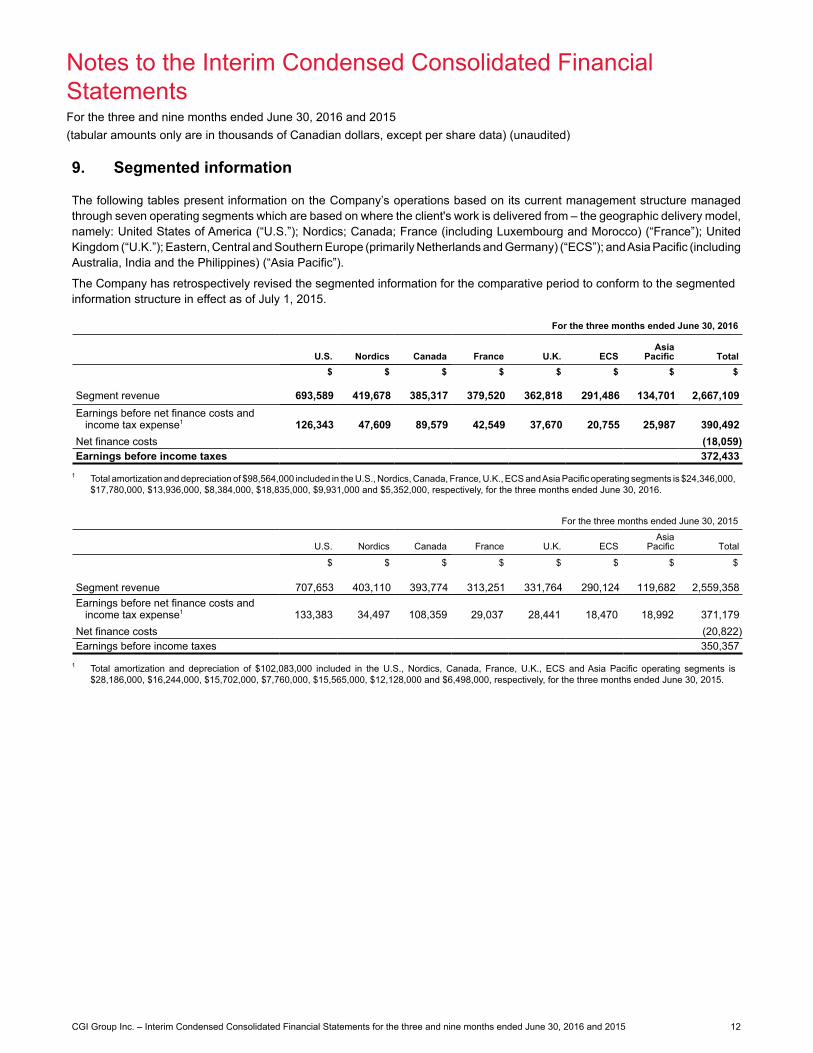
9. Segmented information
The following tables present information on the Company’s operations based on its current management structure managed through seven operating segments which are based on where the client's work is delivered from – the geographic delivery model, namely: United States of America (“U.S.”); Nordics; Canada; France (including Luxembourg and Morocco) (“France”); United Kingdom (“U.K.”); Eastern, Central and Southern Europe (primarily Netherlands and Germany) (“ECS”); and Asia Pacific (including Australia, India and the Philippines) (“Asia Pacific”).
The Company has retrospectively revised the segmented information for the comparative period to conform to the segmented information structure in effect as of July 1, 2015.
For the three months ended June 30, 2016
U.S. Nordics Canada France U.K. ECSAsia
Pacific Total$ $ $ $ $ $ $ $
Segment revenue 693,589 419,678 385,317 379,520 362,818 291,486 134,701 2,667,109Earnings before net finance costs and
income tax expense1 126,343 47,609 89,579 42,549 37,670 20,755 25,987 390,492Net finance costs (18,059)Earnings before income taxes 372,433
1 Total amortization and depreciation of $98,564,000 included in the U.S., Nordics, Canada, France, U.K., ECS and Asia Pacific operating segments is $24,346,000, $17,780,000, $13,936,000, $8,384,000, $18,835,000, $9,931,000 and $5,352,000, respectively, for the three months ended June 30, 2016.
For the three months ended June 30, 2015
U.S. Nordics Canada France U.K. ECSAsia
Pacific Total
$ $ $ $ $ $ $ $
Segment revenue 707,653 403,110 393,774 313,251 331,764 290,124 119,682 2,559,358Earnings before net finance costs and
income tax expense1 133,383 34,497 108,359 29,037 28,441 18,470 18,992 371,179Net finance costs (20,822)Earnings before income taxes 350,357
1 Total amortization and depreciation of $102,083,000 included in the U.S., Nordics, Canada, France, U.K., ECS and Asia Pacific operating segments is $28,186,000, $16,244,000, $15,702,000, $7,760,000, $15,565,000, $12,128,000 and $6,498,000, respectively, for the three months ended June 30, 2015.

Notes to the Interim Condensed Consolidated Financial StatementsFor the three and nine months ended June 30, 2016 and 2015(tabular amounts only are in thousands of Canadian dollars, except per share data) (unaudited)
CGI Group Inc. – Interim Condensed Consolidated Financial Statements for the three and nine months ended June 30, 2016 and 2015 13
9. Segmented information (continued)
For the nine months ended June 30, 2016
U.S. Nordics Canada France U.K. ECSAsia
Pacific Total$ $ $ $ $ $ $ $
Segment revenue 2,157,169 1,292,742 1,149,287 1,103,294 1,088,652 910,467 399,224 8,100,835
Earnings before restructuring costs, net finance costs and income tax expense1 357,801 142,958 251,347 131,618 125,564 83,954 71,990 1,165,232
Restructuring costs (29,100)Net finance costs (60,803)Earnings before income taxes 1,075,329
1 Total amortization and depreciation of $300,808,000 included in the U.S., Nordics, Canada, France, U.K., ECS and Asia Pacific operating segments is $71,255,000, $53,814,000, $44,378,000, $25,628,000, $58,650,000, $31,088,000 and $15,995,000, respectively, for the nine months ended June 30, 2016.
For the nine months ended June 30, 2015
U.S. Nordics Canada France U.K. ECSAsia
Pacific Total
$ $ $ $ $ $ $ $
Segment revenue 2,060,896 1,270,876 1,161,895 969,153 976,192 915,507 347,302 7,701,821Earnings before net finance costs and
income tax expense1 337,012 123,665 266,242 110,809 101,197 81,255 58,164 1,078,344Net finance costs (68,873)Earnings before income taxes 1,009,471
1 Total amortization and depreciation of $315,589,000 included in the U.S., Nordics, Canada, France, U.K., ECS and Asia Pacific operating segments is $84,017,000, $49,268,000, $51,278,000, $23,802,000, $54,418,000, $33,171,000 and $19,635,000, respectively, for the nine months ended June 30, 2015.
The accounting policies of each operating segment are the same as those described in the summary of significant accounting policies (Note 3) of the Company’s consolidated financial statements for the year ended September 30, 2015. Intersegment revenue is priced as if the revenue was from third parties.
Notes to the Interim Condensed Consolidated Financial StatementsFor the three and nine months ended June 30, 2016 and 2015(tabular amounts only are in thousands of Canadian dollars, except per share data) (unaudited)
CGI Group Inc. – Interim Condensed Consolidated Financial Statements for the three and nine months ended June 30, 2016 and 2015 14
10. Financial instruments
FAIR VALUE
All financial instruments are initially measured at their fair values. Subsequently, financial assets classified as loans and receivables and financial liabilities classified as other liabilities are measured at their amortized cost using the effective interest rate method. Financial assets and liabilities classified as fair value through earnings (“FVTE”) and classified as available-for-sale are measured subsequently at their fair values.
The Company has made the following classifications:
FVTE
Cash and cash equivalents and derivative financial instruments (unless they qualify for hedge accounting). In addition, deferred compensation plan assets within long-term financial assets were designated by management as FVTE upon initial recognition as this reflected management's investment strategy.
Loans and receivables
Trade accounts receivable, cash included in funds held for clients and long-term receivables within long-term financial assets.
Available-for-sale
Long-term bonds included in funds held for clients and in long-term investments within long-term financial assets.
Other liabilities
Accounts payable and accrued liabilities, accrued compensation, long-term debt and clients’ funds obligations.
FAIR VALUE HIERARCHY
Fair value measurements recognized in the balance sheet are categorized in accordance with the following levels:
Level 1: quoted prices (unadjusted) in active markets for identical assets or liabilities;
Level 2: inputs other than quoted prices included in Level 1, but that are observable for the asset or liability, either directly or indirectly; and
Level 3: inputs for the asset or liability that are not based on observable market data.
FAIR VALUE MEASUREMENTS
Fair value is the price that would be received to sell an asset or paid to transfer a liability in an orderly transaction between market participants at the measurement date.
Valuation techniques used to value financial instruments are as follows:
- The fair value of Senior U.S. and euro unsecured notes, the unsecured committed term loan credit facility, the unsecured committed revolving credit facility and the other long-term debt is estimated by discounting expected cash flows at rates currently offered to the Company for debts of the same remaining maturities and conditions;
- The fair value of long-term bonds included in funds held for clients and in long-term investments is determined by discounting the future cash flows using observable inputs, such as interest rate yield curves or credit spreads, or according to similar transactions on an arm's-length basis;
- The fair value of foreign currency forward contracts is determined using forward exchange rates at the end of the reporting period;
- The fair value of cross-currency swaps and interest rate swaps is determined based on market data (primarily yield curves, exchange rates and interest rates) to calculate the present value of all estimated flows;
- The fair value of cash and cash equivalents is determined using observable quotes.
There were no changes in valuation techniques during the nine months ended June 30, 2016.

Notes to the Interim Condensed Consolidated Financial StatementsFor the three and nine months ended June 30, 2016 and 2015(tabular amounts only are in thousands of Canadian dollars, except per share data) (unaudited)
CGI Group Inc. – Interim Condensed Consolidated Financial Statements for the three and nine months ended June 30, 2016 and 2015 15
10. Financial instruments (continued)
FAIR VALUE MEASUREMENTS (CONTINUED)
The following table presents financial liabilities measured at amortized cost categorized using the fair value hierarchy:
As at June 30, 2016 As at September 30, 2015
Level Carrying amount Fair value Carrying amount Fair value
$ $ $ $
Financial liabilities for which fair value is disclosed Other liabilities
Senior U.S. and euro unsecured notes Level 2 1,719,614 1,817,637 1,765,180 1,839,478Unsecured committed term loan credit facility Level 2 — — 129,222 129,385Other long-term debt Level 2 24,868 23,577 23,437 22,049
1,744,482 1,841,214 1,917,839 1,990,912
The following table presents financial assets and liabilities measured at fair value categorized using the fair value hierarchy:
Level As at June 30, 2016 As at September 30, 2015
$ $
Financial assets Financial assets at fair value through earnings
Cash and cash equivalents Level 2 283,681 305,262Deferred compensation plan assets Level 1 39,082 38,238
322,763 343,500Derivative financial instruments designated as hedging instruments
Current derivative financial instruments Level 2 20,439 26,567Long-term derivative financial instruments Level 2 79,367 30,771
99,806 57,338 Available-for-sale
Long-term bonds included in funds held for clients Level 2 196,277 196,964Long-term investments Level 2 24,454 42,202
220,731 239,166 Financial liabilities
Derivative financial instruments designated as hedging instruments
Current derivative financial instruments Level 2 5,504 28,106Long-term derivative financial instruments Level 2 48,129 225
53,633 28,331
There were no transfers between Level 1 and Level 2 during the nine months ended June 30, 2016.

Notes to the Interim Condensed Consolidated Financial StatementsFor the three and nine months ended June 30, 2016 and 2015(tabular amounts only are in thousands of Canadian dollars, except per share data) (unaudited)
CGI Group Inc. – Interim Condensed Consolidated Financial Statements for the three and nine months ended June 30, 2016 and 2015 16
10. Financial instruments (continued)
FAIR VALUE MEASUREMENTS (CONTINUED)
The following table summarizes the fair value of outstanding derivative financial instruments:
Recorded in
As at June 30, 2016
As at September 30, 2015
$ $
Hedges on net investments in foreign operations$831,400 cross-currency swap in euro designated as a fixed-to-fixed hedging
instrument of the Company’s net investment in European operations ($109,730 as at September 30, 2015)
Long-term assets 56,382 —Current liabilities — 22,297
Cash flow hedges on future revenueU.S.$2,250 foreign currency forward contracts to hedge the variability in the
expected foreign currency exchange rate between the U.S. dollar and theCanadian dollar (U.S.$9,000 as at September 30, 2015)
Current liabilities 528 2,478
U.S.$51,082 foreign currency forward contracts to hedge the variability in theexpected foreign currency exchange rate between the U.S. dollar and theIndian rupee (U.S.$42,296 as at September 30, 2015)
Current assets 2,392 1,388Long-term assets 486 1,284Current liabilities 399 1,220
Long-term liabilities — 86
$135,975 foreign currency forward contracts to hedge the variability in theexpected foreign currency exchange rate between the Canadian dollar andthe Indian rupee ($151,916 as at September 30, 2015)
Current assets 10,844 14,795Long-term assets 7,408 16,212Current liabilities 13 —
Long-term liabilities 455 —
kr87,925 foreign currency forward contracts to hedge the variability in the expected foreign currency exchange rate between the Swedish krona and the Indian rupee (kr77,100 as at September 30, 2015)
Current assets 1,223 1,279Long-term assets 276 879
€14,100 foreign currency forward contracts to hedge the variability in theexpected foreign currency exchange rate between the euro and the Indianrupee (€7,300 as at September 30, 2015)
Current assets 211 —Long-term assets 43 —Current liabilities 27 441
£23,375 foreign currency forward contracts to hedge the variability in theexpected foreign currency exchange rate between the British pound and theIndian rupee (£25,200 as at September 30, 2015)
Current assets 5,005 59Long-term assets 892 12Current liabilities — 47
Long-term liabilities — 139
€71,625 foreign currency forward contracts to hedge the variability in theexpected foreign currency exchange rate between the euro and the Britishpound (€84,000 as at September 30, 2015)
Current assets 753 9,044Long-term assets 558 8,254Current liabilities 3,692 —
Long-term liabilities 621 —
€1,250 foreign currency forward contracts to hedge the variability in theexpected foreign currency exchange rate between the euro and theSwedish krona (€5,000 as at September 30, 2015)
Current liabilities 83 339
€13,000 foreign currency forward contracts to hedge the variability in the expected foreign currency exchange rate between the euro and the Moroccan dirham (€7,000 as at September 30, 2015)
Current assets 11 2Current liabilities 623 198
Long-term liabilities 247 —
€12,475 foreign currency forward contracts to hedge the variability in the expected foreign currency exchange rate between the euro and the Czech koruna (nil as at September 30, 2015)
Current liabilities 139 —Long-term liabilities 40 —
Cash flow hedges on unsecured committed term loan credit facilitynil interest rate swap floating-to-fixed ($109,730 as at September 30, 2015)
Current liabilities — 1,086
Notes to the Interim Condensed Consolidated Financial StatementsFor the three and nine months ended June 30, 2016 and 2015(tabular amounts only are in thousands of Canadian dollars, except per share data) (unaudited)
CGI Group Inc. – Interim Condensed Consolidated Financial Statements for the three and nine months ended June 30, 2016 and 2015 17
10. Financial instruments (continued)
Recorded inAs at
June 30, 2016As at
September 30, 2015
$ $
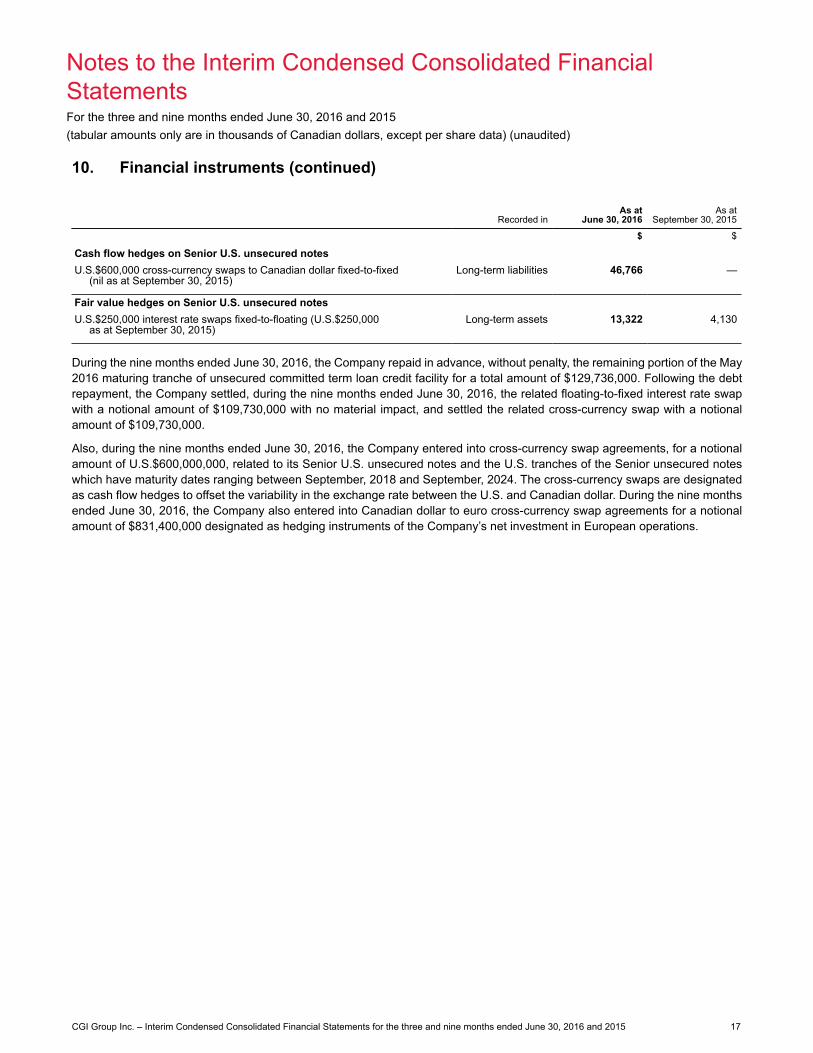
Cash flow hedges on Senior U.S. unsecured notesU.S.$600,000 cross-currency swaps to Canadian dollar fixed-to-fixed (nil as at September 30, 2015)
Long-term liabilities 46,766 —
Fair value hedges on Senior U.S. unsecured notesU.S.$250,000 interest rate swaps fixed-to-floating (U.S.$250,000 as at September 30, 2015)
Long-term assets 13,322 4,130
During the nine months ended June 30, 2016, the Company repaid in advance, without penalty, the remaining portion of the May 2016 maturing tranche of unsecured committed term loan credit facility for a total amount of $129,736,000. Following the debt repayment, the Company settled, during the nine months ended June 30, 2016, the related floating-to-fixed interest rate swap with a notional amount of $109,730,000 with no material impact, and settled the related cross-currency swap with a notional amount of $109,730,000.
Also, during the nine months ended June 30, 2016, the Company entered into cross-currency swap agreements, for a notional amount of U.S.$600,000,000, related to its Senior U.S. unsecured notes and the U.S. tranches of the Senior unsecured notes which have maturity dates ranging between September, 2018 and September, 2024. The cross-currency swaps are designated as cash flow hedges to offset the variability in the exchange rate between the U.S. and Canadian dollar. During the nine months ended June 30, 2016, the Company also entered into Canadian dollar to euro cross-currency swap agreements for a notional amount of $831,400,000 designated as hedging instruments of the Company’s net investment in European operations.