Q2FY22 and H1FY22
25
EARNINGS RELEASE Q2FY22 and H1FY22
Transcript of Q2FY22 and H1FY22

EARNINGS RELEASEQ2FY22 and H1FY22

DisclaimerCertain statements in this presentation describing theCompany's objectives, projections, estimates andexpectations may be 'forward looking statements' within themeaning of applicable laws and regulations.
Although our expectations are based on reasonableassumptions, these forward-looking statements may beinfluenced by numerous risks and uncertainties that couldcause actual outcomes and results to be materially differentfrom those expressed or implied. The Company takes noresponsibility for any consequence of decisions made basedon such statements and holds no obligation to update thesein the future.
The past financial figures have been regrouped orreclassified as per the current grouping, wherever necessary.
2
3
TABLE OF CONTENTS
S E C T I O NPA G E N O .
01. Key Highlights 4
02. Expansion & Capex Update 6
03. Q2 & H1 Performance 10
04. ESG at Dalmia 18
05. Annexure 23

KEY HIGHLIGHTS
S E C T I O N
01
4

Key Highlights
Financial Performance
Sales Volume grew by 6.2% YoY to 5.11 MnT
Revenue increased by 11.4% YoY to Rs 2,577 cr
EBITDA/T for the quarter Rs. 1,217; EBITDA Margin stood at 24.1%
Capacity Additions
Commenced commercial production of 2.25 MnT at Dalmia DSP Unit II near Cuttack in Odisha
Commenced Trial Run production of 3Mnt plant at Maharashtra (erstwhile Murli Industries)
Total Cement Capacity increased to 33MnT
Total Clinker Capacity increased to 18.88 MnT from 18.68 MnT
Debt Position
Reduction in Gross Debt of Rs 162 cr during the quarter
Became Net Debt Free Company, Net Debt/EBITDA stood at (0.48x)
Capital Allocation Framework and Transformation Declared an interim dividend of Rs 4 per share Sold ~21.4 Lacs shares for IEX for Rs 128 cr; reduced its stake in the company to 14.8% Received approval from the board for the divestment of Hippo Stores Received approval in the AGM for appointment of Walker Chandiok & Co., Chartered Accountants (member firm of Grant
Thornton) as Statutory auditors of the company
5

EXPANSION AND CAPEX UPDATE
S E C T I O N
02
6

Capacity Update
7
Upgradation
North East 1.2 West 1.0 South 0.9 East 2.1
5.2
Brownfield
East 1.7
Greenfield
South 3.0
Phase 1 - Ongoing Projects
West 3.0 East 2.5
5.5
Total Cement Capacity Post Expansion – 48.5 MnT
Capacity Overview
Present Capacity 33.0
Ongoing Projects 5.5
Greenfield 3.0
Brownfield 1.7
Upgradation 5.2
Total Capacity 48.5
(Figures in MnT)
*
* Precise location to be announced in due course
Sep’22: Commenced commercial production of 2.25 MnT Line 2 near Cuttack, Odisha

Capex Update
88
Phase 1 -Ongoing Capex
New capacity OthersInnovation & Sustainability
2.25 MnT Line 2 near
Cuttack Odisha:
Commercial
production started
Murli Industries: Trial
Run started for plant
with 3MnT capacity
Bihar Grinding Unit:
Finalization of
location underway
Clinker Debottlenecking:
0.2 MnT completed
Tamil Nadu GUs: Site
Finalized, MoU signed and
EC applied
Bokaro Unit: Site Finalized,
MoU signed and EC
applied
Cement Debottlenecking:
Equipment ordering
planned for H2FY22
Estimated addition in
WHRS and Solar for FY22
stands 9 MW and 74
MW
Mining Land: Acquisition
of Land underway

WHRS and Solar Power Update
9
WHRS Commissioning Timeline
H2FY22 9.4 H1FY23 30.6 H2FY23 10.2
50.2
Solar Commissioning Timeline
H2FY22 73.7 H1FY23 7.0
80.7
Renewable Energy Power (WHRS and Solar)
Investment in Renewable Energy will not only help us minimize our costs but also help us to achieve our sustainability goals
9 9 22 31 72 8 8
10 84
91
9% 9%
15%
33%
42%
0%
5%
10%
15%
20%
25%
30%
35%
40%
45%
-
20
40
60
80
100
120
140
160
180
FY19 FY20 FY21 FY22E FY23E
WHRS Capacity- MW Solar Capacity - MW Renewable % of Total Captive Power Capacity

Q2 & H1 PERFORMANCE
S E C T I O N
03
10

Financial Performance
Quarterly Sales Volume Half-Yearly Sales Volume
4.8
4.9
5.1
Q2FY21 Q1FY22 Q2FY22
(MnT)(MnT) Growth: 6%
11
8.5
10.0
H1FY21 H1FY22
Growth: 18%
Growth: 4%
Our diverse product portfolio supported by favorable demand environment enabled us to generate industry leading volume growth

Financial Performance
Quarterly Sales Revenue Half-Yearly Sales Revenue
2,313
2,587 2,577
Q2FY21 Q1FY22 Q2FY22
(Rs Cr)(Rs Cr)
12
4,214
5,164
H1FY21 H1FY22
Growth: 11%Growth: 23%
Decline: 0.4%

1,436
1,6241,668
Q2FY21 Q1FY22 Q2FY22
Operational Performance
Quarterly Total Variable Cost* Half-Yearly Total Variable Cost*
(Rs/T)(Rs/T)
13
1,464
1,646
H1FY21 H1FY22
Increase: 12.4%Increase: 16%
Increase: 3%
Significant inflationary pressure across our supply chain has led to increase in our Total Variable Cost on a YoY basis
* Includes Raw Material Consumed, Change in Stock, Purchase of Traded goods and Power & Fuel Cost
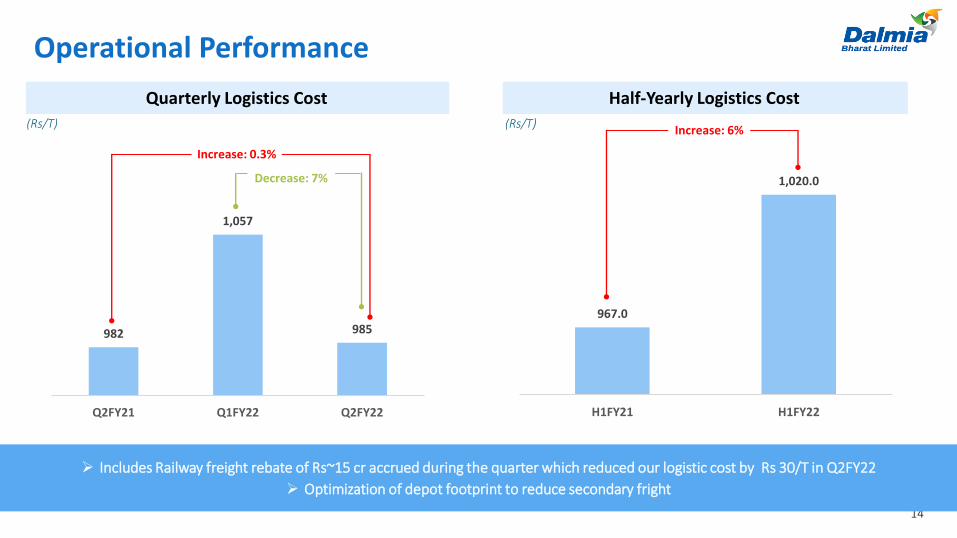
Operational Performance
Quarterly Logistics Cost Half-Yearly Logistics Cost
982
1,057
985
Q2FY21 Q1FY22 Q2FY22
(Rs/T)(Rs/T)
14
967.0
1,020.0
H1FY21 H1FY22
Increase: 6%
Includes Railway freight rebate of Rs~15 cr accrued during the quarter which reduced our logistic cost by Rs 30/T in Q2FY22
Optimization of depot footprint to reduce secondary fright
Increase: 0.3%
Decrease: 7%

698 713
621
300.0
400.0
500.0
600.0
700.0
800.0
900.0
1,000.0
Q2FY21 Q1FY22 Q2FY22
Financial Performance
Quarterly EBITDA Half-Yearly EBITDA
24.1%30.2%Margins
15
(Rs Cr)(Rs Cr)
Decline: 13%
1,313
1,334
H1FY21 H1FY22
25.8%31.2%
Growth: 2%
Decline: 11%
27.6%
Seasonal drop in pricing specially in our core markets has led to sequential decline in realization and in turn EBITDA
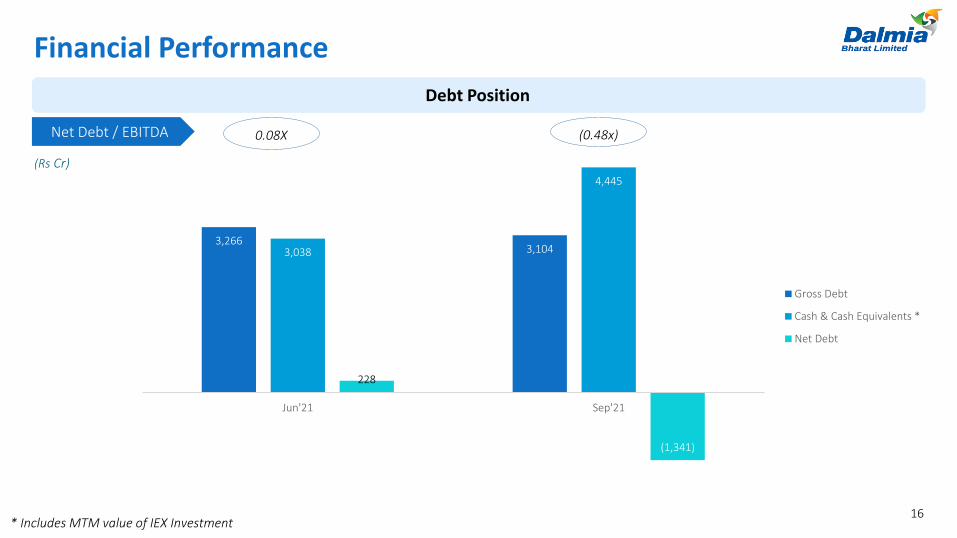
3,2663,1043,038
4,445
228
(1,341)
Jun'21 Sep'21
Gross Debt
Cash & Cash Equivalents *
Net Debt
Financial Performance
Debt Position
(0.48x)0.08XNet Debt / EBITDA
(Rs Cr)
* Includes MTM value of IEX Investment 16
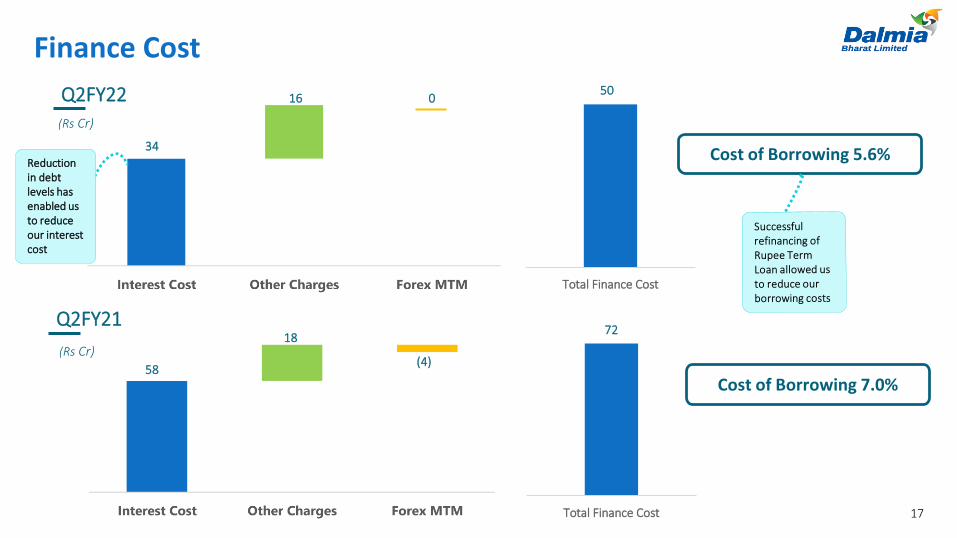
Finance Cost
Q2FY22
Q2FY21
Cost of Borrowing 5.6%
Cost of Borrowing 7.0%
(Rs Cr)
Total Finance Cost
72
Total Finance Cost
(Rs Cr)
17
050
Reduction in debt levels has enabled us to reduce our interest cost
16
34
18
58(4)

ESG UPDATE
S E C T I O N
03
18

19
Dalmia Cement engagement during the launch of FMC in Geneva, Switzerland – Mr. John Kerry, Special Presidential Envoy for Climate with Mr. Mahendra Singhi (MD & CEO DCBL)
19
Dalmia Cement joins First Movers Coalition
First company from emerging economies in heavy-industry sector to join FMC as founding member
FMC to be launched formally in COP-26
Aimed at setting up right demand signals for the green products and green procurement
Backed by US Government, may emerge as a platform to shape public as well as private sector green procurement commitments and policies
20
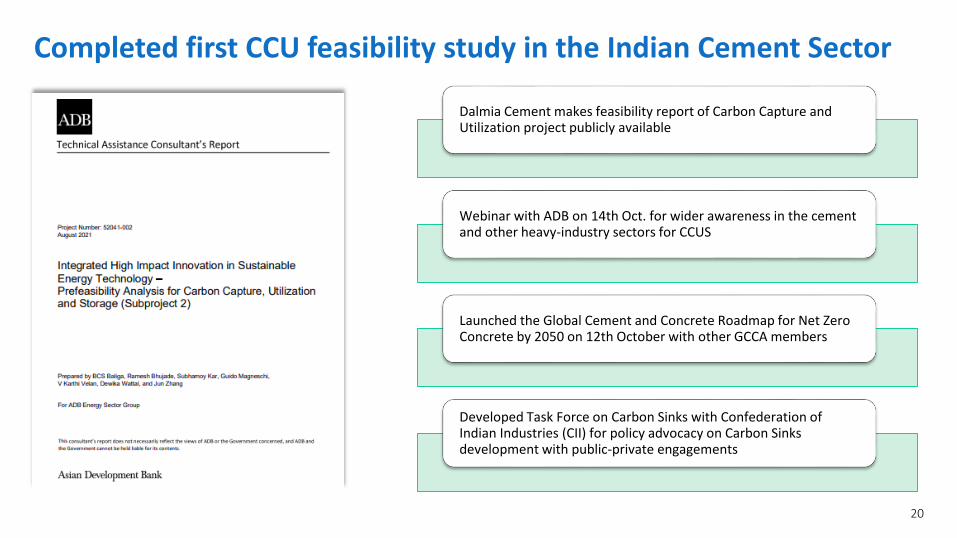
Completed first CCU feasibility study in the Indian Cement Sector
20
Dalmia Cement makes feasibility report of Carbon Capture and Utilization project publicly available
Webinar with ADB on 14th Oct. for wider awareness in the cement and other heavy-industry sectors for CCUS
Launched the Global Cement and Concrete Roadmap for Net Zero Concrete by 2050 on 12th October with other GCCA members
Developed Task Force on Carbon Sinks with Confederation of Indian Industries (CII) for policy advocacy on Carbon Sinks development with public-private engagements

0.67 0.75
1.43
Fly ash (In Mnt)
Q1 Q2 HY
912
21
Blue Metal (In Kilo Ton)
Q1 Q2 HY
0.50.4
0.9
Synthetic Gypsum(In Lac Ton)
Q1 Q2 HY
46 59
105
Red Mud (In Kilo Ton)
Q1 Q2 HY
0.61
1.1
1.71
Alternate Fuel (In Lac Ton)
Q1 Q2 HY
1.130.83
1.96
Slag (In MnT)
Q1 Q2 HY
21
Waste utilization – At the core of circular economy drive

CSR at Dalmia
22
Dalmia Institute of Knowledge & Skill Harnessing
(DIKSHa), a skill training center, actively involved in
imparting skill trainings in farm and non-farm
sector, building Community based organizations
and enabling access to finance
Extended livelihood training - designed a focused
group to address the specific needs of tribunal
communities
Climate Action – Watershed Projects
Major Initiatives
DIKSHa @ 13 Centers | 5,812 completed training out
of which 561 completed in Q2FY22
100% job offered with a salary of Rs 8,000-12,000
per month
An additional water harvesting potential of 1,747
lakh liters added during the year so far
The total annual water harvesting capacity stands
at 2,487 crore liters.
11,184 Self Help Group (SHG) members in 963 SHGs
Developing 120 acres of wadis (horticulture
plantation) benefitting around 133 tribal farmers
from 10 Medinipur villages is in final phase

ANNEXURES
S E C T I O N
04
23

Impact on PBT due to Goodwill Amortization (Restructuring Related)
24
With Restructuring Without Restructuring With Restructuring Without Restructuring
Income from Operations 2,577 2,577 2,313 2,313
Less:-Operating Expenses 1,956 1,956 1,615 1,615
EBITDA 621 621 698 698
Add:- Other Income 45 45 40 40
Less:-Depreciation 252 303 248 299
Less:- Finance Cost 50 50 72 72
PBT 364 313 418 367
Q2 FY22 Q2 FY21(Rs Cr)

CONTACT INFORMATION
Corporate Office: 11th & 12th floor, Hansalaya Building, 15, Barakhamba Road, New Delhi – 110001
e: [email protected]: www.dalmiacement.com
Thank You