Q2'20 Talend Investor Presentation
38
Talend Investor Presentation August 2020
Transcript of Q2'20 Talend Investor Presentation

Talend Investor PresentationAugust 2020

22
Safe Harbor Disclosure and Non-GAAP Financial Measures
This presentation and the accompanying oral presentation contain forward-looking statements within the meaning of Section 27A of the Securities Act of 1933, as amended, and Section 21E of the Securities Exchange Act of 1934, as amended. Forward-looking statements generally relate to future events or our future financial or operating performance. In some cases, you can identify forward-looking statements because they contain words such as “may,” “will,” “should,” “expects,” “likely,” “plans,” “anticipates,” “could,” “intends,” “target,” “projects,” “contemplates,” “believes,” “estimates,” “predicts,” “potential” or “continue” or similar terms or expressions orthe negative of these words or other similar terms or expressions that concern our expectations, strategy, plans or intentions. Forward-looking statements include, but are not limited to, expectations with respect to our operating results,our prospects for future growth, our ability to strengthen our position in the cloud with innovations, our free cash flow, the future demand and behavior of customers and the data integration market, the evolution of our marketplace, our transition to cloud-based products, our ability to capture an increasing share of the big data and cloud integration market, and the impact of the COVID-19 pandemic on our business and operations, results of operations, financial condition, and liquidity and capital resources. Our expectations and beliefs regarding these matters may not materialize, and actual results in future periods are subject to inherent risks, uncertainties and changes in circumstance that are difficult or impossible to predict. Consequently, you should not rely on these forward-looking statements. Actual outcomes and results may differ materially from those contemplated by these forward-looking statements as a result of such uncertainties, risks, and changes in circumstances. Those risks, uncertainties and assumptions include general economic conditions, including the length and severity of the COVID-19 pandemic; the impact of COVID-19 on economic activity and our business, customers, third-party partners and employees; our ability to continue to deliver and improve our products and successfully develop new products; customer acceptance and purchase of our existing products and new products, including conversion of leads to sales; our ability to successfully transition to the cloud; our ability to successfully manage our leadership transition; our ability to attract, train and retain highly-skilled and qualified employees, including senior-level managers and engineers; the impact of the transition to cloud on our professional services revenue; our ability to retain and increase sales to existing customers and generate new customers; the market for data integration solutions, particularly our cloud and big data integration solutions; interruptions or performance problems with our technology or infrastructure; competition from other products and services; the sufficiency of our cash and cash equivalents to meet our cash needs; the unpredictability and length of our sales cycle; our ability to deliver high-quality customer support; any security incidents or breaches or perceptions of security incidents or breaches; our ability to expand and train our sales force; the performance of our channel partners; our success in sustainingand expanding our international business; our ability to generate significant volumes of sales leads from digital and virtual marketing efforts; the seasonality of our business; our ability to protect our intellectual property, including trade secrets, patents and copyrights; costs resulting from any claim of infringement or other violations by us of another party’s intellectual property rights; our ability to comply with government laws and regulations; natural and man-made disasters, including pandemics; and exposure to political, economic and social events in France, the United States, United Kingdom, China and other jurisdictions in which we operate and have customers.
The forward-looking statements contained in this presentation are also subject to other risks and uncertainties, and the foregoing list of factors is not exclusive. Additional risks and uncertainties that could affect our financial and operating results are included under the captions “Risk Factors” and “Management’s Discussion and Analysis of Financial Condition and Results of Operation” and elsewhere in our most recent filings with the Securities and Exchange Commission, including in our most recent annual report on Form 10-K filed with the SEC , our quarterly reports on Form 10-Q, and other filings with the SEC, all of which are available on the Investors section of Talend's website at https://investor.talend.com and the SEC’s website at www.sec.gov. The forward-looking statements in this presentation are based on information available to us as of the date hereof, and we expressly disclaim any obligation to update any forward-looking statements provided to reflect any change in our expectations or any change in events, conditions, or circumstances on which any such statement is based, except as required by law.
This presentation also contains estimates and other statistical data made by independent parties and by us relating to marketsize and growth and other industry data. These data involve a number of assumptions and limitations, and you are cautioned not to give undue weight to such estimates. We have not independently verified the statistical and other industry data generated by independentparties and contained in this presentation and, accordingly,cannot guarantee their accuracy or completeness. In addition, projections, assumptions and estimates of its future performance and the future performance of the industries in which it operates are necessarily subject to a high degree of uncertainty and risk due to a variety of factors. These and other factors could cause results to differ materially from those expressed in the estimates made by the independent parties and by us.
In addition tofinancials presented in accordance with generally accepted accounting principles in the United States ("GAAP"), t his presentation includes certain non-GAAP financial measures. The non-GAAP measures have limitations as analytical tools and you should not consider them in isolation or as a substitute for the most directly comparable financial measures prepared in accordance withGAAP. There are a number of limitations related to the use of these non-GAAP financial measures versus their nearest GAAP equivalents. Other companies may calculate non-GAAP financial measures differently or may use other measures to evaluate their performance. For example, we define free cash flow as net cash used in operating activities less net cash used in investing activities for purchases of property and equipment and intangible assets. Free cash flow as defined by us may not be comparable to other similar measures used by other companies, which could reduce the usefulness of free cash flow as a comparative measure. We urge you to review the reconciliation of our non-GAAP financial measures to the most directly comparable GAAP financial measures set forth in the appendices to the presentat ion, and not to rely on any single financial measure to evaluate our business.
33
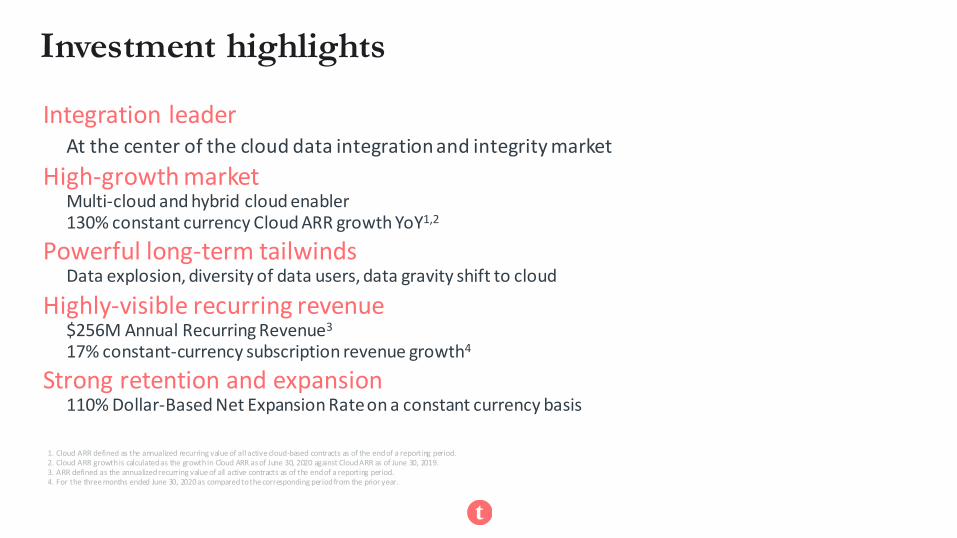
Investment highlights
Integration leaderAt the center of the cloud data integration and integrity market
High-growth marketMulti-cloud and hybrid cloud enabler130% constant currency Cloud ARR growth YoY1,2
Powerful long-term tailwindsData explosion, diversity of data users, data gravity shift to cloud
Highly-visible recurring revenue$256M Annual Recurring Revenue3
17% constant-currency subscription revenue growth4
Strong retention and expansion110% Dollar-Based Net Expansion Rate on a constant currency basis
1. Cloud ARR defined as the annualized recurring value of all active cloud-based contracts as of the end of a reporting period.2. Cloud ARR growth is calculated as the growth in Cloud ARR as of June 30, 2020 against Cloud ARR as of June 30, 2019.3. ARR defined as the annualized recurring value of all active contracts as of the end of a reporting period.4. For the three months ended June 30, 2020 as compared to the corresponding period from the prior year.

44
Streamlined supply chain, efficient marketing campaigns
Improvedoperations
Customized products, real-time feedback
Better customer experiences
Digital transformation,data monetization
New business models
Data is the new competitive advantage

55
Several shifts in the landscape are making data strategies increasingly complex
10-fold risein worldwide data by
2025¹
More data(volume, velocity, sources)
3x growth rate data experts in
business vs. IT by 20202
More users
>75% of organizations will have adopted a multi-cloud and/or
hybrid IT strategy by 20213
Shift to hybrid environments
GDPR, MiFID II
More regulation
1. Harvard Business Review: “What’s Your Data Strategy?,” May-September 20172. Gartner: “How to Enable Self-Service Analytics and Business Intelligence: Lessons From Gartner Award Finalists,” October 20173. Gartner: “Predicts 2019: Increasing Reliance on Cloud Computing Transforms IT and Business Practices.”

66
Amidst this data chaos, companies and users are leftconfused and unable to use their data successfully
Companies have used tactical, reactive
approaches to manage their most strategic
business asset.
62% of employees do not trust the data¹ they deliver, use or
process.
1. Talend , data Trust readiness report, July 2019

77
✓ All the data users
✓ All the data sources
✓ Across hybrid, multi-cloud environments
Data integration
Data quality
Application integration
Data governance
Talend takes a unified approach to solve this data chaos and deliver data the entire organization can trust
Talend
Data
Fabric✓ All use cases

What makes Talend Data Fabric different?
Unified - Data integration, integrity and governance in single platform with real-time data delivery and self-service data access and management
Flexible - Connect anything to anything – any data source or type – and deploy anywhere – cloud, hybrid, and on premises
Grows with you - Scale without penalty and easily integrate with today’s innovations and what’s coming next

99
Talend Data Fabric helps our customers achieve incredible business outcomes
£ Millions /
year of additional revenue from third-party
partners
Turn raw data into revenue
75% faster
development for new projects
Innovate faster
11% increase
in revenue per unit
Achieveoperational efficiencies
$1 Billion /
year savings with faster clinical trials
Lower costs and risk

1010
1. International Data Corporation: “Worldwide Data Integration and Integrity Software Forecast, 2018 - 2023” May 2019; Applied Master Data Management category from “Worldwide Master Data Management Competitive Software Forecast, 2019–2023” July 2019, and Integration and Orchestration Middleware category (excluding Managed File Transfer) from “Worldwide Semiannual Public Cloud Services Tracker,” May 2019
2. International Data Corporation: “Worldwide Data Integration and Integrity Software Forecast, 2018 - 2023” May 2019
Cloud data integration is driving the market growth
$23B$19BData Integration and
Orchestration in 2020¹
Massive ecosystem Evolving to cloud
Data Integration and Integrity Market² in 2020
$8B
‘20-‘23 CAGR: 11%
Cloud
Cloud Data Integration revenue² (in $M)
$1,337
2020 2023
$2,779
26% of data integration revenue in 2023²
Powering growth

1111
Talend uniquely meets the needs of all users
Azure Data Factory
Citizen integrators
Integration engineers
Simple Integrations
ComplexTransformations &
Governance

1212
Talend helps organizations succeed in the rapidly evolving cloud ecosystem
PUBLIC, PRIVATE, HYBRID AND MULTI-CLOUD
TRADITIONAL ENTERPRISE DATABASES
SAAS APPLICATIONS
✓ Support for all major customer databases and their journey from on-prem to cloud
✓ Operability across all cloud infrastructures: Public, private, hybrid and multi-cloud
✓ Optimized for all cloud innovations: cloud-to-cloud migration, IoT, advanced analytics, containerization and serverless processing, and machine learning models

1313
4,750+ customers across all industries rely on Talend for their data strategy
Financial services, Insurance
Life Sciences, Healthcare
Logistics, Transportation
Education
Construction, Manufacturing, Utilities
Retail , Consumer goods
Technology, Services

In a heavily regulated environment, AstraZeneca devised a strategic initiative of returning to growth galvanized around data consolidation and transformation. AstraZeneca built a data lake on AWS and Talend is at the heart of that architecture, growing 5 times its footprint since the start of its data journey.
Why Talend• Extensibility to build a new cloud ecosystem with strategic
vendors, all leveraging modern technologies, and deep AWS connectivity
• Ability to scale up and down based on business needs and cost predictability
Enabled 90% of data to be ready for analysis within 3 minutes
Shortened planning cycles from 15 days down to 3 hours
$1 billion per year savings by shortening clinical trials

L’Oréal differentiates itself with top quality products and innovation, fueled by an ongoing dialog between science and marketing. Its governed data lake collects, protects and shares all research knowledge (100 years of product development history), from product innovation to consumer assessment data.
Why Talend• Broad connectivity to all types of databases• Ability to put a Talend project on the collaborative developer
platform, GitHub• Integration of intelligent algorithms into data flows via APIs
New tailor-made digital platforms for L'Oréal researchers
50 million data entries managed everyday
From 2 days to 1 hour to send all product evaluations to the lab

AB InBev’s data hub on Azure cloud collects data from a vast range of sources, including IoT devices for data discovery to better understand customer tastes, improve store and bar experiences, supply chain optimization, product development and more
Why Talend• Built for Cloud • Reusable framework• Data discovery: a sandbox for data scientists, which they use to
test various data models
100+ source systems integratedFrom 6 months to 6 weeks for
development timeFrom 23 to 1
ETL tool

1717
Adam MeisterChief Financial Officer
Laurent BrideChief Operating Officer & Chief Technology Officer
Christal BemontChief Executive Officer
Lauren VaccarelloChief Marketing Officer
Jamie KiserChief Customer Officer
Ann-Christel GrahamChief Revenue Officer
Ciaran DynesSVP, Product
Aaron RossGeneral Counsel
Michelle SitzmanChief People Officer
Experienced leadership team

Financial overview

1919
Total ARR $ and ARR Growth1,2
$256M19% CC YoY
Cloud ARR $ and ARR Growth2,3
$75M130% CC YoY
Subscription Revenue
90%
Non-GAAP Subscription Gross
Margin4
87%
Q2’20 financial highlights
1. ARR defined as the annualized recurring value of all active contracts at the end of a reporting period.2. Constant currency (CC) year-over-year metrics are as of June 30, 2020.3. Cloud ARR defined as the annualized recurring value of all active cloud-based contracts as of the end of a reporting period.4. See Appendix page 30 for reconciliation.

2020
Rapidly growing cloud business
Cloud Annual Recurring Revenue ($M)
YoY % 310% 179% 150% 128%
1. CC defined as constant currency2. $100 million Cloud ARR by Q4’20 represents Talend’s guidance, not actuals
$33
$41
$54
$61
$75
Q2'19 Q3'19 Q4'19 Q1'20 Q2'20
$100M Cloud ARR by
Q4‘202
+130% YoY Growth on CC Basis1

2121
$218 $225
$243 $246 $256
Q2'19 Q3'19 Q4'19 Q1'20 Q2'20
Total annual recurring revenue
YoY % 24% 23% 20% 17%
1. CC defined as constant currency
+19% YoY Growth on CC Basis1
($ in millions)

2222
Customer expansion
Note:• Dollar-based net expansion rate is calculated by dividing recurring customer revenue by base revenue. Base revenue is defined asthe subscription revenue recognized from all customers during the four quarters
ended one year prior to the date of measurement. Recurring customer revenue is defined as the subscription revenue recognized during the four quarters ended on the date of measurement from the same customer base included in the measure of base revenue, including revenue resulting from additional sales to those customers. Dollar-based net expansion rate is presented on a constant currency basis.
• The numbers previously disclosed for each of the quarters of the years ended December 31, 2019 and 2018 have been revised to reflect the correction of an immaterial error. See Note 3, Revision of prior period financial statements, in our Annual Report on Form 10-K filed with the SEC on March 17, 2020 for more details.
• Our dollar-based net expansion rate excludes monthly customers.
122% 119% 118% 120% 117% 117%113% 111% 111% 110%
Q1'18 Q2'18 Q3'18 Q4'18 Q1'19 Q2'19 Q3'19 Q4'19 Q1'20 Q2'20
Dollar-based net expansion rate (CC)

2323
Revenue growth and mix
87% 88% 88% 89% 90%
13% 12%12% 11% 10%
$60 $62 $67 $68 $68
Q2'19 Q3'19 Q4'19 Q1'20 Q2'20
Subscription
Professional Services
Total Revenue ($M) Subscription Revenue ($M)
$53 $55
$60 $61 $61
Q2'19 Q3'19 Q4'19 Q1'20 Q2'20
+17% YoYon a CC Basis1
1. CC defined as constant currency2. Professional Services revenue growth moderating due to cloud mix shift and greater channel contribution.
Growth % 23% 21% 22% 16%Growth % 20% 20% 18% 12%
Growth impacted by ratable shift and PS growth moderation2

2424
531 540593 598 614
Q2'19 Q3'19 Q4'19 Q1'20 Q2'20
Enterprise customer growth
Number of Enterprise Customers1
1. Enterprise customers are defined as customers with ARR of $100,000 or more.
+16% YoY

2525
Non-GAAP Gross margin
Note: Non-GAAP Gross Margin excludes share-based compensation expense, amortization of acquired intangible assets, and other expenses. See Appendix page 30 for reconciliation.
76% 78% 79% 79% 80%86% 87% 87% 87% 87%
Q2'19 Q3'19 Q4'19 Q1'20 Q2'20
Total Gross Margin
Subscription Gross Margin

2626
($6)($3)
($1)($4)
($7)
Q2'19 Q3'19 Q4'19 Q1'20 Q2'20
Non-GAAP Operating loss
Note: Non-GAAP Operating Loss excludes share-based compensation expense, amortization of acquired intangible assets, and other expenses. See Appendix page 31 for reconciliation.
Margin % (10%) (5%) (1%) (6%) (10%)
($ in millions)

2727
Q3’20 and FY2020 guidance
Note: All values are Non-GAAP, and exclude share-based compensation expense, amortization of acquired intangible assets, and other expenses.
Q3'20 Low High FY20 Low High
($M, except per share data) ($M, except per share data)
Revenue $69.2 $70.2 Revenue $277.5 $279.5
Operating Loss ($11.6) ($10.6) Operating Loss ($36.0) ($34.0)
Net Loss ($12.4) ($11.4) Net Loss ($38.0) ($36.0)
EPS ($0.39) ($0.36) EPS ($1.20) ($1.14)

Appendix

2929
Balance sheet
Note: We have initially applied ASC 606 at January 1, 2018. Under the transition method chosen, the comparative information is not restated.
($ in thousands) 31-Dec-19 31-Mar-20 30-Jun-20
Cash and cash equivalents $177,075 $177,812 $164,968
Other assets $226,842 $193,727 $196,195
Total assets $403,917 $371,539 $361,163
Contract liabilities - Deferred revenue $160,423 $146,337 $140,426
Other liabilities $207,542 $193,083 $199,217
Total liabilities $367,965 $339,420 $339,643
Total shareholders’ equity $35,952 $32,119 $21,520

3030
GAAP to non-GAAP reconciliation
Note: We have initially applied ASC 606 at January 1, 2018. Under the transition method chosen, the comparative information is not restated.
($ in thousands) Q2’19 Q3’19 Q4’19 Q1'20 Q2'20
Total Revenue $60,305 $62,436 $67,454 $68,119 $67,738
GAAP Gross Profit $44,546 $47,688 $52,280 $53,354 $52,532
GAAP Subscription Gross Profit $44,131 $46,976 $51,141 $52,885 $51,938
Share-based Compensation Expense 899 773 814 248 1,031
Non-GAAP Subscription Gross Profit $45,030 $47,749 $51,955 $53,133 $52,969
GAAP Professional Services Gross Profit $415 $712 $1,139 $469 $594
Share-based Compensation Expense 603 472 530 406 409
Non-GAAP Professional Services Gross Profit $1,018 $1,184 $1,670 $875 $1,003
Non-GAAP Gross Profit $46,048 $48,933 $53,625 $54,008 $53,972
% Gross Margin 76% 78% 79% 79% 80%
GAAP Sales & Marketing Expense $34,528 $33,239 $35,588 $38,253 $39,531
Share-based Compensation Expense 3,106 3,030 2,565 2,454 3,737
Other Expenses 0 0 0 634 82
Non-GAAP Sales & Marketing Expense $31,422 $30,209 $33,023 $35,165 $35,712
GAAP Research & Development Expense $16,577 $15,552 $16,029 $15,934 $17,639
Share-based Compensation Expense 3,186 2,680 2,255 2,957 2,715
Amortization of acquired intangible assets 913 906 909 908 906
Non-GAAP Research & Development Expense $12,478 $11,966 $12,866 $12,069 $14,018
GAAP General & Administrative Expense $11,616 $12,164 $10,282 $15,655 $14,997
Share-based Compensation Expense 2,762 2,086 1,343 4,264 3,332
Amortization of acquired intangible assets 412 413 413 413 412
Other Expenses 0 0 0 440 0
Non-GAAP General & Administrative Expense $8,442 $9,665 $8,527 $10,538 $11,253
GAAP Operating Loss ($18,175) ($13,267) ($9,618) ($16,488) ($19,635)
Share-based Compensation Expense 10,556 9,039 7,507 10,329 11,224
Amortization of acquired intangible assets 1,325 1,319 1,321 1,321 1,318
Other Expenses 0 0 0 1,074 82
Non-GAAP Operating Loss ($6,294) ($2,909) ($790) ($3,764) ($7,011)

3131
GAAP to non-GAAP reconciliation:operating loss
Note: Non-GAAP reconciliation numbers may not foot due to decimal rounding.
($ in thousands) Q2’19 Q3’19 Q4'19 Q1'20 Q2'20
GAAP Operating Loss ($18,175) ($13,267) ($9,618) ($16,488) ($19,635)
Share-based Compensation Expense 10,556 9,039 7,507 10,329 11,224
Amortization of acquired intangibles 1,325 1,319 1,321 1,321 1,318
Transaction Related Expenses 0 0 0 1,074 82
Non-GAAP Operating Loss ($6,294) ($2,909) ($790) ($3,764) ($7,011)

3232
($ in thousands) 2019 Q1'20 Q2'20
Net cash from (used in) operating activities ($14,543) $2,848 ($15,099)
Less: Acquisition of property and equipment 2,191 2,449 716
Free Cash Flow ($16,734) $399 ($15,815)
Note: Net cash used in investing activities (2,191) (2,449) (716)
Note: Net cash from financing activities 157,838 3,886 (406)
Free cash flow reconciliation

3333
Subscription revenue reconciliation
($ in thousands) Q2’19 Q2'20
Subscription revenue as reported $52,615 $60,885
Conversion impact U.S. Dollar/other currencies 799
Subscription revenue on constant currency basis $52,615 $61,684
YoY % as reported 16 %
YoY % on constant currency basis 17 %

3434
Product taxonomy
On-prem Cloud
Data / Big Data Integration X X
Data Governance X X
Data Preparation X X
Pipeline Designer X
API Services X
Other Product Offerings X

Recognized
as a Leader in Forrester
Enterprise Data Fabric Waveby Noel Yuhannawith Gene Leganza, Robert Perdoni, and Christine TurleyJune 10°, 2020
Highest score in the current offering category.
"Data fabric [...] delivers a unified, intelligent, and integrated end-to-end platform to support new and emerging use cases. The sweet spot is its ability to deliver use cases quickly by leveraging innovation"
The Forrester Wave™ is copyrighted by Forrester Research, Inc. Forrester and Forrester Wave are trademarks of Forrester Research, Inc. The Forrester Wave is a graphical representation of Forrester's call on a market and is plotted using a detailed spreadsheet with exposed scores, weightings, and comments. Forrester does not endorse any vendor, product, or service depicted in the Forrester Wave. Information is based on best available resources. Opinions reflect judgment at the time and are subject to change. Source: Forrester Research (June 2020)

A Recognized Leader in
in Data Integration Tools
by GartnerMagic Quadrant for Data Integration tools, Ehtisham Zaidi, Eric Thoo, Nick Heudecker, 1 August, 2019.
Talend positioned as a Leader in the 2019 Gartner Magic Quadrant for Data Integration Tools based on completeness of vision and ability to execute.
This graphic was published by Gartner, Inc. as part of a larger research document and should be evaluated in the context of the entire document. The Gartner document is available upon request from https://bit.ly/1Ddgprv . Gartner does not endorse any vendor, product or service depicted in its research publications, and does not advise technology users to select only those vendors with the highest ratings or other designation. Gartner research publications consist of the opinions of Gartner's research organization and should not be construed as statements of fact. Gartner disclaims all warranties, expressed or implied, with respect to this research, including any warranties of merchantability or fitness for a particular purpose.
Figure 1. Magic Quadrant for Data Integration Tools

A Recognized Leader in Data Quality Solutions by GartnerMagic Quadrant For Data Quality SolutionsMelody Chien, Ankush Jain 27 July 2020
“Data quality initiatives have traditionally been mandated to fulfill compliance requirements and to reduce operational risks and costs. Increasingly, data quality is also a necessity when amplifying analytics for better insights and making trusted, data-driven decisions."
This graphic was published by Gartner, Inc. as part of a larger research document and should be evaluated in the context of the entire document. The Gartner document is available upon request from https://bit.ly/1Ddgprv . Gartner does not endorse any vendor, product or service depicted in its research publications, and does not advise technology users to select only those vendors with the highest ratings or other designation. Gartner research publications consist of the opinions of Gartner's research organization and should not be construed as statements of fact. Gartner disclaims all warranties, expressed or implied, with respect to this research, including any warranties of merchantability or fitness for a particular purpose.
Figure 1. Magic Quadrant for Data Quality Solutions

A Strong Performer in
Strategic IPaaS
Henry Peyret, Gene Leganza , Elizabeth Hoberman , Sara Sjoblom, January 2019
“Talend offers data, application, B2B, and IoT integration in a single IPaaS environment, for cloud and/or on-premises integration scenarios.”“predictable by-the-user subscription model, while most IPaaS competitors use a consumption model”
The Forrester Wave™ is copyrighted by Forrester Research, Inc. Forrester and Forrester Wave are trademarks of Forrester Research, Inc. The Forrester Wave is a graphical representation of Forrester's call on a market and is plotted using a detailed spreadsheet with exposed scores, weightings, and comments. Forrester does not endorse any vendor, product, or service depicted in the Forrester Wave. Information is based on best available resources. Opinions reflect judgment at the time and are subject to change.
The Forrester Wave™: Strategic iPaaS And Hybrid Integration Platforms, Q1 2019
Source: Forrester Research (January 2019)