Q2 FY18 Earnings Presentation - Global IT Leader … · content of this presentation, ... form the...
14
Q2 FY18 Earnings Presentation Infinite possibilities with technology December 08 th , 2017
Transcript of Q2 FY18 Earnings Presentation - Global IT Leader … · content of this presentation, ... form the...
Q2 FY18 Earnings Presentation
Infinite possibilities with technology
December 08th, 2017

SAFE HARBOR
2
This presentation has been prepared by Kellton Tech Solutions Limited solely to provide information about the Company.
No representation or warranty, express or implied is made as to, and no reliance should be placed on, the fairness, accuracy, completeness or
correctness of such information or opinions contained herein. None of the Company nor any of its respective affiliates, advisers or representatives,
shall have any liability whatsoever (in negligence or otherwise) for any loss howsoever arising from any use of this presentation or its contents or
otherwise arising in connection with this presentation.
The information contained in this presentation is only current as of its date. The Company may alter, modify or otherwise change in any manner the
content of this presentation, without obligation to notify any person of such revision or changes. Certain statements made in this presentation may
not be based on historical information or facts and may be "forward-looking statements", including those relating to the Company’s general business
plans and strategy, its future financial condition and growth prospects, and future developments in its industry and its competitive and regulatory
environment. Actual results may differ materially from these forward-looking statements due to a number of factors, including future changes or
developments in the Company’s business, its competitive environment, information technology and political, economic, legal and social conditions in
India.
Please note that this presentation is based on the publicly available information on Kellton Tech including but not limited to Company’s website and
Annual Reports.
This communication is for general information purposes only, without regard to specific objectives, financial situations and needs of any particular
person. Please note that investments in securities are subject to risks including loss of principal amount.
This presentation does not constitute an offer or invitation to purchase or subscribe for any shares in the Company and neither any part of it shall
form the basis of or be relied upon in connection with any contract or commitment whatsoever.

AGENDA
3
• Performance Highlight
• Financial Performance
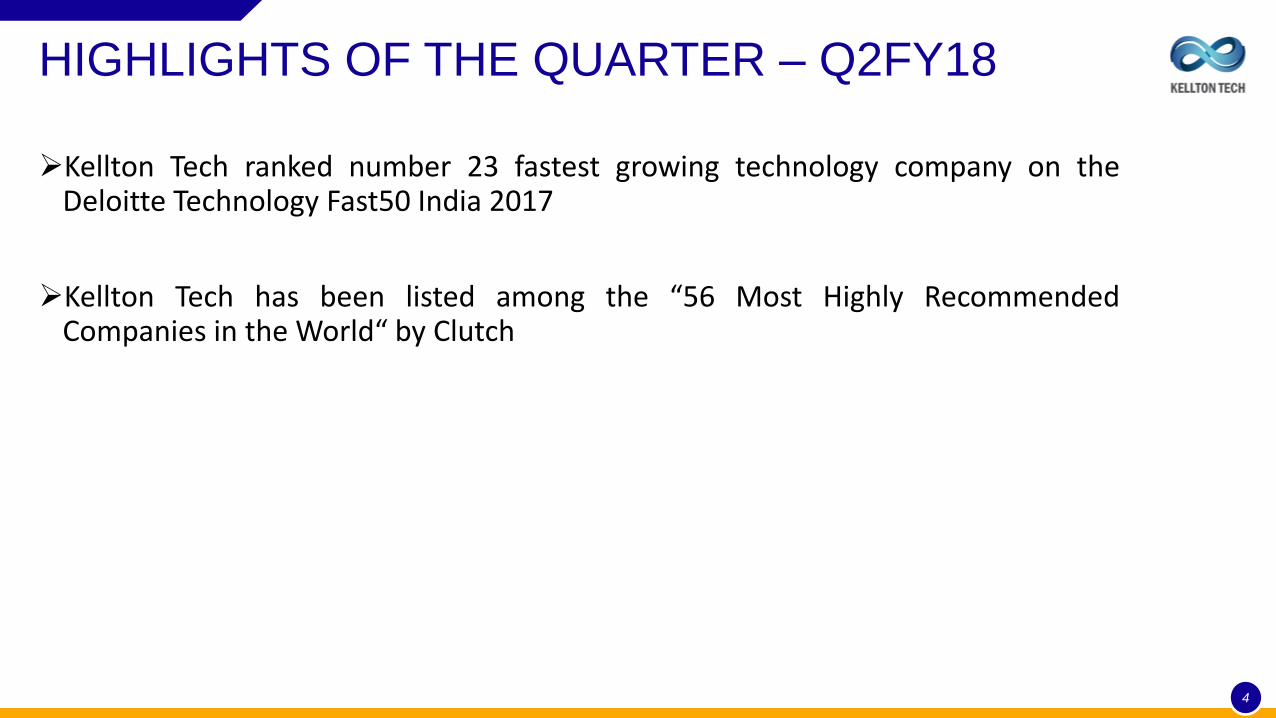
HIGHLIGHTS OF THE QUARTER – Q2FY18
Kellton Tech ranked number 23 fastest growing technology company on the Deloitte Technology Fast50 India 2017
Kellton Tech has been listed among the “56 Most Highly Recommended Companies in the World“ by Clutch
4

Q2 FY18 – HIGHLIGHTS
5
Financial Highlights:
Total revenue of Rs 1,852.5 million; up 5.4% QoQ and up 22.6% YoY
Profit:
EBITDA was at Rs 280.0 million; up 9.6% QoQ and up 34.6% YoY
EBITDA Margin stood at 15.1%
Net Profit stood at Rs 149.6 million; up 2.4% QoQ and up 15.6% YoY
PAT Margin of 8.1%
EPS was at Rs 3.17; up 2.3% QoQ and up 15.3% YoY
Note: 1. Financial performance Q2FY18, Q1FY18 and Q2FY17 are as per IND AS

H1 FY18 – HIGHLIGHTS
6
Financial Highlights:
Total revenue of Rs 3,610.7 million; up 23.8% YoY
Profit: EBITDA was at Rs 535.6 million; up 34.0% YoY
EBITDA Margin stood at 14.8%
Net Profit stood at Rs 295.8 million; up 18.2% YoY
PAT Margin of 8.2%
EPS was at Rs 6.26; up 17.7% YoY
Note: 1. Financial performance Q2FY18, Q1FY18 and Q2FY17 are as per IND AS

Acquired 6 new clients, prominent of them are:
NEW CLIENT WINS – Q2 FY18
7
An end-to-end digital transformation solution that enabled high net worth individuals manage their wealth along with key financial trends and investment opportunities
Implementing the ‘Early Digital Learning Program (EDLP)’ project for the Republic of Mauritius. The project involves Supply, Commissioning, and Maintenance of a Tablet-based learning program in Mauritius
Developed a revolutionary, one-stop health care platform dedicated to extend the horizons of healthcare facilities and services
Developed a customer-centric and intelligent digital platform for one of the leading manufacturer of electric motors, mechanical, and electrical motion controls and power generation products
A leading financial
firm
Digital Learning
Program
A leading pharmacy
store chain
A leading
manufacturer

AGENDA
8
• Performance Highlight
• Financial Performance
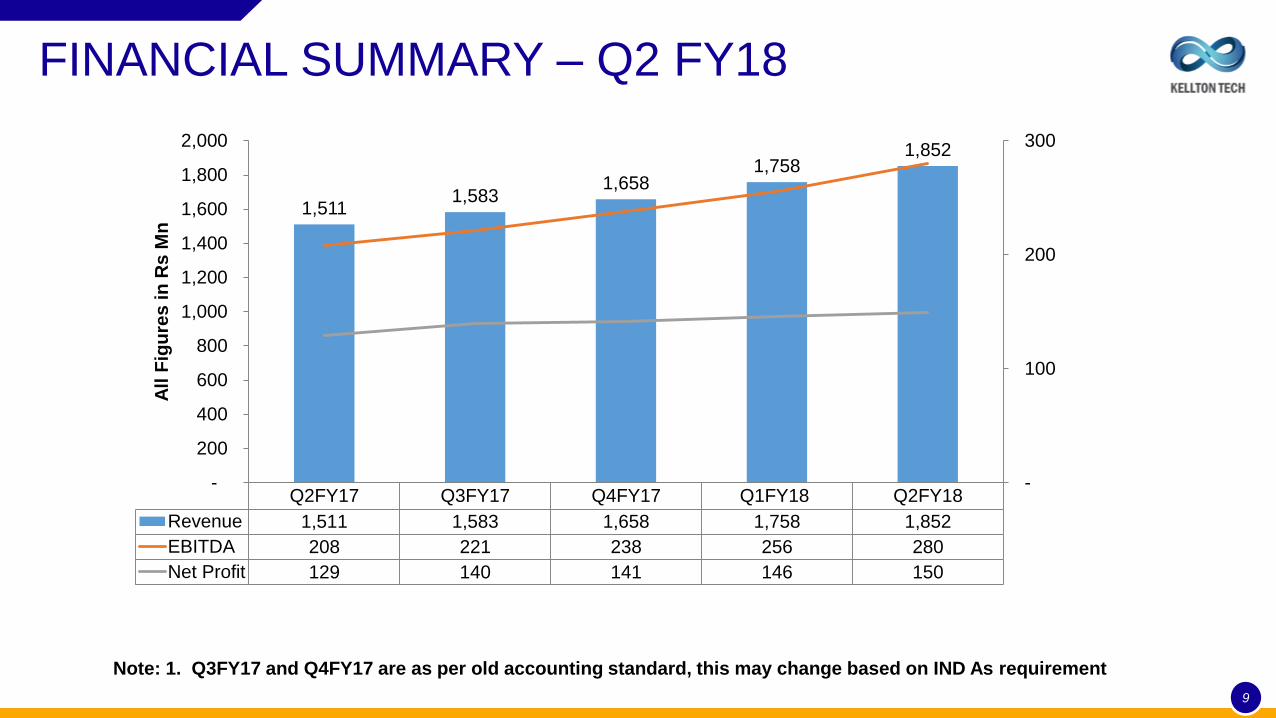
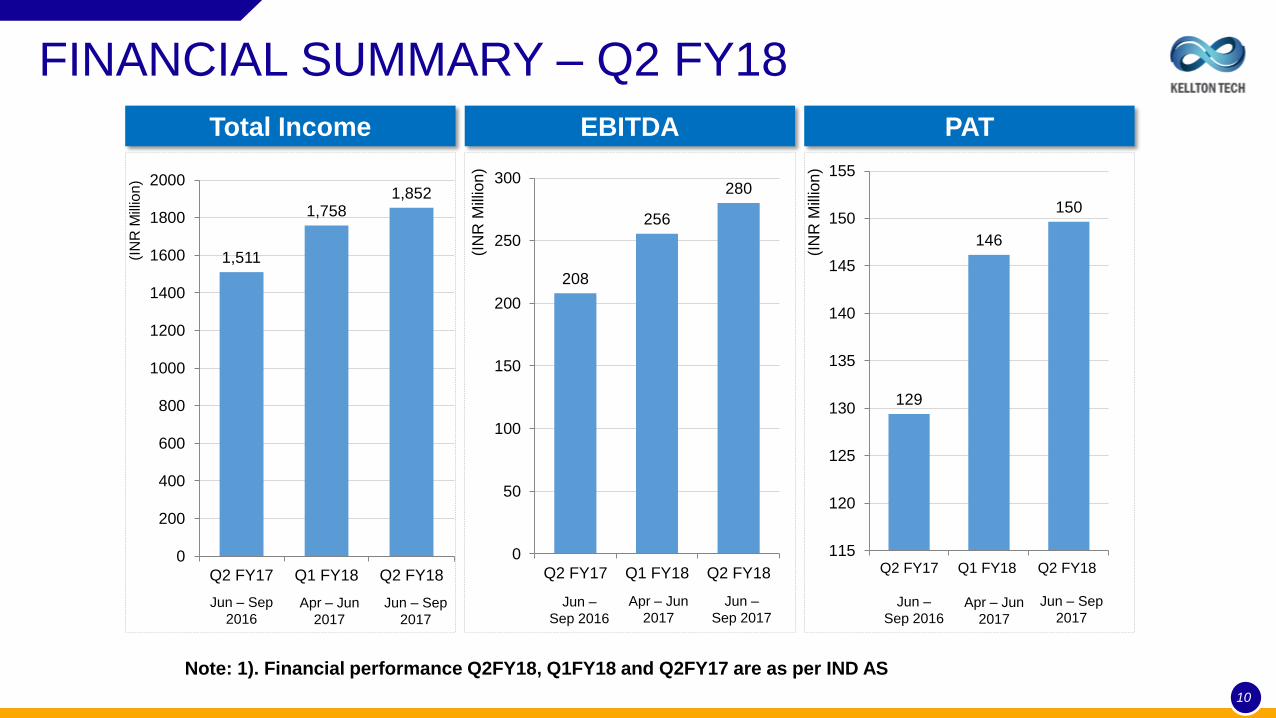
FINANCIAL SUMMARY – Q2 FY18
9
Note: 1. Q3FY17 and Q4FY17 are as per old accounting standard, this may change based on IND As requirement
Q2FY17 Q3FY17 Q4FY17 Q1FY18 Q2FY18
Revenue 1,511 1,583 1,658 1,758 1,852
EBITDA 208 221 238 256 280
Net Profit 129 140 141 146 150
1,511 1,583
1,658 1,758
1,852
-
100
200
300
-
200
400
600
800
1,000
1,200
1,400
1,600
1,800
2,000A
ll F
igu
res
in
Rs
Mn
FINANCIAL SUMMARY – Q2 FY18
10
Total Income EBITDA PAT
129
146
150
115
120
125
130
135
140
145
150
155
Q2 FY17 Q1 FY18 Q2 FY18
(IN
R M
illio
n)
(IN
R M
illio
n)
1,511
1,758 1,852
0
200
400
600
800
1000
1200
1400
1600
1800
2000
Q2 FY17 Q1 FY18 Q2 FY18
(IN
R M
illio
n)
208
256
280
0
50
100
150
200
250
300
Q2 FY17 Q1 FY18 Q2 FY18
Jun – Sep
2016 Apr – Jun
2017
Jun – Sep
2017
Jun –
Sep 2016
Apr – Jun
2017
Jun –
Sep 2017 Jun –
Sep 2016 Apr – Jun
2017
Jun – Sep
2017
Note: 1). Financial performance Q2FY18, Q1FY18 and Q2FY17 are as per IND AS
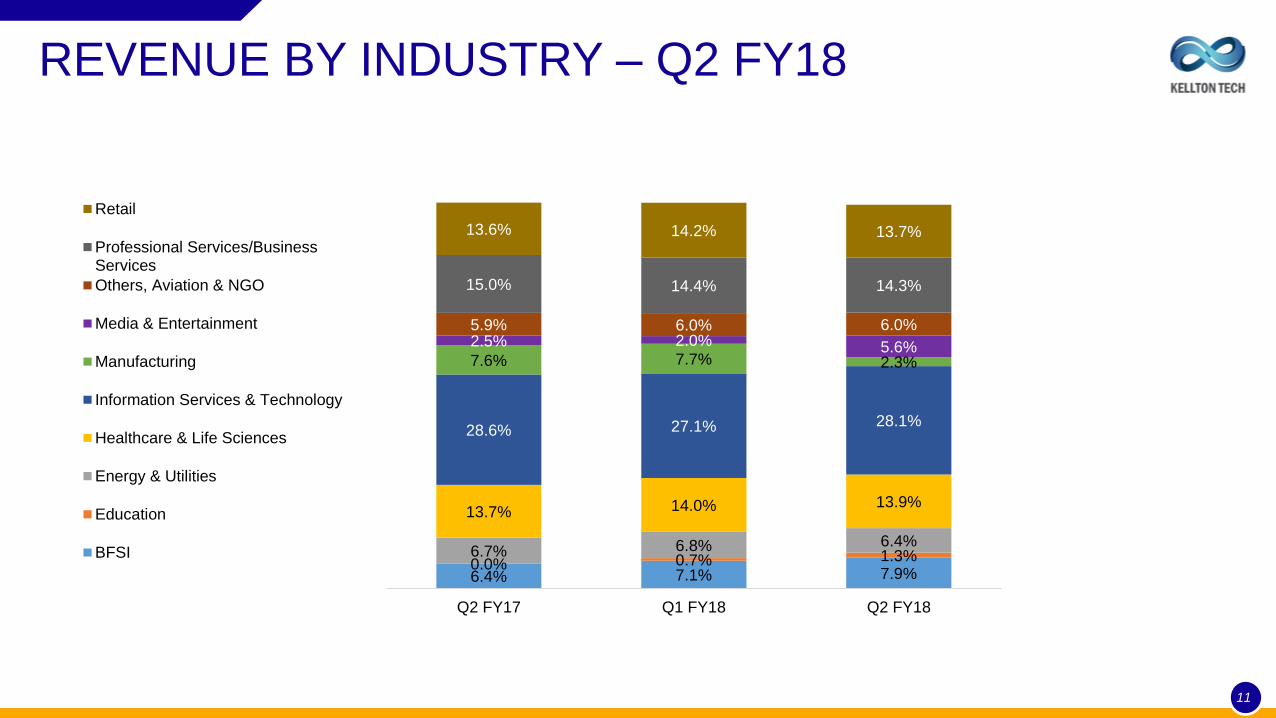
REVENUE BY INDUSTRY – Q2 FY18
11
6.4% 7.1% 7.9% 0.0% 0.7% 1.3% 6.7% 6.8% 6.4%
13.7% 14.0% 13.9%
28.6% 27.1% 28.1%
7.6% 7.7% 2.3%
2.5% 2.0% 5.6%
5.9% 6.0% 6.0%
15.0% 14.4% 14.3%
13.6% 14.2% 13.7%
Q2 FY17 Q1 FY18 Q2 FY18
Retail
Professional Services/BusinessServices
Others, Aviation & NGO
Media & Entertainment
Manufacturing
Information Services & Technology
Healthcare & Life Sciences
Energy & Utilities
Education
BFSI
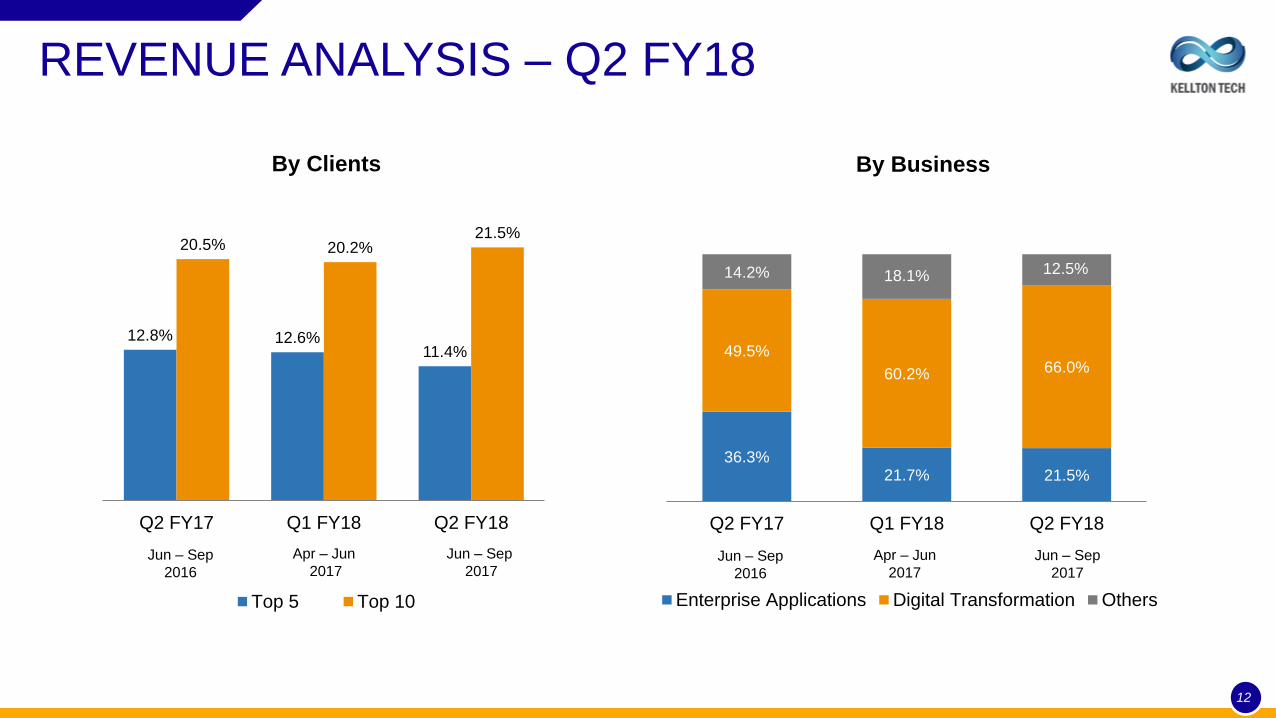
REVENUE ANALYSIS – Q2 FY18
12
12.8% 12.6% 11.4%
20.5% 20.2% 21.5%
Q2 FY17 Q1 FY18 Q2 FY18
By Clients
Top 5 Top 10
Jun – Sep
2016
Apr – Jun
2017
Jun – Sep
2017
36.3% 21.7% 21.5%
49.5%
60.2% 66.0%
14.2% 18.1% 12.5%
Q2 FY17 Q1 FY18 Q2 FY18
By Business
Enterprise Applications Digital Transformation Others
Jun – Sep
2016
Apr – Jun
2017
Jun – Sep
2017
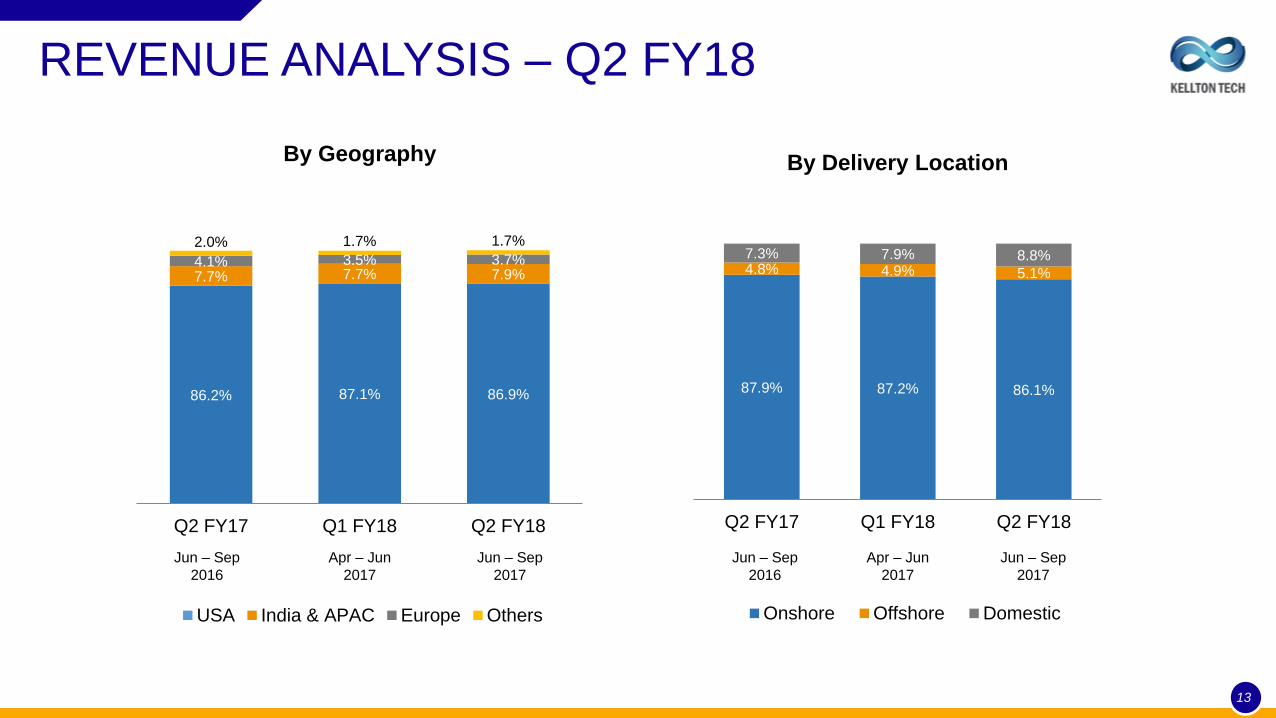
REVENUE ANALYSIS – Q2 FY18
86.2% 87.1% 86.9%
7.7% 7.7% 7.9% 4.1% 3.5% 3.7%
2.0% 1.7% 1.7%
Q2 FY17 Q1 FY18 Q2 FY18
By Geography
USA India & APAC Europe Others
87.9% 87.2% 86.1%
4.8% 4.9% 5.1%
7.3% 7.9% 8.8%
Q2 FY17 Q1 FY18 Q2 FY18
By Delivery Location
Onshore Offshore Domestic
Jun – Sep
2016
Apr – Jun
2017
Jun – Sep
2017
13
Jun – Sep
2016
Apr – Jun
2017
Jun – Sep
2017

©2017