Q2 2020 Update - Seeking Alpha
26
Q2 2020 Update
Transcript of Q2 2020 Update - Seeking Alpha

Q2 2020 Update
Highlights 03
Financial Summary 04
Operational Summary 06
Vehicle Capacity 07
Core Technology 08
Other Highlights 09
Outlook 10
Photos & Charts 11
Financial Statements 20
Additional Information 25
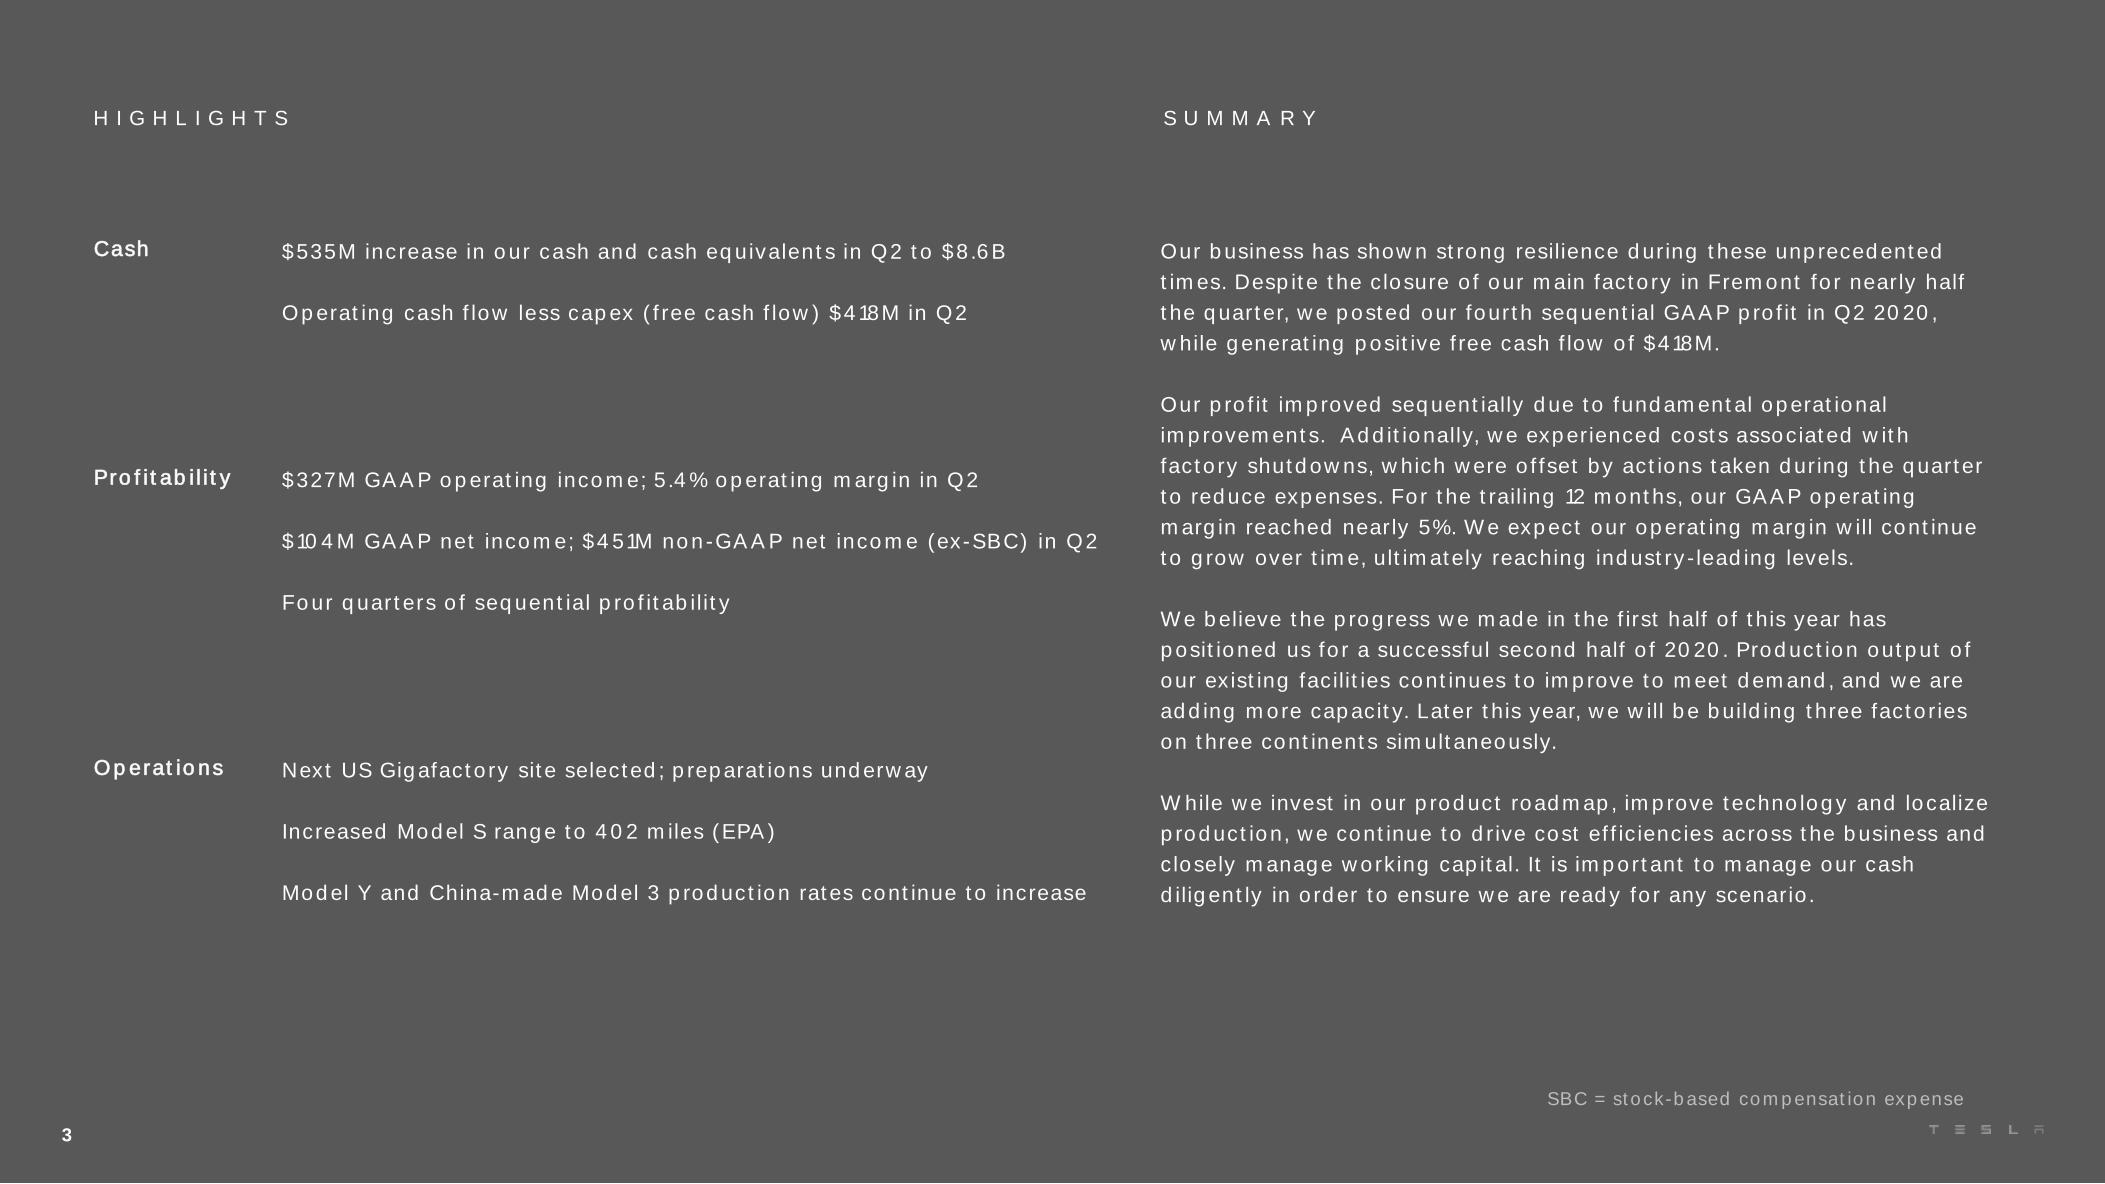
Our business has shown strong resilience during these unprecedented
times. Despite the closure of our main factory in Fremont for nearly half
the quarter, we posted our fourth sequential GAAP profit in Q2 2020,
while generating positive free cash flow of $418M.
Our profit improved sequentially due to fundamental operational
improvements. Additionally, we experienced costs associated with
factory shutdowns, which were offset by actions taken during the quarter
to reduce expenses. For the trailing 12 months, our GAAP operating
margin reached nearly 5%. We expect our operating margin will continue
to grow over time, ultimately reaching industry-leading levels.
We believe the progress we made in the first half of this year has
positioned us for a successful second half of 2020. Production output of
our existing facilities continues to improve to meet demand, and we are
adding more capacity. Later this year, we will be building three factories
on three continents simultaneously.
While we invest in our product roadmap, improve technology and localize
production, we continue to drive cost efficiencies across the business and
closely manage working capital. It is important to manage our cash
diligently in order to ensure we are ready for any scenario.
$535M increase in our cash and cash equivalents in Q2 to $8.6B
Operating cash flow less capex (free cash flow) $418M in Q2
Cash
Next US Gigafactory site selected; preparations underway
Increased Model S range to 402 miles (EPA)
Model Y and China-made Model 3 production rates continue to increase
Profitability $327M GAAP operating income; 5.4% operating margin in Q2
$104M GAAP net income; $451M non-GAAP net income (ex-SBC) in Q2
Four quarters of sequential profitability
Operations
S U M M A R YH I G H L I G H T S
3
SBC = stock-based compensation expense
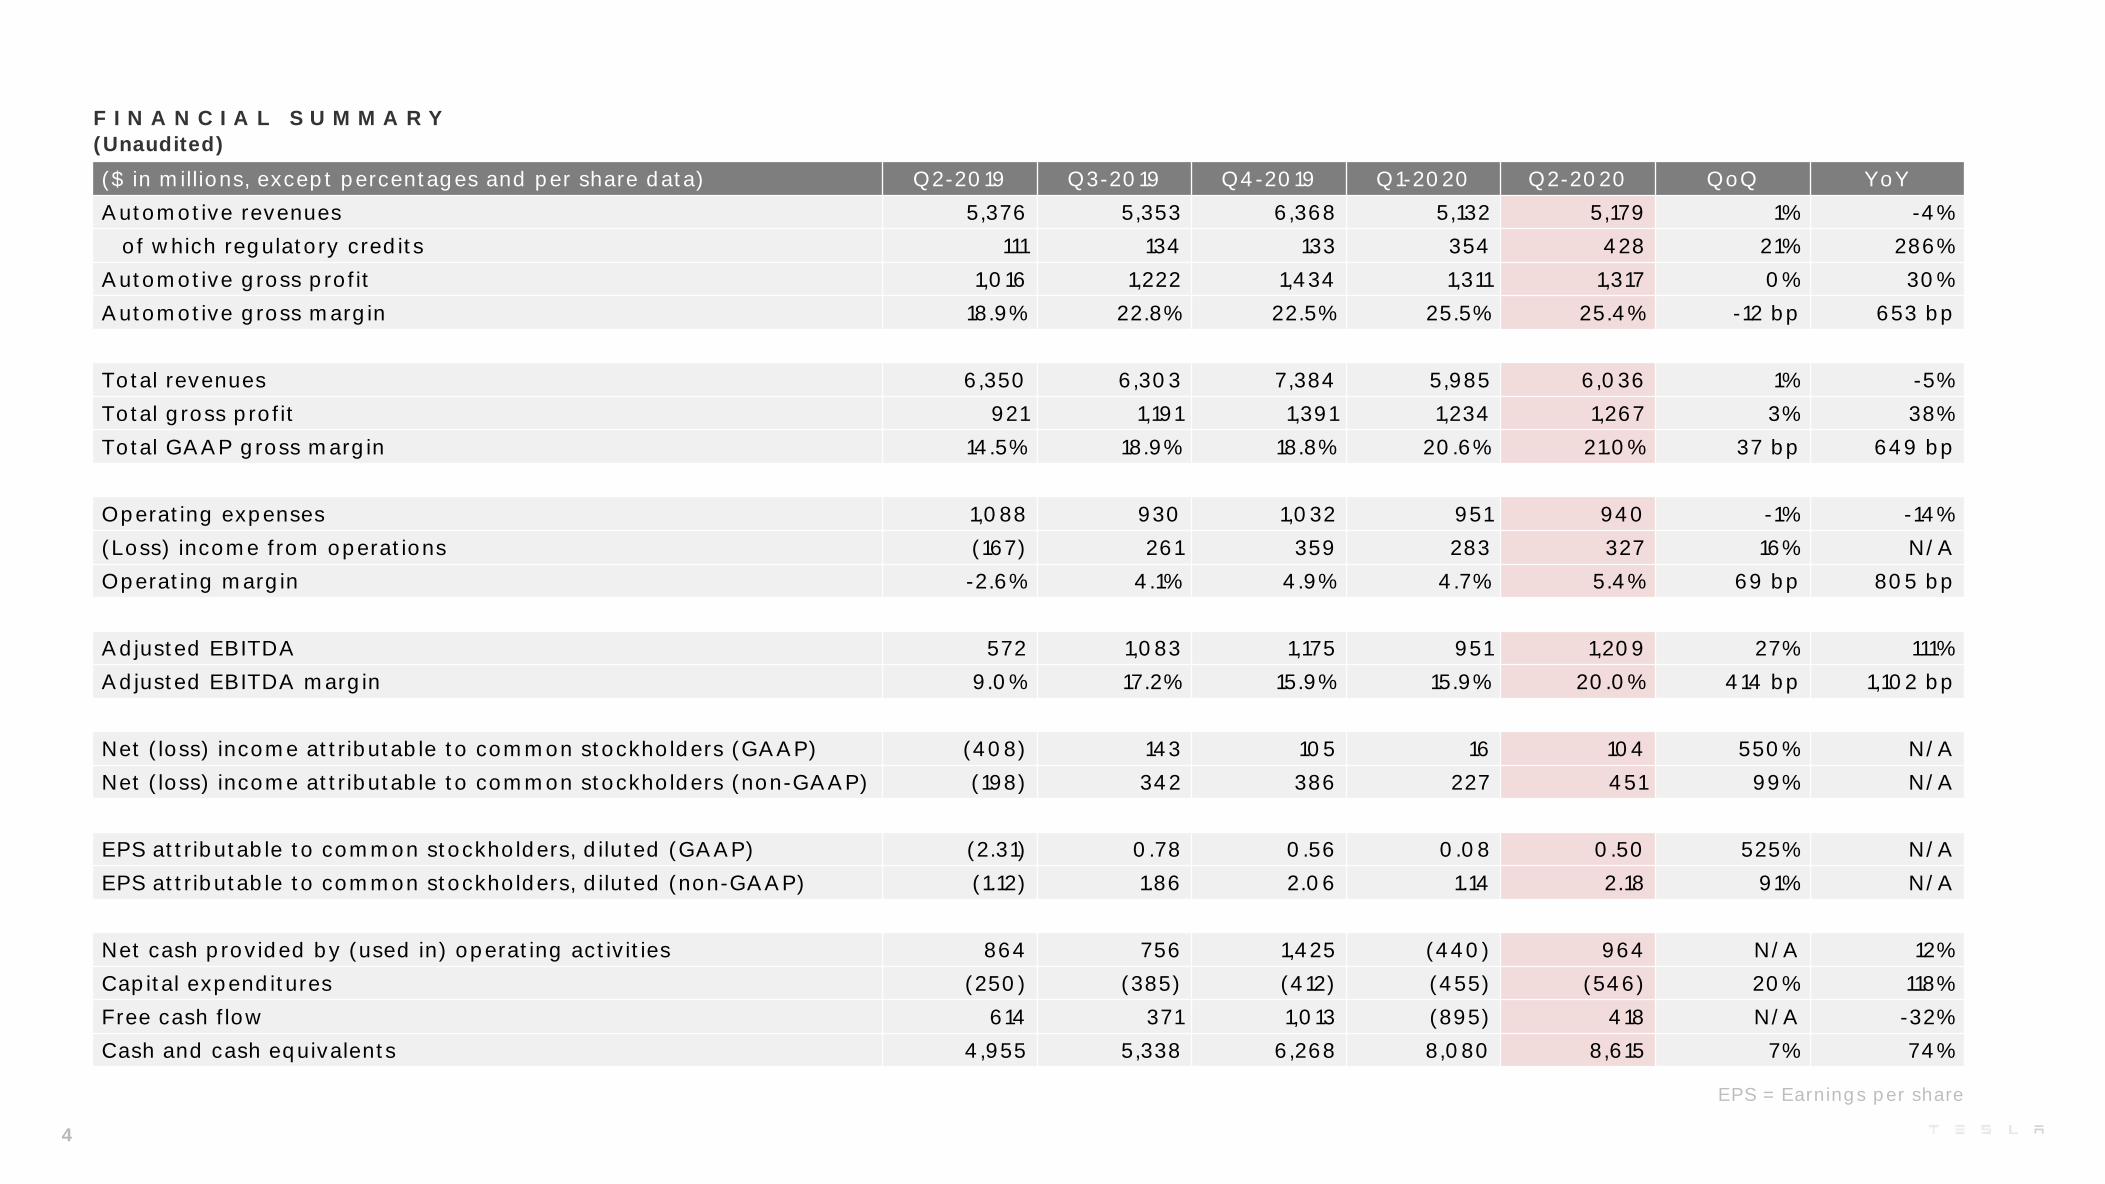
F I N A N C I A L S U M M A R Y
(Unaudited)
4
($ in millions, except percentages and per share data) Q2-2019 Q3-2019 Q4-2019 Q1-2020 Q2-2020 QoQ YoY
Automotive revenues 5,376 5,353 6,368 5,132 5,179 1% -4%
of which regulatory credits 111 134 133 354 428 21% 286%
Automotive gross profit 1,016 1,222 1,434 1,311 1,317 0% 30%
Automotive gross margin 18.9% 22.8% 22.5% 25.5% 25.4% -12 bp 653 bp
Total revenues 6,350 6,303 7,384 5,985 6,036 1% -5%
Total gross profit 921 1,191 1,391 1,234 1,267 3% 38%
Total GAAP gross margin 14.5% 18.9% 18.8% 20.6% 21.0% 37 bp 649 bp
Operating expenses 1,088 930 1,032 951 940 -1% -14%
(Loss) income from operations (167) 261 359 283 327 16% N/A
Operating margin -2.6% 4.1% 4.9% 4.7% 5.4% 69 bp 805 bp
Adjusted EBITDA 572 1,083 1,175 951 1,209 27% 111%
Adjusted EBITDA margin 9.0% 17.2% 15.9% 15.9% 20.0% 414 bp 1,102 bp
Net (loss) income attributable to common stockholders (GAAP) (408) 143 105 16 104 550% N/A
Net (loss) income attributable to common stockholders (non-GAAP) (198) 342 386 227 451 99% N/A
EPS attributable to common stockholders, diluted (GAAP) (2.31) 0.78 0.56 0.08 0.50 525% N/A
EPS attributable to common stockholders, diluted (non-GAAP) (1.12) 1.86 2.06 1.14 2.18 91% N/A
Net cash provided by (used in) operating activities 864 756 1,425 (440) 964 N/A 12%
Capital expenditures (250) (385) (412) (455) (546) 20% 118%
Free cash flow 614 371 1,013 (895) 418 N/A -32%
Cash and cash equivalents 4,955 5,338 6,268 8,080 8,615 7% 74%
EPS = Earnings per share
F I N A N C I A L S U M M A R Y
Revenue
Profitability
Cash
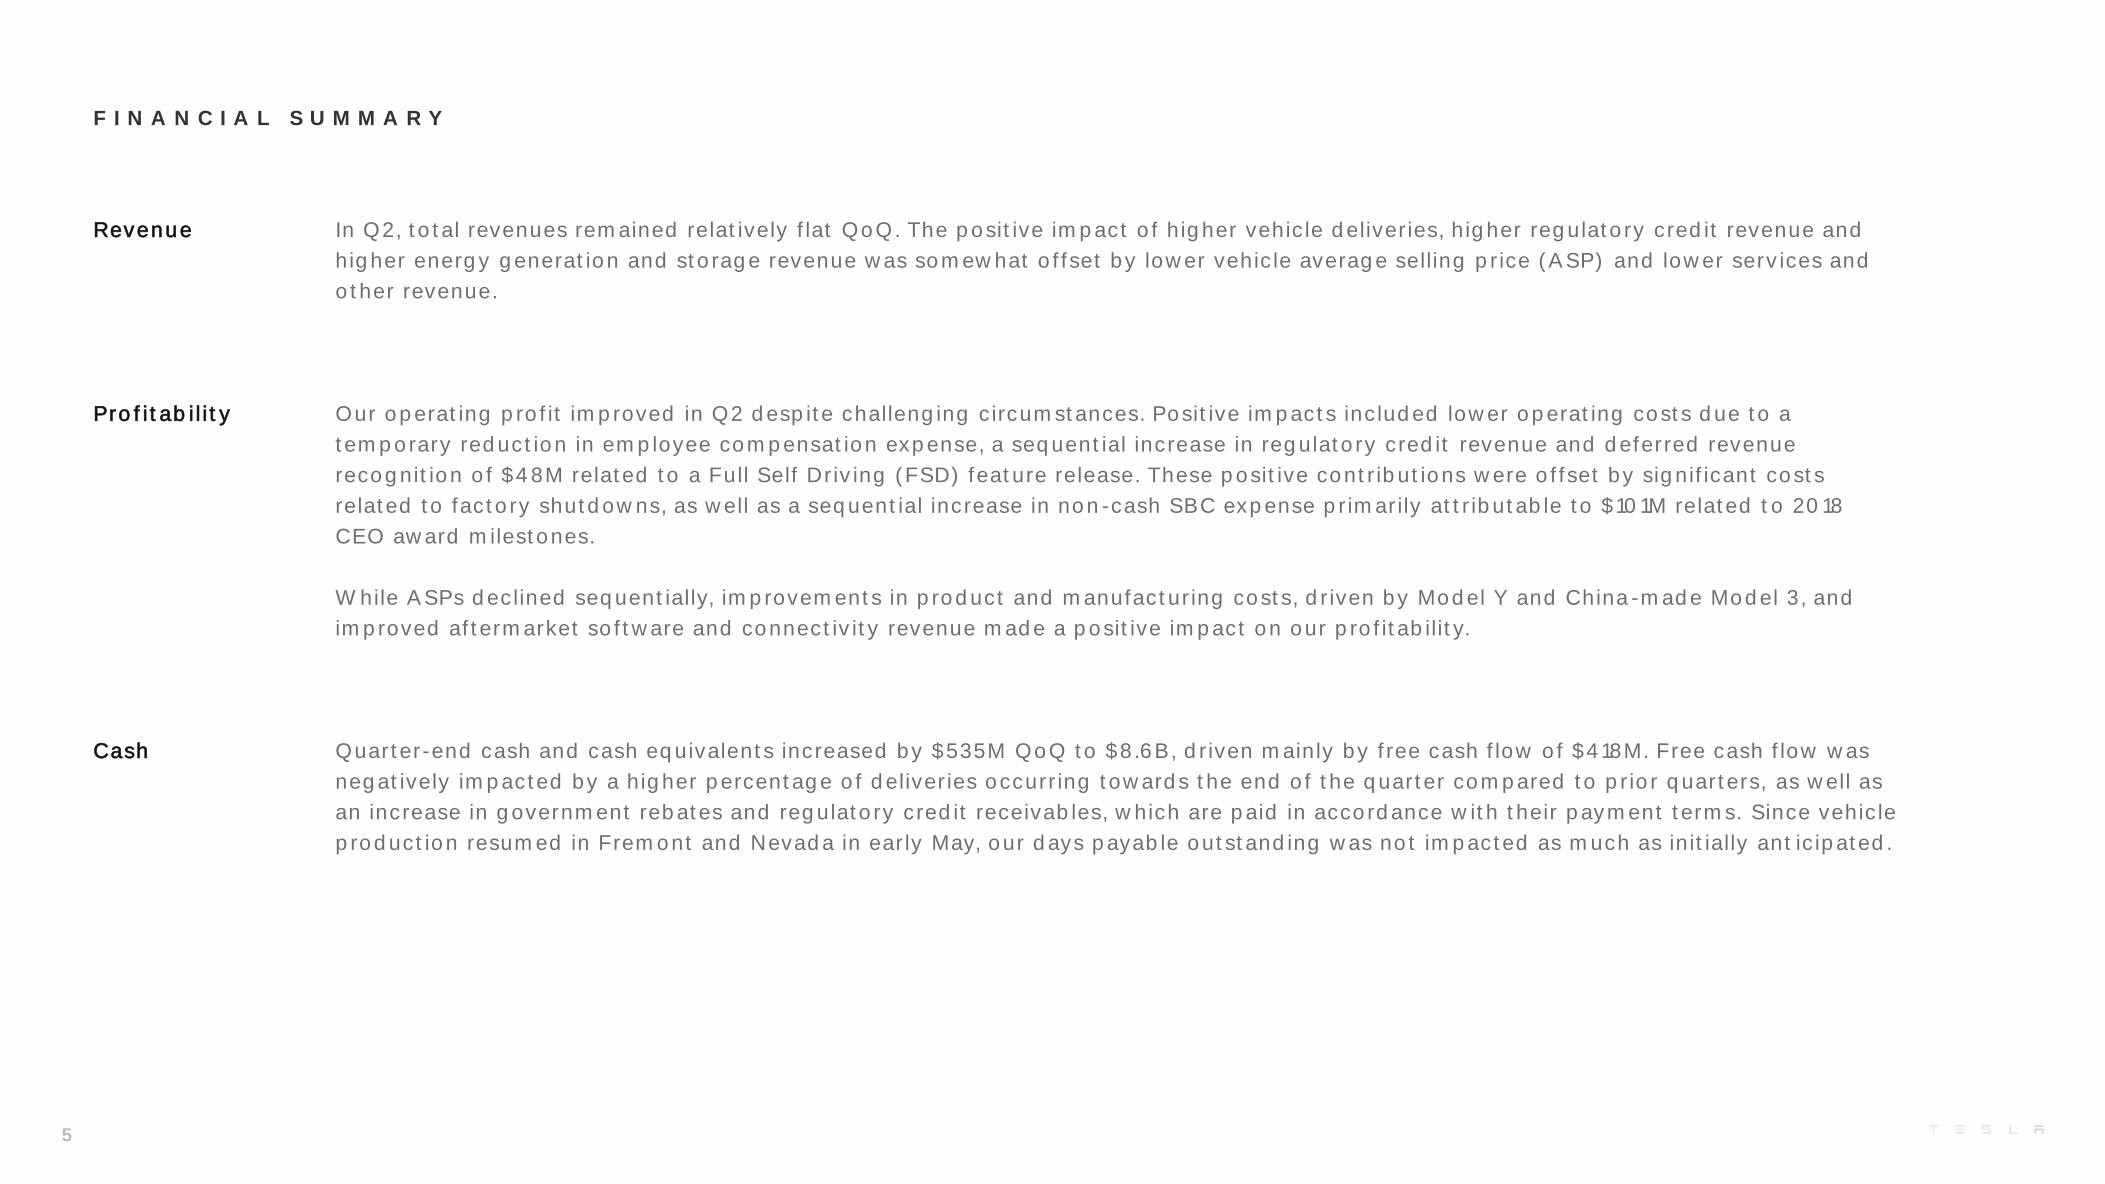
In Q2, total revenues remained relatively flat QoQ. The positive impact of higher vehicle deliveries, higher regulatory credit revenue and
higher energy generation and storage revenue was somewhat offset by lower vehicle average selling price (ASP) and lower services and
other revenue.
Our operating profit improved in Q2 despite challenging circumstances. Positive impacts included lower operating costs due to a
temporary reduction in employee compensation expense, a sequential increase in regulatory credit revenue and deferred revenue
recognition of $48M related to a Full Self Driving (FSD) feature release. These positive contributions were offset by significant costs
related to factory shutdowns, as well as a sequential increase in non-cash SBC expense primarily attributable to $101M related to 2018
CEO award milestones.
While ASPs declined sequentially, improvements in product and manufacturing costs, driven by Model Y and China-made Model 3, and
improved aftermarket software and connectivity revenue made a positive impact on our profitability.
Quarter-end cash and cash equivalents increased by $535M QoQ to $8.6B, driven mainly by free cash flow of $418M. Free cash flow was
negatively impacted by a higher percentage of deliveries occurring towards the end of the quarter compared to prior quarters, as well as
an increase in government rebates and regulatory credit receivables, which are paid in accordance with their payment terms. Since vehicle
production resumed in Fremont and Nevada in early May, our days payable outstanding was not impacted as much as initially anticipated.
5
Q2-2019 Q3-2019 Q4-2019 Q1-2020 Q2-2020 QoQ YoY
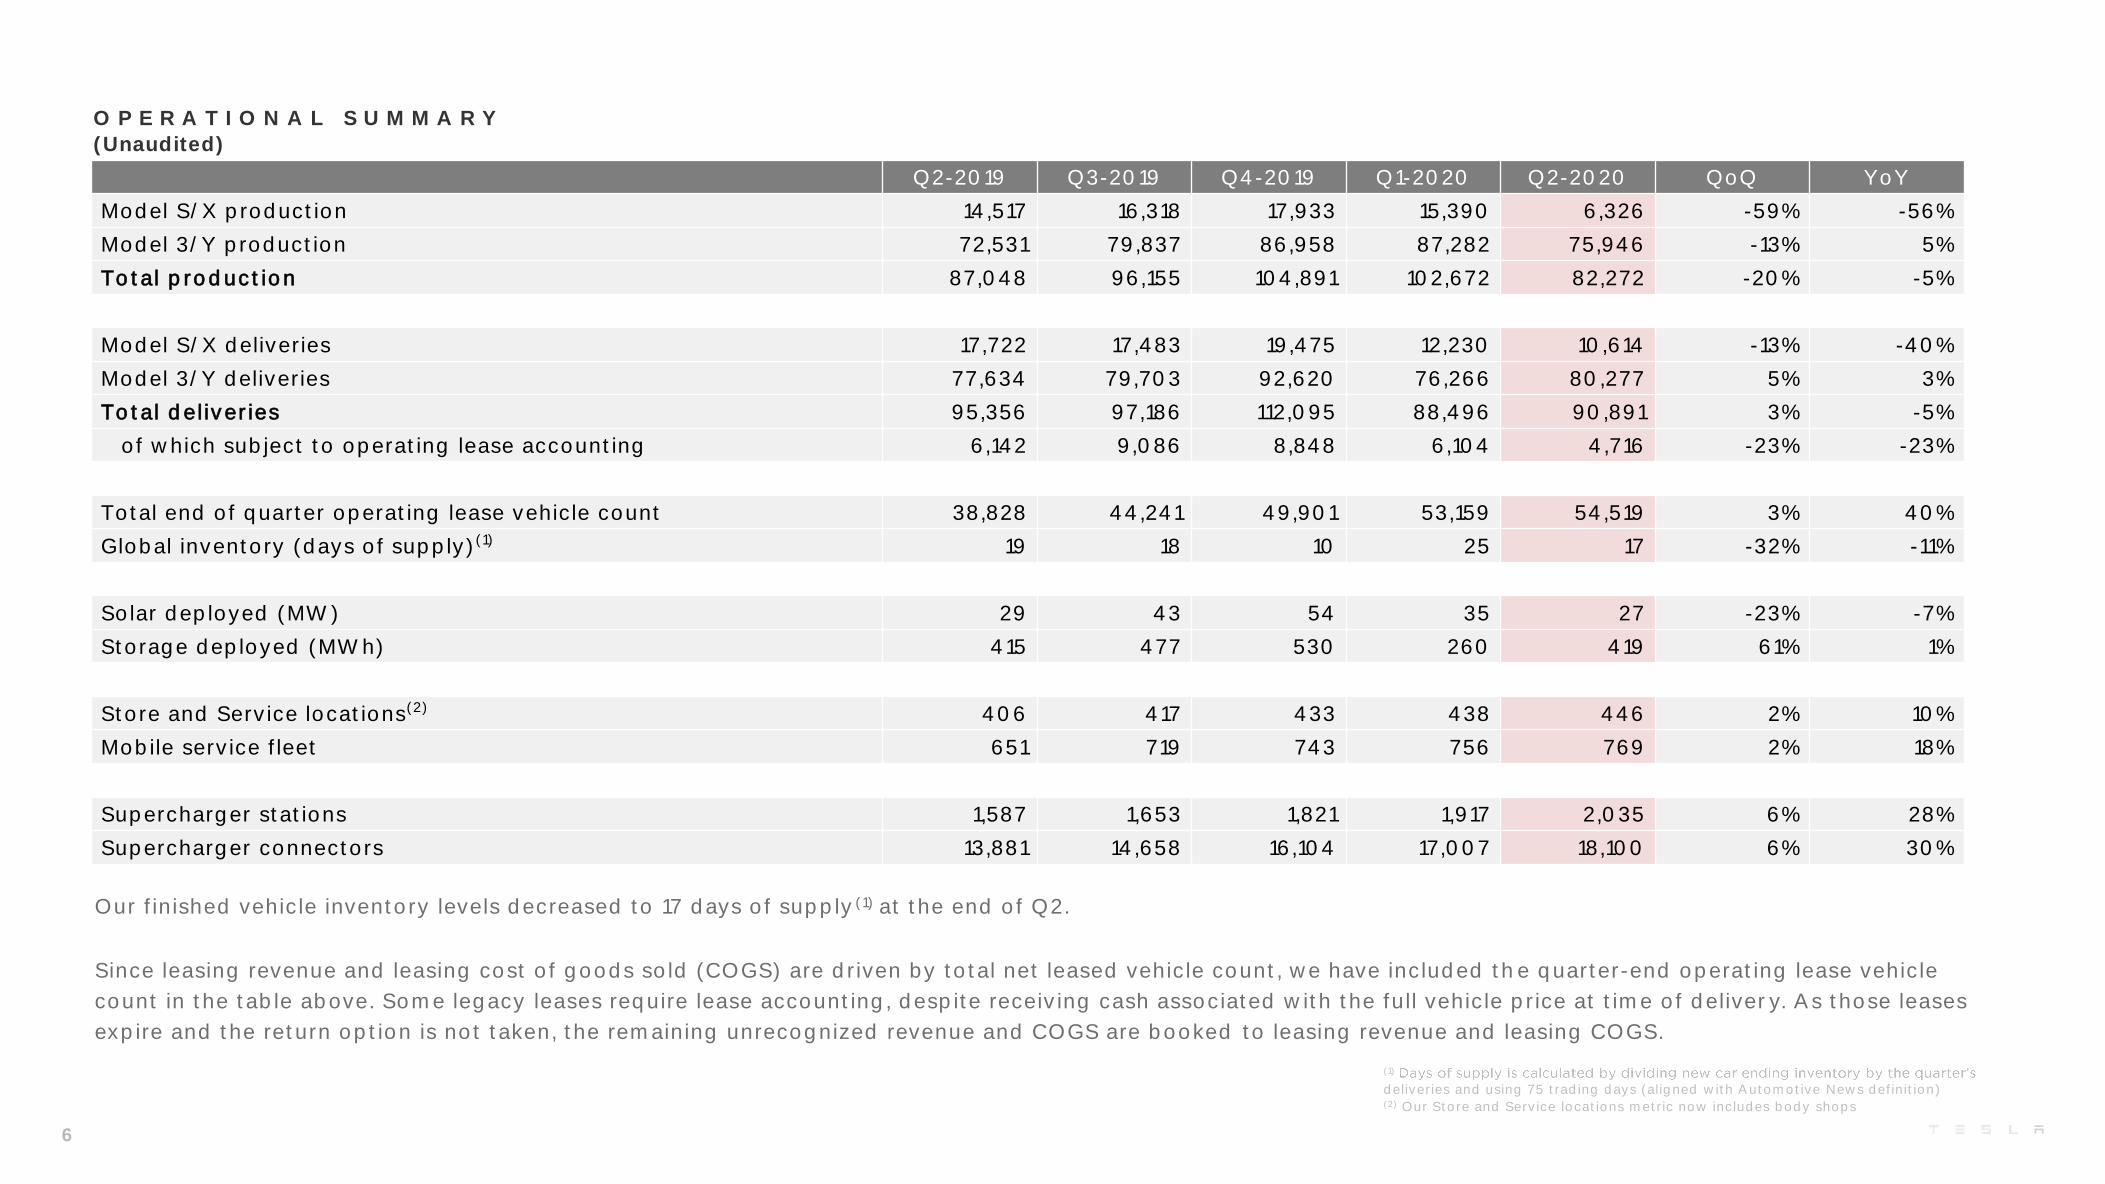
Model S/X production 14,517 16,318 17,933 15,390 6,326 -59% -56%
Model 3/Y production 72,531 79,837 86,958 87,282 75,946 -13% 5%
Total production 87,048 96,155 104,891 102,672 82,272 -20% -5%
Model S/X deliveries 17,722 17,483 19,475 12,230 10,614 -13% -40%
Model 3/Y deliveries 77,634 79,703 92,620 76,266 80,277 5% 3%
Total deliveries 95,356 97,186 112,095 88,496 90,891 3% -5%
of which subject to operating lease accounting 6,142 9,086 8,848 6,104 4,716 -23% -23%
Total end of quarter operating lease vehicle count 38,828 44,241 49,901 53,159 54,519 3% 40%
Global inventory (days of supply)(1) 19 18 10 25 17 -32% -11%
Solar deployed (MW) 29 43 54 35 27 -23% -7%
Storage deployed (MWh) 415 477 530 260 419 61% 1%
Store and Service locations(2) 406 417 433 438 446 2% 10%
Mobile service fleet 651 719 743 756 769 2% 18%
Supercharger stations 1,587 1,653 1,821 1,917 2,035 6% 28%
Supercharger connectors 13,881 14,658 16,104 17,007 18,100 6% 30%
Our finished vehicle inventory levels decreased to 17 days of supply(1) at the end of Q2.
Since leasing revenue and leasing cost of goods sold (COGS) are driven by total net leased vehicle count, we have included the quarter-end operating lease vehicle
count in the table above. Some legacy leases require lease accounting, despite receiving cash associated with the full vehicle price at time of delivery. As those leases
expire and the return option is not taken, the remaining unrecognized revenue and COGS are booked to leasing revenue and leasing COGS.
(1)
deliveries and using 75 trading days (aligned with Automotive News definition)(2) Our Store and Service locations metric now includes body shops
6
O P E R A T I O N A L S U M M A R Y
(Unaudited)
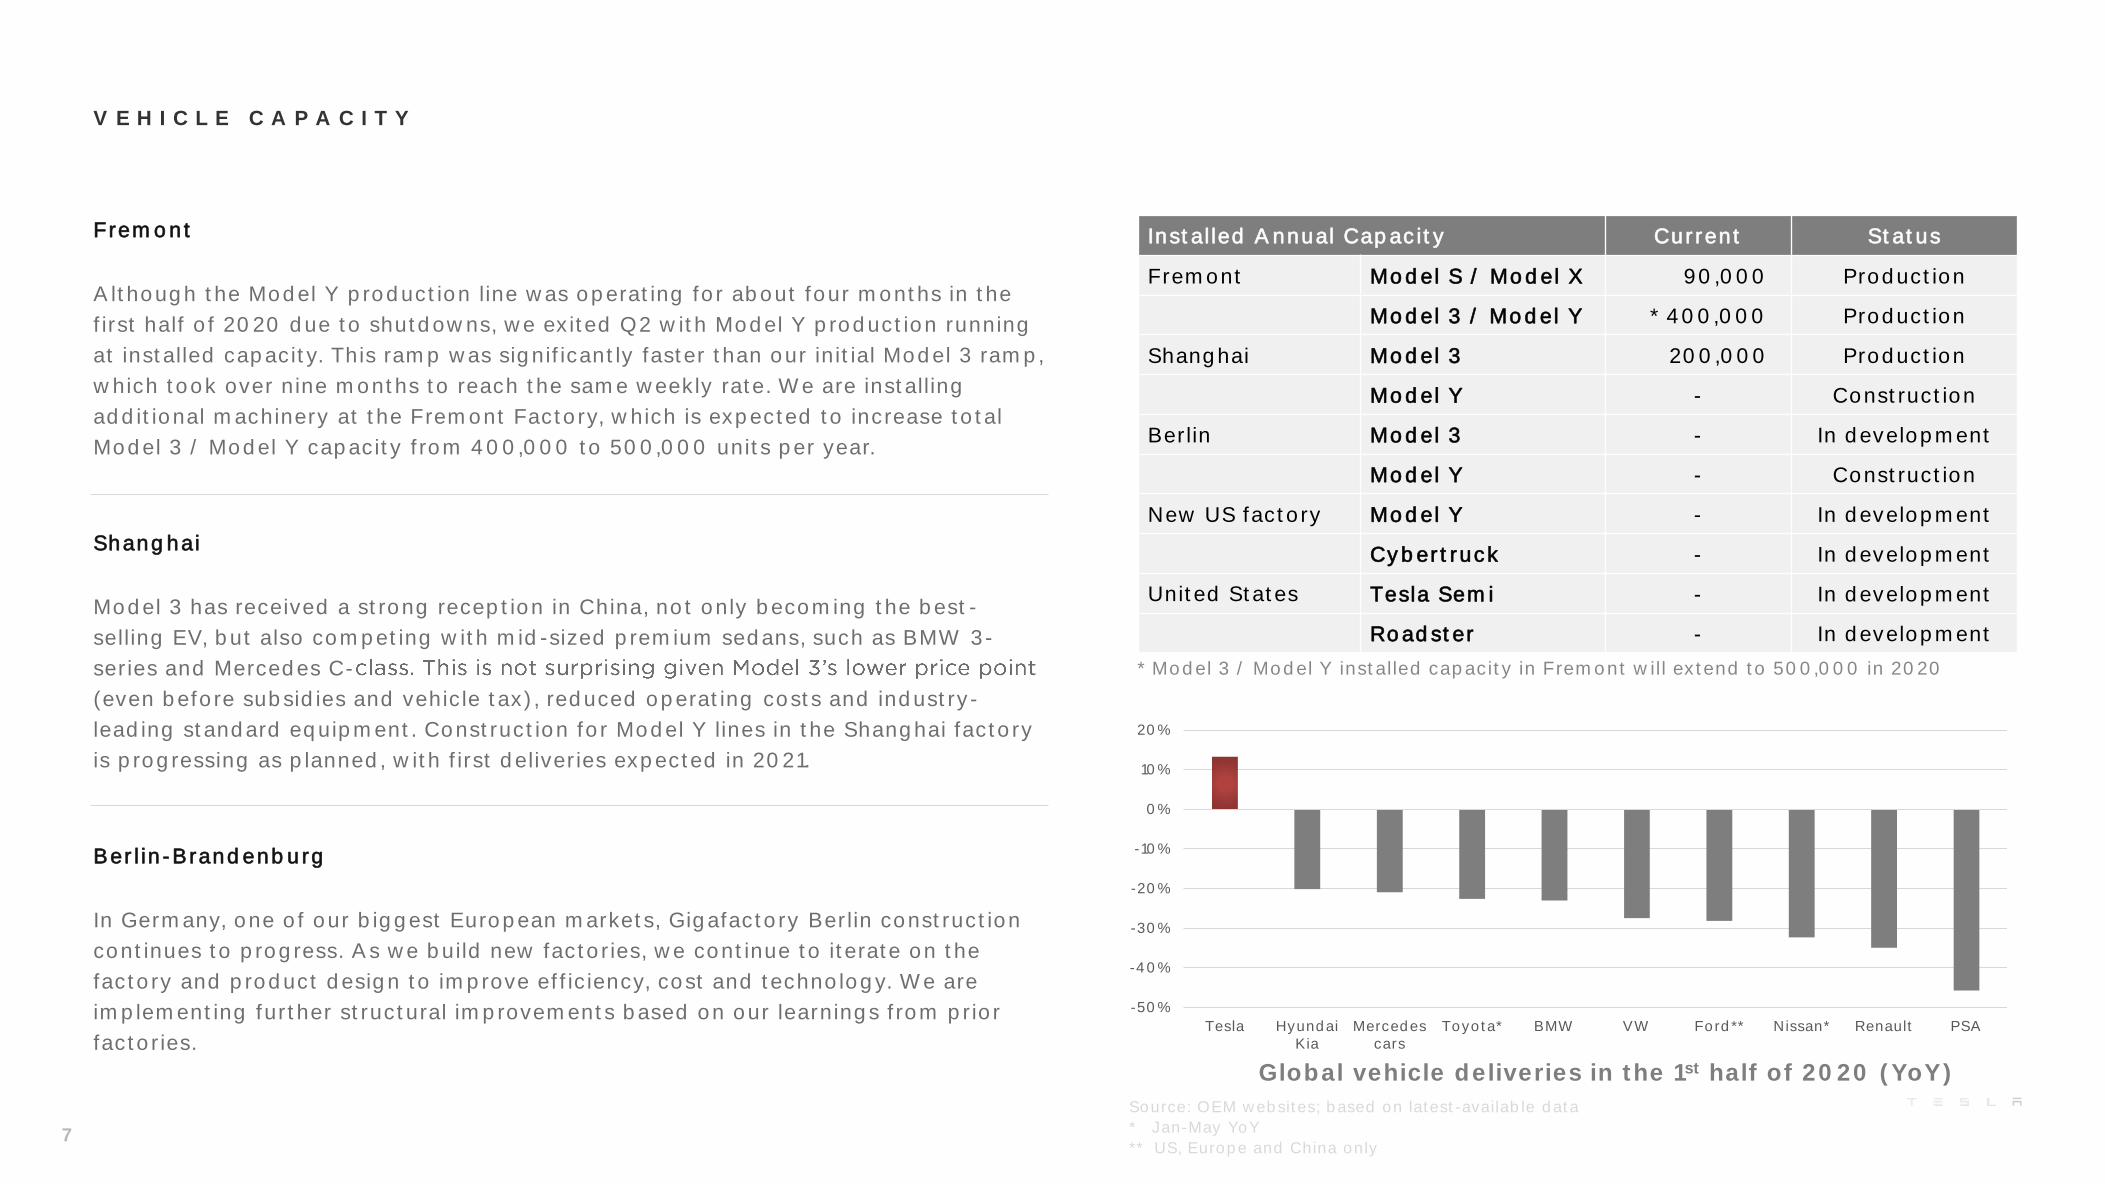
Global vehicle deliveries in the 1st half of 2020 (YoY)
V E H I C L E C A P A C I T Y
Fremont
Although the Model Y production line was operating for about four months in the
first half of 2020 due to shutdowns, we exited Q2 with Model Y production running
at installed capacity. This ramp was significantly faster than our initial Model 3 ramp,
which took over nine months to reach the same weekly rate. We are installing
additional machinery at the Fremont Factory, which is expected to increase total
Model 3 / Model Y capacity from 400,000 to 500,000 units per year.
Shanghai
Model 3 has received a strong reception in China, not only becoming the best-
selling EV, but also competing with mid-sized premium sedans, such as BMW 3-
series and Mercedes C-
(even before subsidies and vehicle tax), reduced operating costs and industry-
leading standard equipment. Construction for Model Y lines in the Shanghai factory
is progressing as planned, with first deliveries expected in 2021.
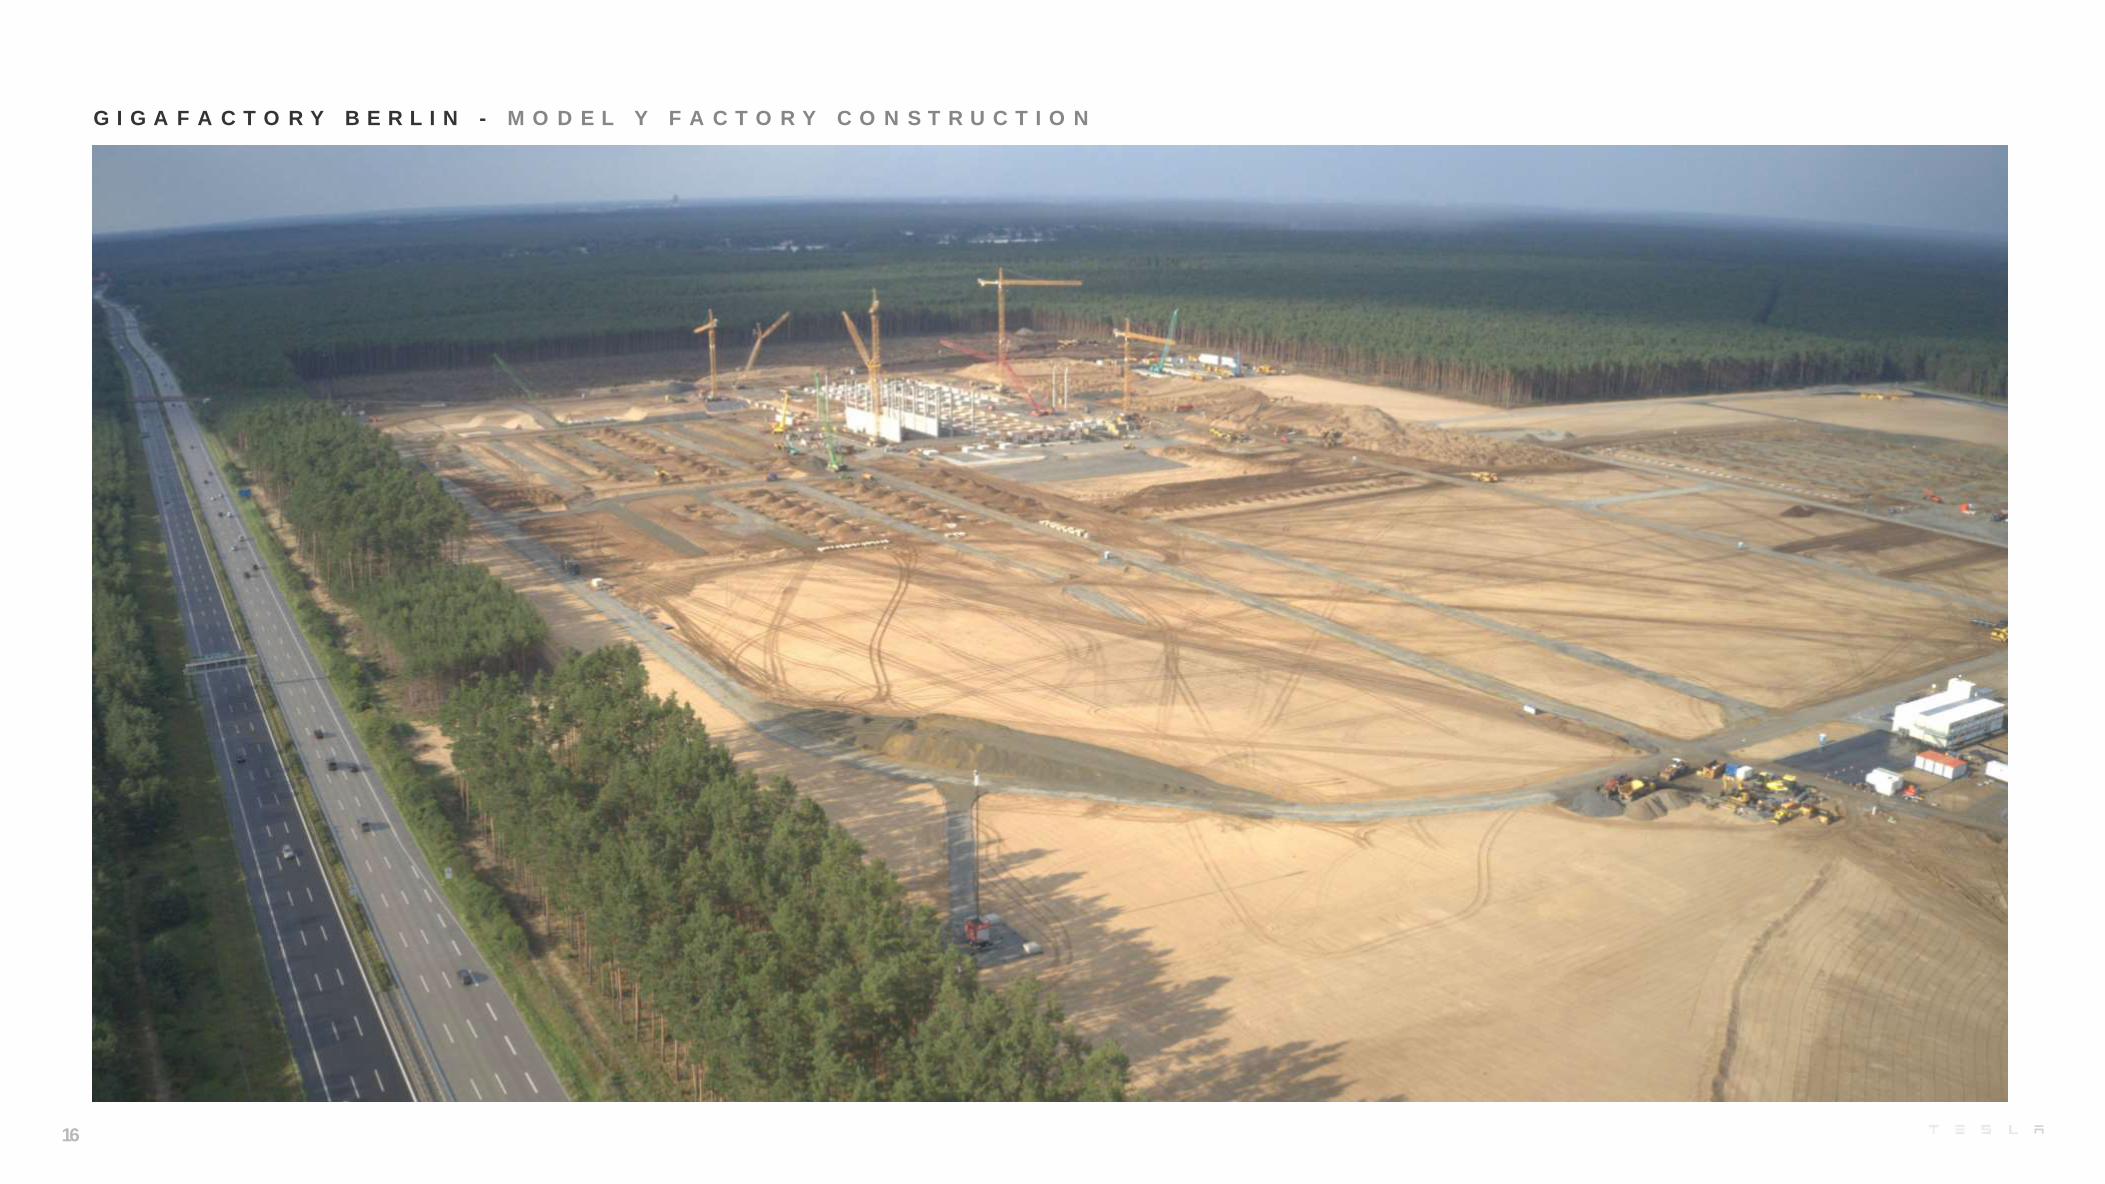
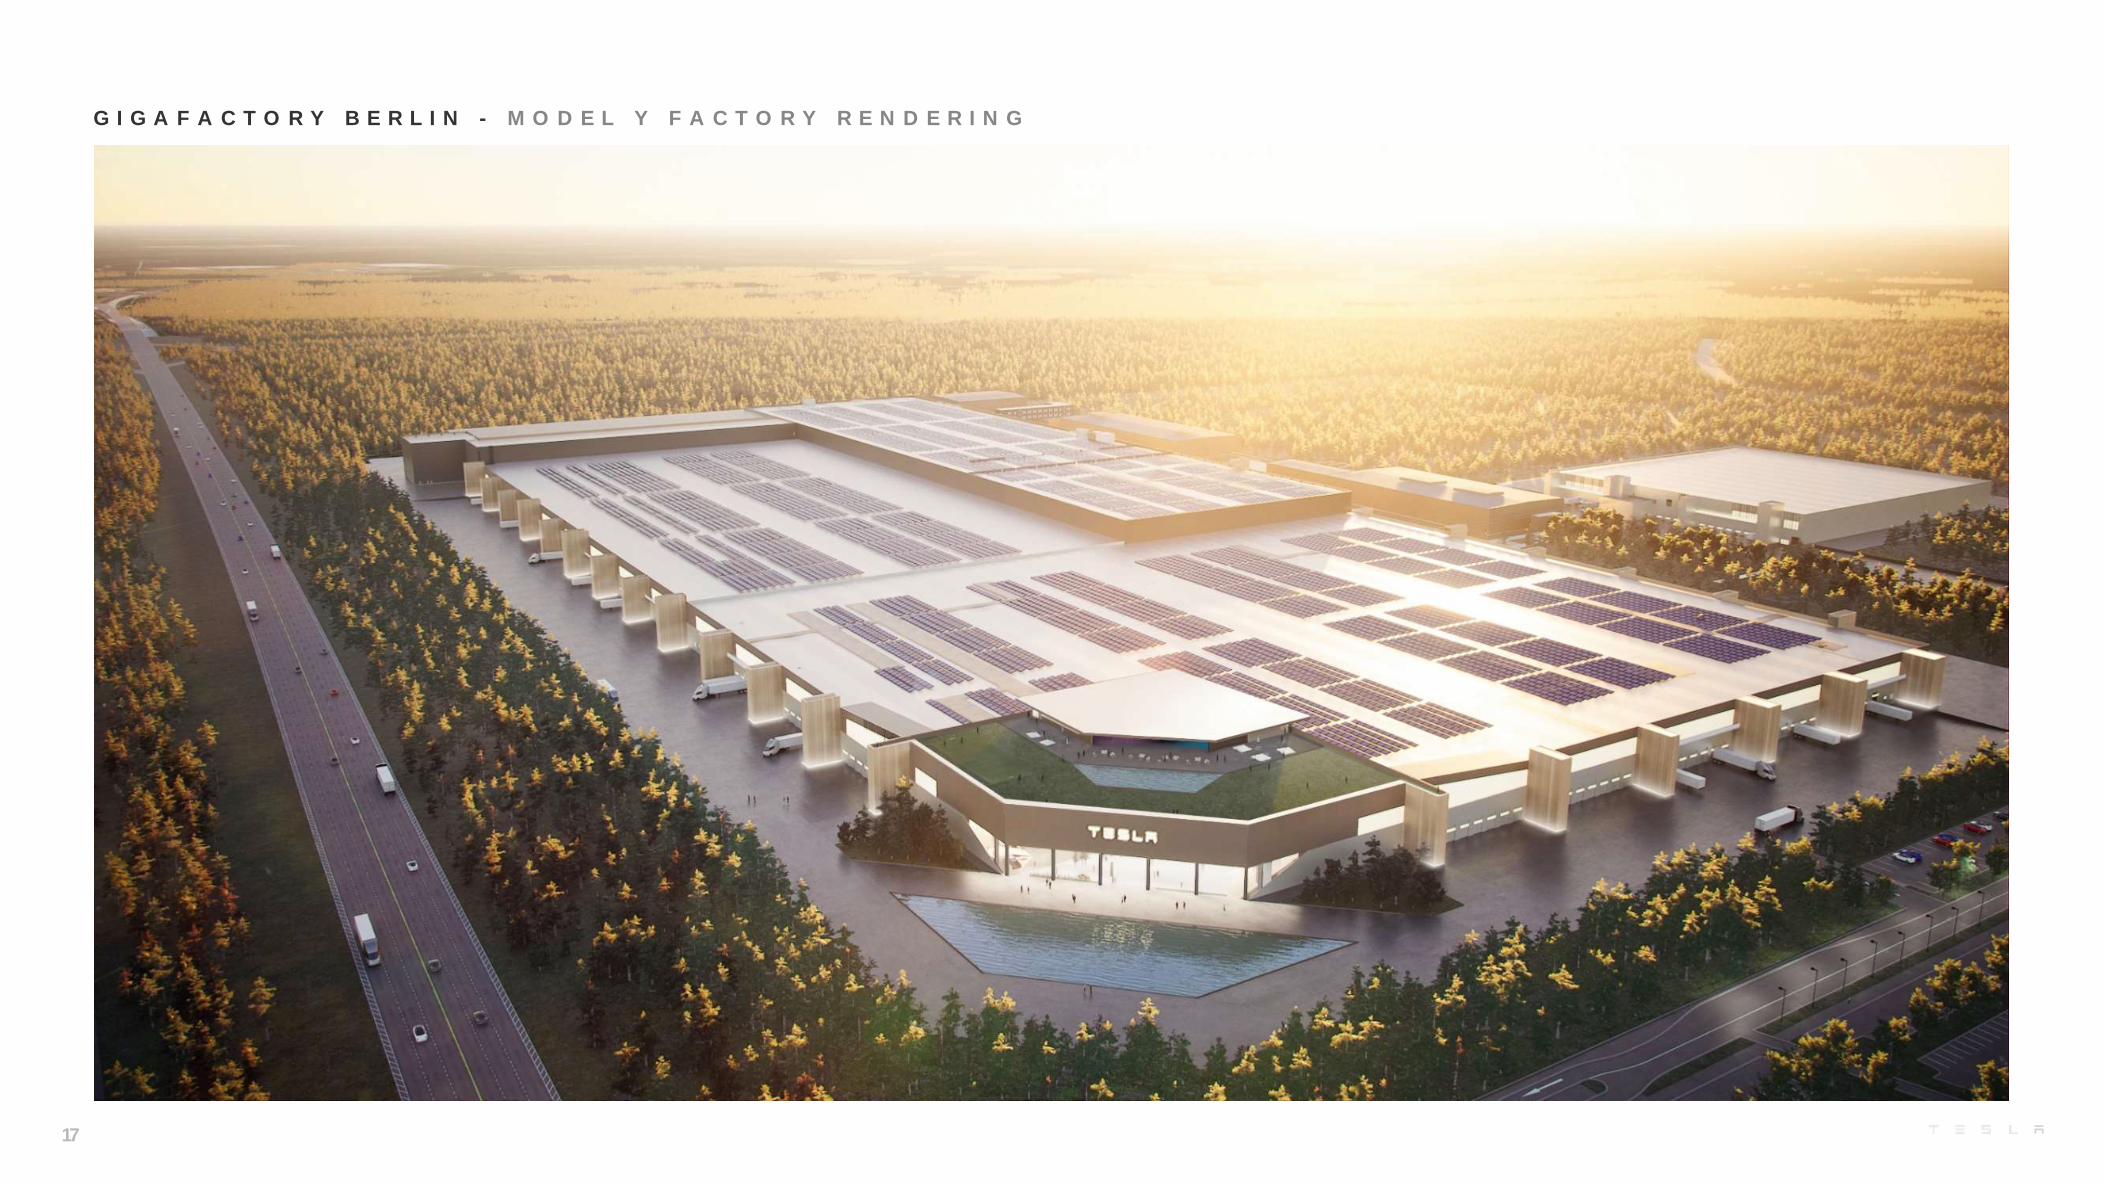
Berlin-Brandenburg
In Germany, one of our biggest European markets, Gigafactory Berlin construction
continues to progress. As we build new factories, we continue to iterate on the
factory and product design to improve efficiency, cost and technology. We are
implementing further structural improvements based on our learnings from prior
factories.
Installed Annual Capacity Current Status
Fremont Model S / Model X 90,000 Production
Model 3 / Model Y * 400,000 Production
Shanghai Model 3 200,000 Production
Model Y - Construction
Berlin Model 3 - In development
Model Y - Construction
New US factory Model Y - In development
Cybertruck - In development
United States Tesla Semi - In development
Roadster - In development
* Model 3 / Model Y installed capacity in Fremont will extend to 500,000 in 2020
7
-50%
-40%
-30%
-20%
-10%
0%
10%
20%
Tesla HyundaiKia
Mercedescars
Toyota* BMW VW Ford** Nissan* Renault PSA
Source: OEM websites; based on latest-available data
* Jan-May YoY
** US, Europe and China only
C O R E T E C H N O L O G Y
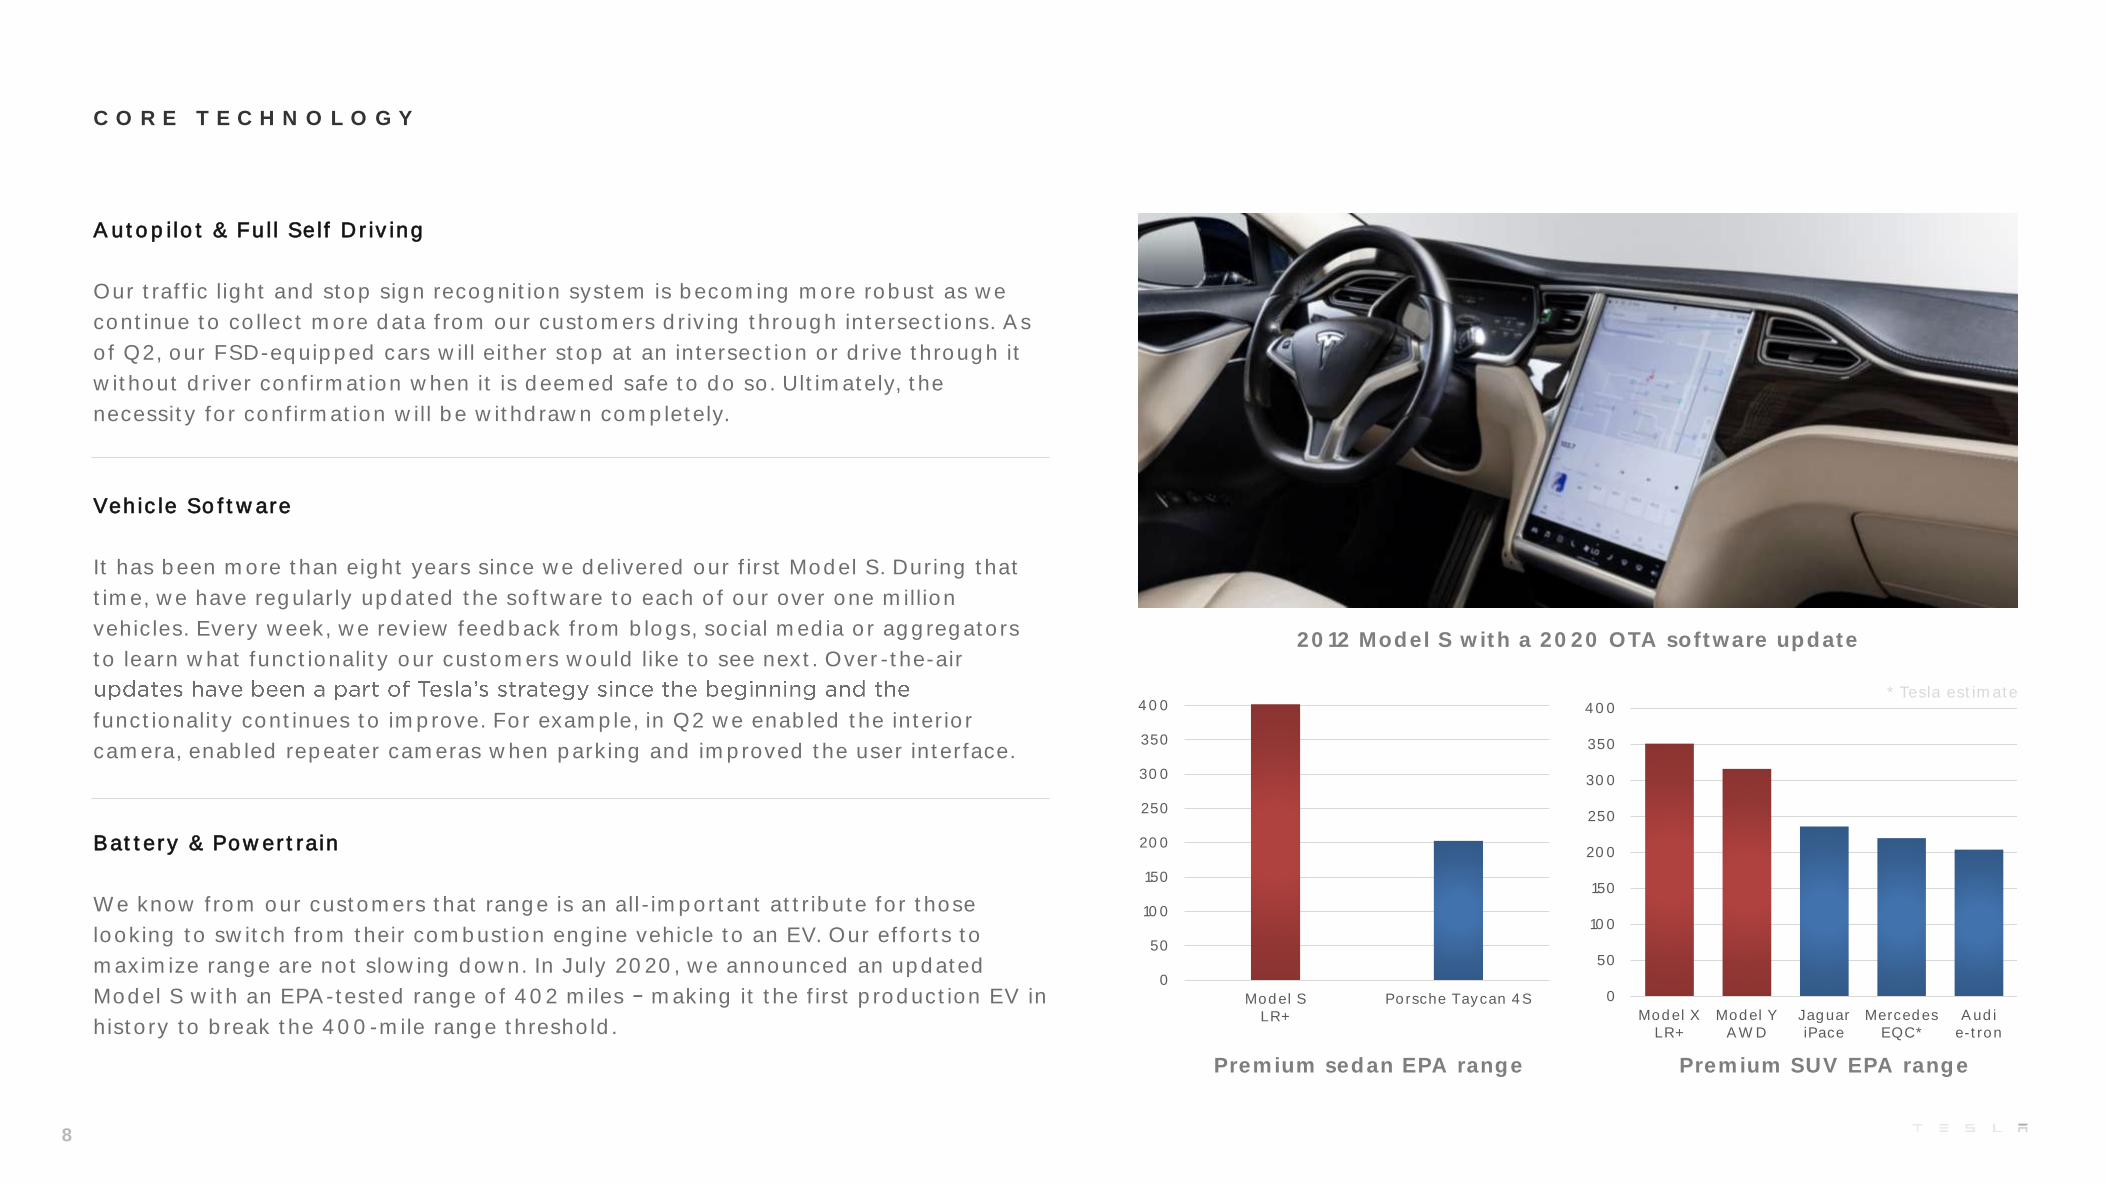
Autopilot & Full Self Driving
Our traffic light and stop sign recognition system is becoming more robust as we
continue to collect more data from our customers driving through intersections. As
of Q2, our FSD-equipped cars will either stop at an intersection or drive through it
without driver confirmation when it is deemed safe to do so. Ultimately, the
necessity for confirmation will be withdrawn completely.
Vehicle Software
It has been more than eight years since we delivered our first Model S. During that
time, we have regularly updated the software to each of our over one million
vehicles. Every week, we review feedback from blogs, social media or aggregators
to learn what functionality our customers would like to see next. Over-the-air
functionality continues to improve. For example, in Q2 we enabled the interior
camera, enabled repeater cameras when parking and improved the user interface.
Battery & Powertrain
We know from our customers that range is an all-important attribute for those
looking to switch from their combustion engine vehicle to an EV. Our efforts to
maximize range are not slowing down. In July 2020, we announced an updated
Model S with an EPA-tested range of 402 miles making it the first production EV in
history to break the 400-mile range threshold.
2012 Model S with a 2020 OTA software update
8
Premium sedan EPA range
* Tesla estimate
Premium SUV EPA range
0
50
100
150
200
250
300
350
400
Model SLR+
Porsche Taycan 4S 0
50
100
150
200
250
300
350
400
Model XLR+
Model YAWD
JaguariPace
MercedesEQC*
Audie-tron
O T H E R H I G H L I G H T S
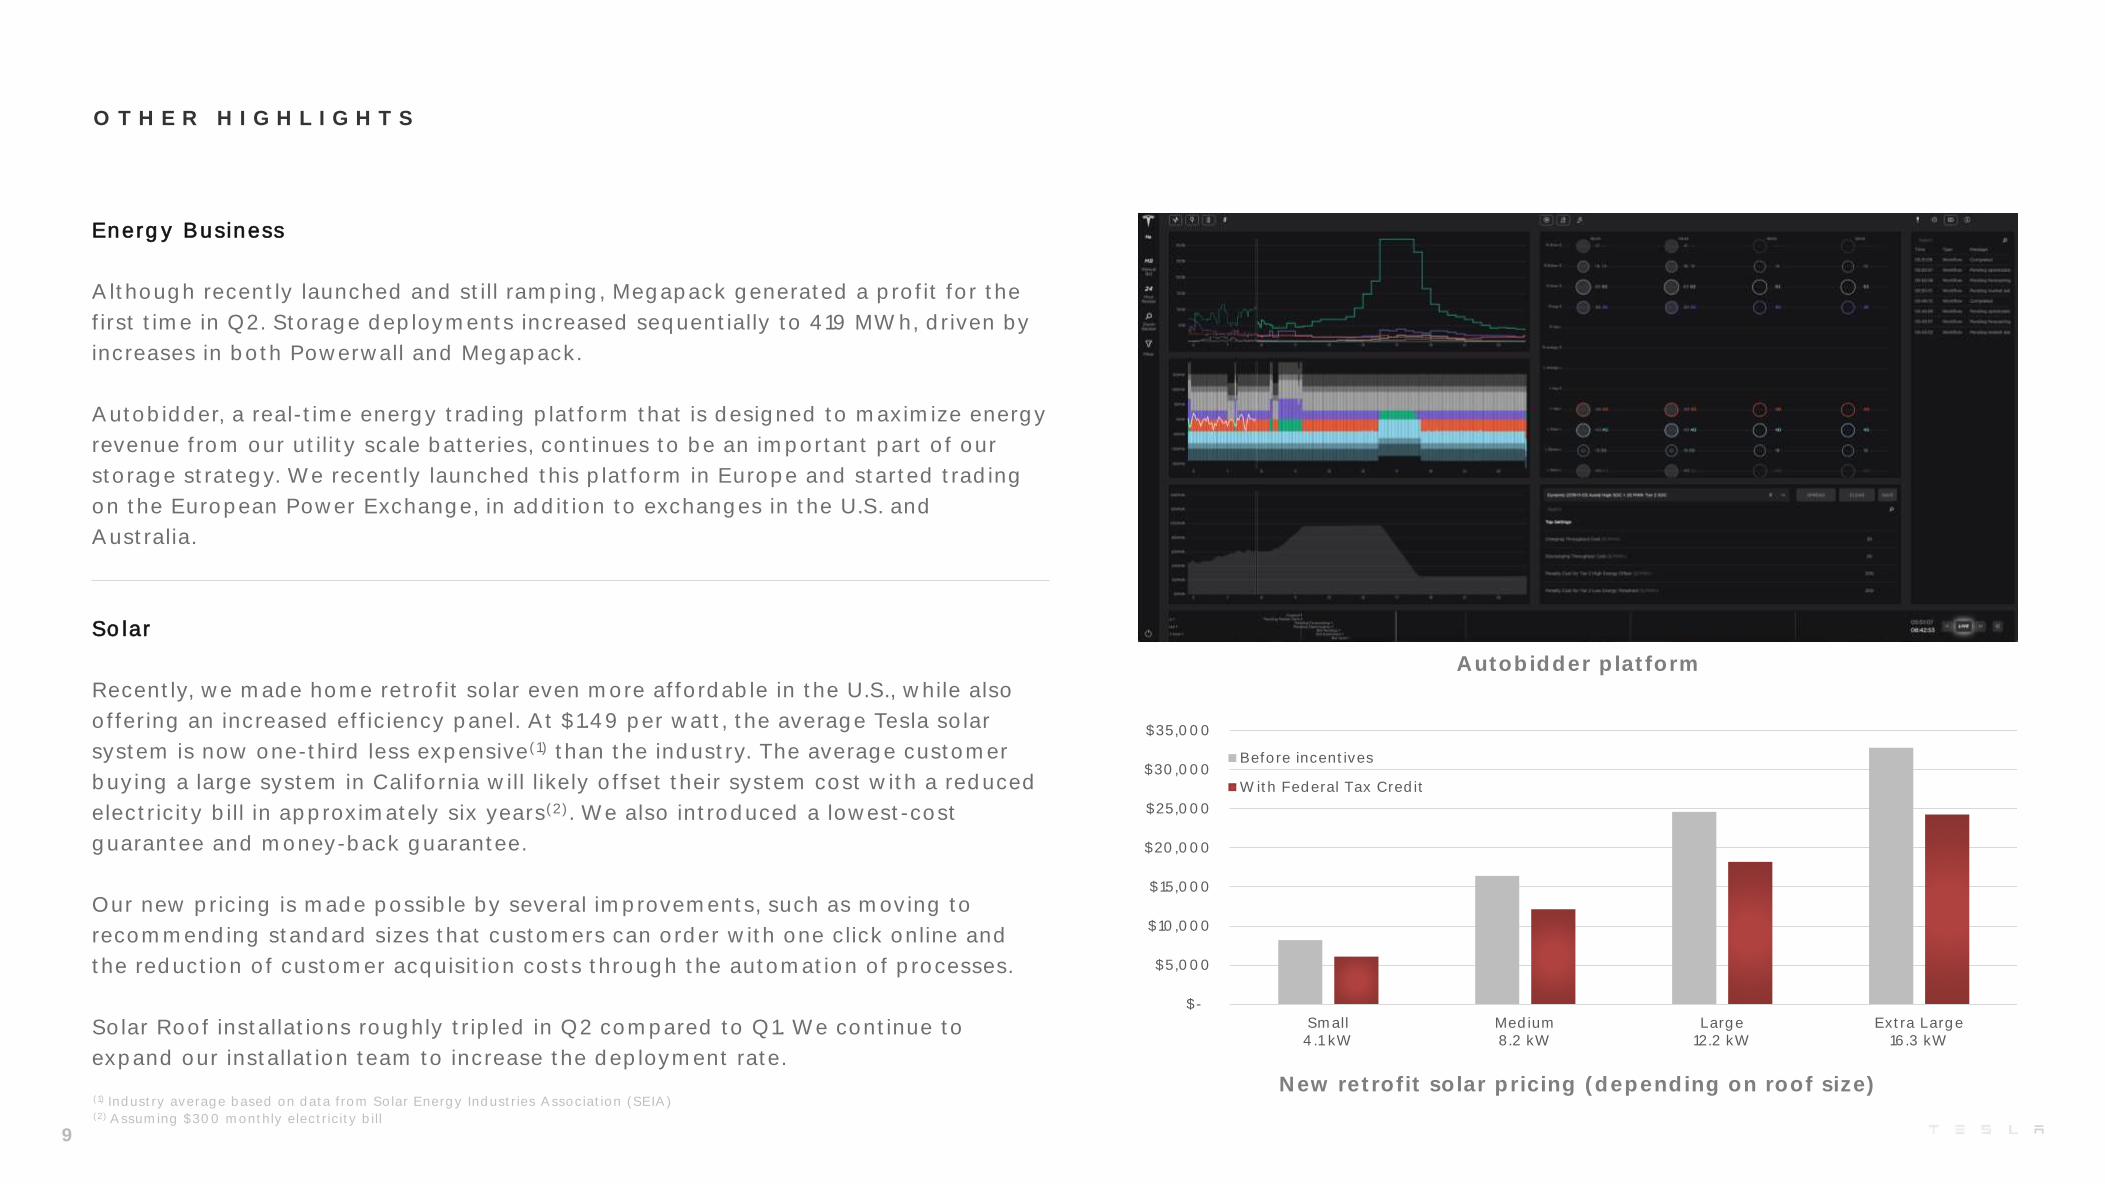
Energy Business
Although recently launched and still ramping, Megapack generated a profit for the
first time in Q2. Storage deployments increased sequentially to 419 MWh, driven by
increases in both Powerwall and Megapack.
Autobidder, a real-time energy trading platform that is designed to maximize energy
revenue from our utility scale batteries, continues to be an important part of our
storage strategy. We recently launched this platform in Europe and started trading
on the European Power Exchange, in addition to exchanges in the U.S. and
Australia.
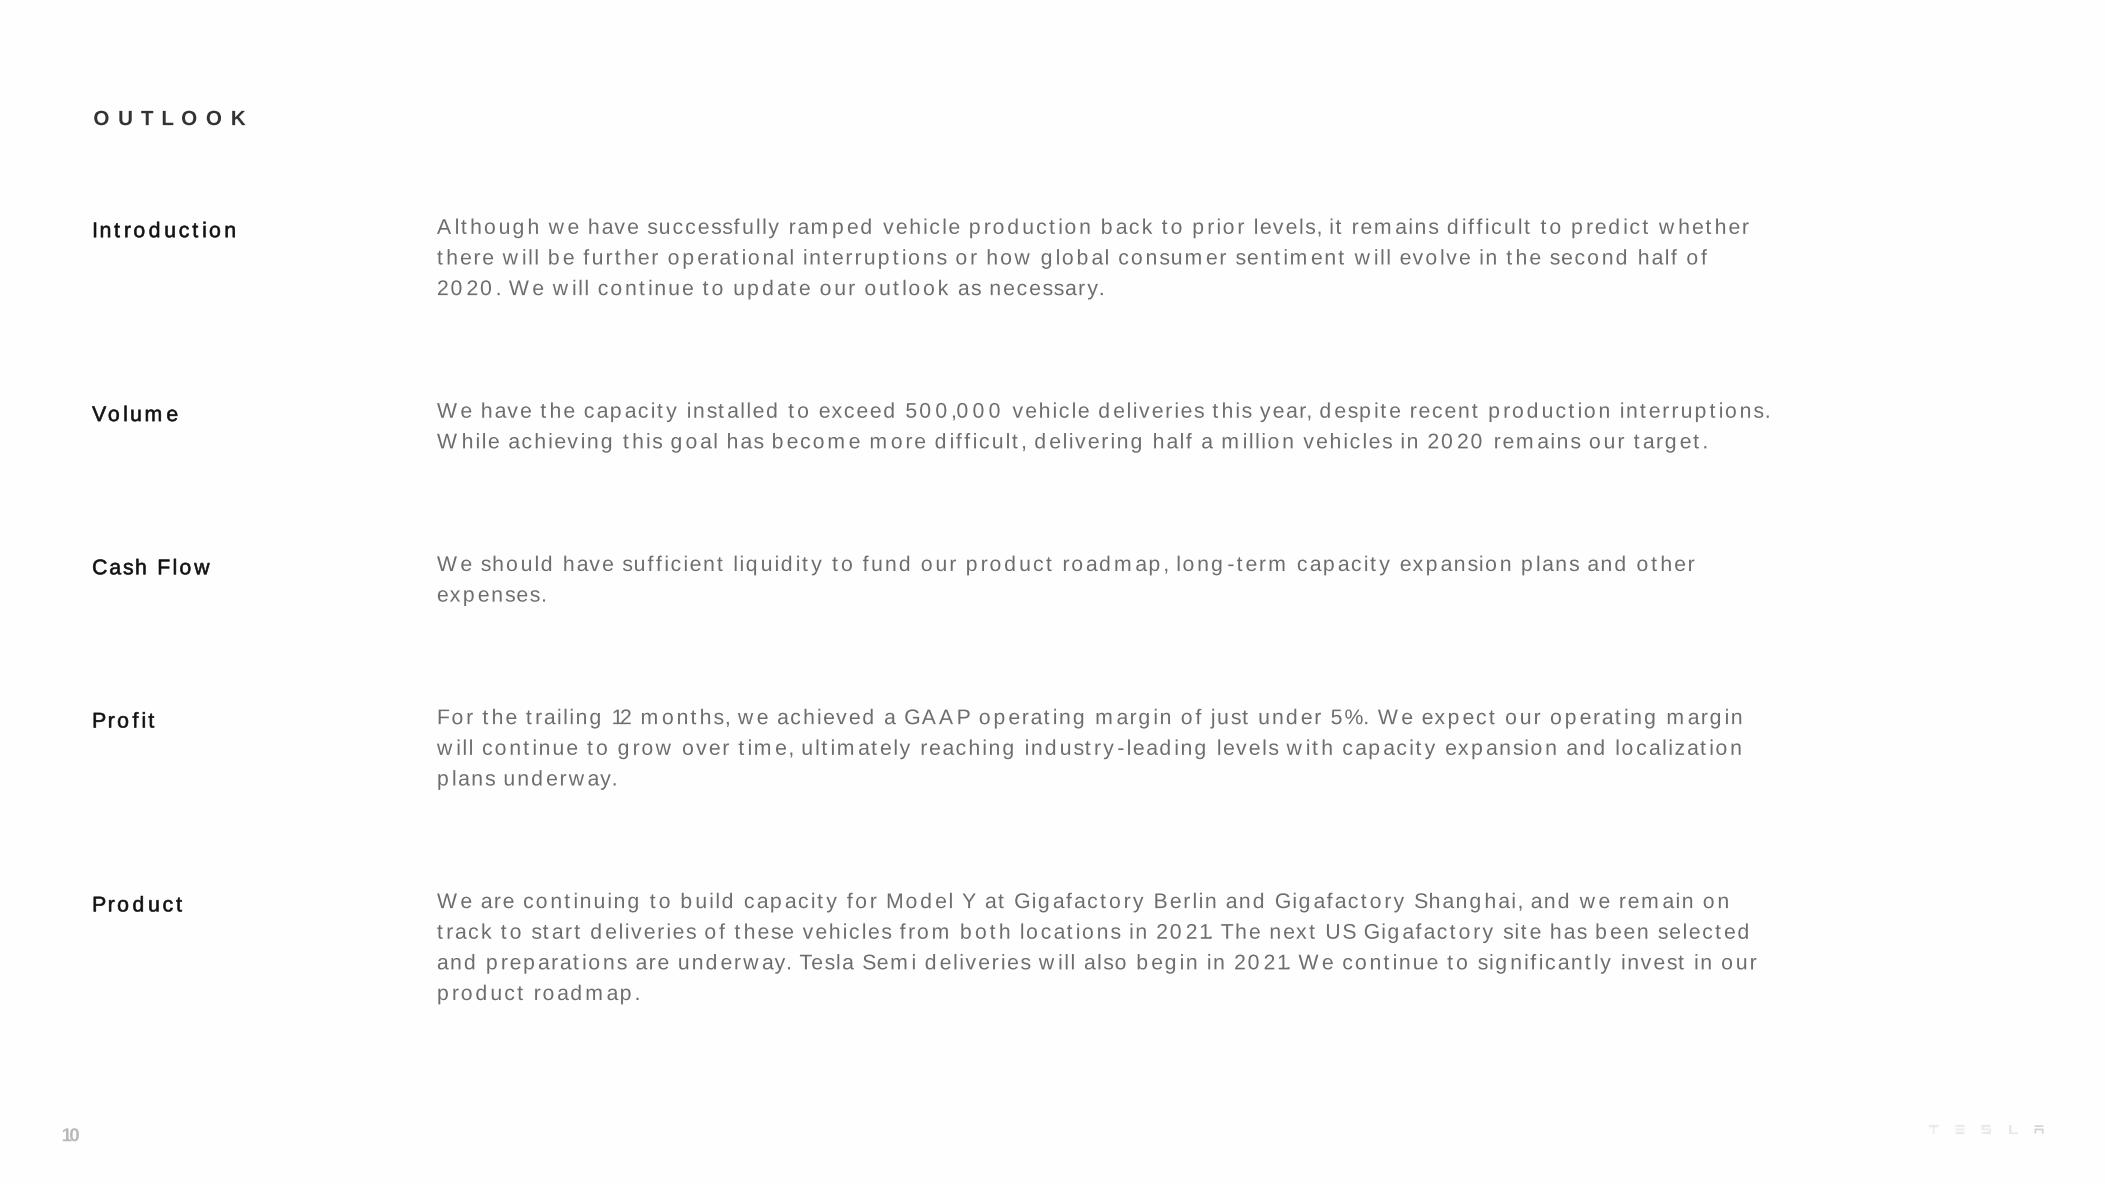
Solar
Recently, we made home retrofit solar even more affordable in the U.S., while also
offering an increased efficiency panel. At $1.49 per watt, the average Tesla solar
system is now one-third less expensive(1) than the industry. The average customer
buying a large system in California will likely offset their system cost with a reduced
electricity bill in approximately six years(2). We also introduced a lowest-cost
guarantee and money-back guarantee.
Our new pricing is made possible by several improvements, such as moving to
recommending standard sizes that customers can order with one click online and
the reduction of customer acquisition costs through the automation of processes.
Solar Roof installations roughly tripled in Q2 compared to Q1. We continue to
expand our installation team to increase the deployment rate.
9
Autobidder platform
$-
$5,000
$10,000
$15,000
$20,000
$25,000
$30,000
$35,000
Small4.1 kW
Medium8.2 kW
Large12.2 kW
Extra Large16.3 kW
Before incentives
With Federal Tax Credit
New retrofit solar pricing (depending on roof size)(1) Industry average based on data from Solar Energy Industries Association (SEIA)(2) Assuming $300 monthly electricity bill
O U T L O O K
Introduction
Volume
Cash Flow
Profit
Product
Although we have successfully ramped vehicle production back to prior levels, it remains difficult to predict whether
there will be further operational interruptions or how global consumer sentiment will evolve in the second half of
2020. We will continue to update our outlook as necessary.
We have the capacity installed to exceed 500,000 vehicle deliveries this year, despite recent production interruptions.
While achieving this goal has become more difficult, delivering half a million vehicles in 2020 remains our target.
We should have sufficient liquidity to fund our product roadmap, long-term capacity expansion plans and other
expenses.
For the trailing 12 months, we achieved a GAAP operating margin of just under 5%. We expect our operating margin
will continue to grow over time, ultimately reaching industry-leading levels with capacity expansion and localization
plans underway.
We are continuing to build capacity for Model Y at Gigafactory Berlin and Gigafactory Shanghai, and we remain on
track to start deliveries of these vehicles from both locations in 2021. The next US Gigafactory site has been selected
and preparations are underway. Tesla Semi deliveries will also begin in 2021. We continue to significantly invest in our
product roadmap.
10

P H O T O S & C H A R T S
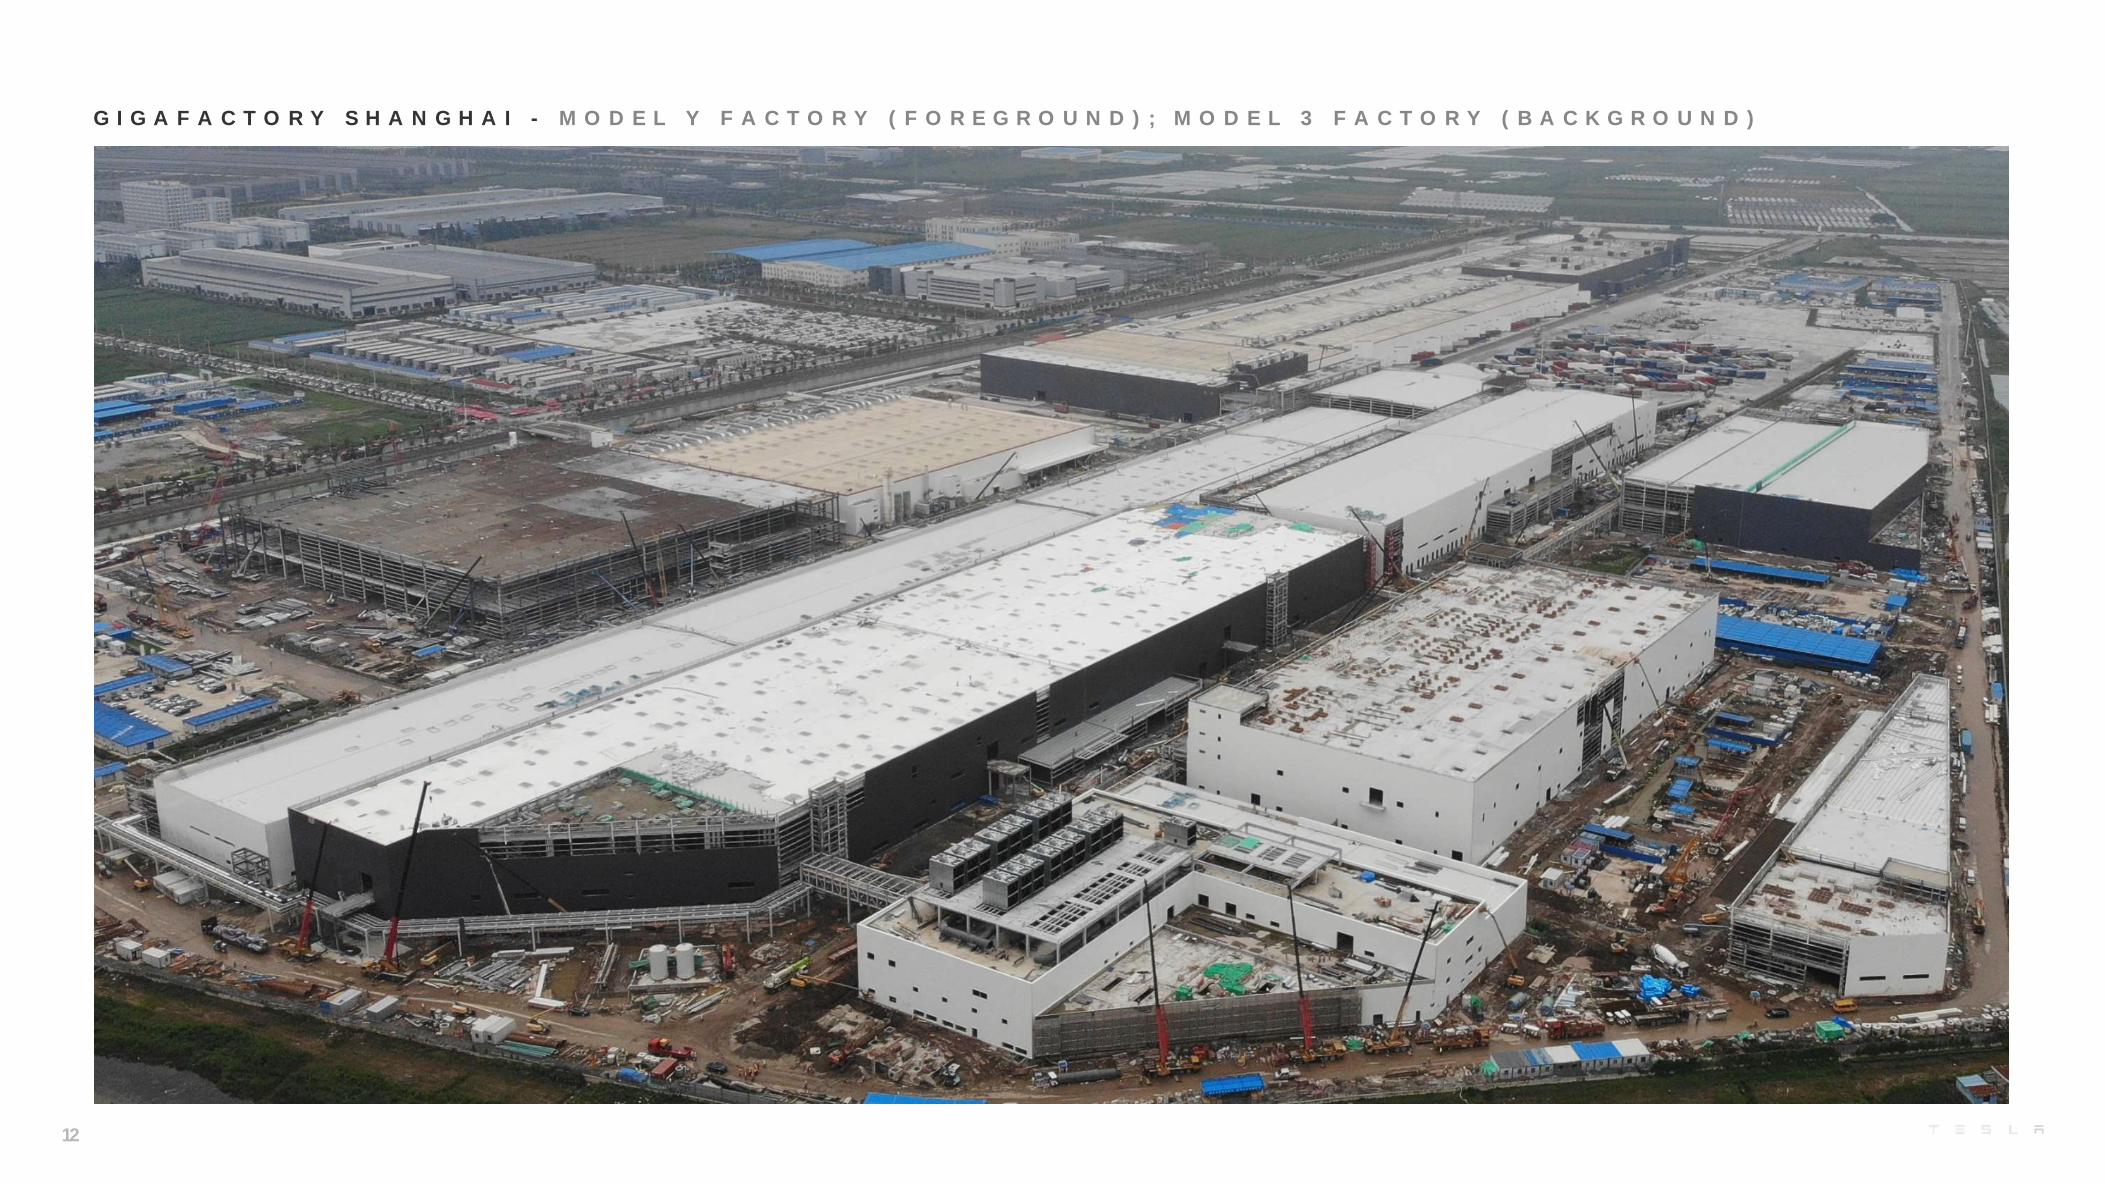
G I G A F A C T O R Y S H A N G H A I - M O D E L Y F A C T O R Y ( F O R E G R O U N D ) ; M O D E L 3 F A C T O R Y ( B A C K G R O U N D )
12
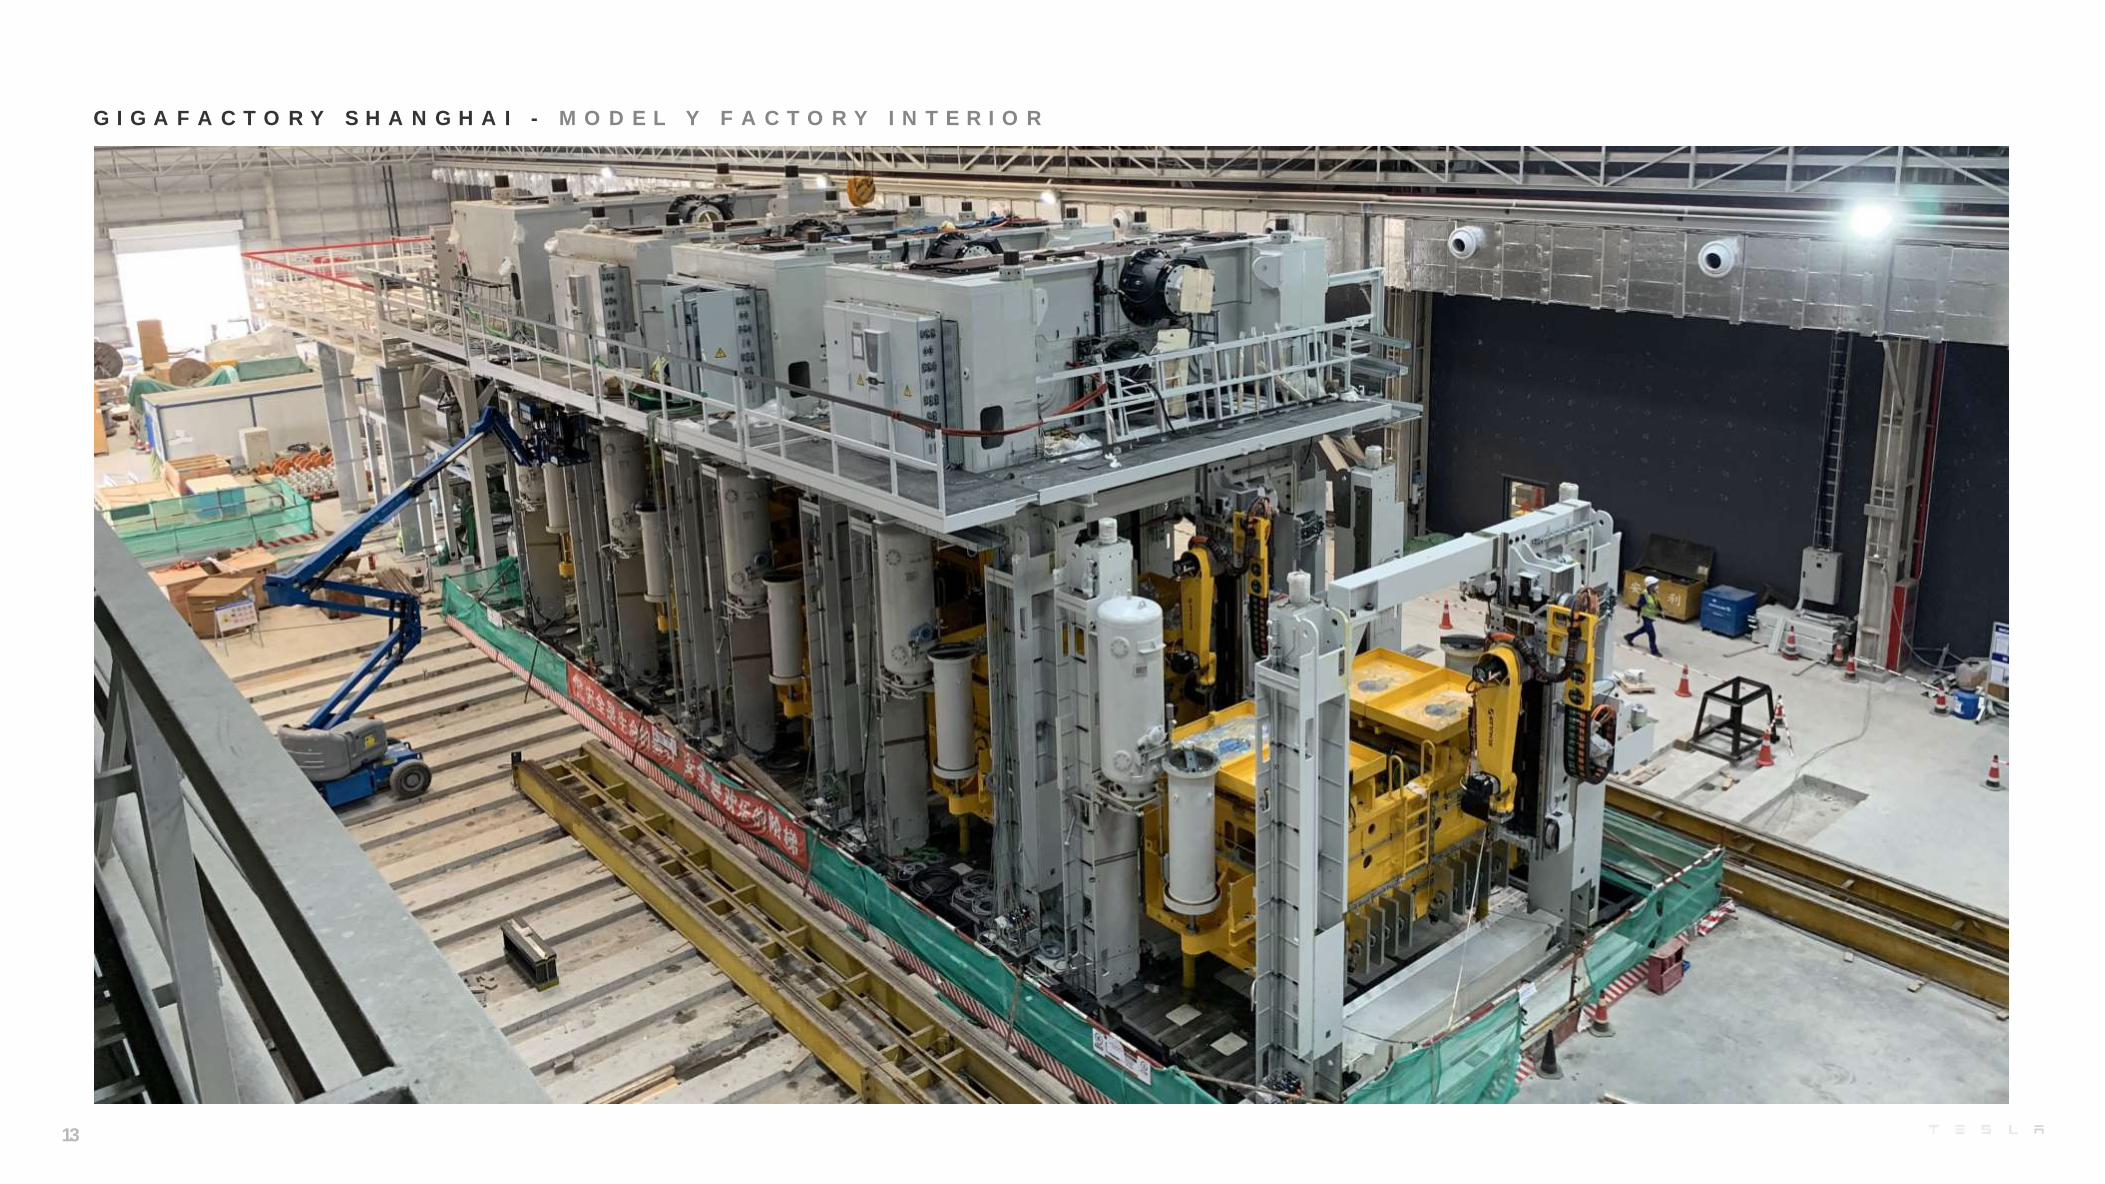
G I G A F A C T O R Y S H A N G H A I - M O D E L Y F A C T O R Y I N T E R I O R
13
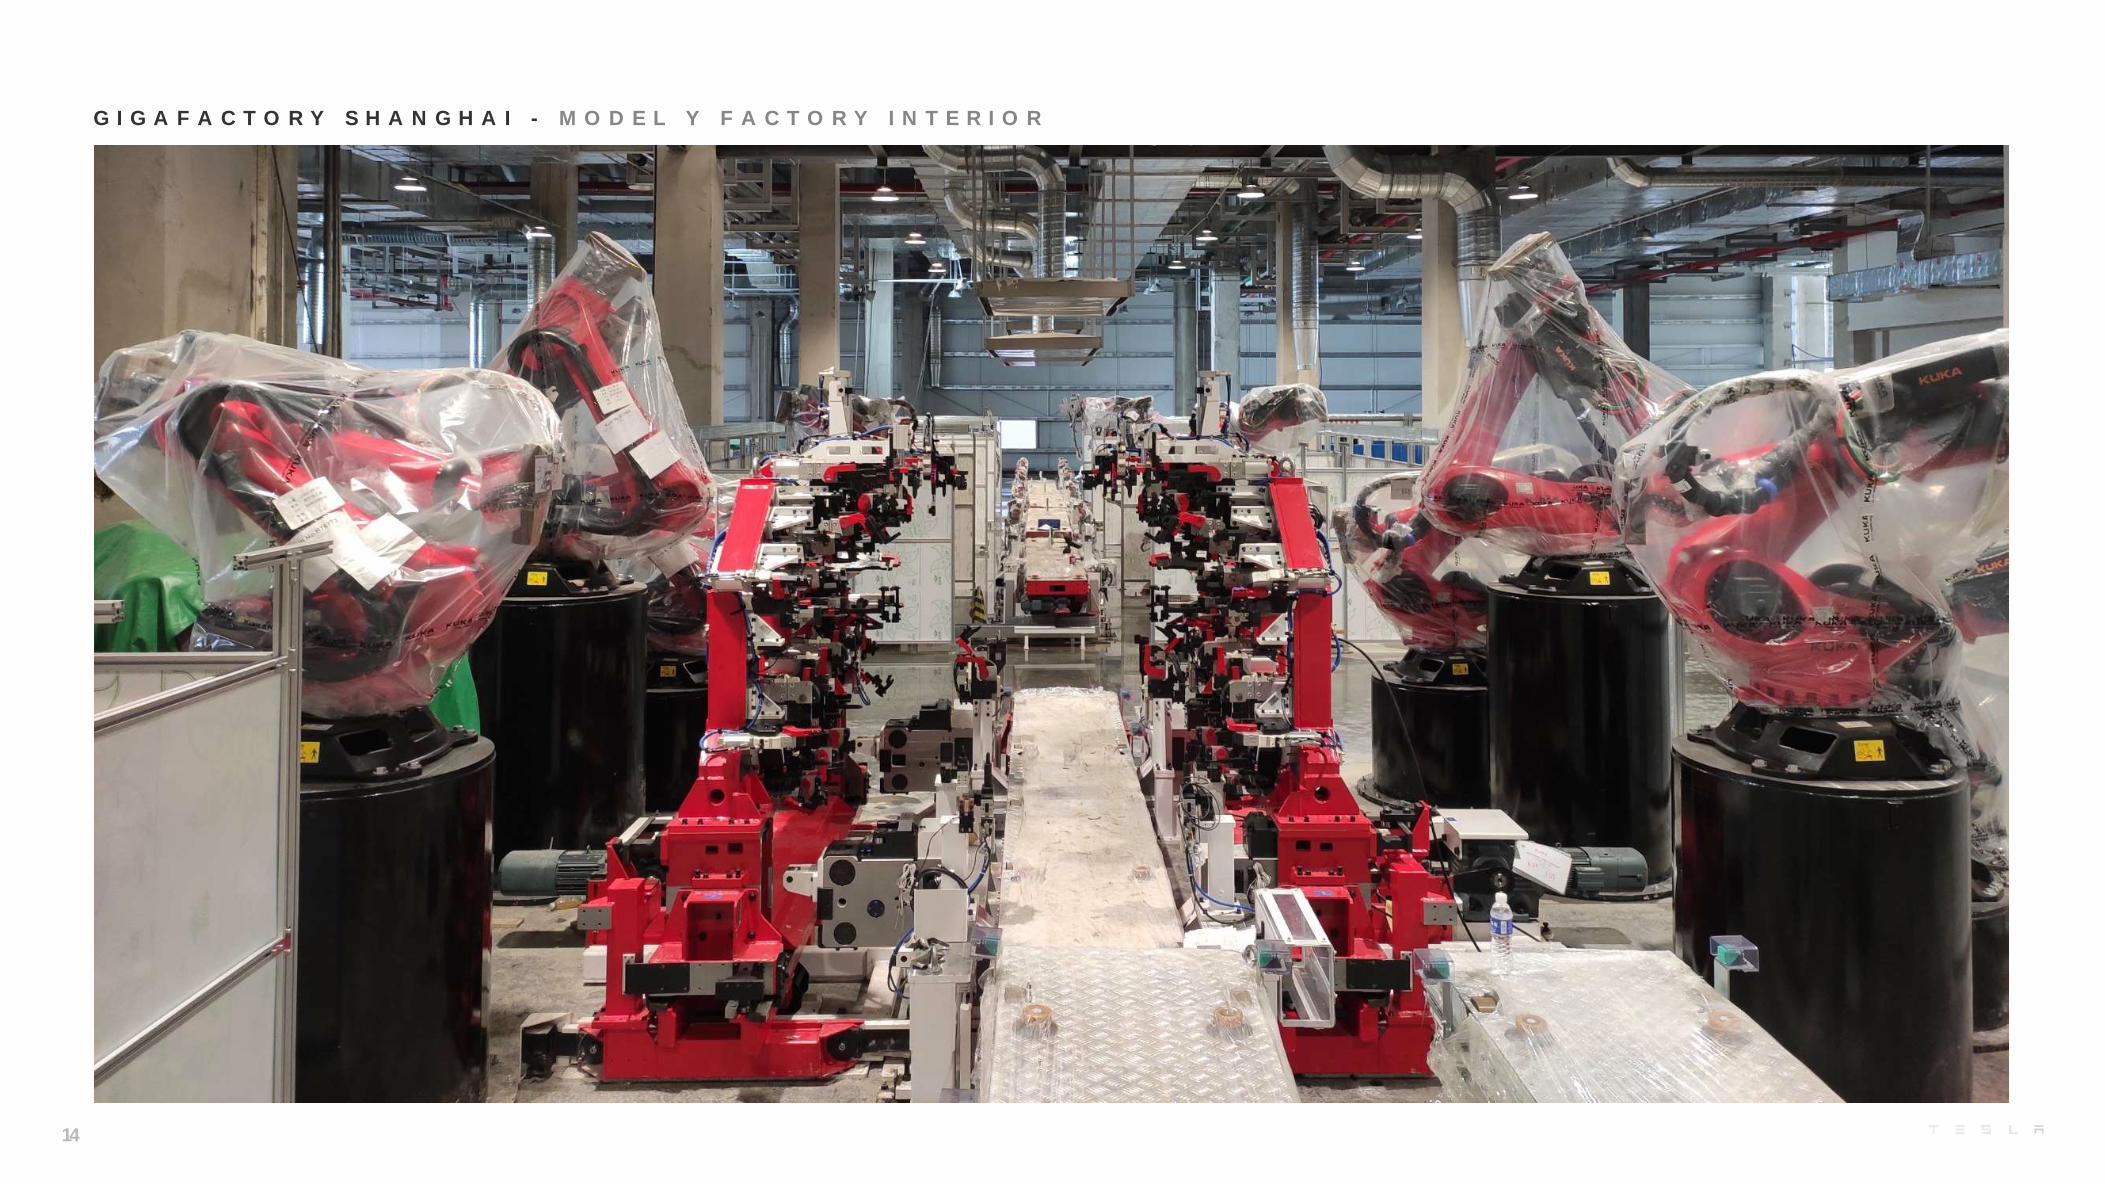
G I G A F A C T O R Y S H A N G H A I - M O D E L Y F A C T O R Y I N T E R I O R
14
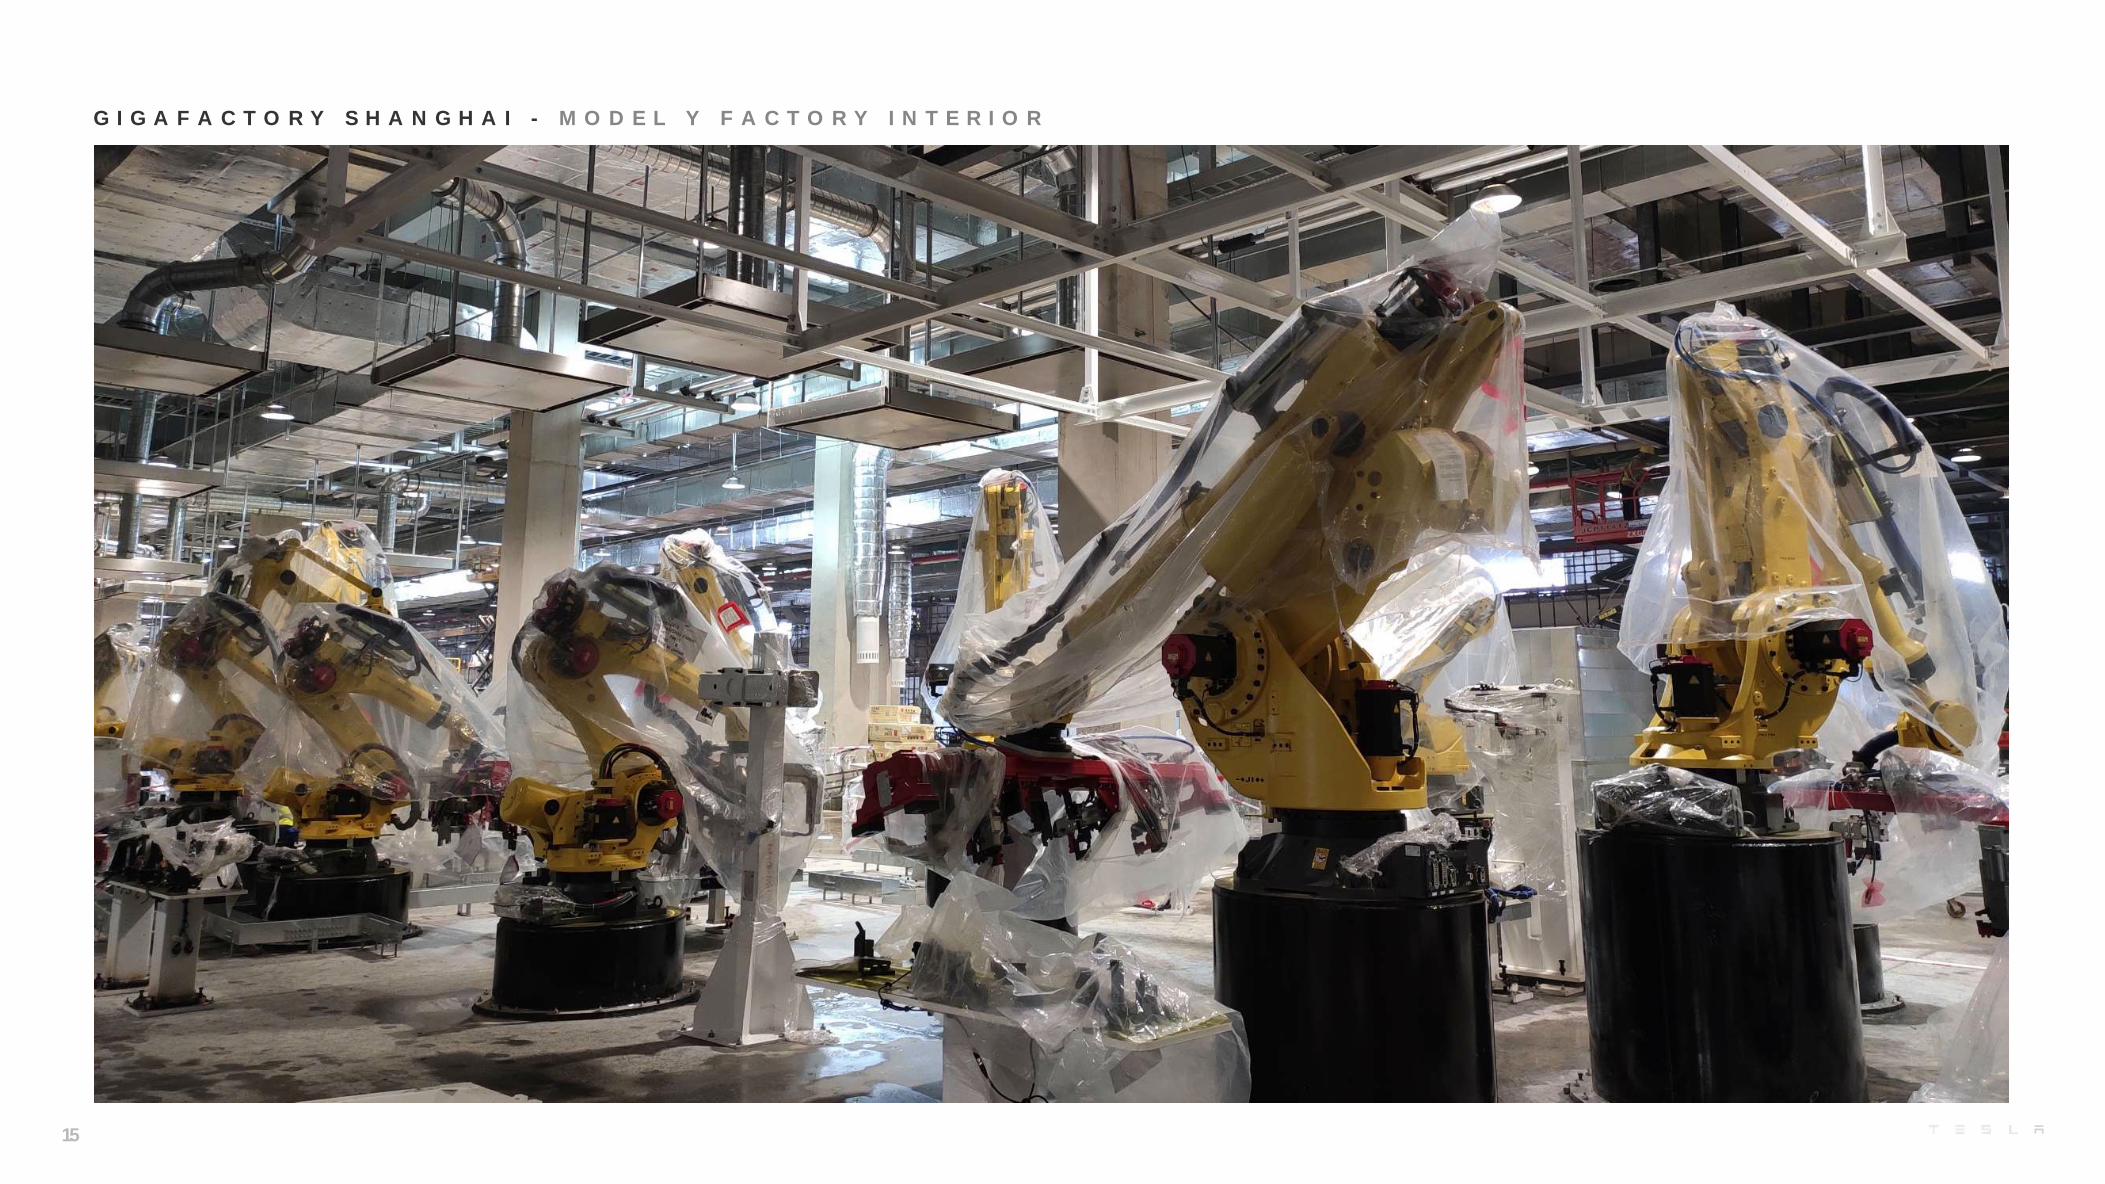
G I G A F A C T O R Y S H A N G H A I - M O D E L Y F A C T O R Y I N T E R I O R
15
16
G I G A F A C T O R Y B E R L I N - M O D E L Y F A C T O R Y C O N S T R U C T I O N
17
G I G A F A C T O R Y B E R L I N - M O D E L Y F A C T O R Y R E N D E R I N G
-0.8
-0.6
-0.4
-0.2
0.0
0.2
0.4
0.6
0.8
3Q
-20
17
4Q
-20
17
1Q-2
018
2Q
-20
18
3Q
-20
18
4Q
-20
18
1Q-2
019
2Q
-20
19
3Q
-20
19
4Q
-20
19
1Q-2
02
0
2Q
-20
20
-1.5
-1.0
-0.5
0.0
0.5
1.0
1.5
3Q
-20
17
4Q
-20
17
1Q-2
018
2Q
-20
18
3Q
-20
18
4Q
-20
18
1Q-2
019
2Q
-20
19
3Q
-20
19
4Q
-20
19
1Q-2
02
0
2Q
-20
20
0
20,000
40,000
60,000
80,000
100,000
120,000
3Q
-20
17
4Q
-20
17
1Q-2
018
2Q
-20
18
3Q
-20
18
4Q
-20
18
1Q-2
019
2Q
-20
19
3Q
-20
19
4Q
-20
19
1Q-2
02
0
2Q
-20
20
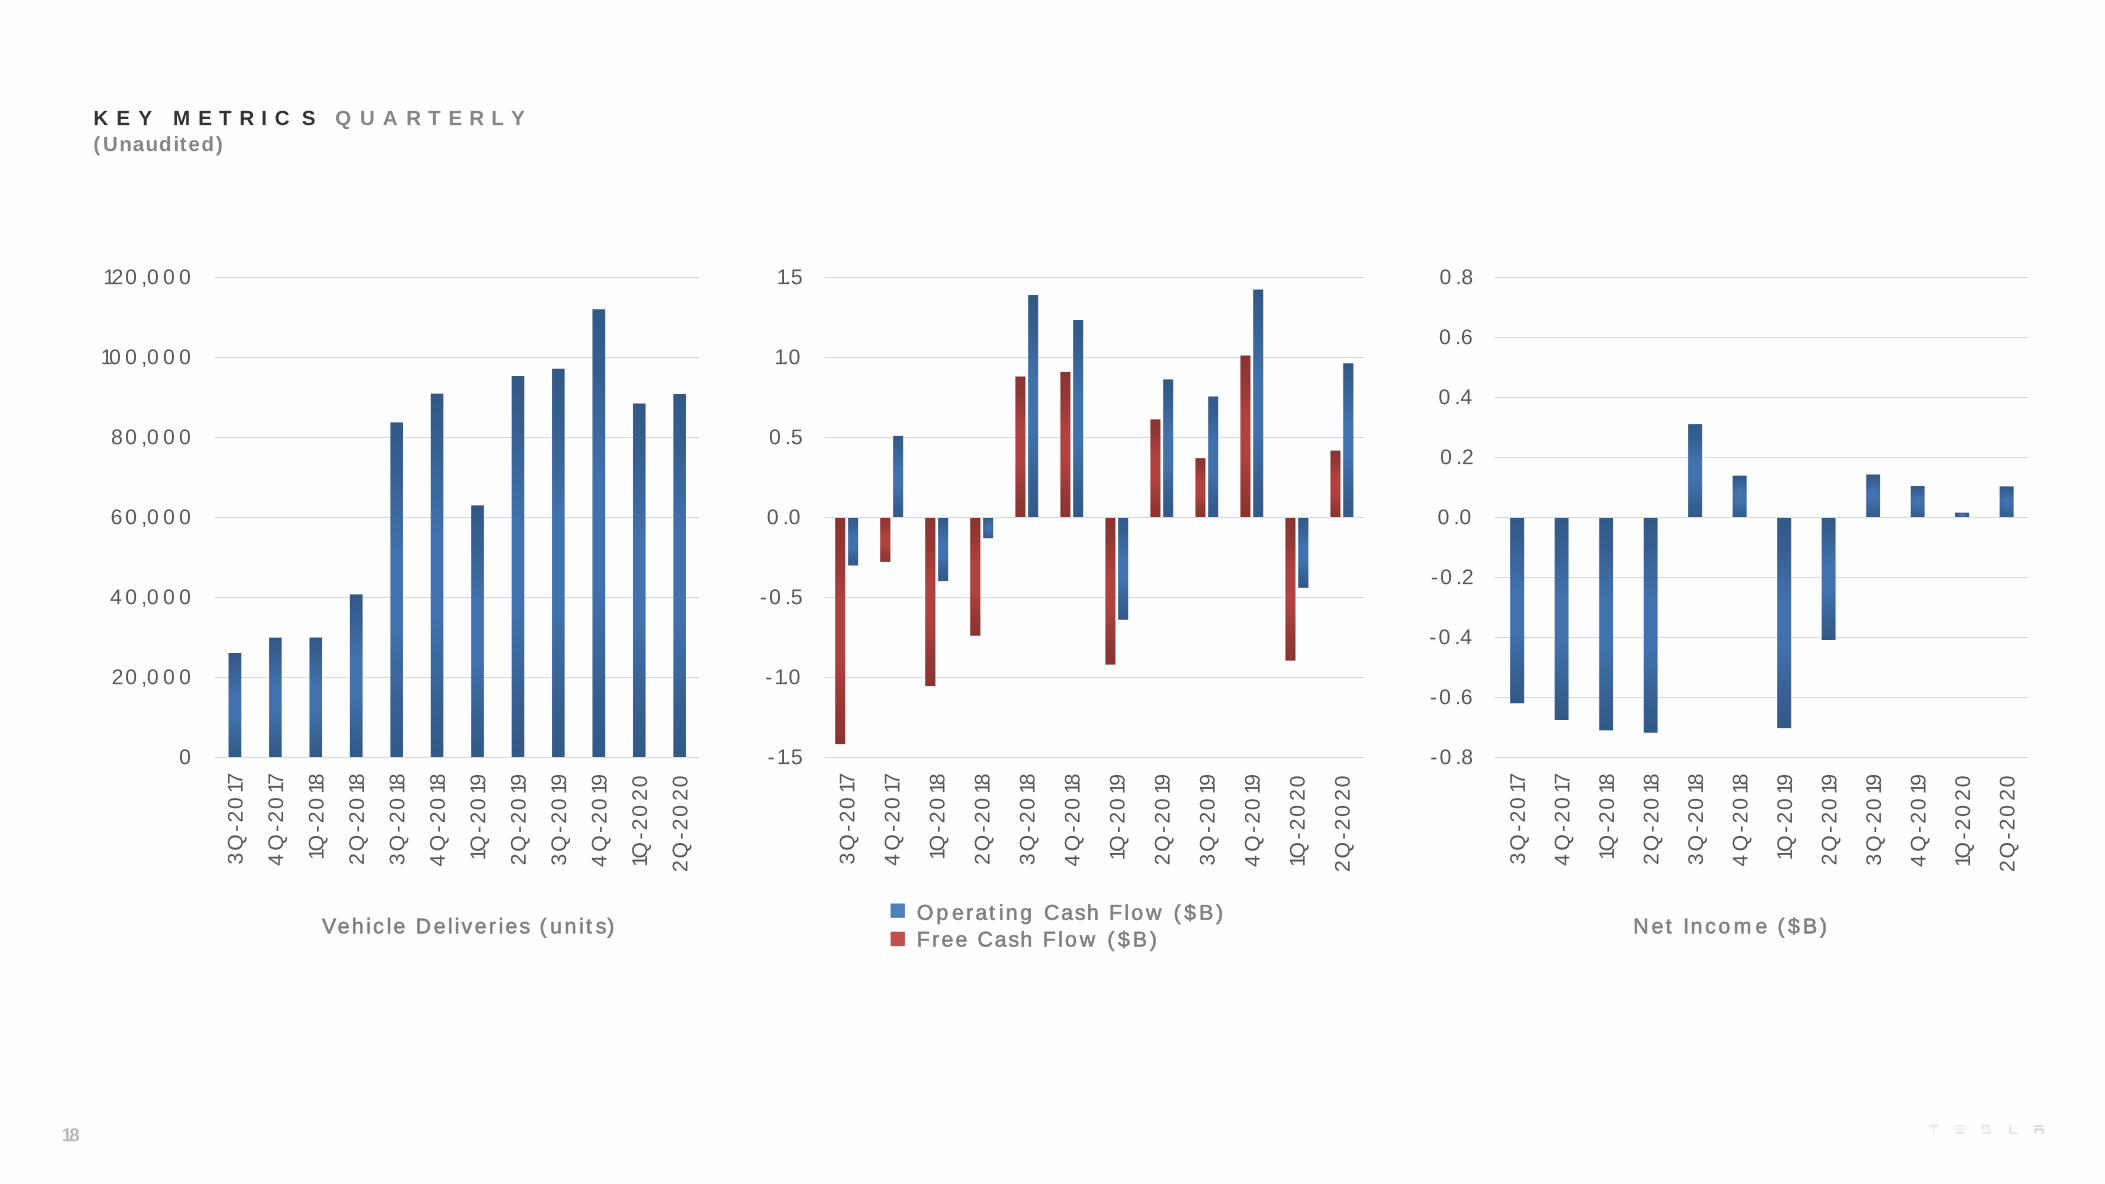
Vehicle Deliveries (units) Net Income ($B)
K E Y M E T R I C S Q U A R T E R L Y
(Unaudited)
18
Operating Cash Flow ($B)
Free Cash Flow ($B)
-5.0
-4.0
-3.0
-2.0
-1.0
0.0
1.0
2.0
3.0
4.0
5.0
3Q
-20
17
4Q
-20
17
1Q-2
018
2Q
-20
18
3Q
-20
18
4Q
-20
18
1Q-2
019
2Q
-20
19
3Q
-20
19
4Q
-20
19
1Q-2
02
0
2Q
-20
20
0
50,000
100,000
150,000
200,000
250,000
300,000
350,000
400,000
3Q
-20
17
4Q
-20
17
1Q-2
018
2Q
-20
18
3Q
-20
18
4Q
-20
18
1Q-2
019
2Q
-20
19
3Q
-20
19
4Q
-20
19
1Q-2
02
0
2Q
-20
20
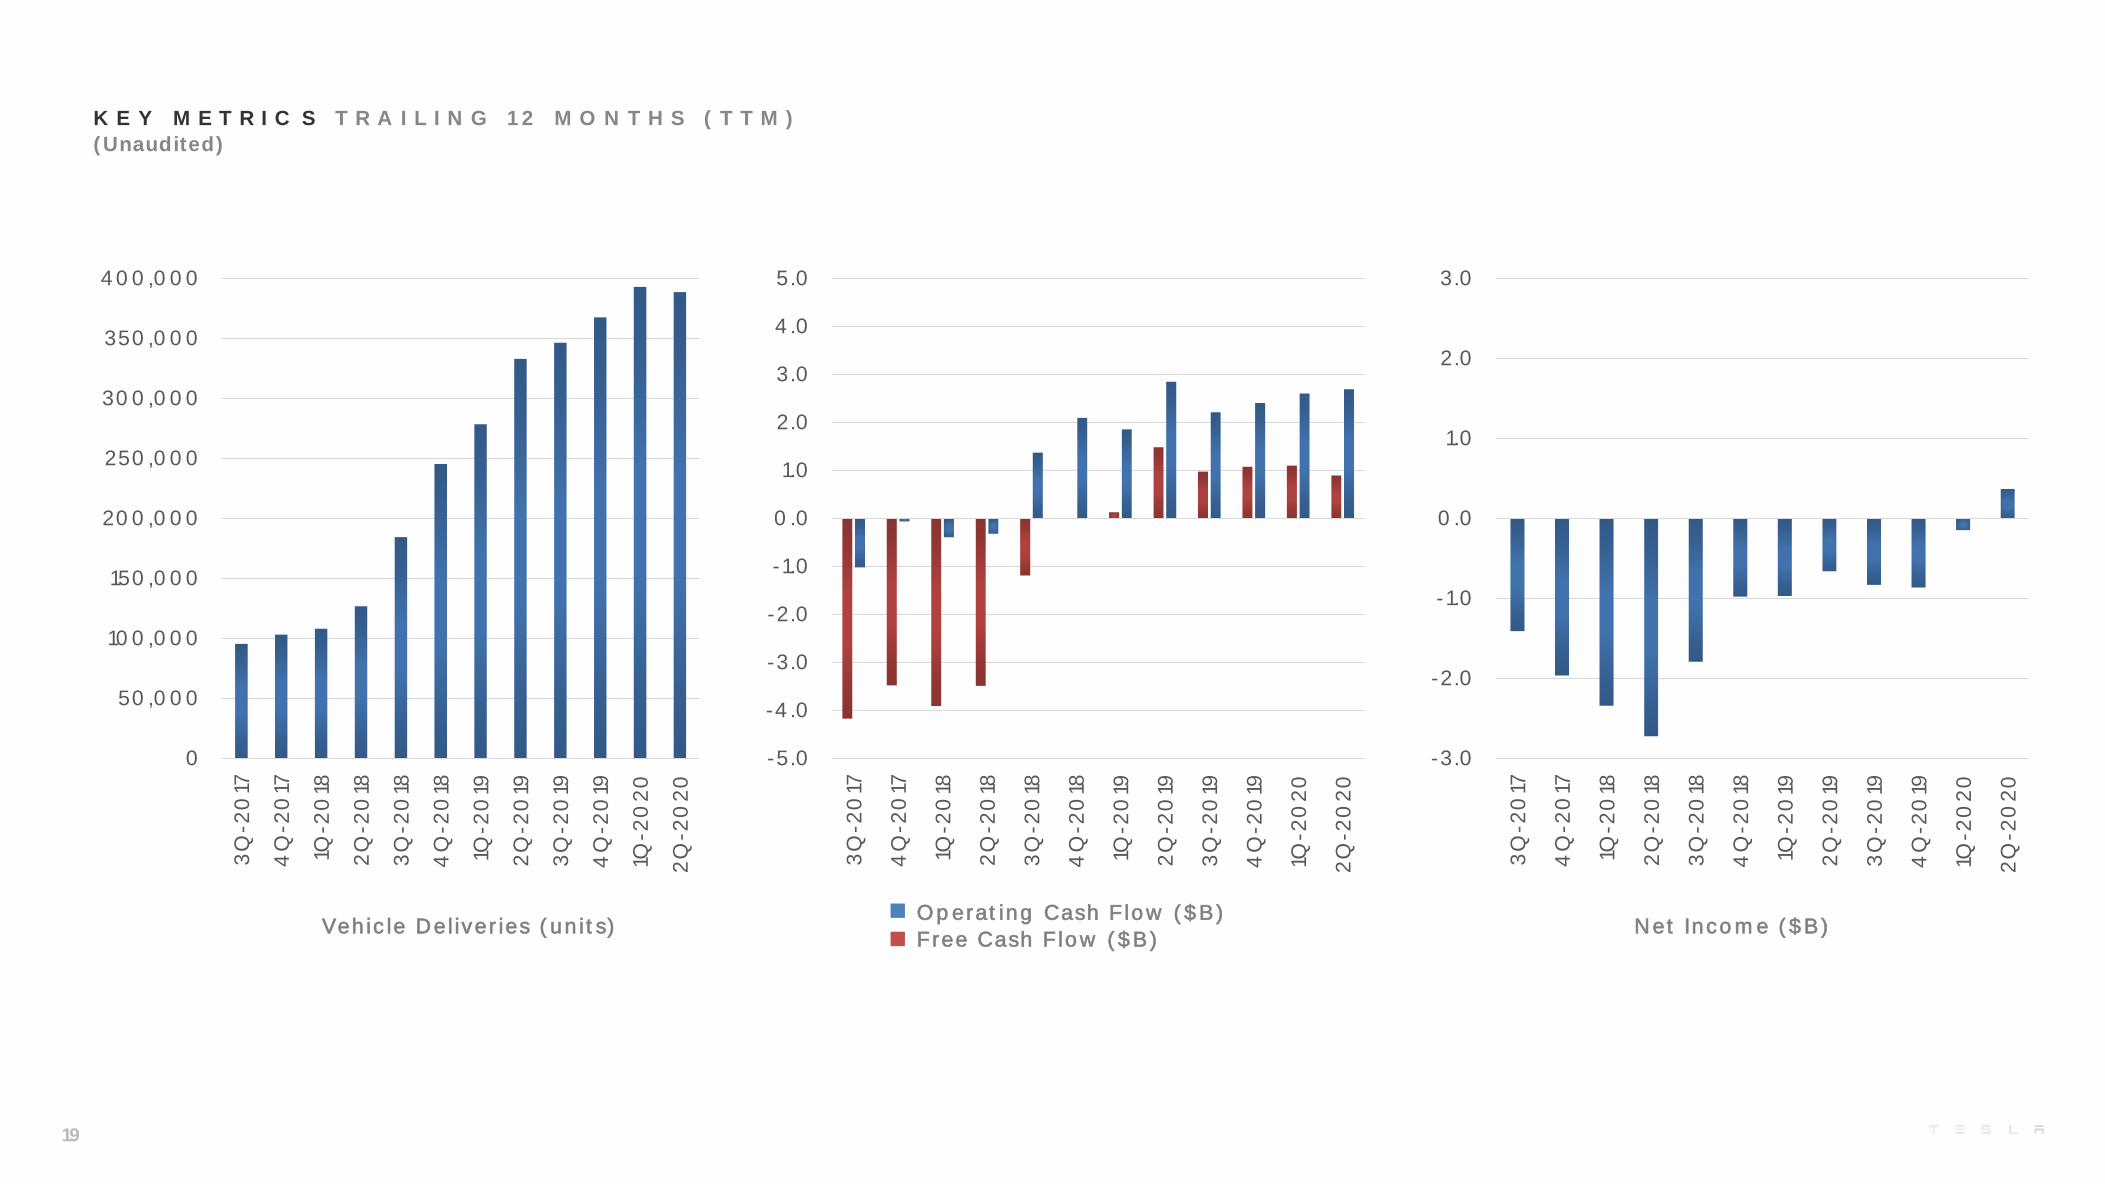
K E Y M E T R I C S T R A I L I N G 1 2 M O N T H S ( T T M )
(Unaudited)
Vehicle Deliveries (units)Operating Cash Flow ($B)
Free Cash Flow ($B)Net Income ($B)
19
-3.0
-2.0
-1.0
0.0
1.0
2.0
3.0
3Q
-20
17
4Q
-20
17
1Q-2
018
2Q
-20
18
3Q
-20
18
4Q
-20
18
1Q-2
019
2Q
-20
19
3Q
-20
19
4Q
-20
19
1Q-2
02
0
2Q
-20
20

F I N A N C I A L S T A T E M E N T S
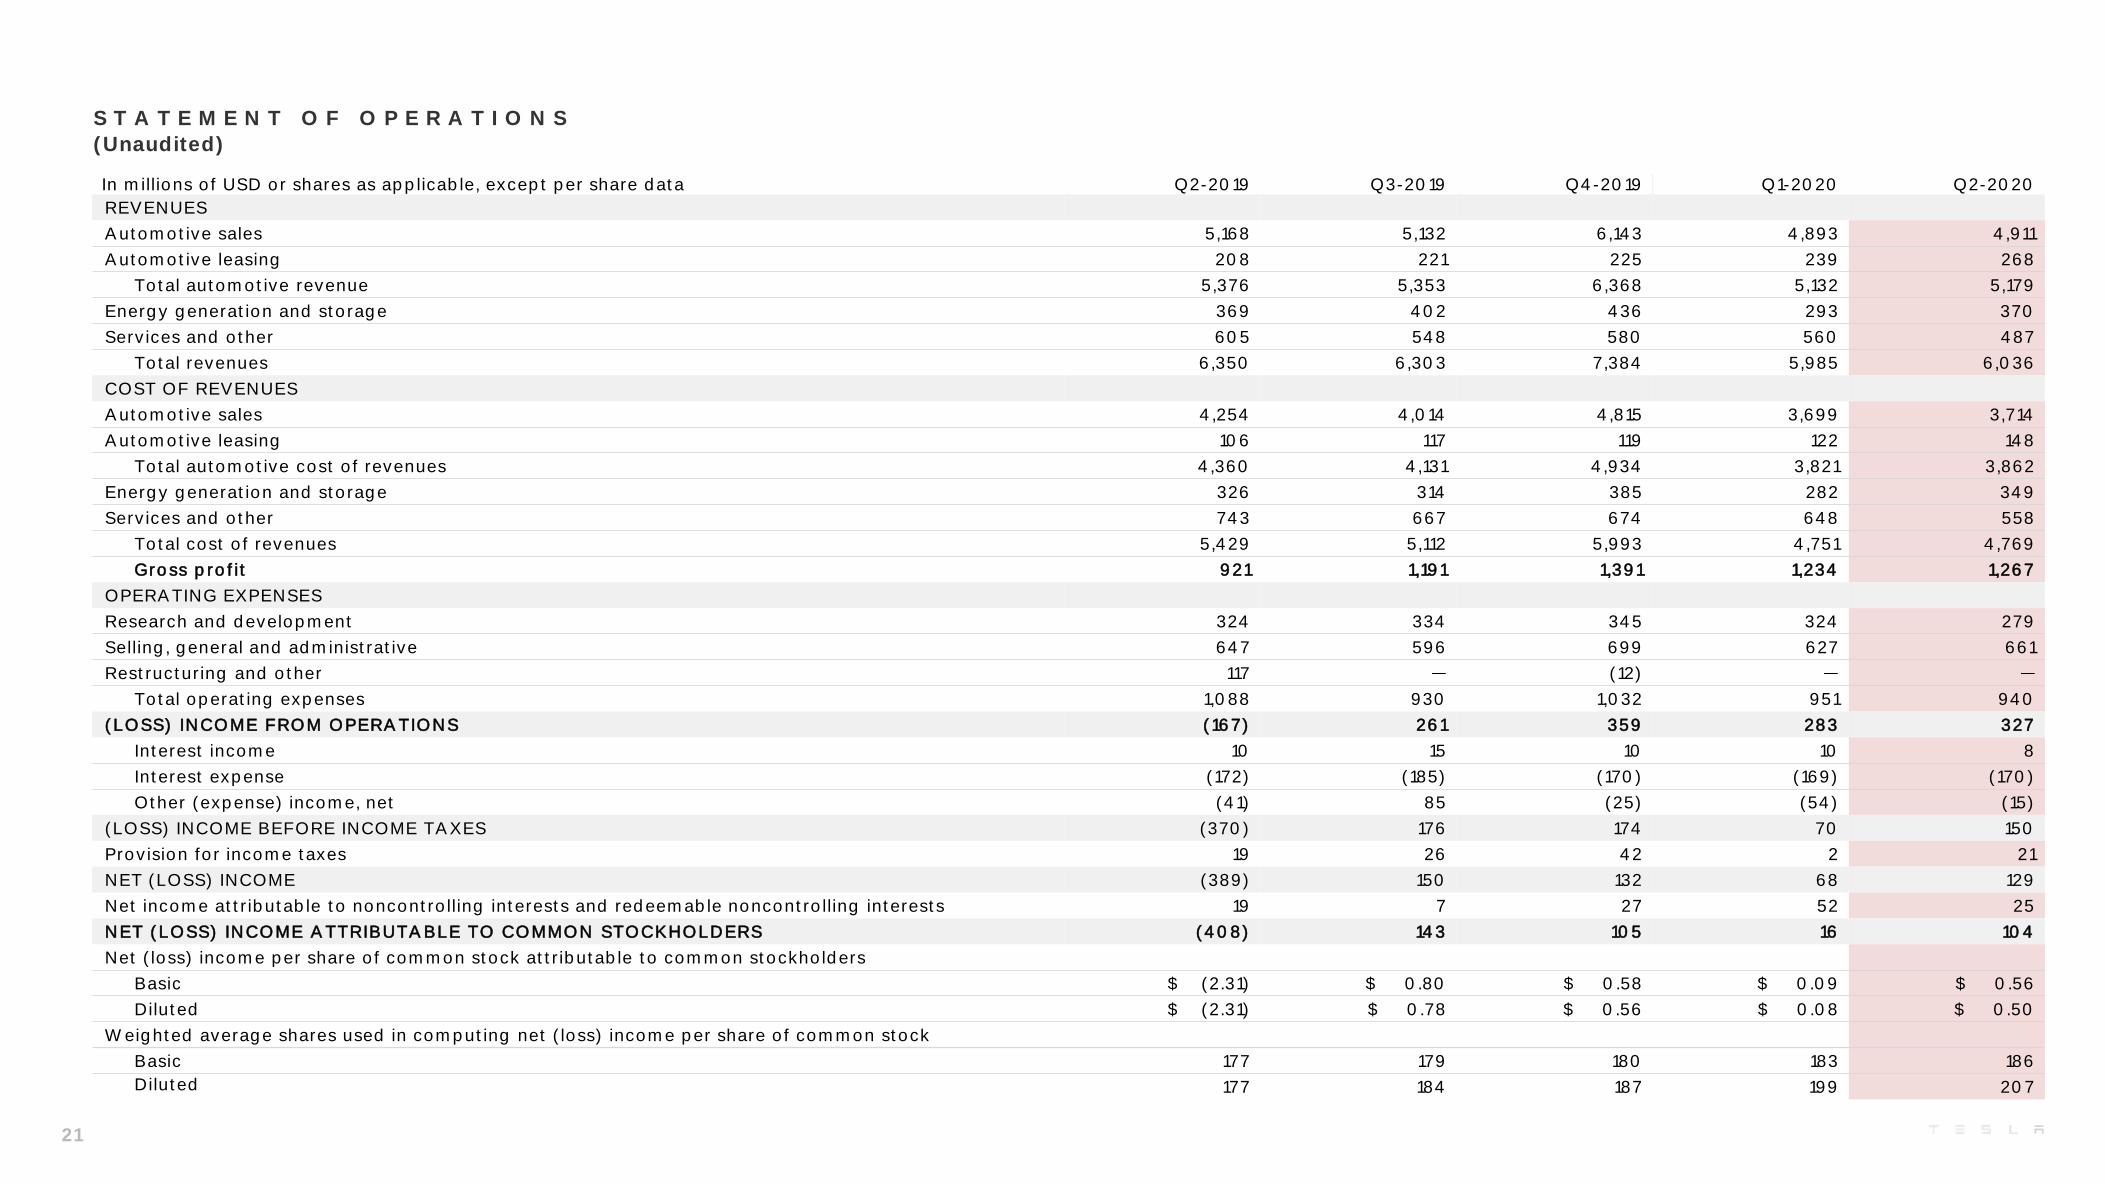
In millions of USD or shares as applicable, except per share data Q2-2019 Q3-2019 Q4-2019 Q1-2020 Q2-2020
REVENUES
Automotive sales 5,168 5,132 6,143 4,893 4,911
Automotive leasing 208 221 225 239 268
Total automotive revenue 5,376 5,353 6,368 5,132 5,179
Energy generation and storage 369 402 436 293 370
Services and other 605 548 580 560 487
Total revenues 6,350 6,303 7,384 5,985 6,036
COST OF REVENUES
Automotive sales 4,254 4,014 4,815 3,699 3,714
Automotive leasing 106 117 119 122 148
Total automotive cost of revenues 4,360 4,131 4,934 3,821 3,862
Energy generation and storage 326 314 385 282 349
Services and other 743 667 674 648 558
Total cost of revenues 5,429 5,112 5,993 4,751 4,769
Gross profit 921 1,191 1,391 1,234 1,267
OPERATING EXPENSES
Research and development 324 334 345 324 279
Selling, general and administrative 647 596 699 627 661
Restructuring and other 117 (12)
Total operating expenses 1,088 930 1,032 951 940
(LOSS) INCOME FROM OPERATIONS (167) 261 359 283 327
Interest income 10 15 10 10 8
Interest expense (172) (185) (170) (169) (170)
Other (expense) income, net (41) 85 (25) (54) (15)
(LOSS) INCOME BEFORE INCOME TAXES (370) 176 174 70 150
Provision for income taxes 19 26 42 2 21
NET (LOSS) INCOME (389) 150 132 68 129
Net income attributable to noncontrolling interests and redeemable noncontrolling interests 19 7 27 52 25
NET (LOSS) INCOME ATTRIBUTABLE TO COMMON STOCKHOLDERS (408) 143 105 16 104
Net (loss) income per share of common stock attributable to common stockholders
Basic $ (2.31) $ 0.80 $ 0.58 $ 0.09 $ 0.56
Diluted $ (2.31) $ 0.78 $ 0.56 $ 0.08 $ 0.50
Weighted average shares used in computing net (loss) income per share of common stock
Basic 177 179 180 183 186
Diluted 177 184 187 199 207
S T A T E M E N T O F O P E R A T I O N S
(Unaudited)
21
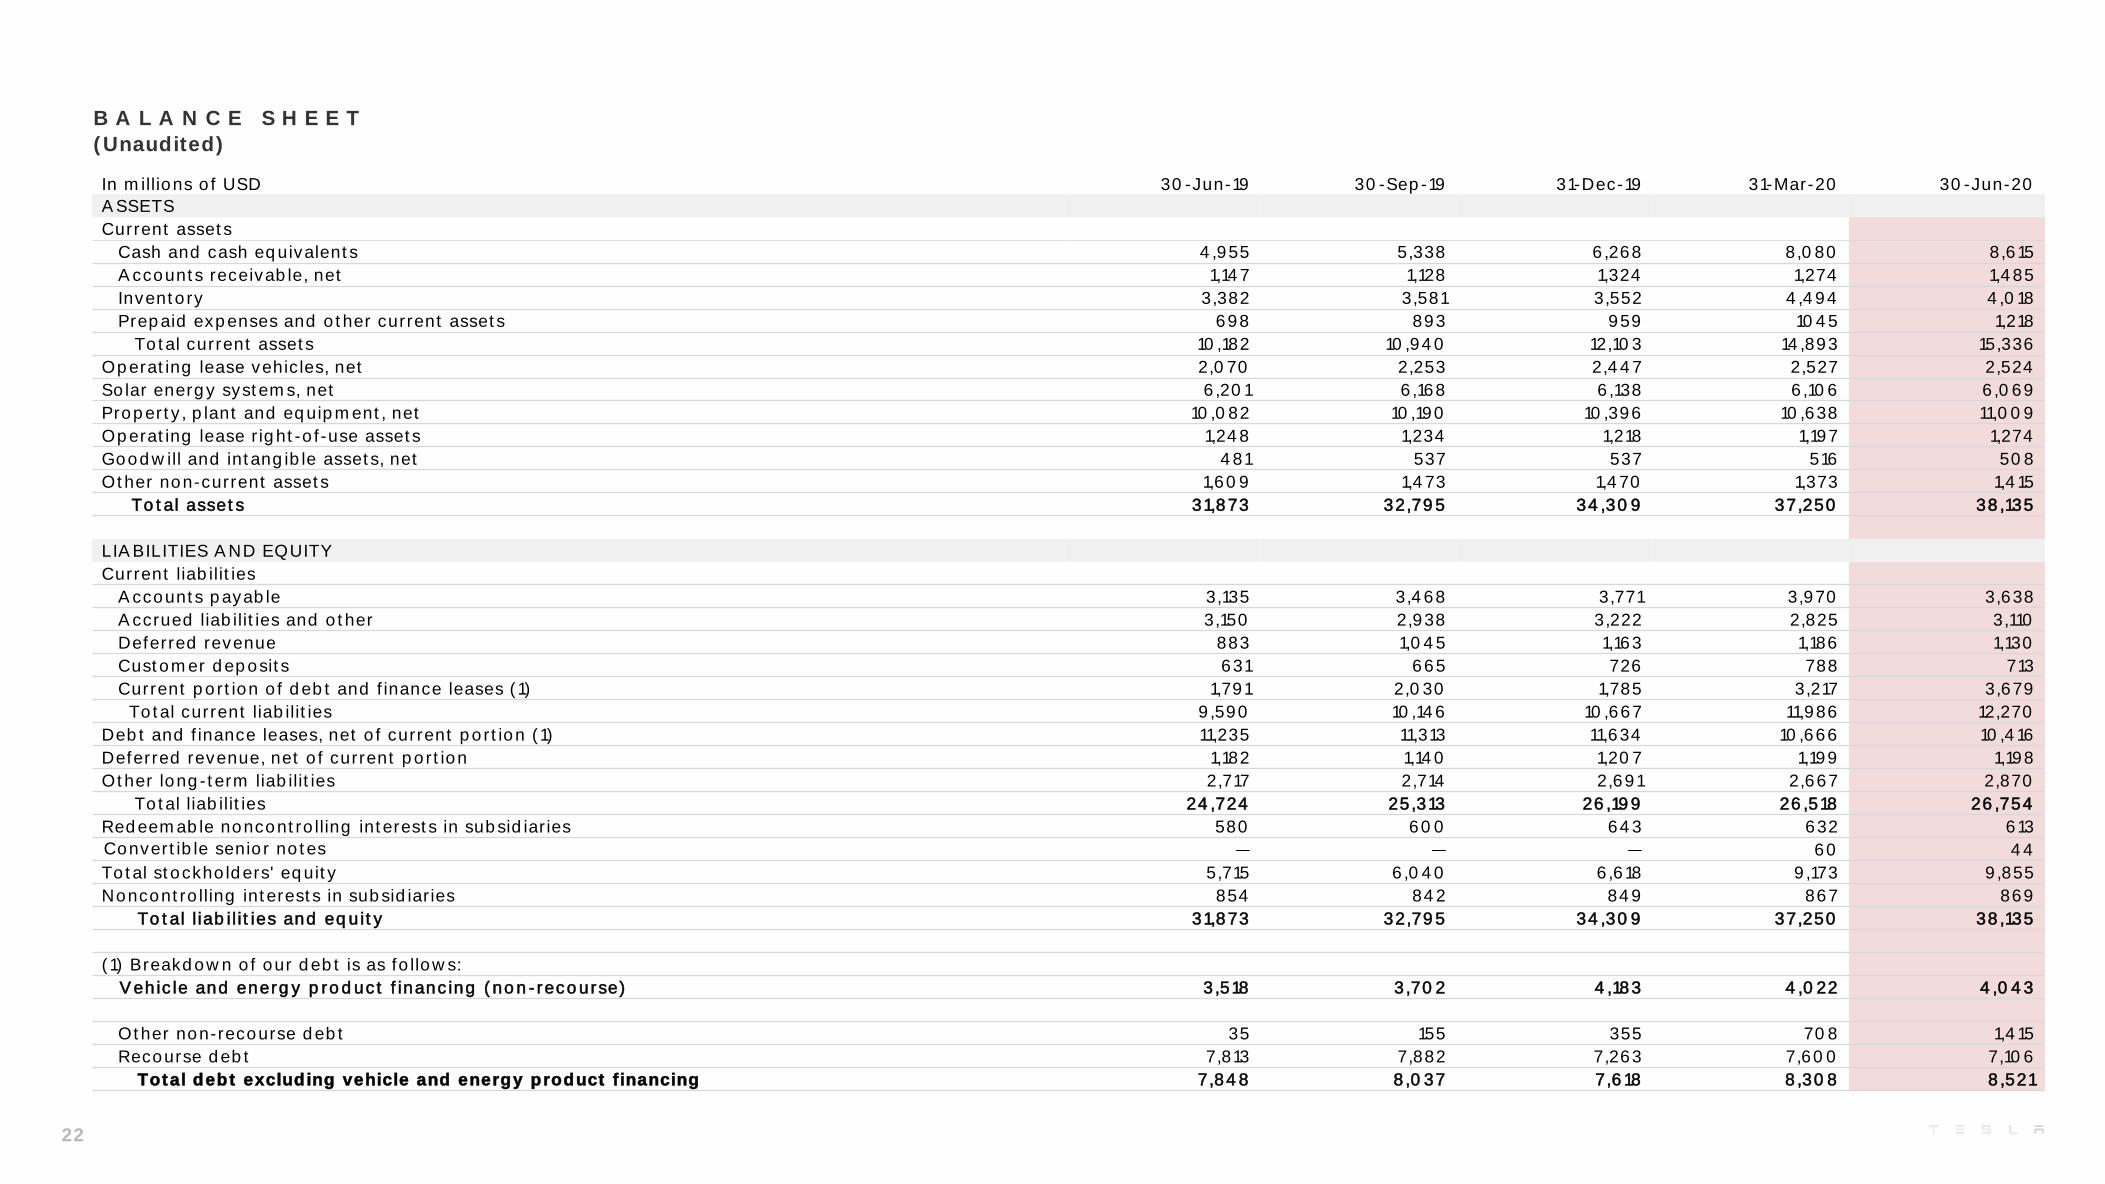
B A L A N C E S H E E T
(Unaudited)
In millions of USD 30-Jun-19 30-Sep-19 31-Dec-19 31-Mar-20 30-Jun-20
ASSETS
Current assets
Cash and cash equivalents 4,955 5,338 6,268 8,080 8,615
Accounts receivable, net 1,147 1,128 1,324 1,274 1,485
Inventory 3,382 3,581 3,552 4,494 4,018
Prepaid expenses and other current assets 698 893 959 1045 1,218
Total current assets 10,182 10,940 12,103 14,893 15,336
Operating lease vehicles, net 2,070 2,253 2,447 2,527 2,524
Solar energy systems, net 6,201 6,168 6,138 6,106 6,069
Property, plant and equipment, net 10,082 10,190 10,396 10,638 11,009
Operating lease right-of-use assets 1,248 1,234 1,218 1,197 1,274
Goodwill and intangible assets, net 481 537 537 516 508
Other non-current assets 1,609 1,473 1,470 1,373 1,415
Total assets 31,873 32,795 34,309 37,250 38,135
LIABILITIES AND EQUITY
Current liabilities
Accounts payable 3,135 3,468 3,771 3,970 3,638
Accrued liabilities and other 3,150 2,938 3,222 2,825 3,110
Deferred revenue 883 1,045 1,163 1,186 1,130
Customer deposits 631 665 726 788 713
Current portion of debt and finance leases (1) 1,791 2,030 1,785 3,217 3,679
Total current liabilities 9,590 10,146 10,667 11,986 12,270
Debt and finance leases, net of current portion (1) 11,235 11,313 11,634 10,666 10,416
Deferred revenue, net of current portion 1,182 1,140 1,207 1,199 1,198
Other long-term liabilities 2,717 2,714 2,691 2,667 2,870
Total liabilities 24,724 25,313 26,199 26,518 26,754
Redeemable noncontrolling interests in subsidiaries 580 600 643 632 613
Convertible senior notes 60 44
Total stockholders' equity 5,715 6,040 6,618 9,173 9,855
Noncontrolling interests in subsidiaries 854 842 849 867 869
Total liabilities and equity 31,873 32,795 34,309 37,250 38,135
(1) Breakdown of our debt is as follows:
Vehicle and energy product financing (non-recourse) 3,518 3,702 4,183 4,022 4,043
Other non-recourse debt 35 155 355 708 1,415
Recourse debt 7,813 7,882 7,263 7,600 7,106
Total debt excluding vehicle and energy product financing 7,848 8,037 7,618 8,308 8,521
22
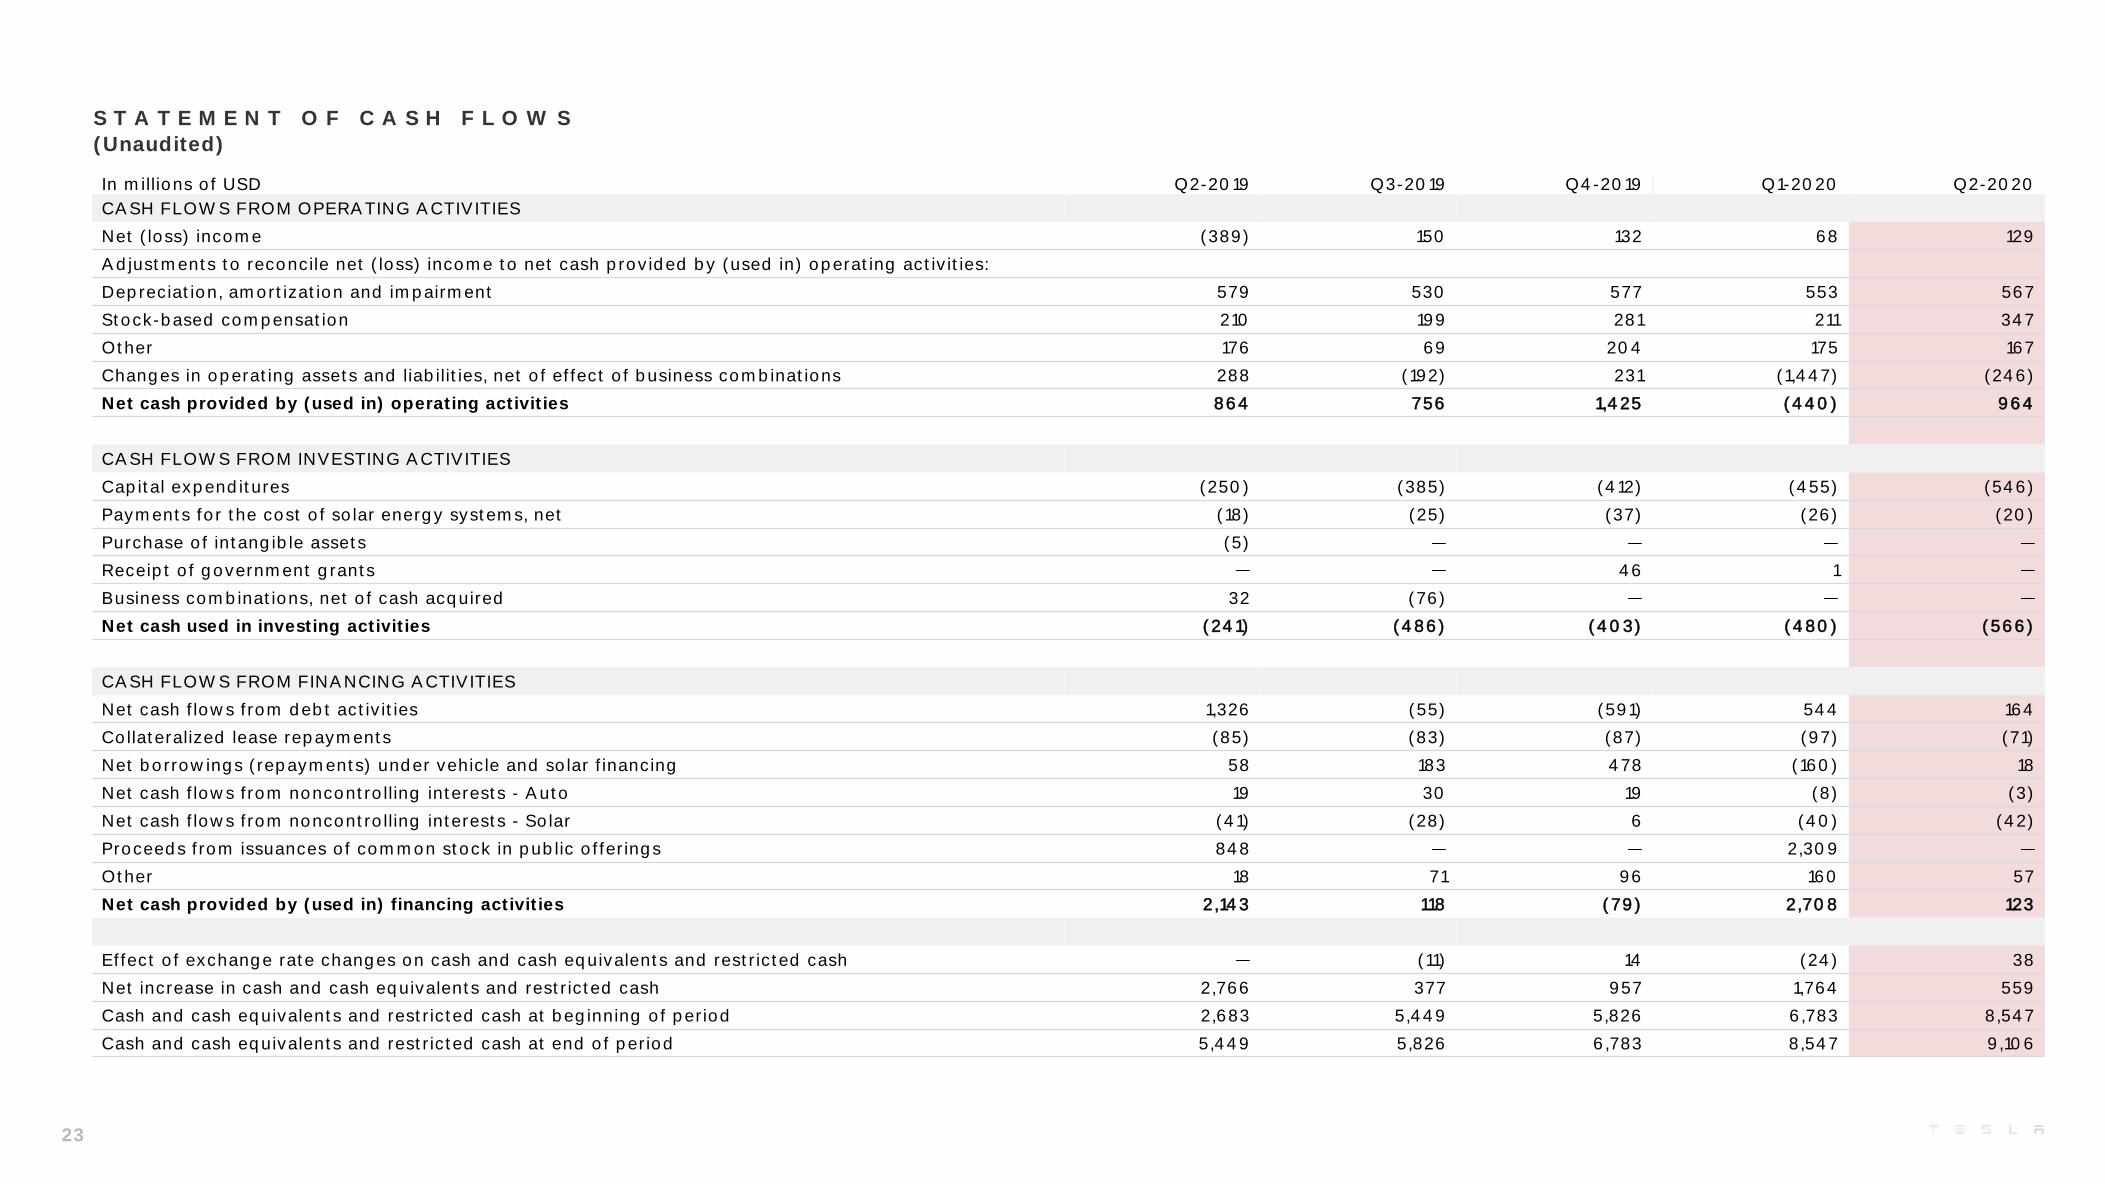
In millions of USD Q2-2019 Q3-2019 Q4-2019 Q1-2020 Q2-2020
CASH FLOWS FROM OPERATING ACTIVITIES
Net (loss) income (389) 150 132 68 129
Adjustments to reconcile net (loss) income to net cash provided by (used in) operating activities:
Depreciation, amortization and impairment 579 530 577 553 567
Stock-based compensation 210 199 281 211 347
Other 176 69 204 175 167
Changes in operating assets and liabilities, net of effect of business combinations 288 (192) 231 (1,447) (246)
Net cash provided by (used in) operating activities 864 756 1,425 (440) 964
CASH FLOWS FROM INVESTING ACTIVITIES
Capital expenditures (250) (385) (412) (455) (546)
Payments for the cost of solar energy systems, net (18) (25) (37) (26) (20)
Purchase of intangible assets (5)
Receipt of government grants 46 1
Business combinations, net of cash acquired 32 (76)
Net cash used in investing activities (241) (486) (403) (480) (566)
CASH FLOWS FROM FINANCING ACTIVITIES
Net cash flows from debt activities 1,326 (55) (591) 544 164
Collateralized lease repayments (85) (83) (87) (97) (71)
Net borrowings (repayments) under vehicle and solar financing 58 183 478 (160) 18
Net cash flows from noncontrolling interests - Auto 19 30 19 (8) (3)
Net cash flows from noncontrolling interests - Solar (41) (28) 6 (40) (42)
Proceeds from issuances of common stock in public offerings 848 2,309
Other 18 71 96 160 57
Net cash provided by (used in) financing activities 2,143 118 (79) 2,708 123
Effect of exchange rate changes on cash and cash equivalents and restricted cash (11) 14 (24) 38
Net increase in cash and cash equivalents and restricted cash 2,766 377 957 1,764 559
Cash and cash equivalents and restricted cash at beginning of period 2,683 5,449 5,826 6,783 8,547
Cash and cash equivalents and restricted cash at end of period 5,449 5,826 6,783 8,547 9,106
S T A T E M E N T O F C A S H F L O W S
(Unaudited)
23
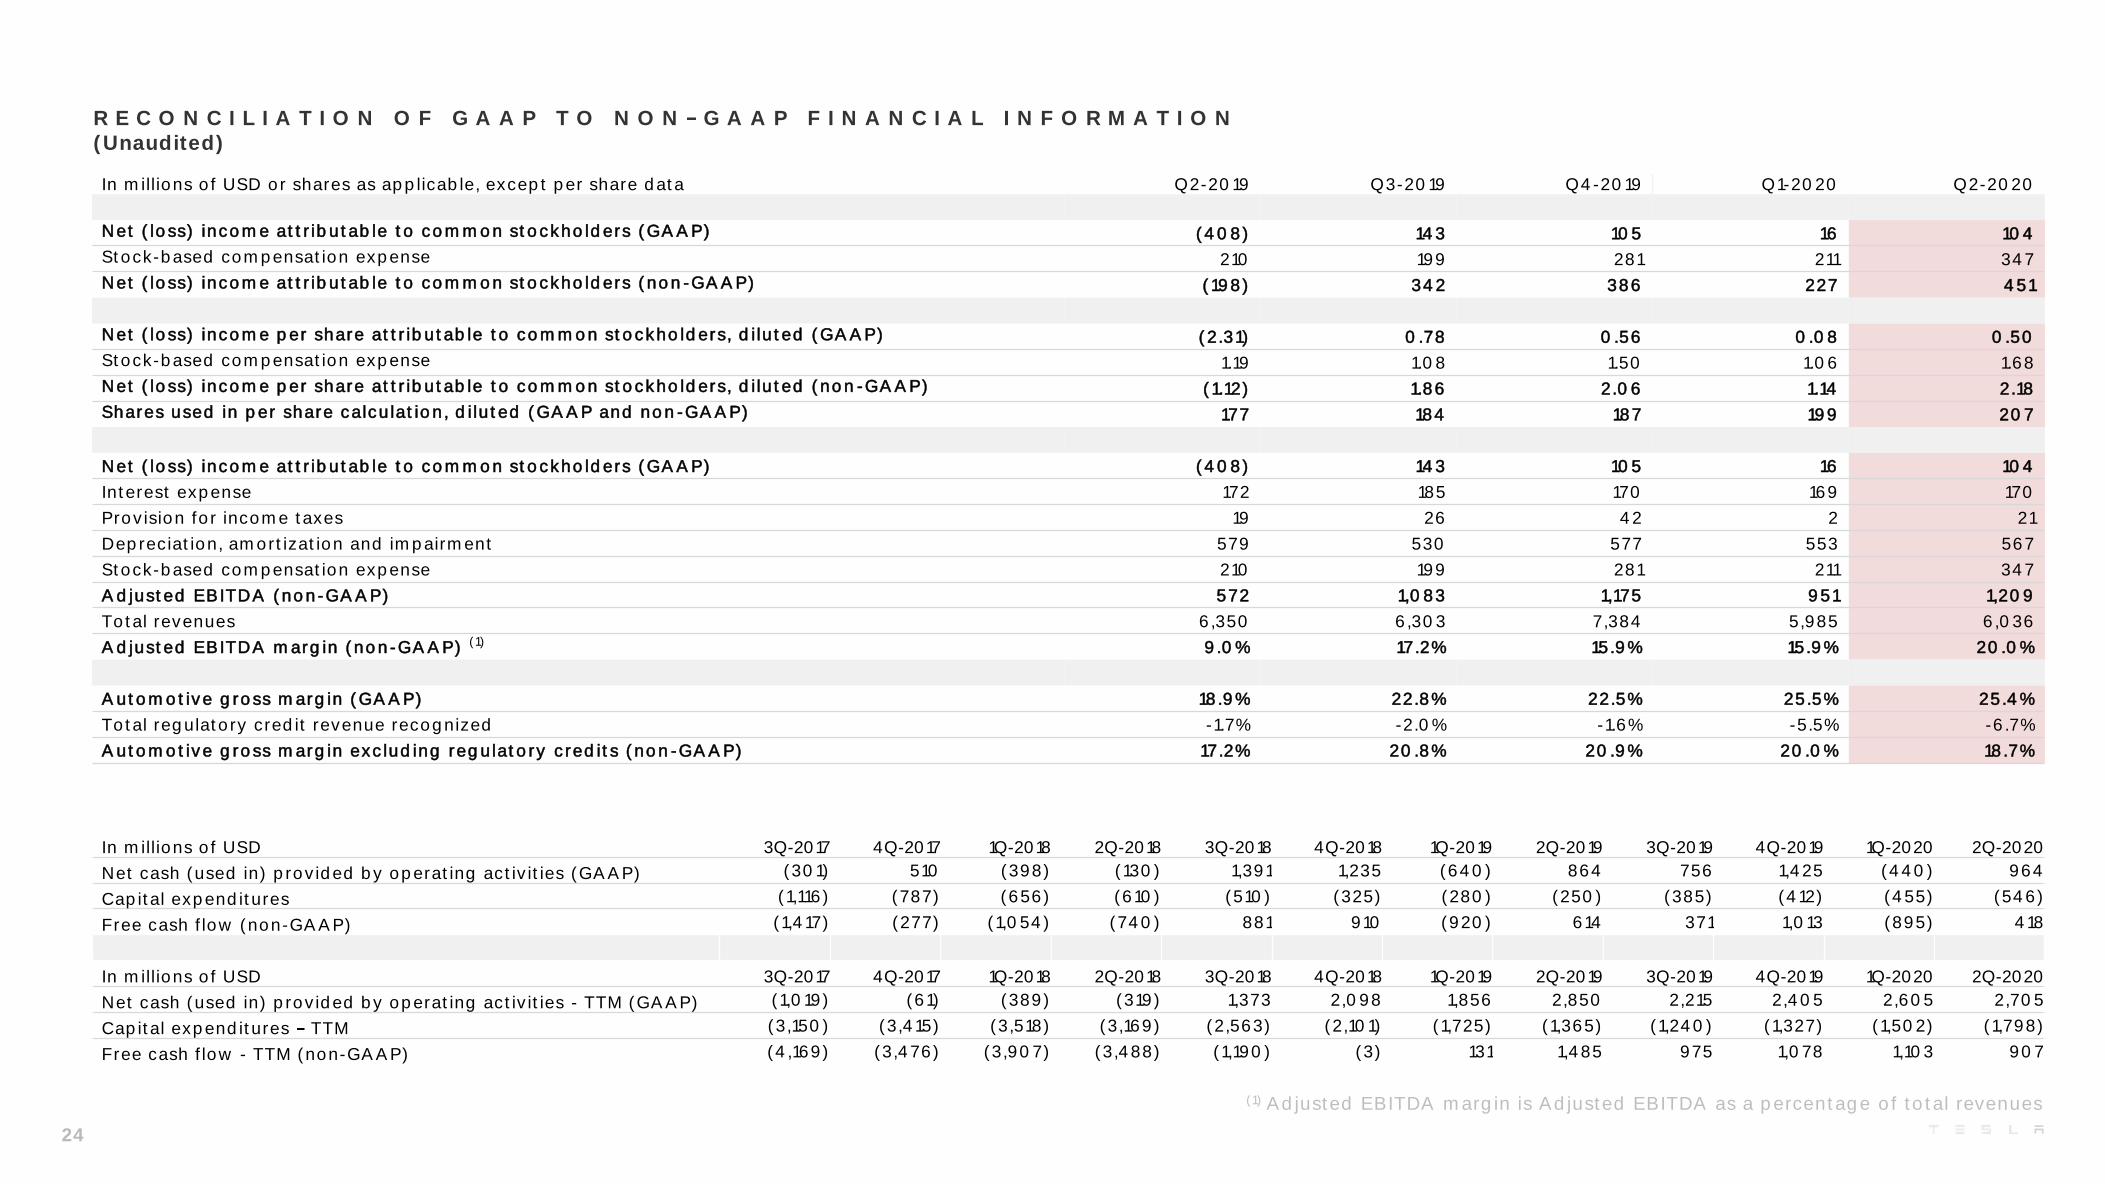
In millions of USD or shares as applicable, except per share data Q2-2019 Q3-2019 Q4-2019 Q1-2020 Q2-2020
Net (loss) income attributable to common stockholders (GAAP) (408) 143 105 16 104
Stock-based compensation expense 210 199 281 211 347
Net (loss) income attributable to common stockholders (non-GAAP) (198) 342 386 227 451
Net (loss) income per share attributable to common stockholders, diluted (GAAP) (2.31) 0.78 0.56 0.08 0.50
Stock-based compensation expense 1.19 1.08 1.50 1.06 1.68
Net (loss) income per share attributable to common stockholders, diluted (non-GAAP) (1.12) 1.86 2.06 1.14 2.18
Shares used in per share calculation, diluted (GAAP and non-GAAP) 177 184 187 199 207
Net (loss) income attributable to common stockholders (GAAP) (408) 143 105 16 104
Interest expense 172 185 170 169 170
Provision for income taxes 19 26 42 2 21
Depreciation, amortization and impairment 579 530 577 553 567
Stock-based compensation expense 210 199 281 211 347
Adjusted EBITDA (non-GAAP) 572 1,083 1,175 951 1,209
Total revenues 6,350 6,303 7,384 5,985 6,036
Adjusted EBITDA margin (non-GAAP) (1) 9.0% 17.2% 15.9% 15.9% 20.0%
Automotive gross margin (GAAP) 18.9% 22.8% 22.5% 25.5% 25.4%
Total regulatory credit revenue recognized -1.7% -2.0% -1.6% -5.5% -6.7%
Automotive gross margin excluding regulatory credits (non-GAAP) 17.2% 20.8% 20.9% 20.0% 18.7%
R E C O N C I L I A T I O N O F G A A P T O N O N G A A P F I N A N C I A L I N F O R M A T I O N (Unaudited)
(1) Adjusted EBITDA margin is Adjusted EBITDA as a percentage of total revenues
24
In millions of USD 3Q-2017 4Q-2017 1Q-2018 2Q-2018 3Q-2018 4Q-2018 1Q-2019 2Q-2019 3Q-2019 4Q-2019 1Q-2020 2Q-2020
Net cash (used in) provided by operating activities (GAAP) (301) 510 (398) (130) 1,391 1,235 (640) 864 756 1,425 (440) 964
Capital expenditures (1,116) (787) (656) (610) (510) (325) (280) (250) (385) (412) (455) (546)
Free cash flow (non-GAAP) (1,417) (277) (1,054) (740) 881 910 (920) 614 371 1,013 (895) 418
In millions of USD 3Q-2017 4Q-2017 1Q-2018 2Q-2018 3Q-2018 4Q-2018 1Q-2019 2Q-2019 3Q-2019 4Q-2019 1Q-2020 2Q-2020
Net cash (used in) provided by operating activities - TTM (GAAP) (1,019) (61) (389) (319) 1,373 2,098 1,856 2,850 2,215 2,405 2,605 2,705
Capital expenditures TTM (3,150) (3,415) (3,518) (3,169) (2,563) (2,101) (1,725) (1,365) (1,240) (1,327) (1,502) (1,798)
Free cash flow - TTM (non-GAAP) (4,169) (3,476) (3,907) (3,488) (1,190) (3) 131 1,485 975 1,078 1,103 907
A D D I T I O N A L I N F O R M A T I O N
WEBCAST INFORMATION
Tesla will provide a live webcast of its second quarter 2020 financial results conference call beginning at 2:30 p.m. PT on July 22, 2020 at ir.tesla.com. This webcast will also be available for replay for approximately one year
thereafter.
CERTAIN TERMS
When used in this update, certain terms have the following meanings. Our vehicle deliveries include only vehicles that have been transferred to end customers with all paperwork correctly completed. Our energy product
deployment volume includes both customer units installed and equipment sales; we report installations at time of commissioning for storage projects or inspection for solar projects, and equipment sales at time of delivery.
"Adjusted EBITDA" is equal to (i) net income (loss) attributable to common stockholders before (ii)(a) interest expense, (b) provision for income taxes, (c) depreciation, amortization and impairment and (d) stock-based
compensation expense, which is the same measurement for this term pursuant to the performance-based stock option award granted to our CEO in 2018. "Free cash flow" is operating cash flow less capital expenditures.
NON-GAAP FINANCIAL INFORMATION
Consolidated financial information has been presented in accordance with GAAP as well as on a non-GAAP basis to supplement our consolidated financial results. Our non-GAAP financial measures include non-GAAP automotive
gross margin, non-GAAP net income (loss) attributable to common stockholders, non-GAAP net income (loss) attributable to common stockholders on a diluted per share basis (calculated using weighted average shares for
GAAP diluted net income (loss) attributable to common stockholders), Adjusted EBITDA, Adjusted EBITDA margin, and free cash flow. These non-
t is useful to supplement its GAAP financial statements with this non-GAAP information because
management uses such information internally for its operating, budgeting and financial planning purposes. Management also believes that presentation of the non-GAAP financial measures provides useful information to our
investors regarding our financial condition and results of operations because it allows investors greater transparency to the information and financial metrics used by Tesla management in its financial and operational decision-
making, as -GAAP information is not prepared under a comprehensive set of accounting rules and therefore, should only be read in conjunction with financial
-GAAP financial information is provided above.
FORWARD-LOOKING STATEMENTS
duction capacity and output rates, volumes, demand, deliveries, installation capacity, deployment, features and/or timing of existing and future Tesla products and technologies such as Model 3, Model Y, Cybertruck, Tesla Semi, Roadster, Autopilot and Full Self Driving, and our energy products and services such as Megapack, Solar Roof and Autobidder; statements regarding cash flow, operating margin, spending, liquidity and profitability targets; statements regarding productivity improvements, cost reductions and efficiencies; and statements regarding construction, expansion, improvements and/or ramp at the Tesla Factory, Gigafactory Shanghai, Gigafactory -These forward- ies, actual results may differ materially from those projected. The following important factors, without limitation, could cause actual results to differ materially from those in the forward-looking statements: uncertainties in future macroeconomic and regulatory conditions arising from the current global pandemic, the risk of delays in the manufacture, production, delivery and/or completion of our vehicles and energy products and product features, including Model 3, Model Y, Tesla Semi and our autonomous driving features; our ability to grow our production, sales, delivery and servicing capabilities, and manage future growth effectively, especially internationally; consumand separate market acceptance of and demand for our vehicles; the ability of suppliers to meet quality and part delivery expectations at increasing volumes, especially with respect to our high-volume models; our ability to sustain and further grow our ramp of battery cell, energy product and product component production at Gigafactory Nevada; our ability to ramp Gigafactory Shanghai, Gigafactory Berlin and the new U.S. factory in accordance with our plans; any failures by Tesla products to perform as expected or if product recalls occur; our ability to continue to reduce or control manufacturing and other costs; competition in the automotive and energy product markets generally and the alternative fuel vehicle market and the premium vehicle markets in particular; our ability to execute on our evolving strategy for product sales, service, charging and other customer infrastructure; the unavailability, reduction or elimination of government and economic incentives for electric vehicles and energy products; potential difficulties in performing and realizing potential benefits under definitive agreements for our existing and future manufacturing facilities; our ability to attract and retain key employees and qualified personnel and ramp our installation teams; our ability to maintain the security of our information and product systems; our compliance with various regulations and laws applicable to our operations and products, which may evolve from time to time; risks relating to our indebtedness and financing strategies; and adverse foreign exchange movements. More information on potential factors that could affect our financial results is included from time to time in our Securities and Exchange Commission filings and reports, including the risks identified under the section captioned
-Q filed with the SEC on April 30, 2020. Tesla disclaims any obligation to update information contained in these forward-looking statements whether as a result of new information, future events or otherwise.
25