Q2 2019 Presentation - newsweb.oslobors.no
43
Q2 2019 Presentation CEO Torgrim Takle | CFO Jon Birger Syversen, 13 August 2019
Transcript of Q2 2019 Presentation - newsweb.oslobors.no

Q2 2019 PresentationCEO Torgrim Takle | CFO Jon Birger Syversen, 13 August 2019
Page 2
Disclaimer These materials may contain statements about future events and expectations that are forward-looking statements. Any statement in these materials that is not a statement ofhistorical fact including, without limitation, those regarding Crayon Group Holding ASA’s (the "Company") financial position, business strategy, plans and objectives of management forfuture operations is a forward-looking statement that involves known and unknown risks, uncertainties and other factors which may cause the actual results, performance orachievements of the Company to be materially different from any future results, performance or achievements expressed or implied by such forward-looking statements. Suchforward-looking statements are based on numerous assumptions regarding the Company’s present and future business strategies and the environment in which the Company willoperate in the future. Although management believes that the expectations reflected in these forward-looking statements are reasonable, it can give no assurances that they willmaterialise or prove to be correct. Because these statements are based on assumptions or estimates and are subject to risks and uncertainties, the actual results or outcome coulddiffer materially from those set out in the forward-looking statements as a result of many factors, including, among others competition from Nordic and international companies inthe markets in which the Company operates, changes in the demand for IT services and software licensing, changes in international, national and local economic, political, business,industry and tax conditions, the Company's ability to realise backlog as operating revenue, the Company's ability to correctly assess costs, pricing and other terms of its contracts, theCompany's ability to manage an increasingly complex business, political and administrative decisions that may affect the Company's public customer group contracts, the Company'sability to retain or replace key personnel and manage employee turnover and other labour costs, unplanned events affecting the Group's operations or equipment, the Company'sability to grow the business organically, changes regarding the Company's brand reputation and brand image, fluctuations in the price of goods, the value of the NOK and exchangeand interest rates, the Company's ability to manage its international operations, changes in the legal and regulatory environment and in the Company's compliance with laws andregulations, increases to the Company's effective tax rate or other harm to its business as a result of changes in tax laws, changes in the Company's business strategy, developmentand investment plans, other factors referenced in this report and the Company's success in identifying other risks to its business and managing the risks of the aforementioned factors.Should one or more of these risks or uncertainties materialise, or should any underlying estimates or assumptions prove to be inappropriate or incorrect, our actual financialcondition, cash flows or results of operations could differ materially from what is expressed or implied herein. The Company assumes no obligations to update the forward-lookingstatements contained herein to reflect actual results, changes in assumptions or changes in factors affecting these statements.
This presentation does not constitute or form part of, and is not prepared or made in connection with, an offer or invitation to sell, or any solicitation of any offer to subscribe for orpurchase any securities and nothing contained herein shall form the basis of any contract or commitment whatsoever. No reliance may be placed for any purposes whatsoever on theinformation contained in this presentation or on its completeness, accuracy or fairness. The information in this presentation is subject to verification, completion and change. Thecontents of this presentation have not been independently verified. The Company's securities have not been and will not be registered under the US Securities Act of 1933, asamended (the "US Securities Act”), and are offered and sold only outside the United States in accordance with an exemption from registration provided by Regulation S of the USSecurities Act. This presentation should not form the basis of any investment decision. Investors and prospective investors in securities of any issuer mentioned herein are required tomake their own independent investigation and appraisal of the business and financial condition of such company and the nature of the securities.

Page 3
Unique Business Model
Relentless SW innovation cycles
Managed Services & IP
S E R V I C E S
Customer acquisition
S O F T W A R E
Recurring business
Customer retention
Customer upsell
End-to-end services
Hyper scalable
Business ModelCustomers’ key challenges within IT
IT investments & complexity
I N F I N I T YGDPRHow to optimize SW spending?
?
Costs Business Value
Procurement & Deployment
Page 4
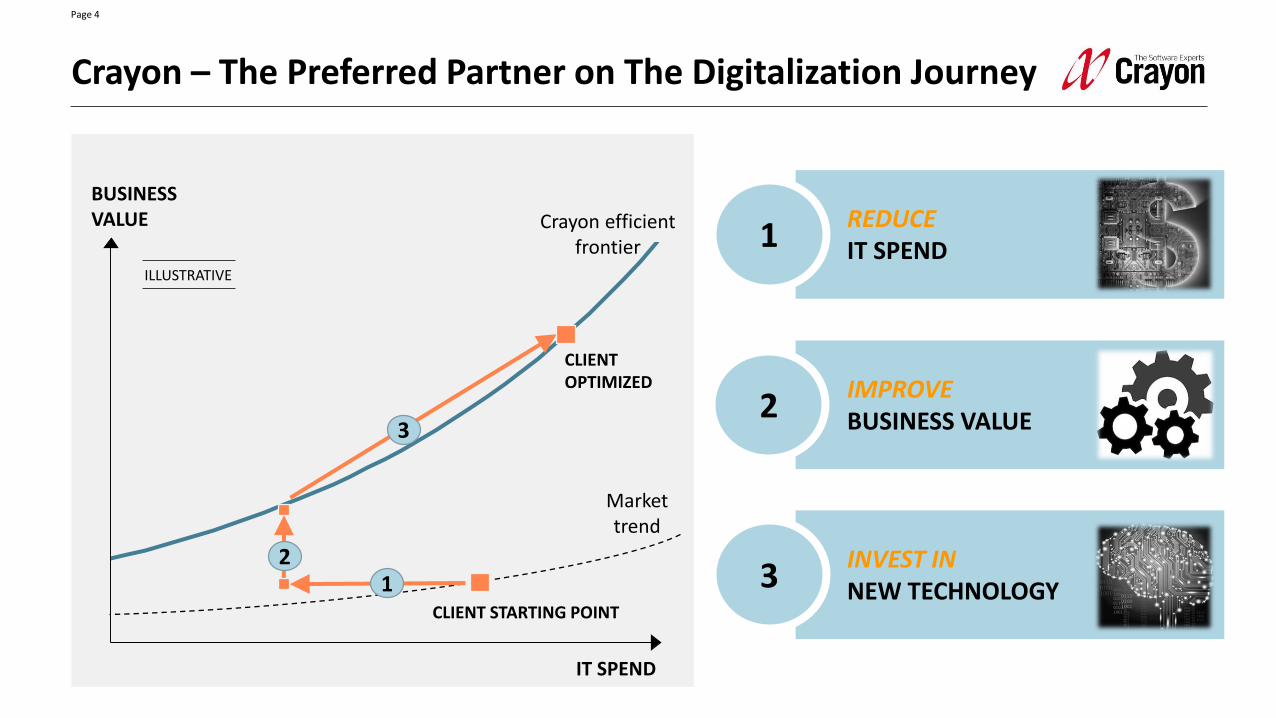
Crayon – The Preferred Partner on The Digitalization Journey
BUSINESSVALUE
IT SPEND
1REDUCEIT SPEND
ILLUSTRATIVE
CLIENT STARTING POINT
CLIENT OPTIMIZED
2
32
IMPROVEBUSINESS VALUE
3INVEST IN NEW TECHNOLOGY1
Crayon efficient frontier
Markettrend

Q2 2019 | CEO Torgrim Takle
5
Business Update
Page 6
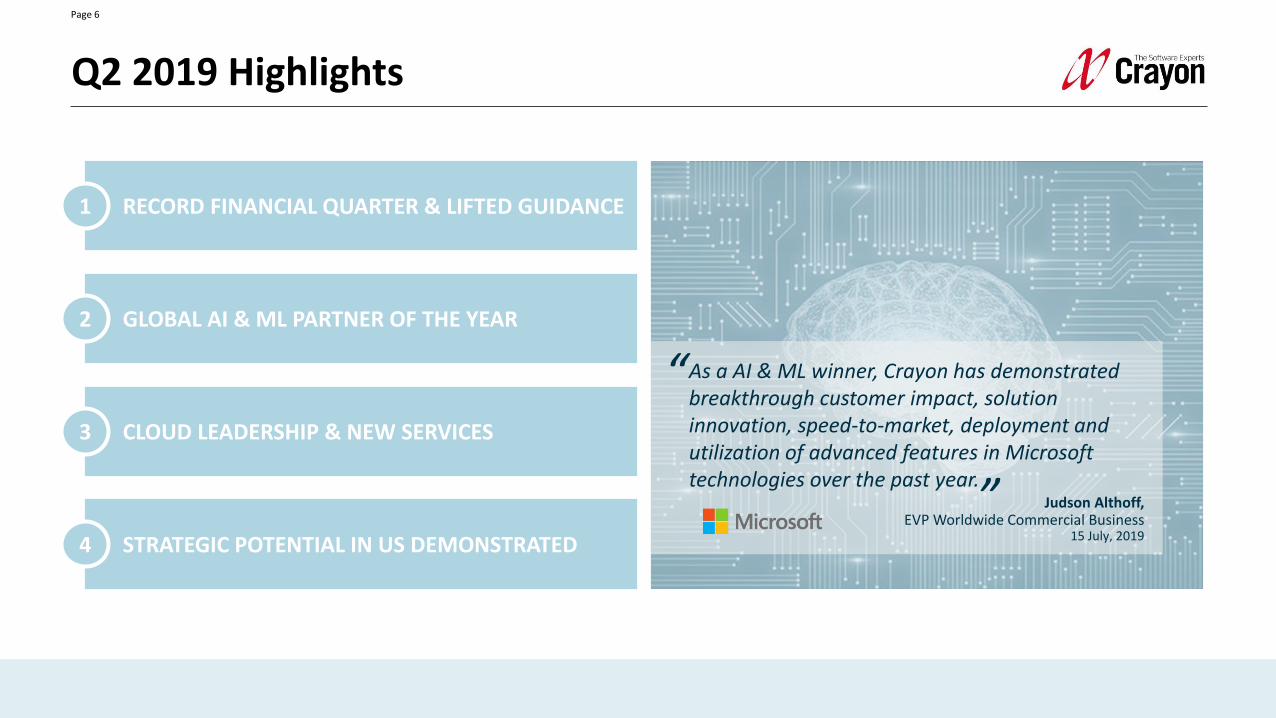
Q2 2019 Highlights
RECORD FINANCIAL QUARTER & LIFTED GUIDANCE1
GLOBAL AI & ML PARTNER OF THE YEAR2
CLOUD LEADERSHIP & NEW SERVICES3
STRATEGIC POTENTIAL IN US DEMONSTRATED4
As a AI & ML winner, Crayon has demonstrated breakthrough customer impact, solution innovation, speed-to-market, deployment and utilization of advanced features in Microsoft technologies over the past year.
“
” Judson Althoff, EVP Worldwide Commercial Business
15 July, 2019
Page 7
1 Adjusted EBITDA – EBITDA adjusted for share based compensation and other one-off income and expenses.
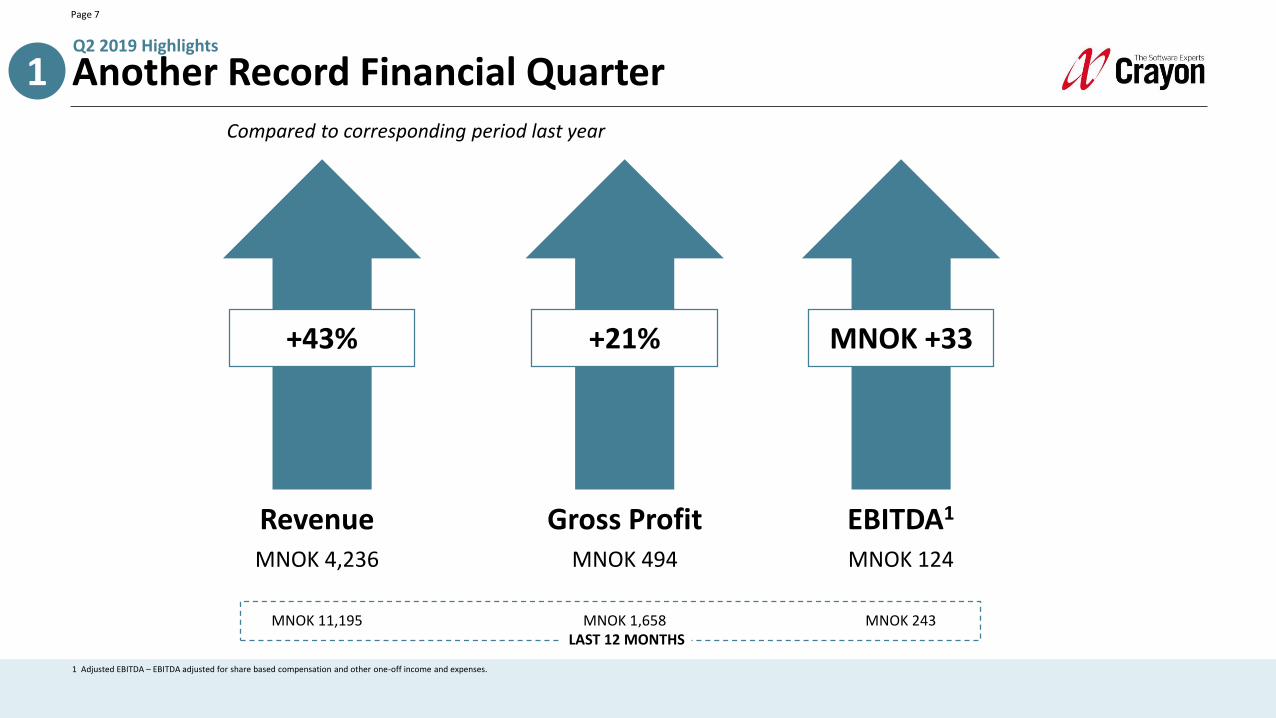
+43%
Revenue Gross Profit
Compared to corresponding period last year
+21%
EBITDA1
MNOK +33
Another Record Financial Quarter1Q2 2019 Highlights
MNOK 4,236 MNOK 494 MNOK 124
MNOK 11,195 MNOK 1,658 MNOK 243LAST 12 MONTHS

Page 8
Strong Performance Across Market Clusters1
0
5
10
15
20
0 10 20 30 40 50 60
USA
Growth Markets
Nordics
Start-Ups
EBITDA improvement NOK millions
Gross profit growth %
1 Q2 2019
Compared to corresponding period last year
Size = gross profit1
Q2 2019 Highlights
All market clusters demonstrated:
Double digit gross profit growth
Improved EBITDA performance
Page 9
1 Gross profit growth Year over Year (“YoY”) 2 EBITDA as a percentage of gross profit
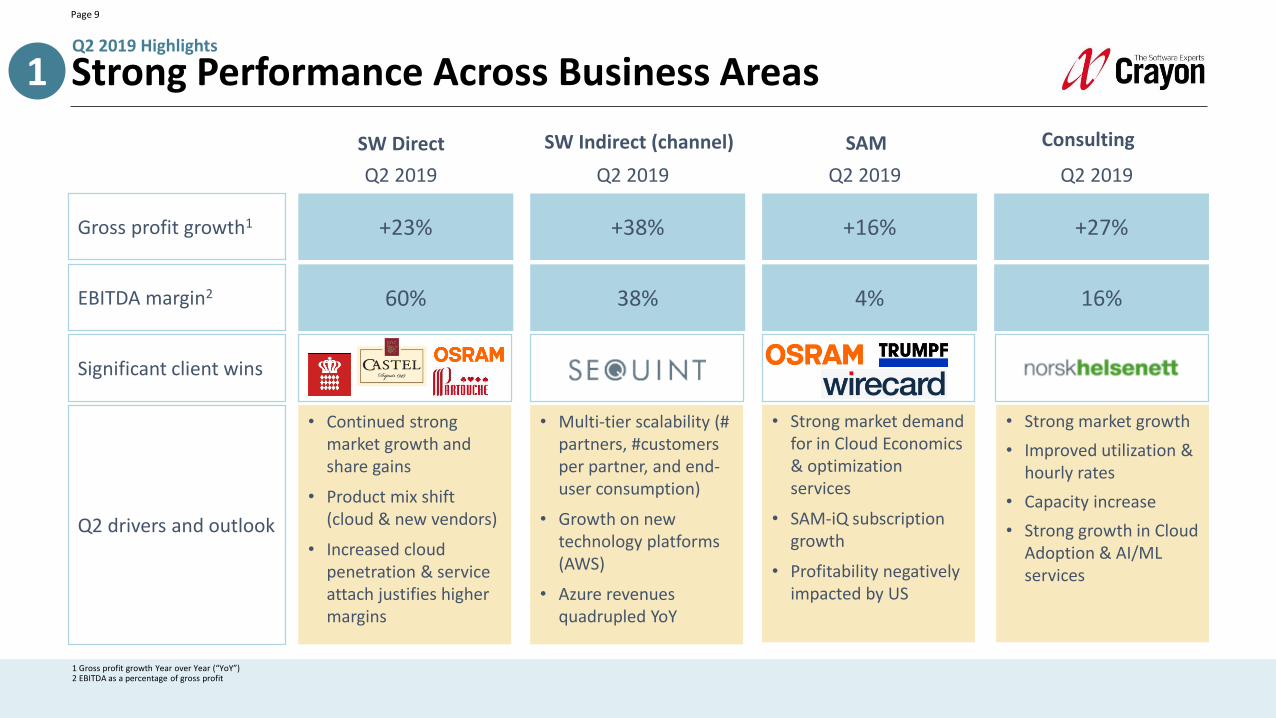
Strong Performance Across Business Areas
+23%
60%
+38%
38%
+16%
4%
+27%
16%
Q2 2019 Q2 2019 Q2 2019 Q2 2019
Gross profit growth1
EBITDA margin2
SW Direct SW Indirect (channel) SAM Consulting
Q2 drivers and outlook
• Continued strong market growth and share gains
• Product mix shift (cloud & new vendors)
• Increased cloud penetration & service attach justifies higher margins
• Multi-tier scalability (# partners, #customers per partner, and end-user consumption)
• Growth on new technology platforms (AWS)
• Azure revenues quadrupled YoY
• Strong market demand for in Cloud Economics & optimization services
• SAM-iQ subscription growth
• Profitability negatively impacted by US
• Strong market growth
• Improved utilization & hourly rates
• Capacity increase
• Strong growth in Cloud Adoption & AI/ML services
Significant client wins
1Q2 2019 Highlights
Page 10
Source: IDC; Gartner; Allied Market Research
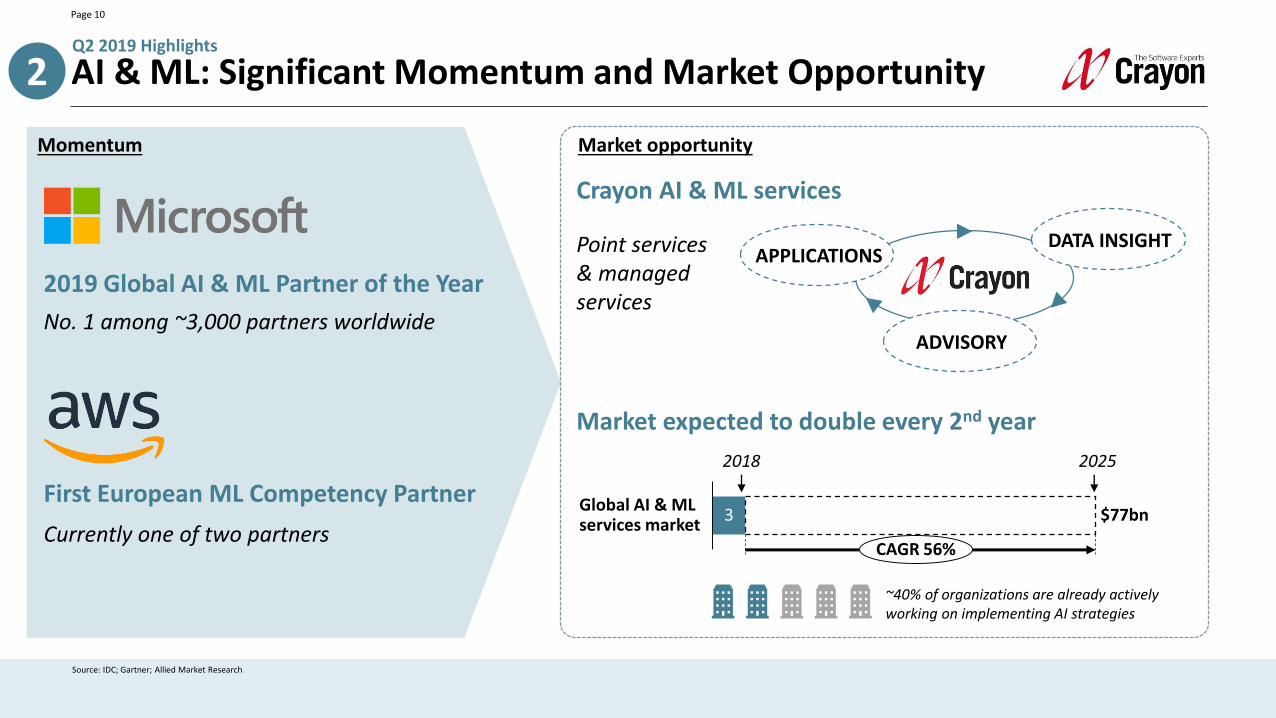
AI & ML: Significant Momentum and Market Opportunity2Q2 2019 Highlights
2019 Global AI & ML Partner of the Year
No. 1 among ~3,000 partners worldwide
First European ML Competency Partner
Currently one of two partners3
Global AI & ML services market
$77bn
CAGR 56%
Momentum Market opportunity
2018 2025
~40% of organizations are already actively working on implementing AI strategies
APPLICATIONSDATA INSIGHT
ADVISORY
Crayon AI & ML services
Point services & managed services
Market expected to double every 2nd year
Page 11
Source: IBM; Gartner; IDC; Canalys; Synergy Research Group
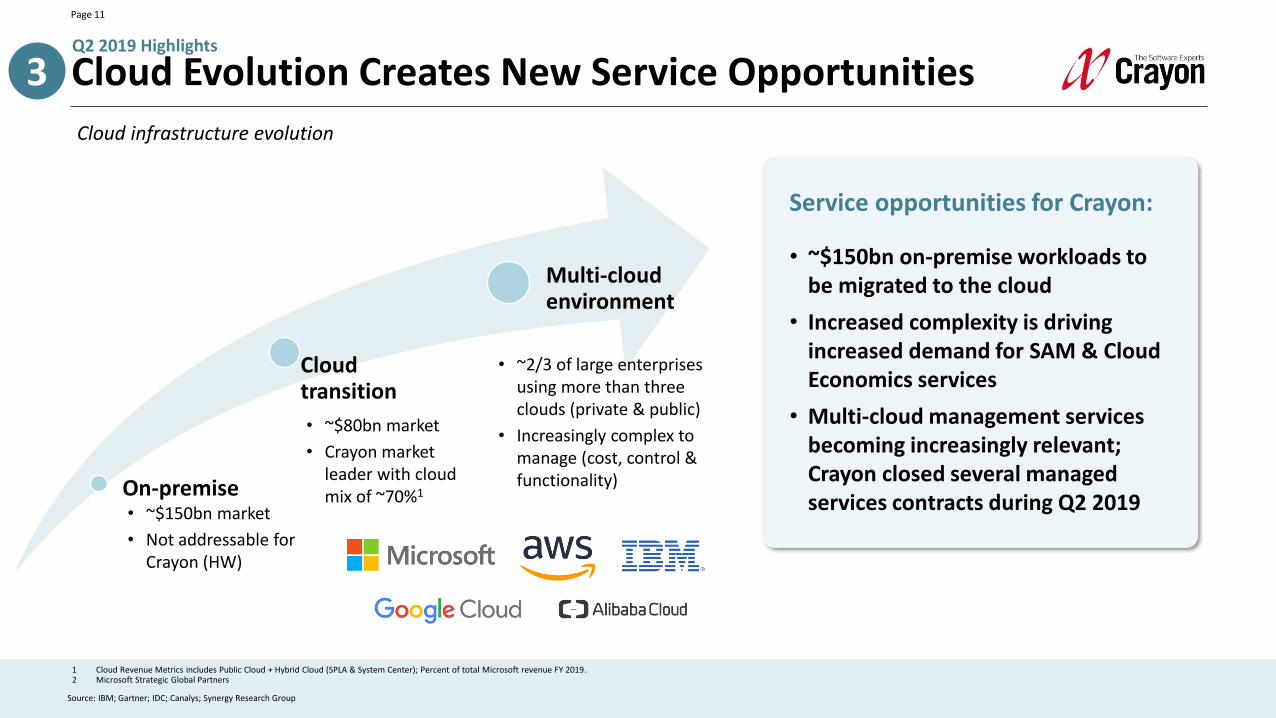
Cloud Evolution Creates New Service Opportunities3Q2 2019 Highlights
On-premise
Cloudtransition
Multi-cloudenvironment
Cloud infrastructure evolution
• ~$150bn market
• Not addressable for Crayon (HW)
• ~$80bn market
• Crayon market leader with cloud mix of ~70%1
• ~2/3 of large enterprises using more than three clouds (private & public)
• Increasingly complex to manage (cost, control & functionality)
1 Cloud Revenue Metrics includes Public Cloud + Hybrid Cloud (SPLA & System Center); Percent of total Microsoft revenue FY 2019. 2 Microsoft Strategic Global Partners
Service opportunities for Crayon:
• ~$150bn on-premise workloads to be migrated to the cloud
• Increased complexity is driving increased demand for SAM & Cloud Economics services
• Multi-cloud management services becoming increasingly relevant; Crayon closed several managed services contracts during Q2 2019
Page 12
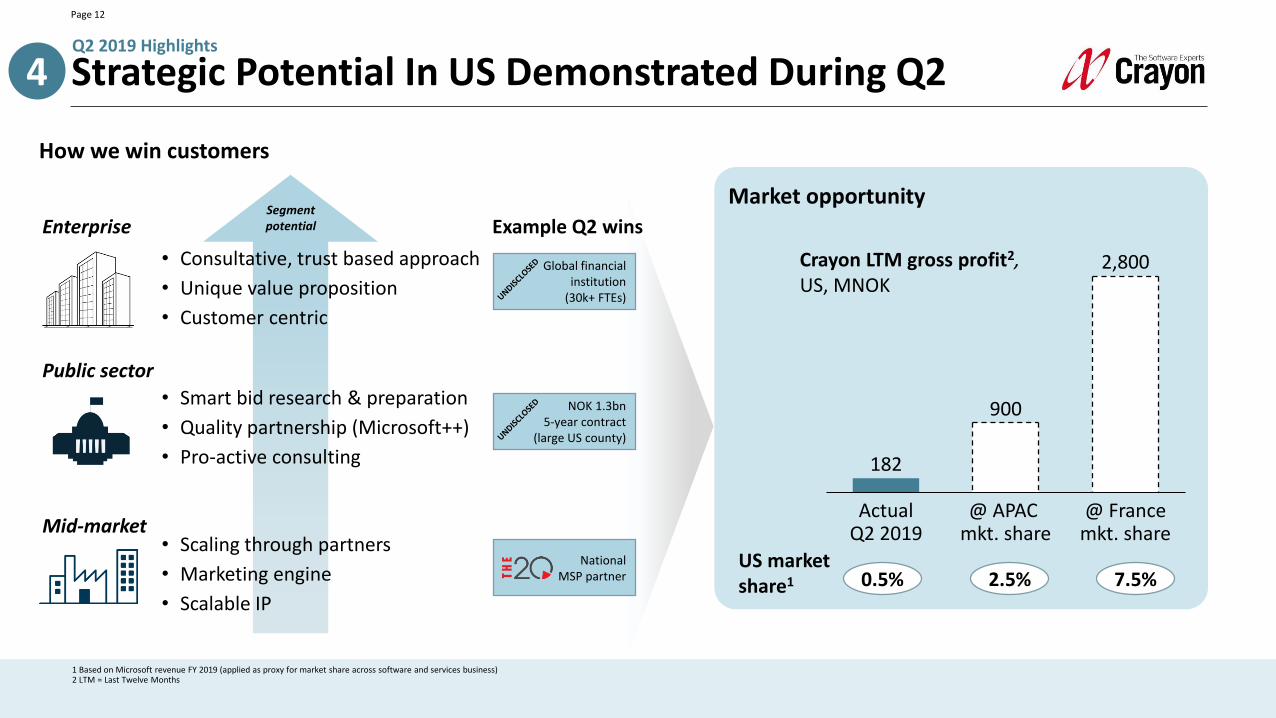
1 Based on Microsoft revenue FY 2019 (applied as proxy for market share across software and services business) 2 LTM = Last Twelve Months
Strategic Potential In US Demonstrated During Q24Q2 2019 Highlights
How we win customers
Market opportunityExample Q2 wins
182
900
2,800
ActualQ2 2019
@ APAC mkt. share
@ France mkt. share
US market share1
Crayon LTM gross profit2, US, MNOK
0.5% 2.5% 7.5%
Enterprise
• Consultative, trust based approach
• Unique value proposition
• Customer centric
Mid-market• Scaling through partners
• Marketing engine
• Scalable IP
Public sector
• Smart bid research & preparation
• Quality partnership (Microsoft++)
• Pro-active consulting
Segment potential
Global financial institution
(30k+ FTEs)
NOK 1.3bn 5-year contract
(large US county)
National MSP partner
Financial Review
13
Q2 2019 | CFO Jon Birger Syvertsen
Page 14
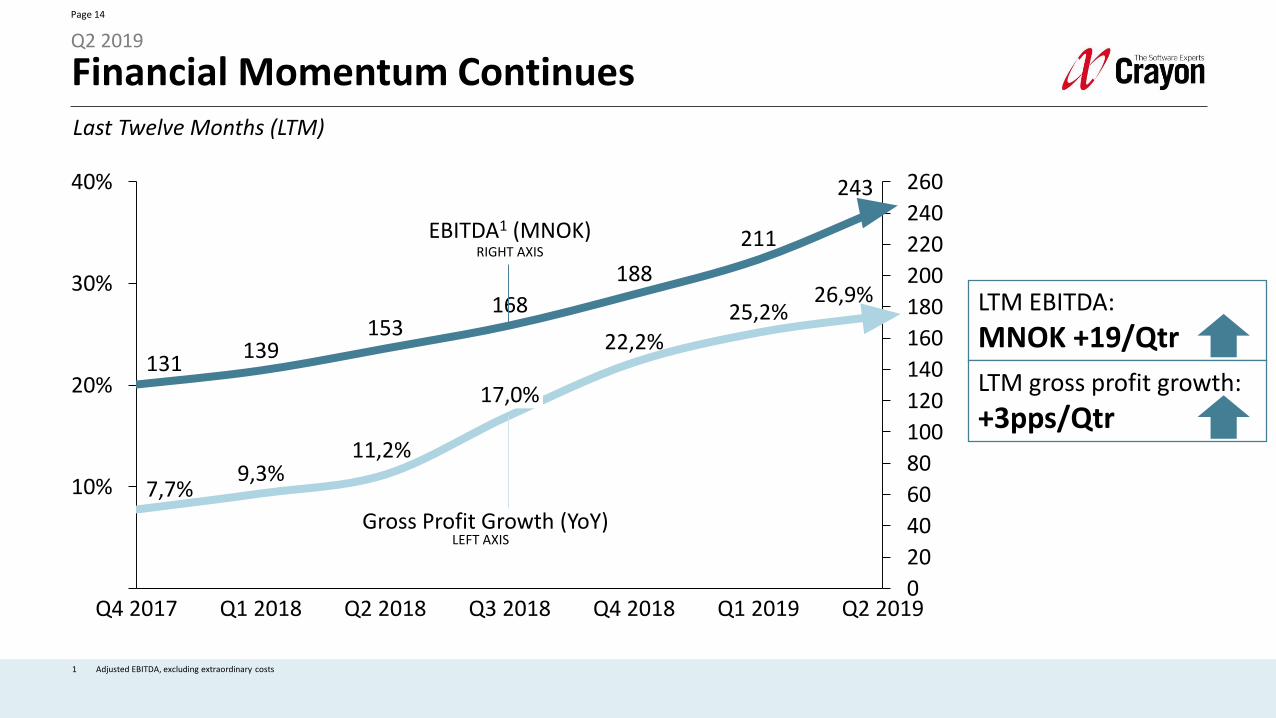
Financial Momentum Continues
120
180
20%
160
140
10%
20030%
40
0
40%
220
20
80
60
100
240
260
26,9%
Q1 2018
25,2%
7,7%
Q3 2018
13122,2%
Q4 2017
9,3%
139
11,2%
153
Q2 2018
17,0%
168
188
Q4 2018
211
Q1 2019 Q2 2019
243
Last Twelve Months (LTM)
Gross Profit Growth (YoY)
EBITDA1 (MNOK)
1 Adjusted EBITDA, excluding extraordinary costs
LTM EBITDA:
MNOK +19/Qtr
LTM gross profit growth:
+3pps/Qtr
LEFT AXIS
RIGHT AXIS
Q2 2019
Page 15
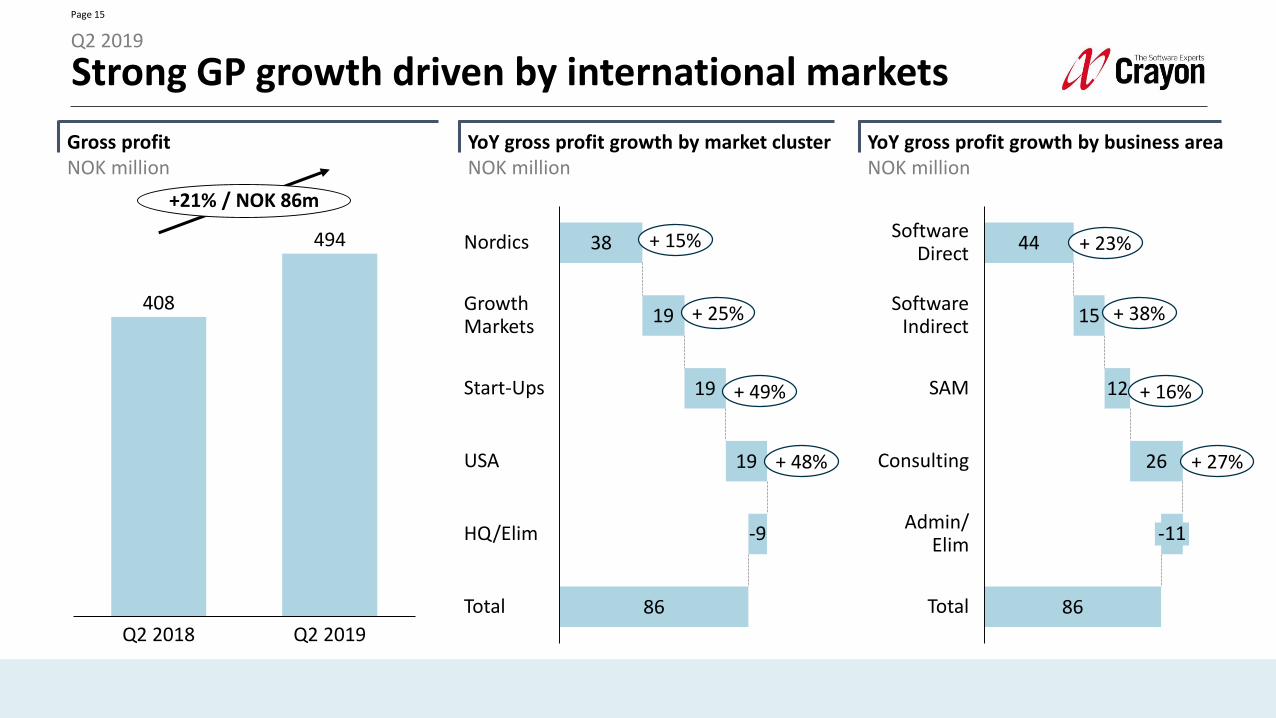
Strong GP growth driven by international marketsQ2 2019
Gross profitNOK million
YoY gross profit growth by market clusterNOK million
408
494
Q2 2019Q2 2018
+21% / NOK 86m
38
86
19
19
19
-9
USA
Total
Nordics
GrowthMarkets
Start-Ups
HQ/Elim
YoY gross profit growth by business areaNOK million
44
86
15
12
26
Total
SoftwareDirect
-11
SoftwareIndirect
SAM
Consulting
Admin/Elim
+ 15%
+ 25%
+ 49%
+ 48%
+ 23%
+ 38%
+ 16%
+ 27%
Page 16
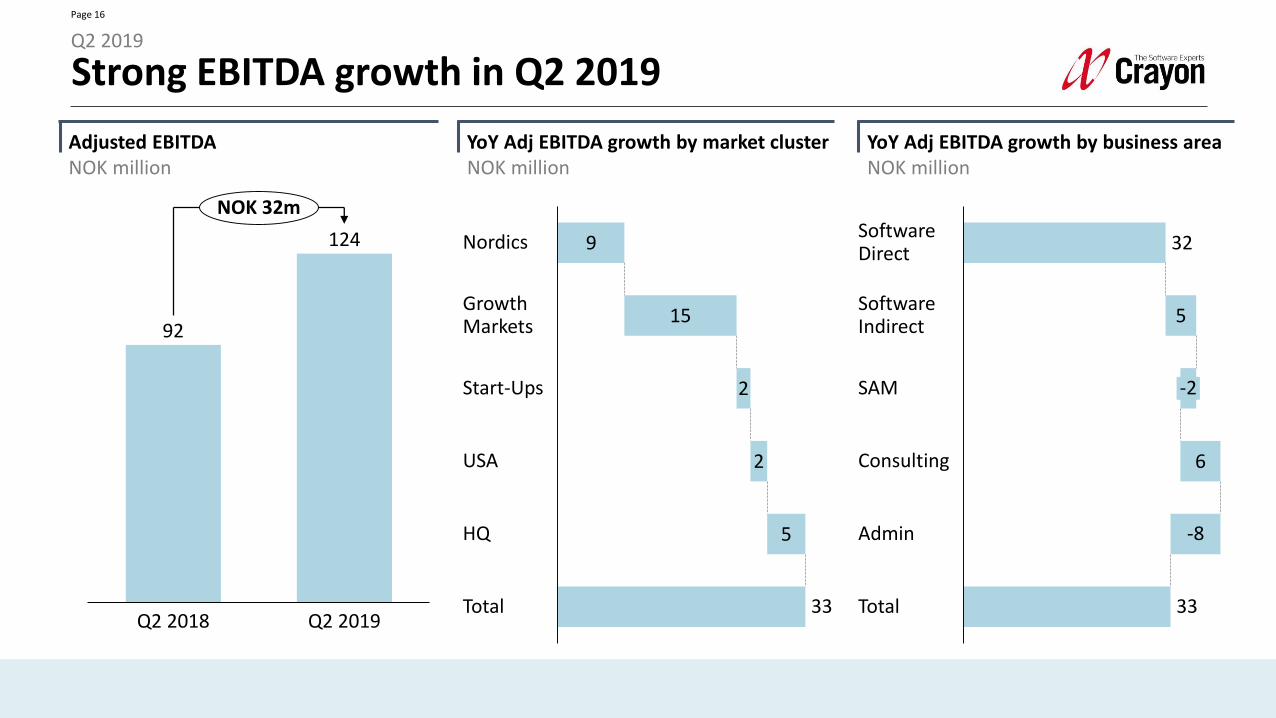
Strong EBITDA growth in Q2 2019Q2 2019
Adjusted EBITDANOK million
YoY Adj EBITDA growth by market clusterNOK million
92
124
Q2 2019Q2 2018
NOK 32m
9
15
2
2
5
Start-Ups
Nordics
GrowthMarkets
USA
HQ
Total 33
YoY Adj EBITDA growth by business areaNOK million
32
5
6Consulting
SoftwareDirect
Total
-8
SoftwareIndirect
-2SAM
Admin
33
Page 17
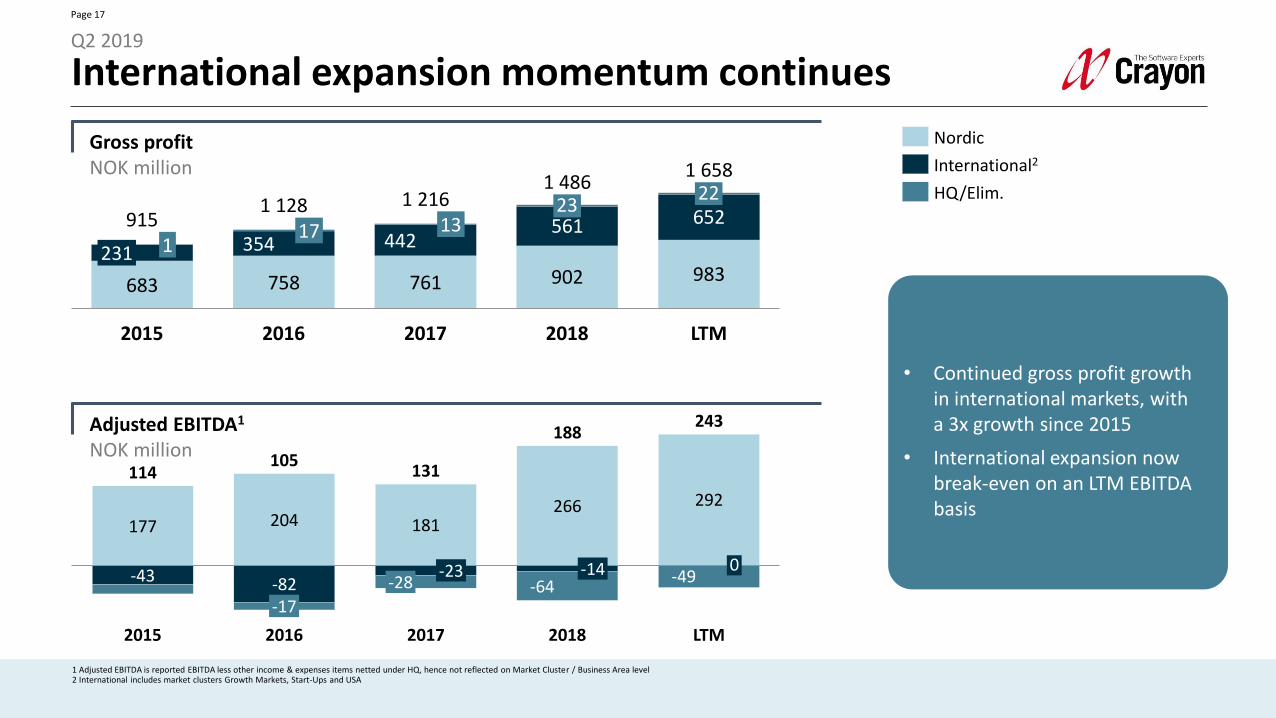
1 Adjusted EBITDA is reported EBITDA less other income & expenses items netted under HQ, hence not reflected on Market Cluster / Business Area level2 International includes market clusters Growth Markets, Start-Ups and USA
International expansion momentum continues
683 758 761 902 983
354 442561 652
2015
231 117
2322
2016
13
2017 2018 LTM
9151 128 1 216
1 4861 658
177 204 181266
-43 -82
292
-64-49
-17
2015
-23
2016
-14
2017
-28
2018
0
LTM
114105
131
188243
HQ/Elim.
Nordic
International2Gross profitNOK million
Adjusted EBITDA1
NOK million
• Continued gross profit growth in international markets, with a 3x growth since 2015
• International expansion now break-even on an LTM EBITDA basis
Q2 2019
Page 18
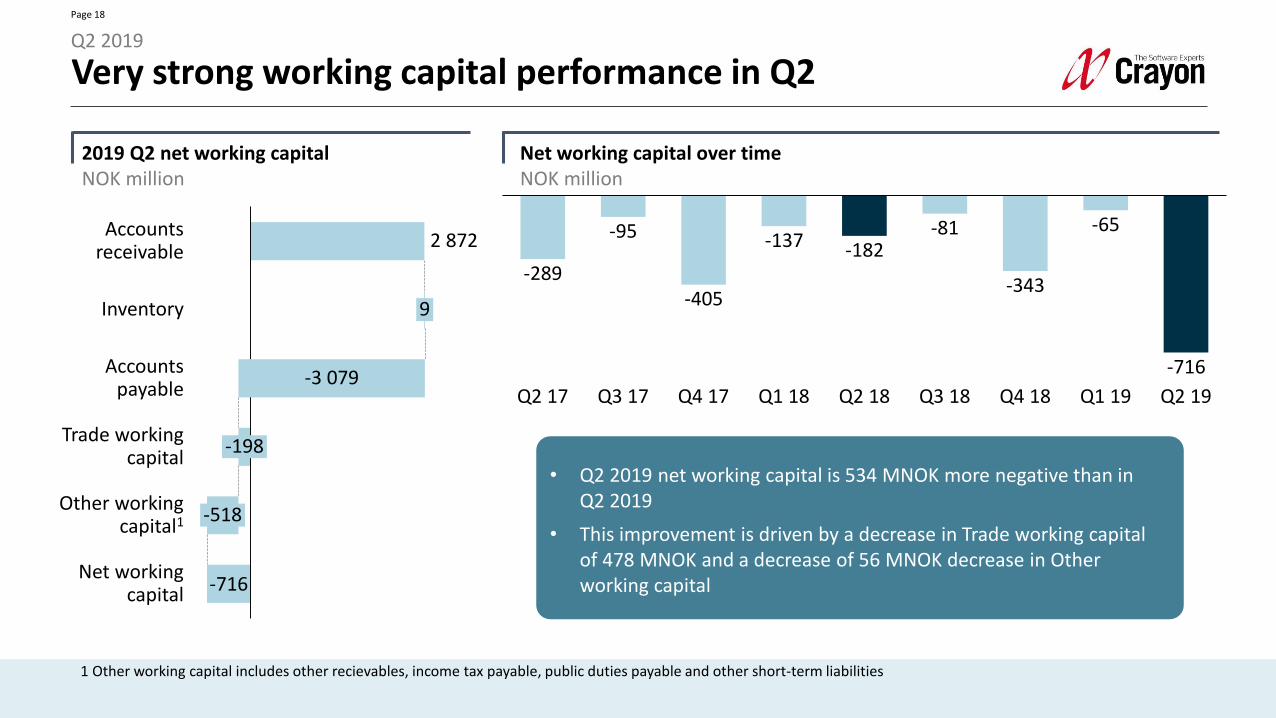
Very strong working capital performance in Q2Q2 2019
Net working capital over timeNOK million
• Q2 2019 net working capital is 534 MNOK more negative than in Q2 2019
• This improvement is driven by a decrease in Trade working capital of 478 MNOK and a decrease of 56 MNOK decrease in Other working capital
-289
-95
-405
-137 -182-81
-343
-65
-716
Q4 18Q2 18Q2 17 Q3 17 Q1 19Q4 17 Q3 18Q1 18 Q2 19
2019 Q2 net working capitalNOK million
-716
Accountsreceivable
Net workingcapital
Accountspayable
9
-3 079
-518
Inventory
-198Trade working
capital
Other workingcapital1
2 872
1 Other working capital includes other recievables, income tax payable, public duties payable and other short-term liabilities
Page 19
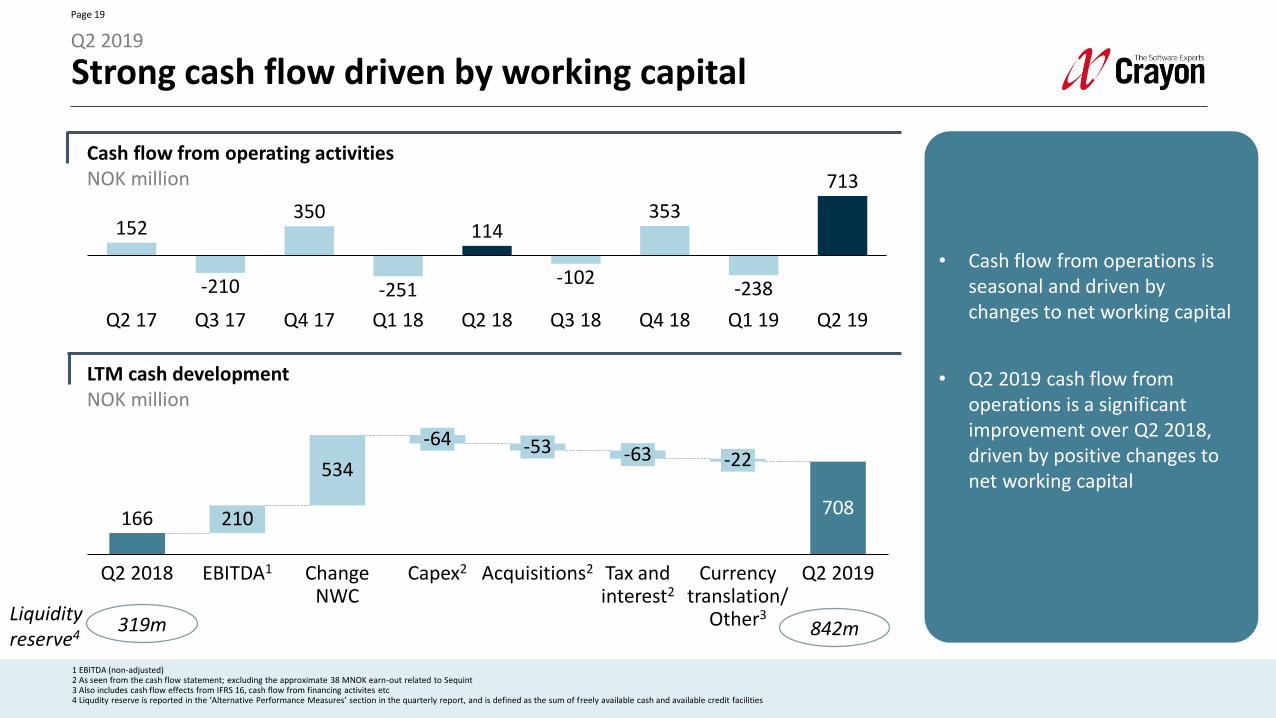
1 EBITDA (non-adjusted)2 As seen from the cash flow statement; excluding the approximate 38 MNOK earn-out related to Sequint3 Also includes cash flow effects from IFRS 16, cash flow from financing activites etc4 Liqudity reserve is reported in the ‘Alternative Performance Measures’ section in the quarterly report, and is defined as the sum of freely available cash and available credit facilities
Strong cash flow driven by working capitalQ2 2019
Cash flow from operating activitiesNOK million
• Cash flow from operations is seasonal and driven by changes to net working capital
• Q2 2019 cash flow from operations is a significant improvement over Q2 2018, driven by positive changes to net working capital
Q1 18Q2 17 Q3 18Q3 17
114
Q2 18Q4 17 Q4 18 Q1 19
350
Q2 19
152
-210 -102-251
353
-238
713
LTM cash developmentNOK million
-64
534
210
Q2 2018
-22
Change NWC
EBITDA1 Capex2
-53
Acquisitions2
-63
Tax and interest2
Currencytranslation/
Other3
708
Q2 2019
166
Liquidityreserve4 842m319m
Page 20
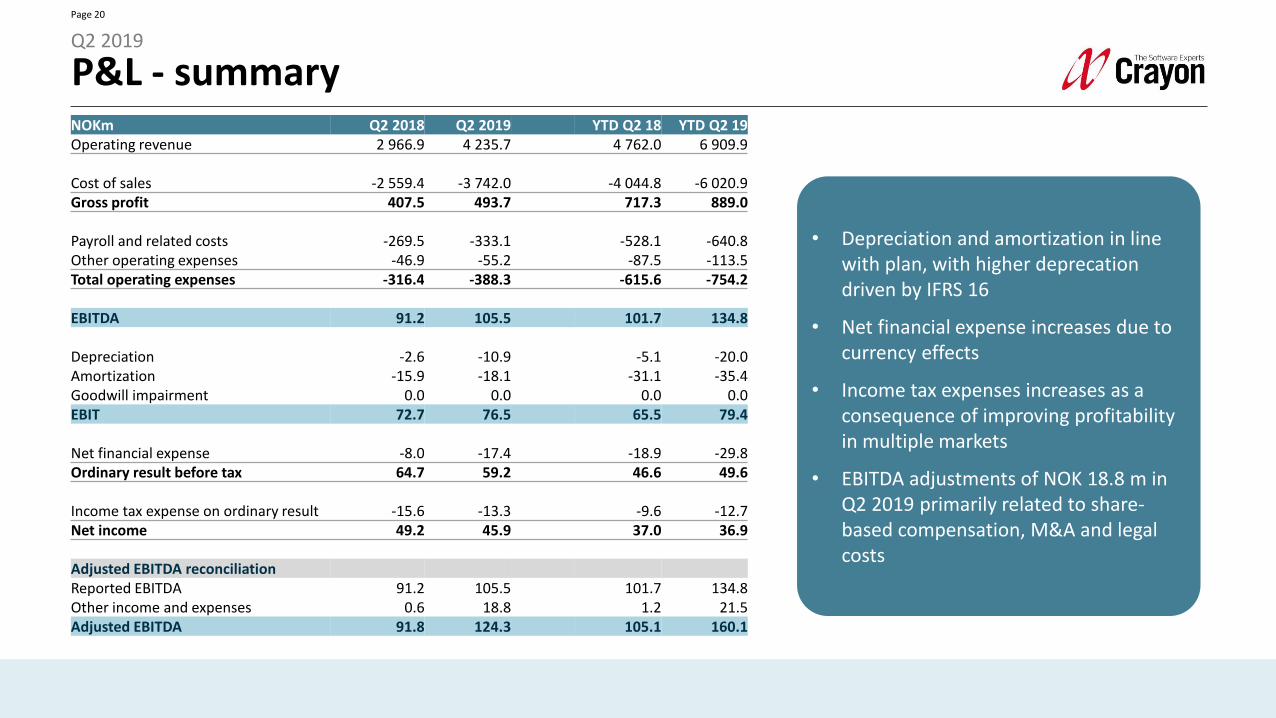
P&L - summaryQ2 2019
• Depreciation and amortization in line with plan, with higher deprecation driven by IFRS 16
• Net financial expense increases due to currency effects
• Income tax expenses increases as a consequence of improving profitability in multiple markets
• EBITDA adjustments of NOK 18.8 m in Q2 2019 primarily related to share-based compensation, M&A and legal costs
NOKm Q2 2018 Q2 2019 YTD Q2 18 YTD Q2 19Operating revenue 2 966.9 4 235.7 4 762.0 6 909.9
Cost of sales -2 559.4 -3 742.0 -4 044.8 -6 020.9Gross profit 407.5 493.7 717.3 889.0
Payroll and related costs -269.5 -333.1 -528.1 -640.8Other operating expenses -46.9 -55.2 -87.5 -113.5Total operating expenses -316.4 -388.3 -615.6 -754.2
EBITDA 91.2 105.5 101.7 134.8
Depreciation -2.6 -10.9 -5.1 -20.0Amortization -15.9 -18.1 -31.1 -35.4Goodwill impairment 0.0 0.0 0.0 0.0EBIT 72.7 76.5 65.5 79.4
Net financial expense -8.0 -17.4 -18.9 -29.8Ordinary result before tax 64.7 59.2 46.6 49.6
Income tax expense on ordinary result -15.6 -13.3 -9.6 -12.7Net income 49.2 45.9 37.0 36.9
Adjusted EBITDA reconciliationReported EBITDA 91.2 105.5 101.7 134.8Other income and expenses 0.6 18.8 1.2 21.5Adjusted EBITDA 91.8 124.3 105.1 160.1
Page 21
1 The Company reports its cash balance net of drawdown on its revolving credit facility (“RCF”)2 Approx. NOK 556m of goodwill as of year-end 2016 relates to the Oslo Stock Exchange delisting of Inmeta-Crayon in 20123 Note that bond transactional costs of around NOK 10m are capitalized , and accretion expensed over the lifetime of the bond, cf. IAS 39
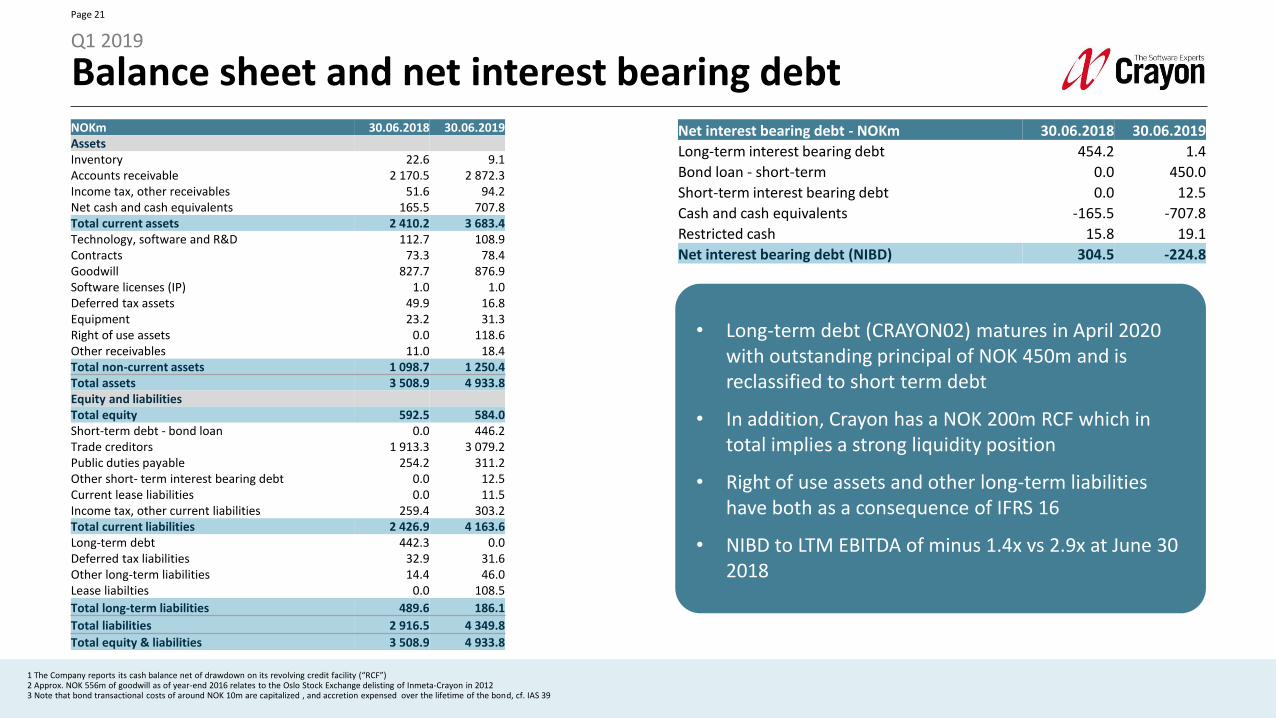
Balance sheet and net interest bearing debtQ1 2019
• Long-term debt (CRAYON02) matures in April 2020 with outstanding principal of NOK 450m and is reclassified to short term debt
• In addition, Crayon has a NOK 200m RCF which in total implies a strong liquidity position
• Right of use assets and other long-term liabilitieshave both as a consequence of IFRS 16
• NIBD to LTM EBITDA of minus 1.4x vs 2.9x at June 30 2018
Net interest bearing debt - NOKm 30.06.2018 30.06.2019
Long-term interest bearing debt 454.2 1.4
Bond loan - short-term 0.0 450.0
Short-term interest bearing debt 0.0 12.5
Cash and cash equivalents -165.5 -707.8
Restricted cash 15.8 19.1
Net interest bearing debt (NIBD) 304.5 -224.8
NOKm 30.06.2018 30.06.2019AssetsInventory 22.6 9.1Accounts receivable 2 170.5 2 872.3Income tax, other receivables 51.6 94.2Net cash and cash equivalents 165.5 707.8Total current assets 2 410.2 3 683.4Technology, software and R&D 112.7 108.9Contracts 73.3 78.4Goodwill 827.7 876.9Software licenses (IP) 1.0 1.0Deferred tax assets 49.9 16.8Equipment 23.2 31.3Right of use assets 0.0 118.6Other receivables 11.0 18.4Total non-current assets 1 098.7 1 250.4Total assets 3 508.9 4 933.8Equity and liabilitiesTotal equity 592.5 584.0Short-term debt - bond loan 0.0 446.2Trade creditors 1 913.3 3 079.2Public duties payable 254.2 311.2Other short- term interest bearing debt 0.0 12.5Current lease liabilities 0.0 11.5Income tax, other current liabilities 259.4 303.2Total current liabilities 2 426.9 4 163.6Long-term debt 442.3 0.0Deferred tax liabilities 32.9 31.6Other long-term liabilities 14.4 46.0Lease liabilties 0.0 108.5
Total long-term liabilities 489.6 186.1
Total liabilities 2 916.5 4 349.8
Total equity & liabilities 3 508.9 4 933.8

Page 22
1 AR = Accounts Receivable, AP = Accounts Payable
Cash flow developmentQ1 2019
• Q2 2019 cash flow from operations improved compared to Q2 2019, primarily driven by improved working capital
• Improvement in cash flow from financing driven by increase in long-term debt related to earn-out for Sequint acquistion
• Capex in Q2 2019 of NOK 15.1m mainly related to investments in new ERP system and Cloud IQ platform
• Acquisition of subsidiaries primarily relates to acquisition of Sequint and acquisition of minority shareholdings
NOKm Q2 2018 Q2 2019 YTD Q2 18 YTD Q2 19Net income before tax 64.7 59.2 46.6 49.6Taxes paid -6.4 -2.6 -13.0 -10.9Depreciation and amortization, incl. write-down 18.5 28.9 36.2 55.4Net interest to credit institutions 8.8 11.9 17.6 23.7Changes in inventory, AR/AP1 -127.1 534.6 -311.2 295.0Changes in other current assets 155.7 80.6 86.8 61.6Net cash flow from operating activities 114.2 712.5 -137.0 474.4
Net cash flow from financing activities -2.9 6.7 -12.6 -11.2
Acquisition of assets -14.3 -15.1 -32.5 -34.4Acquisition of subsidiaries -4.3 -80.7 -7.5 -91.6Divestments / Purchases of own shares / Other 0.0 0.0 0.0 0.0Net cash flow from investing activities -18.6 -95.8 -40.0 -126.0

Outlook

Page 24
Strong H1 and commercial momentum leads to increased FY2019 guidanceQ2 2019
Gross profit growth
Adjusted EBITDA as share of gross profit
NWC1
Capex
1 Average NWC last 4 quarters as share of gross profit last 4 quarters2 Adjusted EBITDA margin excluding IFRS 16 effects3 Application of IFRS 16 included in updated 2019 and medium term guidance; this accounts for approximately 2 perctange point improvement of EBITDA
+22.4 % +26.9 %+15-20 %+20-25%
+10-15 %Above market growth from scaling up internationalmarkets
12.6 %14.7%
[13.7 %2]13-14 %16-17%3
Graduallyincrease to 17%3 15%
Continued margin improvement, driven by International markets
-12.5 % -18.2% -10% to -15% -10% to -15%Expect NWC to fluctuatearound current level
NOK 62 mn NOK 64 mn NOK ~60 mn NOK ~60 mnContinued investments in platforms and IP
2018 actuals LTM actuals 2019 outlook Medium term Comment
INCLUDES IFRS 16 EFFECTS

Q&A session
Page 26
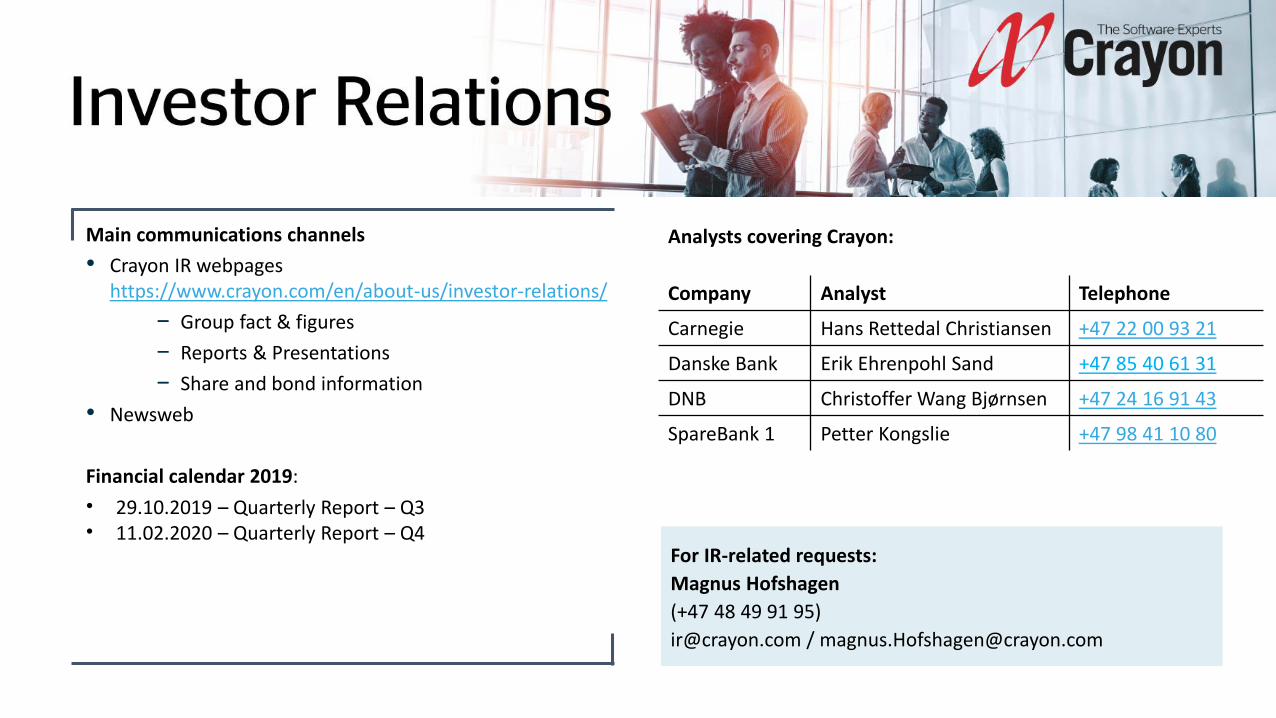
Investor Relations
For IR-related requests:
Magnus Hofshagen
(+47 48 49 91 95)
[email protected] / [email protected]
Main communications channels
• Crayon IR webpages https://www.crayon.com/en/about-us/investor-relations/
− Group fact & figures
− Reports & Presentations
− Share and bond information
• Newsweb
Financial calendar 2019:
• 29.10.2019 – Quarterly Report – Q3• 11.02.2020 – Quarterly Report – Q4
Company Analyst Telephone
Carnegie Hans Rettedal Christiansen +47 22 00 93 21
Danske Bank Erik Ehrenpohl Sand +47 85 40 61 31
DNB Christoffer Wang Bjørnsen +47 24 16 91 43
SpareBank 1 Petter Kongslie +47 98 41 10 80
Analysts covering Crayon:

Data pack available at crayon.com

Appendix
28
Page 29
Source: Annual Report 2015, 2016 and 20171 In direct billing, Crayon invoices the customer directly. In indirect billing, the software vendor bills the customer and Crayon receives a fee from the software vendor
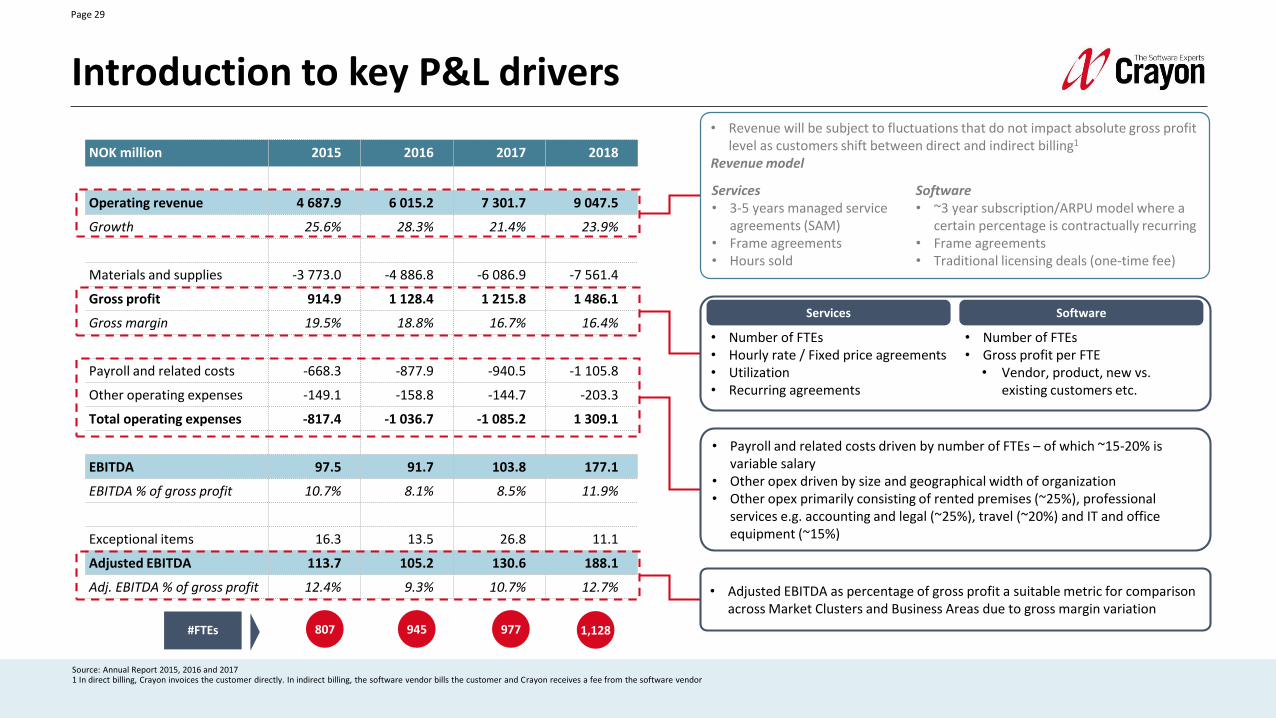
Introduction to key P&L drivers
NOK million 2015 2016 2017 2018
Operating revenue 4 687.9 6 015.2 7 301.7 9 047.5
Growth 25.6% 28.3% 21.4% 23.9%
Materials and supplies -3 773.0 -4 886.8 -6 086.9 -7 561.4
Gross profit 914.9 1 128.4 1 215.8 1 486.1
Gross margin 19.5% 18.8% 16.7% 16.4%
Payroll and related costs -668.3 -877.9 -940.5 -1 105.8
Other operating expenses -149.1 -158.8 -144.7 -203.3
Total operating expenses -817.4 -1 036.7 -1 085.2 1 309.1
EBITDA 97.5 91.7 103.8 177.1
EBITDA % of gross profit 10.7% 8.1% 8.5% 11.9%
Exceptional items 16.3 13.5 26.8 11.1
Adjusted EBITDA 113.7 105.2 130.6 188.1
Adj. EBITDA % of gross profit 12.4% 9.3% 10.7% 12.7%
807 945#FTEs
• Payroll and related costs driven by number of FTEs – of which ~15-20% is variable salary
• Other opex driven by size and geographical width of organization• Other opex primarily consisting of rented premises (~25%), professional
services e.g. accounting and legal (~25%), travel (~20%) and IT and office equipment (~15%)
• Adjusted EBITDA as percentage of gross profit a suitable metric for comparison across Market Clusters and Business Areas due to gross margin variation
• Number of FTEs• Hourly rate / Fixed price agreements• Utilization• Recurring agreements
Services Software
• Number of FTEs• Gross profit per FTE
• Vendor, product, new vs. existing customers etc.
• Revenue will be subject to fluctuations that do not impact absolute gross profit level as customers shift between direct and indirect billing1
Revenue model
Services• 3-5 years managed service
agreements (SAM) • Frame agreements• Hours sold
Software• ~3 year subscription/ARPU model where a
certain percentage is contractually recurring• Frame agreements• Traditional licensing deals (one-time fee)
977 1,128
Page 30
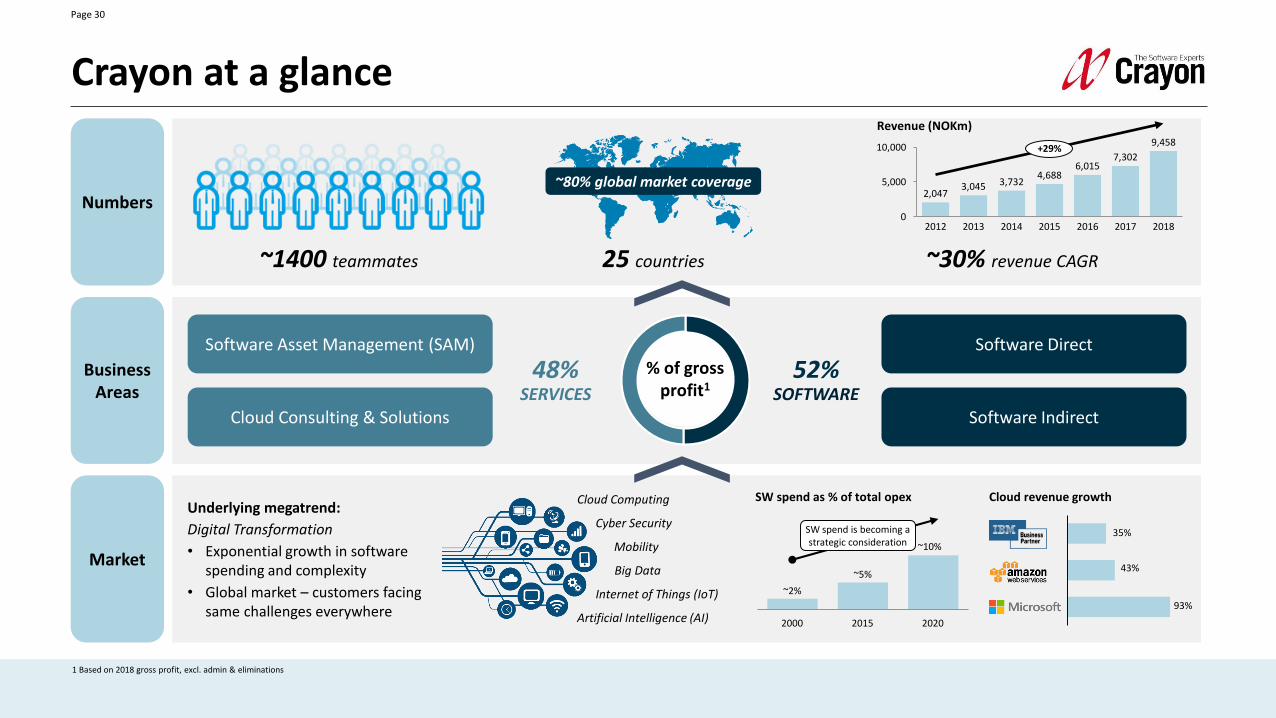
~1400 teammates 25 countries
10,000
5,000
020172014
2,047
4,688
2015
Revenue (NOKm)
2013 20162012 2018
3,045 3,732
6,0157,302
9,458+29%
~30% revenue CAGR
~80% global market coverage
48%SERVICES
52%SOFTWARE
% of gross profit1
1 Based on 2018 gross profit, excl. admin & eliminations
Crayon at a glance
Underlying megatrend:
Digital Transformation
• Exponential growth in software spending and complexity
• Global market – customers facing same challenges everywhere
Internet of Things (IoT)
Artificial Intelligence (AI)
Mobility
Big Data
Cyber Security
Cloud Computing
Software Asset Management (SAM)
Cloud Consulting & Solutions
Software Direct
Software Indirect
35%
43%
93%
Cloud revenue growth
~5%
2000 2015 2020
~2%
~10%
SW spend as % of total opex
SW spend is becoming a strategic consideration
Numbers
BusinessAreas
Market

Page 31
Offering and value proposition
1 Based on share of gross profit 2018
Crayon – a fast growing global software and services expert
• Founded in 2002 with headquarters in Oslo, Norway
• Publicly listed company in 2017
• ~1,400 employees and ~9,000 customers of which more than 40% public1
• Strategic partnerships with the largest software vendors globally
• Extensive IP portfolio yielding competitive advantages
• Presence in 25 countries covering 80% of addressable market
• Revenues of NOK 9.5bn with high growth and strong cash conversion
Company at a glance An international growth story with strengthening momentum
636 675981
20082006 2007
3,732
2009 20152010 20122011 2013 2014 2016 2017 2018
1,0981,481
6,015
1,6602,047
3,045
4,688
7,302
9,048
+22%
+28%
• Helps customers to optimize software costs and reduce complexity
• Customers save ~15-30% of software cost
• Customers benefit from Crayon’s global position and value-add end-to-end services along the software value chain
Software
Services
Crayon is a trusted advisor for customers in their digital transformation journey
Revenue, NOK million
Country locations of Crayon customersCrayon HQ (Oslo, Norway)Crayon locations
80%Addressable
software market
Page 32
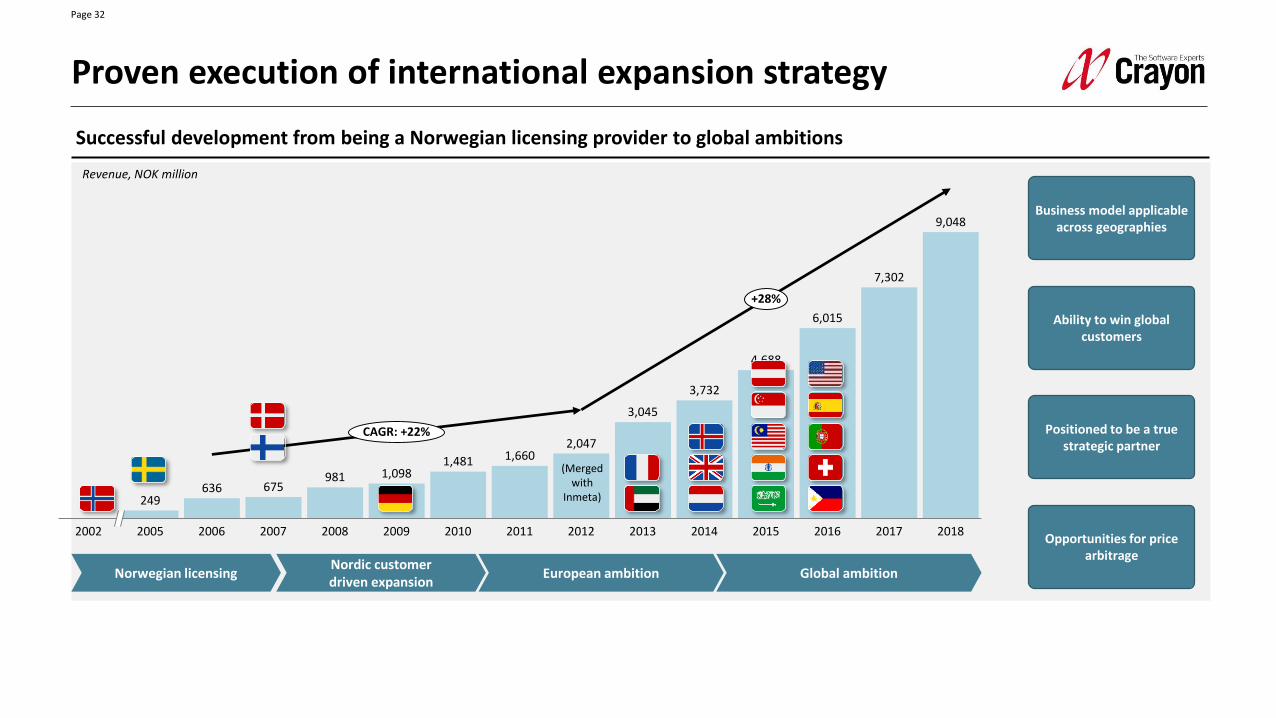
Successful development from being a Norwegian licensing provider to global ambitions
Proven execution of international expansion strategy
249636 675
981
2014
3,732
1,481
2002 2005 201120102006 2009
4,688
2007 2008 2012
3,045
2015 2016
9,048
2017 2018
6,015
1,660
1,098
2,047
7,302
2013
CAGR: +22%
+28%
Norwegian licensingNordic customer driven expansion
European ambition Global ambition
(Merged with
Inmeta)
Revenue, NOK million
Opportunities for price arbitrage
Ability to win global customers
Positioned to be a true strategic partner
Business model applicable across geographies
Page 33
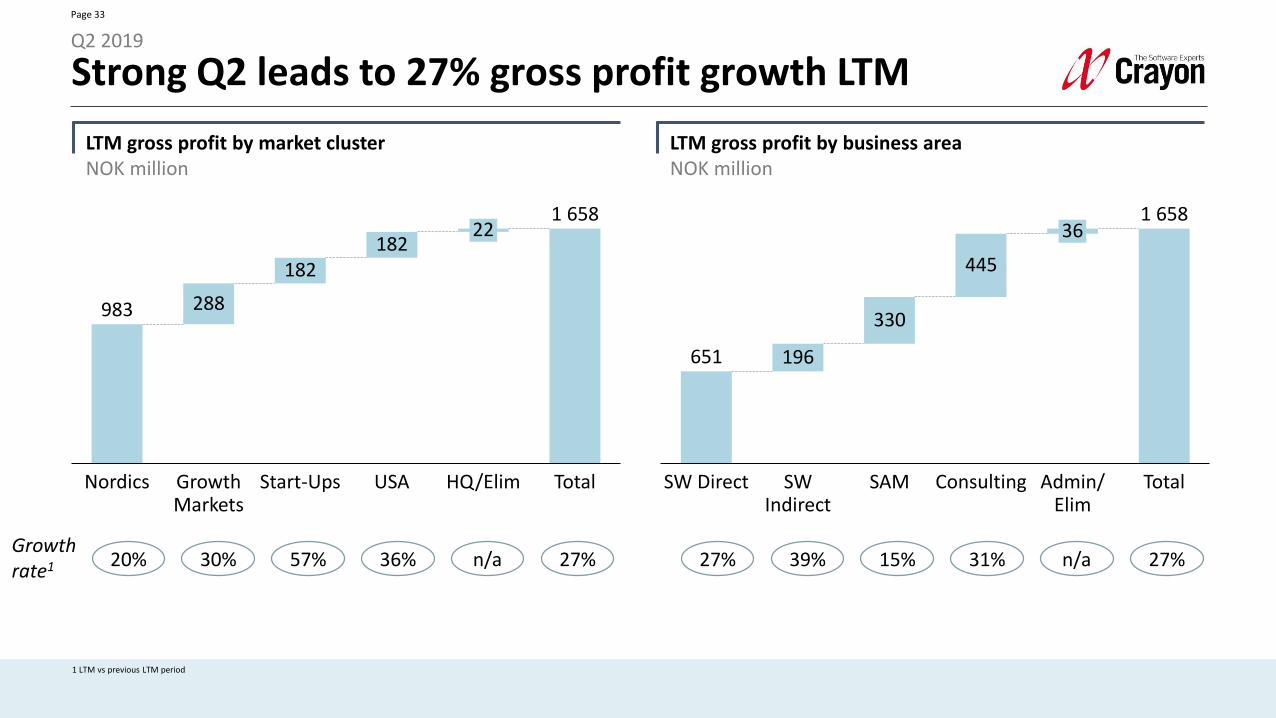
1 LTM vs previous LTM period
Strong Q2 leads to 27% gross profit growth LTM
LTM gross profit by market clusterNOK million
TotalGrowth Markets
22
Nordics
182
288
182
Start-Ups USA HQ/Elim
1 658
983
LTM gross profit by business areaNOK million
20% 30% 57%Growth rate1 36% 27%n/a
330
36
SW Direct
196
SW Indirect
ConsultingSAM
445
Admin/Elim
Total
651
1 658
27% 39% 15% 31% 27%n/a
Q2 2019

Page 34
1 Adjusted EBITDA as share of Gross Profit2 LTM vs previous LTM period
LTM Adjusted EBITDA of NOK 243 million
LTM adjusted EBITDA by market clusterNOK million
Nordics
-430
-49
Growth Markets
-25
USAStart-Ups HQ/Elim Total
292
243
LTM adjusted EBITDA by business areaNOK million
30% 10% -2%EBITDA margin1 -14% 14.7%n/a
SW Direct
13
80
243
SW Indirect
ConsultingSAM
71
-216
Admin/Elim
Total
296
45% 41% 4% 16% 14.7%n/a
Q2 2019
Change in EBITDA margin2
+2.1 pp +10 pp +8.9 pp -1.6 pp +3.6ppn/a +3.7 pp +6.6 pp -3.2 pp +3.7 pp +3.6 ppn/a
Page 35
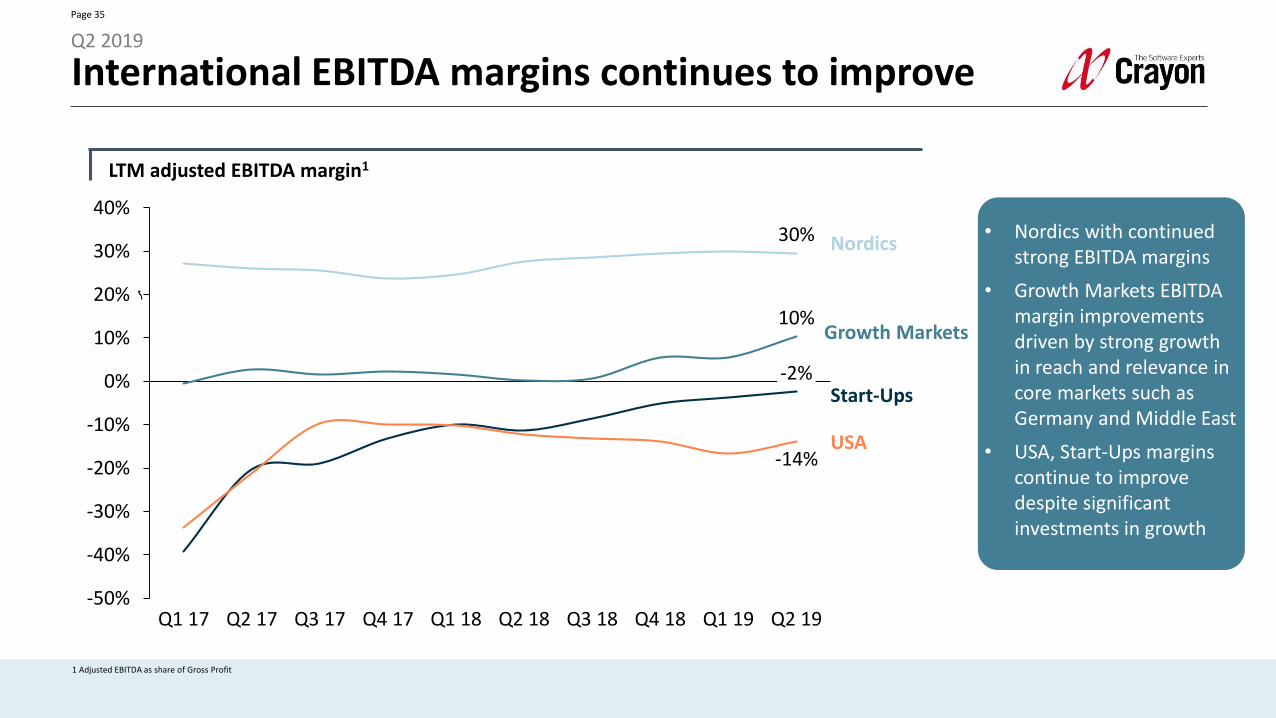
1 Adjusted EBITDA as share of Gross Profit
International EBITDA margins continues to improve
LTM adjusted EBITDA margin1
• Nordics with continued strong EBITDA margins
• Growth Markets EBITDA margin improvements driven by strong growth in reach and relevance in core markets such as Germany and Middle East
• USA, Start-Ups margins continue to improve despite significant investments in growth
-50%
-40%
-30%
-20%
-10%
0%
10%
20%
30%
40%
Q2 17Q1 17
-14%
Q3 18Q1 18Q3 17
10%
Q4 17 Q2 18 Q4 18 Q1 19 Q2 19
30%
-2%
Nordics
Growth Markets
USA
Start-Ups
Q2 2019
Page 36
1 Management estimate based on Microsoft revenue numbers for LSP 2 Intellectual Property (i.e., bespoke products, systems, tools etc.)
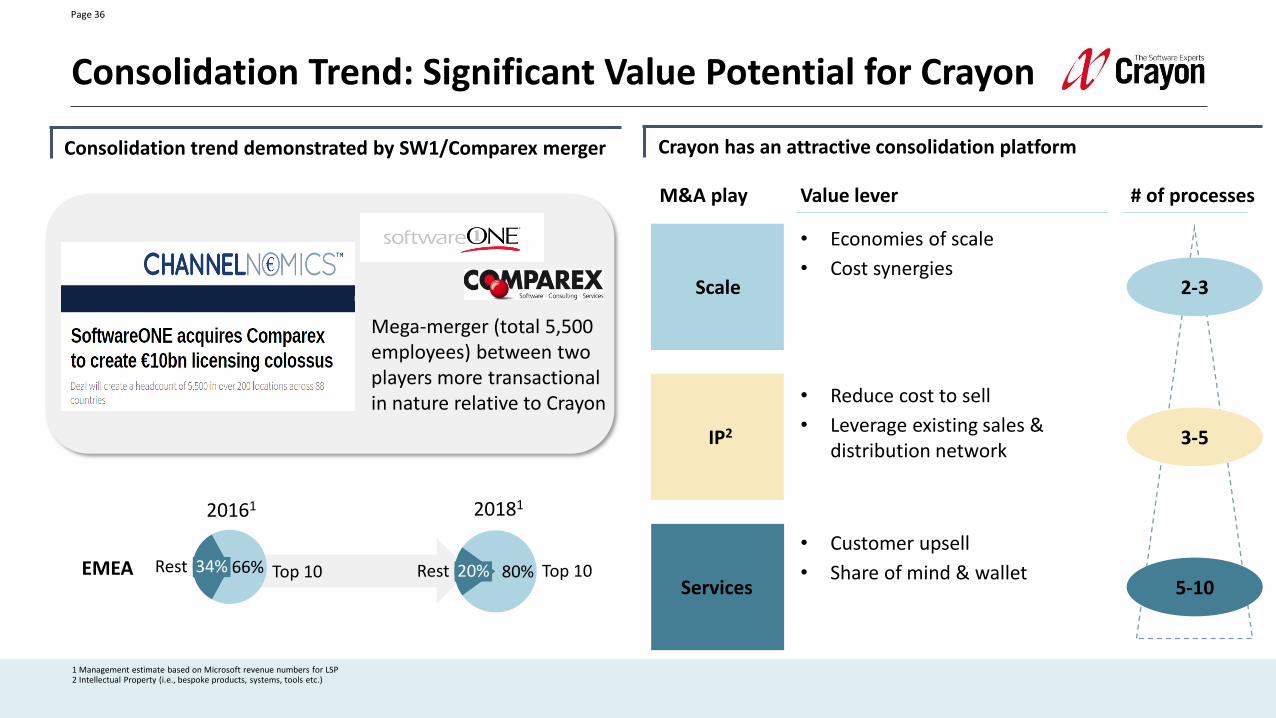
Consolidation Trend: Significant Value Potential for Crayon
Scale
IP2
Crayon has an attractive consolidation platformConsolidation trend demonstrated by SW1/Comparex merger
• Customer upsell
• Share of mind & wallet
• Reduce cost to sell
• Leverage existing sales & distribution network
5-10
3-5
2-3
66% Top 1034%Rest 80% Top 1020%RestEMEA
20161 20181
Mega-merger (total 5,500 employees) between two players more transactional in nature relative to Crayon
Value lever # of processesM&A play
• Economies of scale
• Cost synergies
Services
Page 37
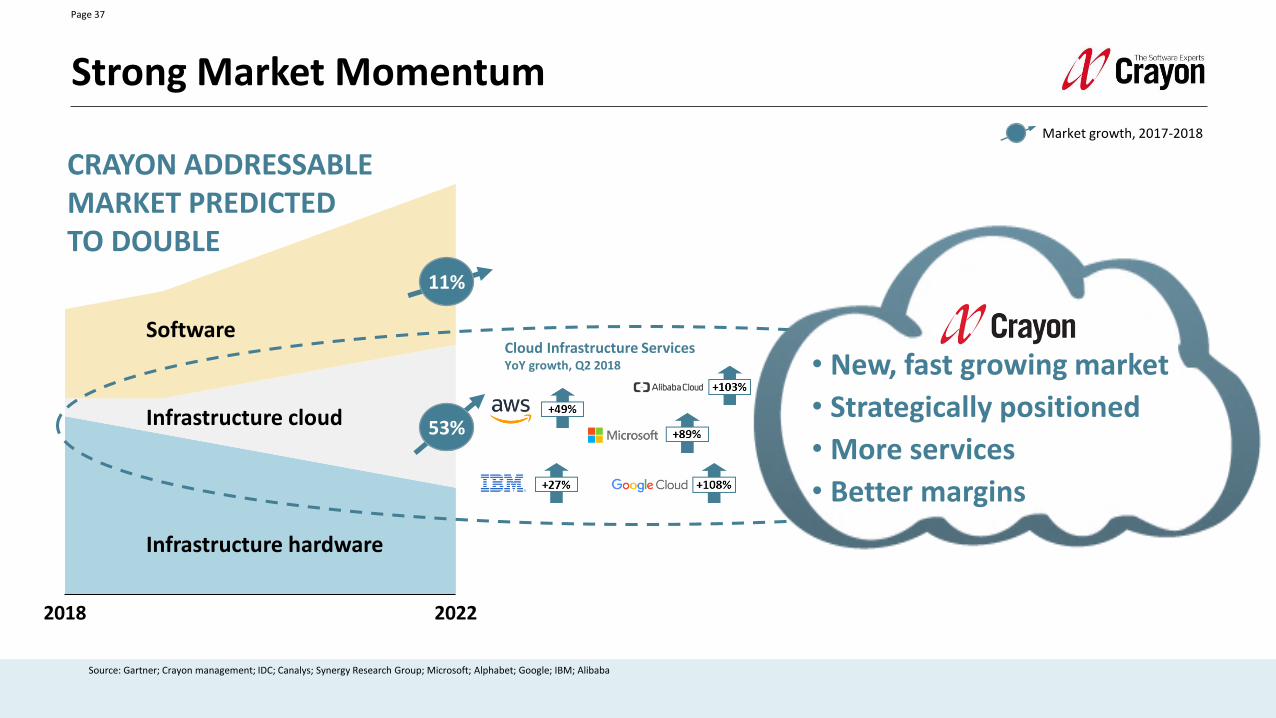
Source: Gartner; Crayon management; IDC; Canalys; Synergy Research Group; Microsoft; Alphabet; Google; IBM; Alibaba
2018 2022
Software
Infrastructure cloud
Infrastructure hardware
Cloud Infrastructure Services YoY growth, Q2 2018
Strong Market Momentum
CRAYON ADDRESSABLE MARKET PREDICTED TO DOUBLE
Market growth, 2017-2018
11%
53%
• New, fast growing market
• Strategically positioned
• More services
• Better margins
~15%~85%
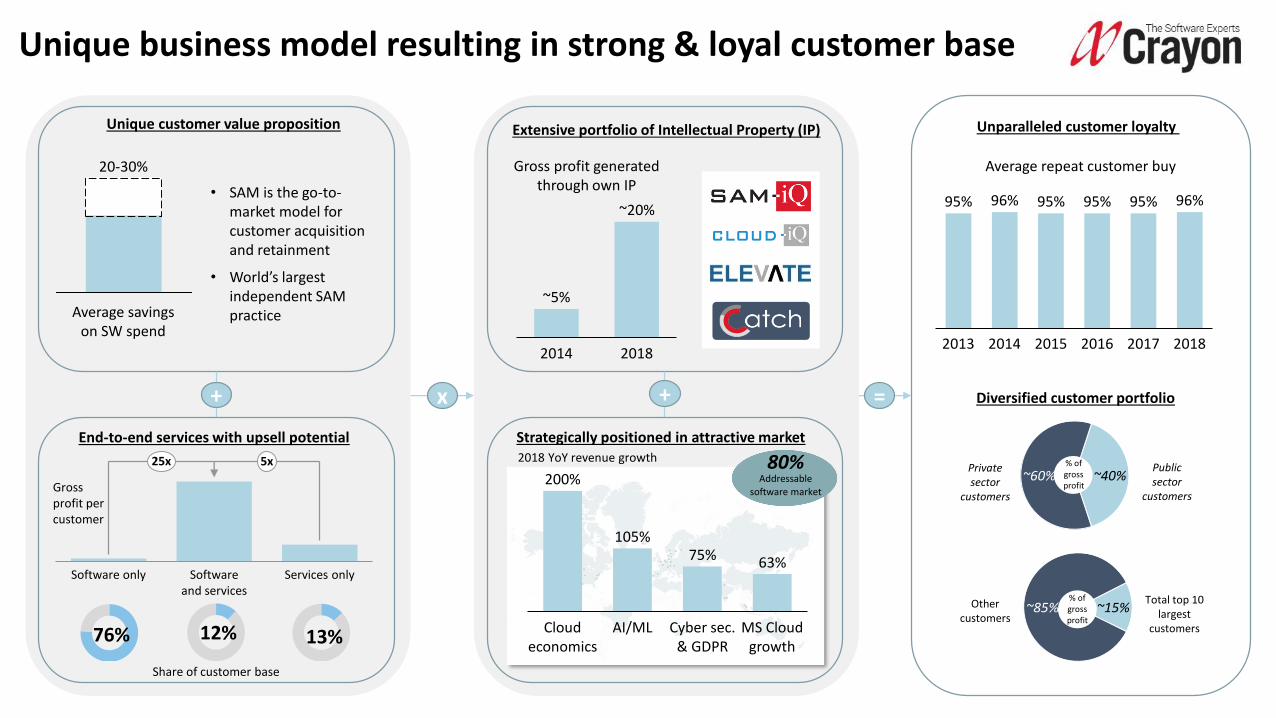
Unique business model resulting in strong & loyal customer base
x
=++ x
Unique customer value proposition
Average savings on SW spend
20-30%
• SAM is the go-to-market model for customer acquisition and retainment
• World’s largest independent SAM practice
~20%
~5%
2014 2018
Gross profit generated through own IP
Cloud economics
AI/ML
200%
Cyber sec. & GDPR
MS Cloud growth
105%75% 63%
Strategically positioned in attractive market
80%Addressable
software market
2018 YoY revenue growth
Extensive portfolio of Intellectual Property (IP)
End-to-end services with upsell potential
Services onlySoftware only Software and services
25x 5x
76% 12% 13%
Share of customer base
Unparalleled customer loyalty
~40%~60%% of gross profit
Public sector
customers
Private sector
customers
Diversified customer portfolio
95%
20142013 2015 2016
96%
2017 2018
95% 95% 95% 96%
Gross profit per customer
Average repeat customer buy
% of gross profit
Total top 10 largest
customers
Other customers
Page 39
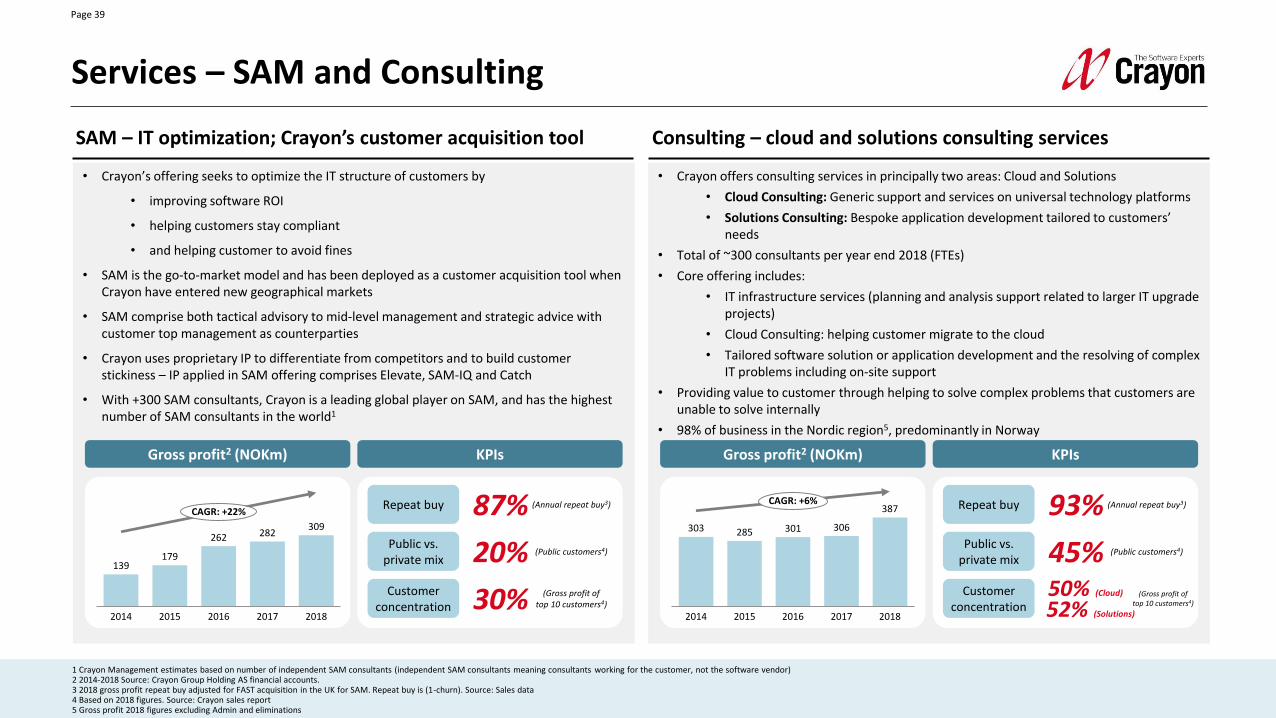
1 Crayon Management estimates based on number of independent SAM consultants (independent SAM consultants meaning consultants working for the customer, not the software vendor)2 2014-2018 Source: Crayon Group Holding AS financial accounts. 3 2018 gross profit repeat buy adjusted for FAST acquisition in the UK for SAM. Repeat buy is (1-churn). Source: Sales data4 Based on 2018 figures. Source: Crayon sales report5 Gross profit 2018 figures excluding Admin and eliminations
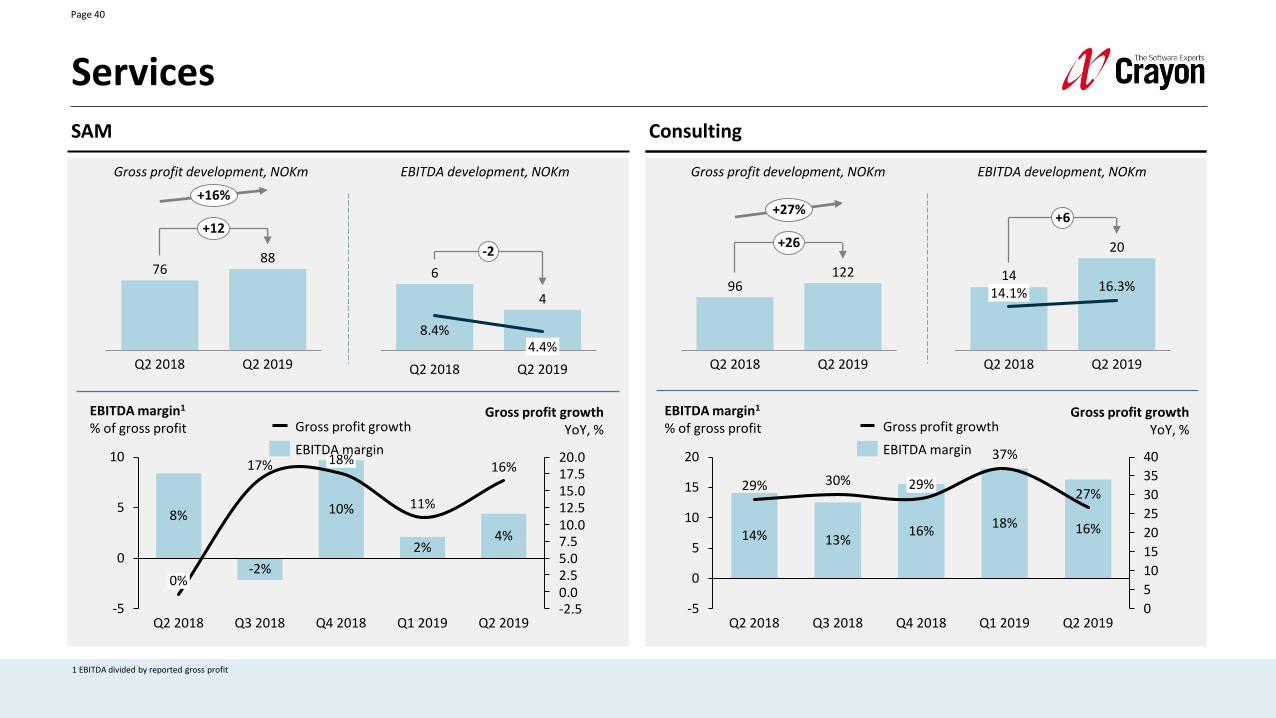
Services – SAM and Consulting
Consulting – cloud and solutions consulting servicesSAM – IT optimization; Crayon’s customer acquisition tool
• Crayon’s offering seeks to optimize the IT structure of customers by
• improving software ROI
• helping customers stay compliant
• and helping customer to avoid fines
• SAM is the go-to-market model and has been deployed as a customer acquisition tool when Crayon have entered new geographical markets
• SAM comprise both tactical advisory to mid-level management and strategic advice with customer top management as counterparties
• Crayon uses proprietary IP to differentiate from competitors and to build customer stickiness – IP applied in SAM offering comprises Elevate, SAM-IQ and Catch
• With +300 SAM consultants, Crayon is a leading global player on SAM, and has the highest number of SAM consultants in the world1
Gross profit2 (NOKm) KPIs
Repeat buy
Public vs. private mix
Customer concentration
87% (Annual repeat buy3)
20% (Public customers4)
30% (Gross profit of top 10 customers4)
179
2014 2015 2016
139
20182017
262 282309
CAGR: +22%
• Crayon offers consulting services in principally two areas: Cloud and Solutions
• Cloud Consulting: Generic support and services on universal technology platforms
• Solutions Consulting: Bespoke application development tailored to customers’ needs
• Total of ~300 consultants per year end 2018 (FTEs)
• Core offering includes:
• IT infrastructure services (planning and analysis support related to larger IT upgrade projects)
• Cloud Consulting: helping customer migrate to the cloud
• Tailored software solution or application development and the resolving of complex IT problems including on-site support
• Providing value to customer through helping to solve complex problems that customers are unable to solve internally
• 98% of business in the Nordic region5, predominantly in Norway
Gross profit2 (NOKm) KPIs
Repeat buy
Public vs. private mix
Customer concentration
93% (Annual repeat buy3)
45% (Public customers4)
2014 20172015
301
2016
303
2018
285 306
387CAGR: +6%
50% (Cloud)
52% (Solutions)
(Gross profit of top 10 customers4)
Page 40
Gross profit development, NOKm EBITDA development, NOKm
1 EBITDA divided by reported gross profit
ServicesSAM
Q2 2018 Q2 2019
7688
+12
+16%
Q2 2018
8.4%
6
4.4%
Q2 2019
4
-2
Consulting
Q2 2018 Q2 2019
96122
+26
+27%
14.1%
Q2 2018
16.3%
Q2 2019
14
20
+6
-5
0
5
10
12.5
-2.50.02.55.07.510.0
15.017.520.0
Q2 2018
EBITDA margin1
% of gross profit
Q1 2019
Gross profit growthYoY, %
0%
18%
8%
17%
-2%
Q3 2018
4%2%
10%
Q4 2018
11%
Q2 2019
16%EBITDA margin
Gross profit growth
0
5
10
15
20
25
30
35
40
-5
0
5
10
15
20
27%
EBITDA margin1
% of gross profitGross profit growth
YoY, %
29%
Q1 2019
18%
Q2 2018
14%
30%
13%
Q3 2018
29%
16%
Q4 2018
37%
Q2 2019
16%
Gross profit growth
EBITDA margin
Gross profit development, NOKm EBITDA development, NOKm
Page 41
1 2014-2018 Source: Crayon Group Holding AS financial accounts2 2018 gross profit repeat buy. Repeat buy is (1-churn). Source: Sales data3 Based on 2018 figures. Source: Crayon sales report4 Crayon direct billing of Microsoft’s share of gross profit. Based on 2018 figures. Source: Crayon sales report
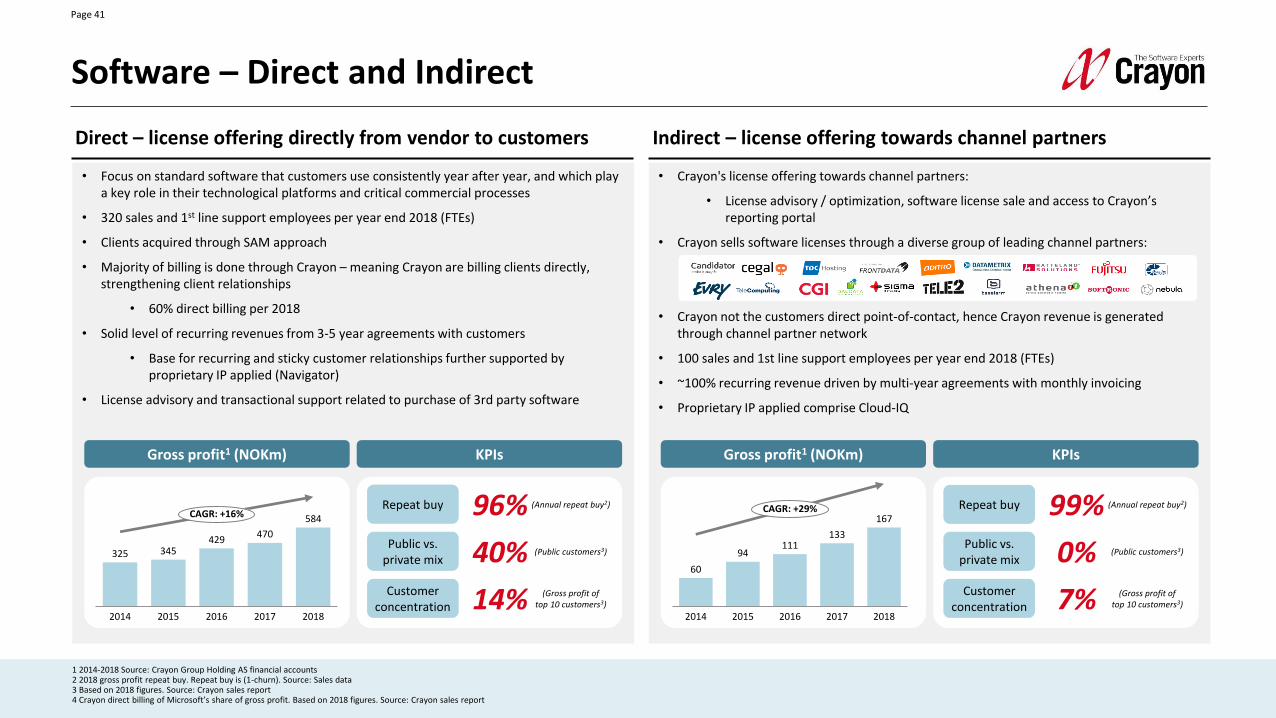
Software – Direct and Indirect
Indirect – license offering towards channel partnersDirect – license offering directly from vendor to customers
• Focus on standard software that customers use consistently year after year, and which play a key role in their technological platforms and critical commercial processes
• 320 sales and 1st line support employees per year end 2018 (FTEs)
• Clients acquired through SAM approach
• Majority of billing is done through Crayon – meaning Crayon are billing clients directly, strengthening client relationships
• 60% direct billing per 2018
• Solid level of recurring revenues from 3-5 year agreements with customers
• Base for recurring and sticky customer relationships further supported by proprietary IP applied (Navigator)
• License advisory and transactional support related to purchase of 3rd party software
Gross profit1 (NOKm) KPIs
Repeat buy
Public vs. private mix
Customer concentration
96% (Annual repeat buy2)
40% (Public customers3)
14% (Gross profit of top 10 customers3)
20172015
325
2014 2016 2018
345429
470
584CAGR: +16%
• Crayon's license offering towards channel partners:
• License advisory / optimization, software license sale and access to Crayon’s reporting portal
• Crayon sells software licenses through a diverse group of leading channel partners:
• Crayon not the customers direct point-of-contact, hence Crayon revenue is generated through channel partner network
• 100 sales and 1st line support employees per year end 2018 (FTEs)
• ~100% recurring revenue driven by multi-year agreements with monthly invoicing
• Proprietary IP applied comprise Cloud-IQ
Gross profit1 (NOKm) KPIs
Repeat buy
Public vs. private mix
Customer concentration
99% (Annual repeat buy2)
0% (Public customers3)
20172014 2015 2016
60
2018
94111
133
167CAGR: +29%
7% (Gross profit of top 10 customers3)

Page 42
1 EBITDA divided by reported gross profit
SoftwareSoftware Direct
Gross profit development, NOKm EBITDA development, NOKm
Software Indirect
Gross profit development, NOKm EBITDA development, NOKm
40.9%
Q2 2019Q2 2018
38.4%
16
21
+5
Q2 2018 Q2 2019
4055
+38%
+15
Q2 2019Q2 2018
188231
+23%
+44
56.9%
139
Q2 2018
59.9%
Q2 2019
107
+32
0
10
20
30
40
50
0
10
20
30
40
50
60
70
80
23%
37%
EBITDA margin1
% of gross profitGross profit growth
YoY, %
13%
57%
Q2 2018
47%
16%
Q3 2018 Q2 2019Q1 2019
28%
Q4 2018
48%
21%
60%
Gross profit growth
EBITDA margin
0
10
20
30
40
50
0
10
20
30
40
50
60
70
80
41%
Gross profit growthYoY, %
Q2 2018
EBITDA margin1
% of gross profit
Q1 2019
38%45%
13%43%
Q3 2018 Q4 2018
34%
41%
40%
42%
Q2 2019
38%
Gross profit growth
EBITDA margin
Page 43
Source: Sales reports1 Based on end of 2018 data2 Based on 2018 gross profit3 ~25% of total revenue relates to use of Crayon’s own IP portfolio
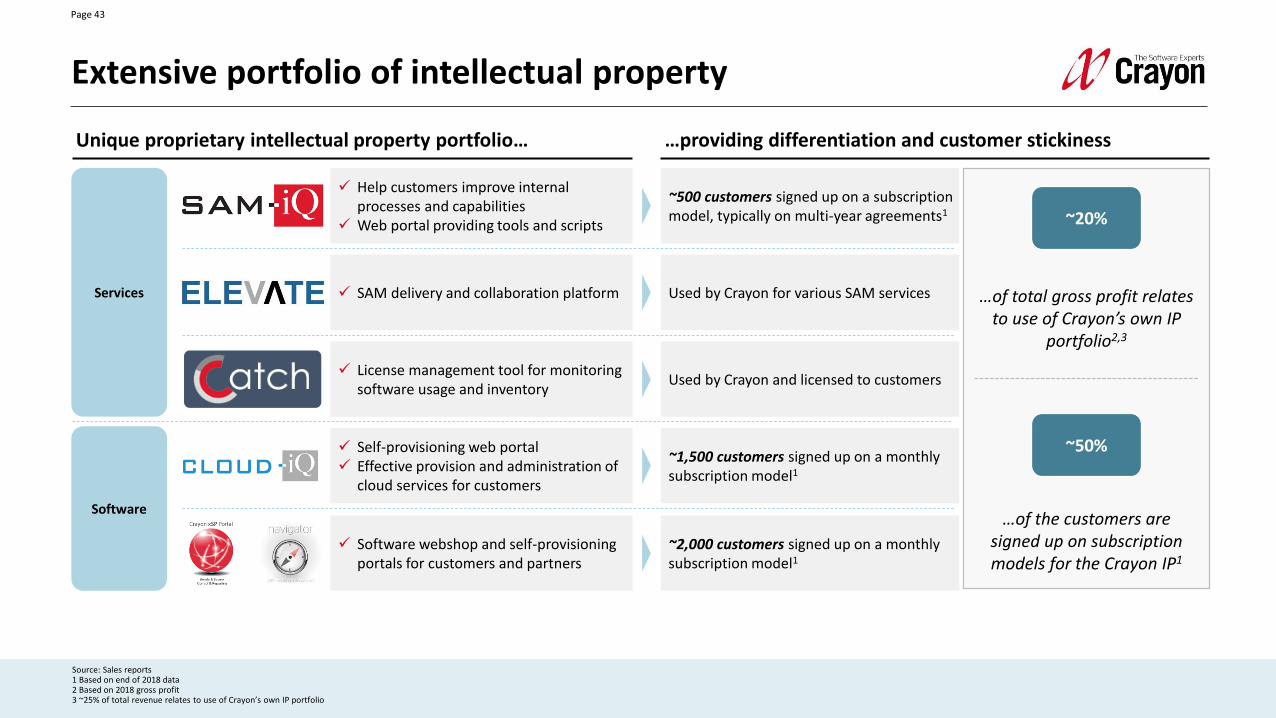
Extensive portfolio of intellectual property
Unique proprietary intellectual property portfolio…
Services
Software
✓ Help customers improve internal processes and capabilities
✓ Web portal providing tools and scripts
✓ SAM delivery and collaboration platform
✓ License management tool for monitoring software usage and inventory
✓ Self-provisioning web portal ✓ Effective provision and administration of
cloud services for customers
✓ Software webshop and self-provisioning portals for customers and partners
~500 customers signed up on a subscription model, typically on multi-year agreements1
Used by Crayon for various SAM services
Used by Crayon and licensed to customers
~1,500 customers signed up on a monthly subscription model1
~2,000 customers signed up on a monthly subscription model1
…providing differentiation and customer stickiness
~20%
…of total gross profit relates to use of Crayon’s own IP
portfolio2,3
~50%
…of the customers are signed up on subscription models for the Crayon IP1