Q2 2019 Highlights and 2019 Outlook -...
25
Q2 2019 Highlights and 2019 Outlook August 7, 2019
Transcript of Q2 2019 Highlights and 2019 Outlook -...

Q2 2019 Highlights and 2019 OutlookAugust 7, 2019

This document contains “forward-looking statements,” that is, information related to future, not past, events. Such statements generally include the words “believes,” “plans,” “intends,” “targets,” “will,” “expects,” “estimates”, “suggests,” “anticipates,” “outlook,” “continues,” or similar expressions. Forward-looking statements include, without limitation, statements about expected: financial positions; results of operations; cash flows; financing plans; business strategy; operating plans; strategic alternatives; capital and other expenditures; competitive positions; growth opportunities; benefits from new technology; and cost reduction initiatives. GCP is subject to various risks and uncertainties that could cause its actual results to differ materially from those contained in forward-looking statements, including, without limitation, risks related to: the cyclical and seasonal nature of the industries that GCP serves; foreign operations, especially in emerging regions; changes in currency exchange rates; the cost and availability of raw materials and energy; new product introductions and other growth initiatives; acquisitions and divestitures of assets; GCP’s outstanding indebtedness, including debt covenants and interest rate exposure; GCP’s funded and unfunded pension obligations; warranty and product liability claims; legal proceedings; the inability to establish or maintain certain business relationships, including with customers and suppliers; employee retention; and compliance with environmental laws. These and other factors are identified and described in more detail in GCP's Annual Report on Form 10-K and Quarterly Reports on Form 10-Q, which have been filed with the U.S. Securities and Exchange Commission and are available online at www.sec.gov. Readers are cautioned not to place undue reliance on GCP’s projections and other forward-looking statements, which speak only as of the date thereof. GCP undertakes no obligation to publicly release any revision to its projections and other forward-looking statements contained in this document, or to update them to reflect events or circumstances occurring after the date of this document.
Non-GAAP Financial MeasuresThese slides contain certain “non-GAAP financial measures”. Please refer to the Appendix for definitions of the non-GAAP financial measures used herein and a reconciliation of those non-GAAP financial measures to their most comparable GAAP measures.
Forward Looking Statements
2

Q2 2019 Highlights
3
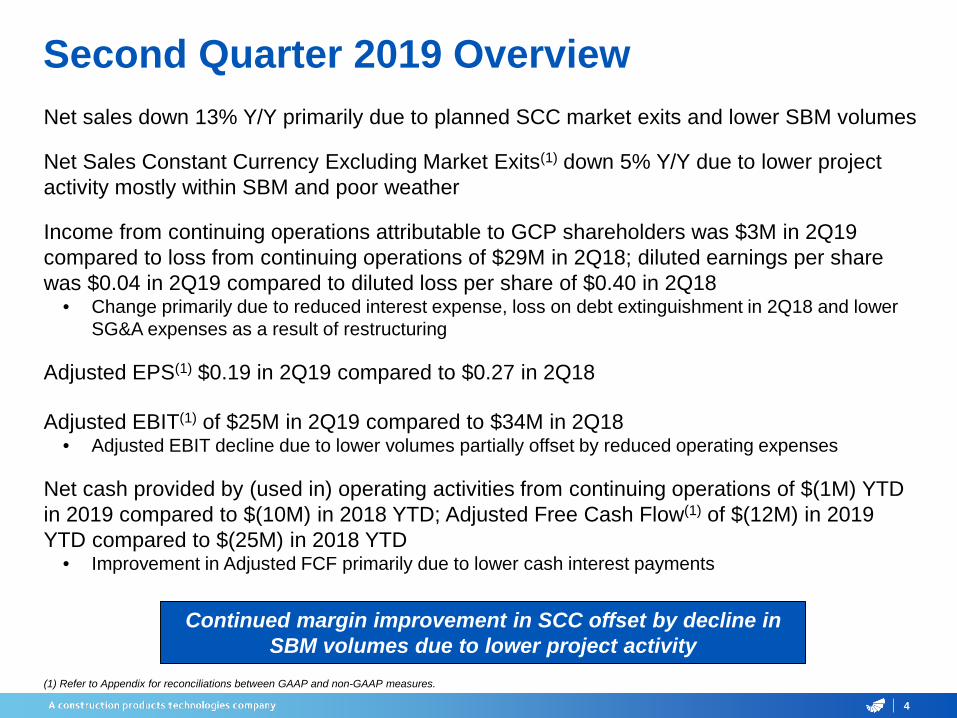
Net sales down 13% Y/Y primarily due to planned SCC market exits and lower SBM volumes
Net Sales Constant Currency Excluding Market Exits(1) down 5% Y/Y due to lower project activity mostly within SBM and poor weather
Income from continuing operations attributable to GCP shareholders was $3M in 2Q19 compared to loss from continuing operations of $29M in 2Q18; diluted earnings per share was $0.04 in 2Q19 compared to diluted loss per share of $0.40 in 2Q18
• Change primarily due to reduced interest expense, loss on debt extinguishment in 2Q18 and lower SG&A expenses as a result of restructuring
Adjusted EPS(1) $0.19 in 2Q19 compared to $0.27 in 2Q18
Adjusted EBIT(1) of $25M in 2Q19 compared to $34M in 2Q18• Adjusted EBIT decline due to lower volumes partially offset by reduced operating expenses
Net cash provided by (used in) operating activities from continuing operations of $(1M) YTD in 2019 compared to $(10M) in 2018 YTD; Adjusted Free Cash Flow(1) of $(12M) in 2019 YTD compared to $(25M) in 2018 YTD
• Improvement in Adjusted FCF primarily due to lower cash interest payments
4
(1) Refer to Appendix for reconciliations between GAAP and non-GAAP measures.
Second Quarter 2019 Overview
Continued margin improvement in SCC offset by decline in SBM volumes due to lower project activity

$175.0 $150.0 $150.0 $150.0 $150.4
Q2 2018 Volume Mix Price Currency Q2 2019
5
Factors Impacting Sales(1)
Q2 2019 $ / % Delta Y/YNet Sales $150.4 (14)%
Net Sales(1) (Constant Currency) $157.3 (10)%
Net Sales(1) (Constant Currency Excluding Market Exits)
$157.3 (1)%
Gross margin 35.6% 300 bps
Segment operating income $14.2 13%
Segment operating margin 9.4% 220 bps
Specialty Construction ChemicalsMarkets, sells and manufactures concrete admixtures, concrete production management systems and cement additives
(14.1)% 3.9% (3.9)%
$ in millions.
• Net sales decrease 14% Y/Y- Planned market exits, poor weather in North America and
lower activity in Asia Pacific - Net Sales Constant Currency Excluding Market Exits(1)
down 1%
• Gross margin increases 300 bps- Price increases, favorable impact of market exits and
restructuring savings
• Segment operating margin increases 220 bps- Increase primarily due to higher gross margin
(1) Refer to Appendix for reconciliations between GAAP and non-GAAP measures.
6
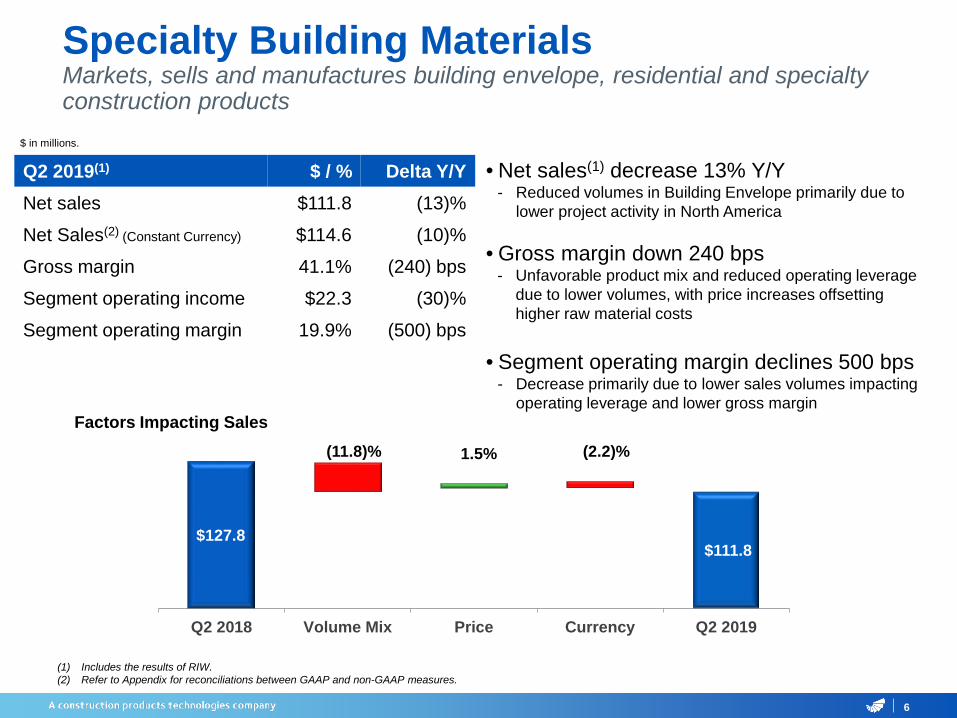
Specialty Building MaterialsMarkets, sells and manufactures building envelope, residential and specialty construction products
Q2 2019(1) $ / % Delta Y/YNet sales $111.8 (13)%
Net Sales(2) (Constant Currency) $114.6 (10)%
Gross margin 41.1% (240) bps
Segment operating income $22.3 (30)%
Segment operating margin 19.9% (500) bps
Factors Impacting Sales
$127.8 $112.0 $114.0 $114.0 $111.8
Q2 2018 Volume Mix Price Currency Q2 2019
(2.2)%1.5%(11.8)%
$ in millions.
• Net sales(1) decrease 13% Y/Y- Reduced volumes in Building Envelope primarily due to
lower project activity in North America
• Gross margin down 240 bps- Unfavorable product mix and reduced operating leverage
due to lower volumes, with price increases offsetting higher raw material costs
• Segment operating margin declines 500 bps- Decrease primarily due to lower sales volumes impacting
operating leverage and lower gross margin
(1) Includes the results of RIW.(2) Refer to Appendix for reconciliations between GAAP and non-GAAP measures.

2019 Outlook
7

Plan for Delivering Long-Term Value
• Simplify organizational structure to drive accountability and improved performance
• Continue to execute on multi-phase cost optimization program
• Sustain improvement in SCC’s margins with core market focus
• Disrupt ready-mix concrete industry with VERIFI®
• Return SBM to growth by optimizing pricing model, broadening market presence and accelerating introduction of new products
8
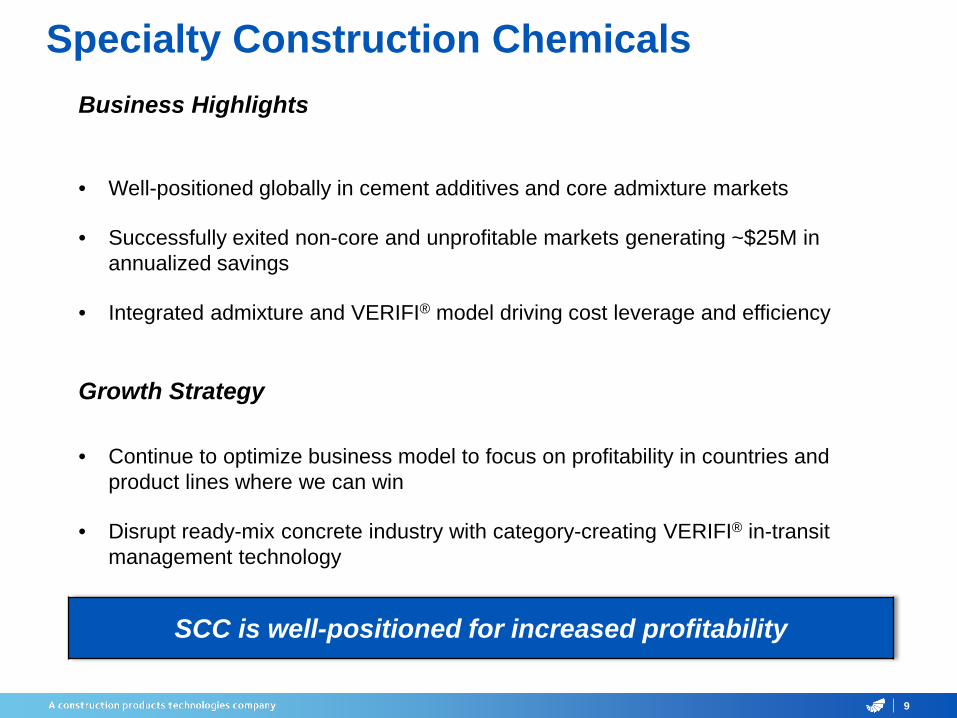
Specialty Construction Chemicals
9
Business Highlights
• Well-positioned globally in cement additives and core admixture markets
• Successfully exited non-core and unprofitable markets generating ~$25M in annualized savings
• Integrated admixture and VERIFI® model driving cost leverage and efficiency
Growth Strategy
• Continue to optimize business model to focus on profitability in countries and product lines where we can win
• Disrupt ready-mix concrete industry with category-creating VERIFI® in-transit management technology
SCC is well-positioned for increased profitability

VERIFI®
10
2019 Priorities
• Increase revenue at rate that exceeds 2018’s growth
• Focus on VERIFI® market penetration by leveraging integrated field and sales model
• Scale production while reducing per unit cost for margin expansion
• Commercialize next-generation technology to double value potential for customers
2021 Trajectory
• Target $50M to $75M in revenue with more than 10,000 installed trucks globally
• Increase market penetration to >10% in North America
• Contribute significantly to SCC margin improvement
• Estimated ROI >20% over contract life (with renewals driving higher returns)
VERIFI® transforms industry by addressing key customer needs such as productivity, quality and materials savings

Specialty Building Materials
11
Business Highlights
• Leading global provider of advanced products including Building Envelope, Residential, Fire Protection and other specialty applications
• Portfolio of reference brands with established specifications and proven track record in critical applications and on marquee projects
• Attractive margins with lower cost-to-serve model
Growth Strategy
• Leverage existing product portfolio to further penetrate adjacent market segments
• Address additional geographies where we can build stronger presence
• Accelerate introduction of next generation products
• Optimize pricing model
SBM is best-in-class business with strong brand names, advanced technology and global specification leadership
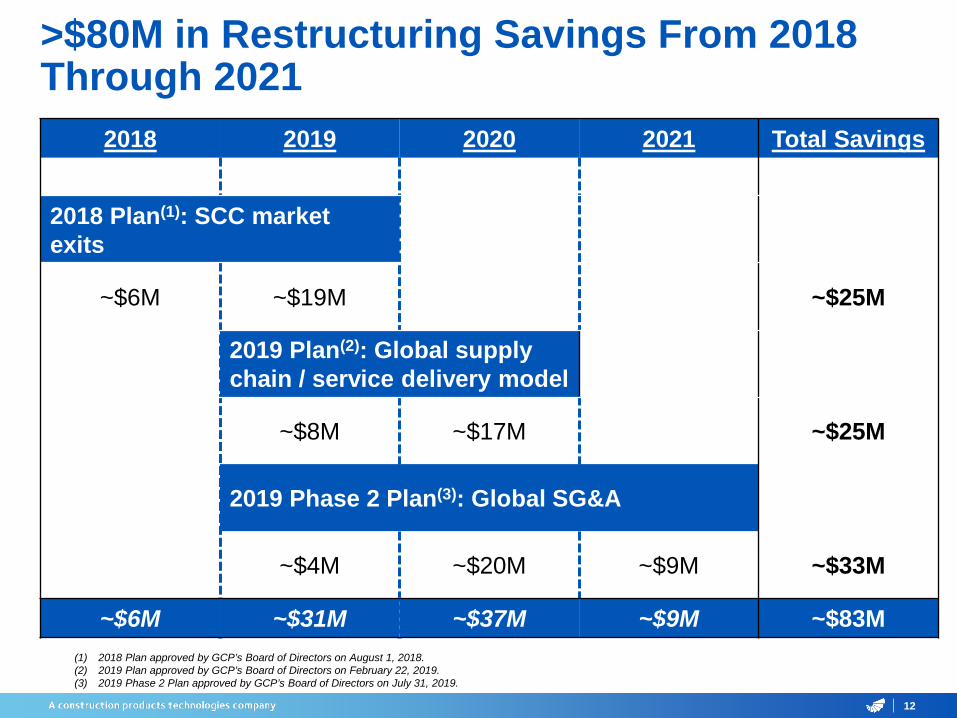
>$80M in Restructuring Savings From 2018 Through 2021
12
2018 2019 2020 2021 Total Savings
2018 Plan(1): SCC market exits
~$6M ~$19M ~$25M
2019 Plan(2): Global supplychain / service delivery model
~$8M ~$17M ~$25M
2019 Phase 2 Plan(3): Global SG&A
~$4M ~$20M ~$9M ~$33M
~$6M ~$31M ~$37M ~$9M ~$83M(1) 2018 Plan approved by GCP’s Board of Directors on August 1, 2018.(2) 2019 Plan approved by GCP’s Board of Directors on February 22, 2019.(3) 2019 Phase 2 Plan approved by GCP’s Board of Directors on July 31, 2019.

2019 Regional Outlook
13
North America52% EMEA
20%
LatinAmerica
6%
AsiaPacific22%
% 2Q19 GCP Net Sales by Region*:
Region 2019 Outlook
North America• Construction market moderating versus 2018
• Housing and commercial softness; infrastructure supported by public investment
Europe, Middle East, Africa• Political challenges impacting Europe; softness in Middle East continues
• Raw material inflation and FX volatility impacting certain markets
Asia Pacific • Construction market healthy in many countries; U.S.-China tension increases uncertainty
• Raw material inflation and FX volatility impacting certain markets
Latin America• Recovery in non-residential and infrastructure
• Raw material inflation, FX volatility and geopolitics impacting certain markets
*Percentages may not add due to rounding.

2019 Annual Guidance
14
(1) Assumes prior-year monthly FX rates carried forward into the guidance period. (2) Refer to Appendix for definition of non-GAAP measures and other important information.(3) Assumes June 30, 2019 FX rates carried forward into the guidance period.(4) Assumes approximately 73M shares outstanding.
Revenue Growth Constant Currency(1)(2) $1.02 billion to $1.05 billion
Adjusted Gross Profit(2)(3) $380 million to $395 million
Adjusted EBIT(2)(3) $100 million to $115 million
Adjusted Tax Rate 29% - 31%
Adjusted EPS(2)(3)(4) $0.75 - $0.92
Adjusted Free Cash Flow(2)(3) $35 million to $50 million
Capital Expenditures 6% to 7% of sales
2019 Additional Guidance Details
15
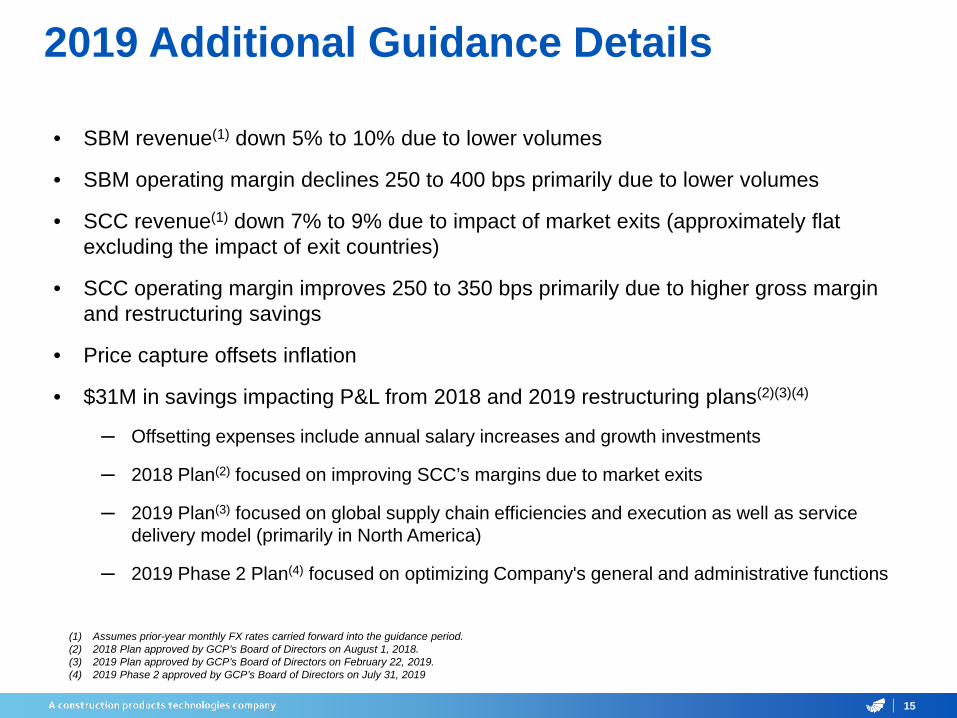
• SBM revenue(1) down 5% to 10% due to lower volumes
• SBM operating margin declines 250 to 400 bps primarily due to lower volumes
• SCC revenue(1) down 7% to 9% due to impact of market exits (approximately flat excluding the impact of exit countries)
• SCC operating margin improves 250 to 350 bps primarily due to higher gross margin and restructuring savings
• Price capture offsets inflation
• $31M in savings impacting P&L from 2018 and 2019 restructuring plans(2)(3)(4)
─ Offsetting expenses include annual salary increases and growth investments
─ 2018 Plan(2) focused on improving SCC’s margins due to market exits
─ 2019 Plan(3) focused on global supply chain efficiencies and execution as well as service delivery model (primarily in North America)
─ 2019 Phase 2 Plan(4) focused on optimizing Company's general and administrative functions
(1) Assumes prior-year monthly FX rates carried forward into the guidance period. (2) 2018 Plan approved by GCP’s Board of Directors on August 1, 2018.(3) 2019 Plan approved by GCP’s Board of Directors on February 22, 2019.(4) 2019 Phase 2 approved by GCP’s Board of Directors on July 31, 2019

Appendix
16
17
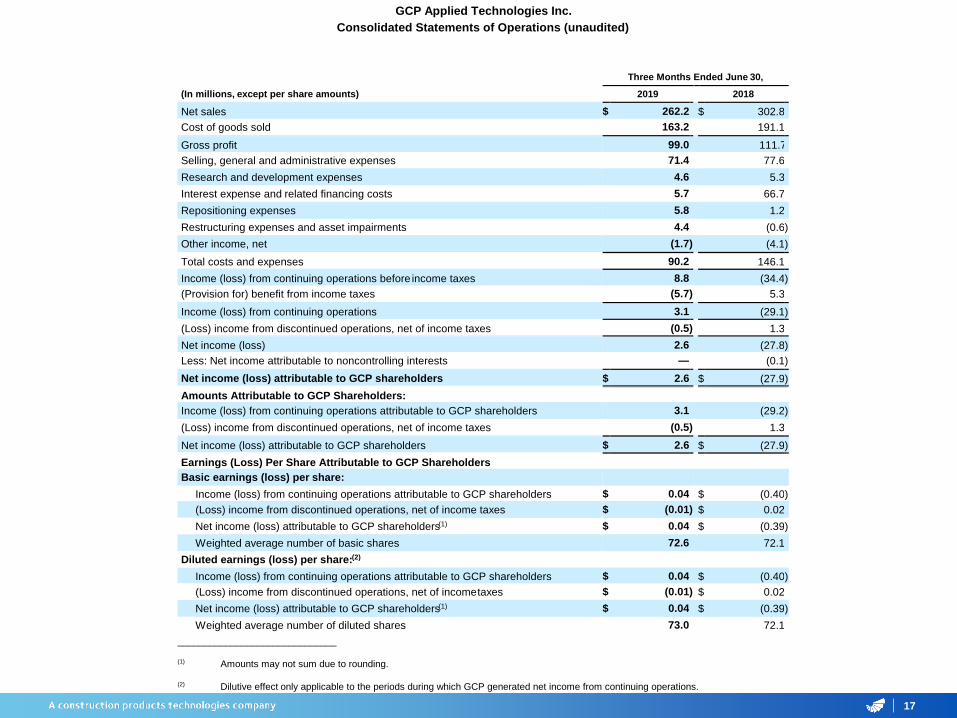
GCP Applied Technologies Inc. Consolidated Statements of Operations (unaudited)
Three Months Ended June 30,
(In millions, except per share amounts) 2019 2018
Net sales $ 262.2 $ 302.8 Cost of goods sold 163.2 191.1 Gross profit 99.0 111.7 Selling, general and administrative expenses 71.4 77.6 Research and development expenses 4.6 5.3 Interest expense and related financing costs 5.7 66.7 Repositioning expenses 5.8 1.2 Restructuring expenses and asset impairments 4.4 (0.6 ) Other income, net (1.7 ) (4.1 )
Total costs and expenses 90.2 146.1 Income (loss) from continuing operations before income taxes 8.8 (34.4 ) (Provision for) benefit from income taxes (5.7 ) 5.3 Income (loss) from continuing operations 3.1 (29.1 ) (Loss) income from discontinued operations, net of income taxes (0.5 ) 1.3 Net income (loss) 2.6 (27.8 ) Less: Net income attributable to noncontrolling interests — (0.1 ) Net income (loss) attributable to GCP shareholders $ 2.6 $ (27.9 ) Amounts Attributable to GCP Shareholders: Income (loss) from continuing operations attributable to GCP shareholders 3.1 (29.2 ) (Loss) income from discontinued operations, net of income taxes (0.5 ) 1.3 Net income (loss) attributable to GCP shareholders $ 2.6 $ (27.9 ) Earnings (Loss) Per Share Attributable to GCP Shareholders Basic earnings (loss) per share:
Income (loss) from continuing operations attributable to GCP shareholders $ 0.04 $ (0.40 ) (Loss) income from discontinued operations, net of income taxes $ (0.01 ) $ 0.02 Net income (loss) attributable to GCP shareholders(1) $ 0.04 $ (0.39 ) Weighted average number of basic shares 72.6 72.1
Diluted earnings (loss) per share:(2) Income (loss) from continuing operations attributable to GCP shareholders $ 0.04 $ (0.40 ) (Loss) income from discontinued operations, net of income taxes $ (0.01 ) $ 0.02 Net income (loss) attributable to GCP shareholders(1) $ 0.04 $ (0.39 ) Weighted average number of diluted shares 73.0 72.1
______________________________
(1) Amounts may not sum due to rounding.
(2) Dilutive effect only applicable to the periods during which GCP generated net income from continuing operations.

18
GCP Applied Technologies Inc. Consolidated Balance Sheets (unaudited)
(In millions, except par value and shares) June 30,
2019 December 31,
2018 ASSETS Current Assets Cash and cash equivalents $ 279.8 $ 326.1 Trade accounts receivable (including allowances of $6.3 million and $5.8 million, respectively) 188.4
198.6
Inventories, net 117.1 110.5 Other current assets 44.0 44.6 Current assets held for sale — 3.4
Total Current Assets 629.3 683.2 Properties and equipment, net 235.3 225.1 Operating lease right-of-use assets 36.3 —
Goodwill 207.4 207.9 Technology and other intangible assets, net 84.7 89.0 Deferred income taxes 26.5 25.5 Overfunded defined benefit pension plans 22.3 22.5 Other assets 28.1 28.0 Non-current assets held for sale 0.5 0.7
Total Assets $ 1,270.4 $ 1,281.9 LIABILITIES AND STOCKHOLDERS' EQUITY Current Liabilities Debt payable within one year $ 3.0 $ 10.6 Operating lease obligations payable within one year 9.3 — Accounts payable 104.0 121.4 Other current liabilities 105.2 145.5
Total Current Liabilities 221.5 277.5 Debt payable after one year 346.1 346.1 Income taxes payable 41.1 37.7 Deferred income taxes 12.2 12.4 Operating lease obligations 27.3 — Unrecognized tax benefits 43.6 62.8 Underfunded and unfunded defined benefit pension plans 50.5 48.1 Other liabilities 15.8 15.5 Non-current liabilities held for sale — 0.4
Total Liabilities 758.1 800.5 Commitments and Contingencies Stockholders' Equity Preferred stock, par value $0.01; authorized: 10,000,000 and 0 shares, respectively; no shares issued or outstanding —
—
Common stock issued, par value $0.01; 300,000,000 shares authorized; outstanding: 72,670,366 and 72,176,324, respectively 0.7
0.7
Paid-in capital 50.2 39.6 Accumulated earnings 587.9 563.9 Accumulated other comprehensive loss (120.7 ) (120.0 Treasury stock (8.0 ) (4.8
Total GCP's Shareholders' Equity 510.1 479.4 Noncontrolling interests 2.2 2.0
Total Stockholders' Equity 512.3 481.4 Total Liabilities and Stockholders' Equity $ 1,270.4 $ 1,281.9

19
GCP Applied Technologies Inc. Consolidated Statements of Cash Flows (unaudited)
Six Months Ended June 30,
(In millions) 2019 2018 OPERATING ACTIVITIES Net income (loss) $ 24.2 $ (34.3 ) Less: Income from discontinued operations 6.3 8.5 Income (loss) from continuing operations 17.9 (42.8 ) Reconciliation to net cash used in operating activities:
Depreciation and amortization 21.1 20.8 Amortization of debt discount and financing costs 0.7 0.9 Stock-based compensation expense 5.0 5.3 Unrealized gain on foreign currency — (0.8 ) Gain on termination and curtailment of pension and other postretirement benefit plans — (0.1 ) Deferred income taxes (15.5 ) (6.0 ) Loss on debt refinancing — 59.8 Gain on disposal of property and equipment (0.2 ) (1.1 )
Changes in assets and liabilities, excluding effect of currency translation: Trade accounts receivable 9.5 (3.3 ) Inventories (6.8 ) (10.7 ) Accounts payable (17.6 ) 5.2 Pension assets and liabilities, net 2.5 (0.4 ) Other assets and liabilities, net (17.3 ) (36.4 )
Net cash used in operating activities from continuing operations (0.7 ) (9.6 ) Net cash used in operating activities from discontinued operations (12.4 ) (124.9 ) Net cash used in operating activities (13.1 ) (134.5 )
INVESTING ACTIVITIES Capital expenditures (27.7 ) (27.6 ) Businesses acquired, net of cash acquired — (29.8 ) Other investing activities 0.5 (2.8 )
Net cash used in investing activities from continuing operations (27.2 ) (60.2 ) Net cash used in investing activities from discontinued operations (0.4 ) (0.2 ) Net cash used in investing activities (27.6 ) (60.4 )
FINANCING ACTIVITIES Borrowings under credit arrangements — 53.5 Repayments under credit arrangements (7.6 ) (58.4 ) Proceeds from issuance of long term note obligations — 350.0 Payments on finance lease obligations (0.4 ) — Repayments of long term note obligations — (578.3 ) Cash paid for debt financing costs — (6.9 ) Payments of tax withholding obligations related to employee equity awards (3.2 ) (1.3 ) Proceeds from exercise of stock options 5.0 5.1 Other financing activities — (0.2 )
Net cash used in financing activities from continuing operations (6.2 ) (236.5 ) Effect of currency exchange rate changes on cash and cash equivalents 0.6 (0.8 ) Decrease in cash and cash equivalents (46.3 ) (432.2 ) Cash and cash equivalents, beginning of period 326.1 721.5 Cash and cash equivalents, end of period $ 279.8 $ 289.3

Analysis of Operations
20
The Company has set forth in the tables below GCP's key operating statistics with percentage changes for the three months ended June 30, 2019 and 2018. In the table, the Company presents financial information in accordance with U.S. GAAP, as well as certain non-GAAP financial measures, which it describes below in further detail. GCP believes that the non-GAAP financial information supplements its discussions about the performance of its businesses, improves period-to-period comparability and provides insight to the information that management uses to evaluate the performance of its businesses. Management uses non-GAAP measures in financial and operational decision-making processes, for internal reporting, and as part of its forecasting and budgeting processes, since these measures provide additional transparency to GCP's core operations.
In the table, the Company has provided reconciliations of these non-GAAP financial measures to the most directly comparable financial measures calculated and presented in accordance with U.S. GAAP. These non-GAAP financial measures should not be considered substitutes for financial measures calculated in accordance with U.S. GAAP, and the financial results that the Company calculates and presents in the table in accordance with U.S. GAAP, as well as the corresponding reconciliations from those results, should be carefully evaluated.
Net Sales Constant Currency (a non-GAAP financial measure)- is defined as current period revenue in local currency translated using prior period exchange rates. GCP uses constant currency in assessing trends in sales excluding the impact of fluctuations in foreign currency exchange rates.
Net Sales Constant Currency Excluding Market Exits (a non-GAAP financial measure)- is defined as Net Sales Constant Currency less the impact on net sales resulting from the exit of non-profitable geographic markets associated with the 2018 Plan.
Adjusted EBIT (a non-GAAP financial measure)- is defined as net income (loss) from continuing operations attributable to GCP shareholders adjusted for: (i) gains and losses on sales of businesses, product lines and certain other investments; (ii) currency and other financial losses in Venezuela; (iii) costs related to legacy product, environmental and other claims; (iv) restructuring expenses, repositioning and asset impairments; (v) defined benefit plan costs other than service and interest costs, expected returns on plan assets and amortization of prior service costs/credits; (vi) third-party and other acquisition-related costs; (vii) other financing costs associated with the modification or extinguishment of debt; (viii) amortization of acquired inventory fair value adjustments; (ix) tax indemnification adjustments; (x) interest income, interest expense and related financing costs; (xi) income taxes; and (xii) certain other items that are not representative of underlying trends. Adjusted EBIT Margin is defined as Adjusted EBIT divided by net sales. GCP uses Adjusted EBIT to assess and measure its operating performance and determine performance-based compensation. GCP uses Adjusted EBIT as a performance measure because it provides improved period-to-period comparability for decision-making and compensation purposes and allows management to measure the ongoing earnings results of the Company's strategic and operating decisions.
Adjusted EBITDA (a non-GAAP financial measure)- is defined as Adjusted EBIT adjusted for depreciation and amortization. Adjusted EBITDA Margin is defined as Adjusted EBITDA divided by net sales. GCP uses Adjusted EBITDA as a performance measure in making significant business decisions.
Adjusted Earnings Per Share (a non-GAAP financial measure)- is defined as earnings per share ("EPS") from continuing operations on a diluted basis adjusted for: (i) gains and losses on sales of businesses, product lines and certain other investments; (ii) currency and other financial losses in Venezuela; (iii) costs related to legacy product, environmental and other claims; (iv) restructuring and repositioning expenses and asset impairments; (v) defined benefit plan costs other than service and interest costs, expected returns on plan assets and amortization of prior service costs/credits; (vi) third-party and other acquisition-related costs; (vii) other financing costs associated with the modification or extinguishment of debt; (viii) amortization of acquired inventory fair value adjustments; (ix) tax indemnification adjustments; (x) certain other items that are not representative of underlying trends; and (xi) certain discrete tax items. GCP uses Adjusted EPS as a performance measure to review its diluted earnings per share results on a consistent basis and in determining certain performance-based employee compensation.

Analysis of Operations
21
Adjusted Gross Profit (a non-GAAP financial measure)- is defined as gross profit adjusted for: (i) corporate and pension-related costs included in cost of goods sold; (ii) loss in Venezuela included in cost of goods sold; and (iii) amortization of acquired inventory fair value adjustment. Adjusted Gross Margin is defined as Adjusted Gross Profit divided by net sales. Management uses this performance measure to understand trends and changes and to make business decisions regarding core operations.
Adjusted Free Cash Flow (a non-GAAP financial measure)- is defined as net cash provided by or used in operating activities minus capital expenditures plus: (i) cash paid for restructuring and repositioning, third party and other acquisition-related costs, costs related to legacy product, environmental and other claims, as well as certain other items that are not representative of underlying trends, net of related cash taxes; (ii) capital expenditures related to repositioning; and (iii) accelerated payments under defined benefit pension arrangements. GCP uses Adjusted Free Cash Flow as a liquidity measure to evaluate its ability to generate cash to support its ongoing business operations, to invest in its businesses, to provide a return of capital to shareholders and to determine payments of performance-based compensation.
Adjusted EBIT Return On Invested Capital (a non-GAAP financial measure)- is defined as Adjusted EBIT (on a trailing four quarters basis) divided by stockholders' equity adjusted for: (i) cash and cash equivalents, (ii) debt, (iii) income tax assets and liabilities, (iv) defined benefit pension plan assets and liabilities, and (iv) certain other assets and liabilities. Management uses Adjusted EBIT Return On Invested Capital as a performance measure to review investments and to make capital allocation decisions.
Adjusted EBIT, Adjusted EBIT Margin, Adjusted EBITDA, Adjusted EBITDA Margin, Adjusted EPS, Adjusted EBIT Return On Invested Capital, Adjusted Gross Profit, Adjusted Gross Margin and Adjusted Free Cash Flow do not purport to represent income measures as defined under U.S. GAAP. These measures are provided to investors and others to improve the period-to-period comparability and peer-to-peer comparability of GCP's financial results and to ensure that investors understand the information GCP uses to evaluate the performance of its businesses.
Adjusted EBIT has material limitations as an operating performance measure because it excludes costs related to income and expenses from restructuring and repositioning activities, which historically has been a material component of net income (loss) from continuing operations attributable to GCP shareholders. Adjusted EBITDA also has material limitations as an operating performance measure because it excludes the impact of depreciation and amortization expense. GCP's business is substantially dependent on the successful deployment of capital, and depreciation and amortization expense is a necessary element of its costs. GCP compensates for the limitations of these measurements by using these indicators together with net income (loss) measured under GAAP to present a complete analysis of its results of operations. Adjusted EBIT and Adjusted EBITDA should be evaluated together with net income (loss) from continuing operations attributable to GCP shareholders measured under GAAP for a complete understanding of GCP's results of operations.
The Company does not provide GAAP earnings on a forward-looking basis because the Company is unable to estimate with reasonable certainty unusual or unanticipated charges, expenses or gains without unreasonable effort. These items are uncertain, depend on various factors, and could be material to the Company’s results computed in accordance with GAAP.

22
GCP Applied Technologies Inc. Analysis of Operations (unaudited)
Analysis of Operations (in millions, except per share amounts)
Three Months Ended June 30,
2019 2018 % Change
Net sales: Specialty Construction Chemicals $ 150.4 $ 175.0 (14.1 )% Specialty Building Materials 111.8 127.8 (12.5 )%
Total GCP net sales $ 262.2 $ 302.8 (13.4 )% Net sales by region:
North America $ 135.8 $ 149.3 (9.0 )% Europe Middle East Africa (EMEA) 52.3 69.2 (24.4 )% Asia Pacific 58.9 65.7 (10.4 )% Latin America 15.2 18.6 (18.3 )%
Total net sales by region $ 262.2 $ 302.8 (13.4 )% Net Sales Constant Currency: Specialty Construction Chemicals $ 157.3 $ 175.0 (10.1 )% Specialty Building Materials 114.6 127.8 (10.3 )% Total GCP Net Sales Constant Currency (non-GAAP) $ 271.9 $ 302.8 (10.2 )% Impact of Market Exits: Specialty Construction Chemicals $ — $ 15.7 NM Total Impact of Market Exits $ — $ 15.7 NM Net Sales Constant Currency Excluding Market Exits: Specialty Construction Chemicals $ 157.3 $ 159.3 (1.3 )%
Specialty Building Materials 114.6 127.8 (10.3 )%
Total GCP Net Sales Constant Currency Excluding Market Exits (non-GAAP) $ 271.9
$ 287.1
(5.3 )%
Profitability performance measures: Adjusted EBIT (A):
Specialty Construction Chemicals segment operating income $ 14.2 $ 12.6 12.7 % Specialty Building Materials segment operating income 22.3 31.8 (29.9 )% Corporate costs (B) (9.4 ) (8.6 ) 9.3 % Certain pension costs (C) (2.0 ) (1.9 ) 5.3 %
Adjusted EBIT (non-GAAP) $ 25.1 $ 33.9 (26.0 )% Legacy product, environmental and other claims (0.1 ) — (100.0 )% Repositioning expenses (5.8 ) (1.2 ) NM Restructuring expenses and asset impairments (4.4 ) 0.6 NM Other costs (D) (1.1 ) — (100.0 )% Pension MTM adjustment and other related costs, net — (0.9 ) (100.0 )% Gain on termination and curtailment of pension and other
postretirement plans —
0.1
(100.0 )% Third-party and other acquisition-related costs — (0.8 ) (100.0 )% Amortization of acquired inventory fair value adjustment — (0.2 ) (100.0 )% Interest expense, net (4.9 ) (66.0 ) (92.6 )% Income tax (expense) benefit (5.7 ) 5.3 NM
Income (loss) from continuing operations attributable to GCP shareholders (GAAP) $ 3.1
$ (29.2 ) NM Income (loss) from continuing operations attributable to GCP
shareholders as a percentage of net sales 1.2 % (9.6 )% NM
Diluted EPS from continuing operations (GAAP) $ 0.04 $ (0.40 ) NM Adjusted EPS (non-GAAP) $ 0.19 $ 0.27 (29.6 )%

23
GCP Applied Technologies Inc. Analysis of Operations (unaudited) (continued)
Analysis of Operations (in millions)
Three Months Ended June 30,
2019 2018 % Change
Adjusted profitability performance measures: Gross Profit:
Specialty Construction Chemicals $ 53.6 $ 57.0 (6.0 )% Specialty Building Materials 46.0 55.6 (17.3 )% Adjusted Gross Profit (non-GAAP) $ 99.6 $ 112.6 (11.5 )% Amortization of acquired inventory fair value adjustment — (0.2 ) (100.0 )% Corporate costs and pension costs in cost of goods sold (0.6 ) (0.7 ) (14.3 )% Total GCP Gross Profit (GAAP) $ 99.0 $ 111.7 (11.4 )%
Gross Margin: Specialty Construction Chemicals 35.6 % 32.6 % 3.0 pts Specialty Building Materials 41.1 % 43.5 % (2.4) pts Adjusted Gross Margin (non-GAAP) 38.0 % 37.2 % 0.8 pts Amortization of acquired inventory fair value adjustment — % (0.1 )% 0.1 pts Corporate costs and pension costs in cost of goods sold (0.2 )% (0.2 )% 0.0 pts Total GCP Gross Margin (GAAP) 37.8 % 36.9 % 0.9 pts
Adjusted EBIT (A)(B)(C): Specialty Construction Chemicals segment operating income $ 14.2 $ 12.6 12.7 % Specialty Building Materials segment operating income 22.3 31.8 (29.9 )% Corporate and certain pension costs (11.4 ) (10.5 ) 8.6 % Total GCP Adjusted EBIT (non-GAAP) $ 25.1 $ 33.9 (26.0 )%
Depreciation and amortization: Specialty Construction Chemicals $ 6.1 $ 6.0 1.7 % Specialty Building Materials 3.8 3.7 2.7 % Corporate 1.1 0.9 22.2 % Total GCP depreciation and amortization $ 11.0 $ 10.6 3.8 %
Adjusted EBITDA: Specialty Construction Chemicals $ 20.3 $ 18.6 9.1 % Specialty Building Materials 26.1 35.5 (26.5 )% Corporate and certain pension costs (10.3 ) (9.6 ) 7.3 % Total GCP Adjusted EBITDA (non-GAAP) $ 36.1 $ 44.5 (18.9 )%
Adjusted EBIT Margin: Specialty Construction Chemicals 9.4 % 7.2 % 2.2 pts Specialty Building Materials 19.9 % 24.9 % (5.0) pts Total GCP Adjusted EBIT Margin (non-GAAP) 9.6 % 11.2 % (1.6) pts
Adjusted EBITDA Margin: Specialty Construction Chemicals 13.5 % 10.6 % 2.9 pts Specialty Building Materials 23.3 % 27.8 % (4.5) pts Total GCP Adjusted EBITDA Margin (non-GAAP) 13.8 % 14.7 % (0.9) pts

24
Analysis of Operations (in millions)
Four Quarters Ended
June 30, 2019 June 30, 2018
Calculation of Return on Stockholders' Equity and Adjusted EBIT Return On Invested Capital (trailing four quarters):
Income (loss) from continuing operations attributable to GCP shareholders (trailing four quarters): $ 44.6
$ (130.2 )
Stockholders' Equity (end of period) 512.3 448.6 Assets:
Cash and cash equivalents (279.8 ) (289.3 ) Pension plans (22.3 ) (26.3 ) Income taxes (26.5 ) (27.4 ) Other current assets (E) (11.8 ) (9.6 ) Other assets (F) (3.6 ) (4.5 ) Assets held for sale* (0.5 ) (10.4 ) Subtotal (344.5 ) (367.5 )
Liabilities: Debt* 349.1 365.1
Income taxes 96.9 107.7
Pension plans 50.5 56.1
Other current liabilities (G) 26.1 68.0
Other liabilities (H) 1.8 2.5
Liabilities held for sale* — 3.8
Subtotal 524.4 603.2 Total invested capital (end of period) $ 692.2 $ 684.3 Return on Stockholders' Equity 8.7 % (29.0 )%
Adjusted EBIT (trailing four quarters) $ 108.9 $ 121.5 Adjusted EBIT Return On Invested Capital (non-GAAP) 15.7 % 17.8 %
___________________________________________________________________________________________________________________ (A) Our segment operating income includes only our share of income of consolidated joint ventures.
(B) Management allocates certain corporate costs to each operating segment to the extent such costs are directly attributable to the segments.
(C) Certain pension costs include only ongoing costs, recognized quarterly, which include service and interest costs, expected returns on plan assets and amortization of prior service costs/credits. SCC and SBM segment operating income and corporate costs do not include any amounts for pension expense. Other pension-related costs, including annual mark-to-market adjustments, gains or losses from curtailments and terminations, as well as other related costs, are excluded from Adjusted EBIT. These amounts are not used by management to evaluate the performance of our businesses and significantly affect the peer-to-peer and period-to-period comparability of our financial results. Mark-to-market adjustments and other related costs are primarily attributable to changes in financial market values and actuaria assumptions and are not directly related to the operation of our businesses.
(D) Other costs represent legal and advisory fees incurred in connection with the nomination by a Company shareholder of Board of Directors candidates to stand for election at the 2019 Annual Meeting of Shareholders, as well as other related matters.
(E) Other current assets consist of income taxes receivable.
(F) Other assets consist of capitalized financing fees.
(G) Other current liabilities consist of income taxes, restructuring, repositioning, accrued interest and liabilities incurred in association with the Darex divestiture.
(H) Other liabilities consist of other postretirement benefits liabilities and liabilities incurred in association with the Darex divestiture.
* Consists of current and non-current components.
NM Not meaningful.

25
GCP Applied Technologies Inc. Analysis of Operations (unaudited) (continued)
(In millions) Six Months Ended June 30,
2019 2018 Cash flow measure: Net cash used in operating activities from continuing operations $ (0.7 ) $ (9.6 ) Capital expenditures (27.7 ) (27.6 ) Free Cash Flow (non-GAAP) (28.4 ) (37.2 ) Cash paid for repositioning 11.3 3.6 Cash paid for restructuring 6.3 4.3 Cash paid for third-party and other acquisition-related costs 0.4 1.0 Capital expenditures related to repositioning 1.3 2.5 Cash paid for other costs 1.7 — Cash taxes related to repositioning, restructuring, third-party and other
acquisition-related costs and other costs (4.9 ) (2.3 ) Accelerated pension plan contributions — 2.9 Adjusted Free Cash Flow (non-GAAP) $ (12.3 ) $ (25.2 )
GCP Applied Technologies Inc. Adjusted Earnings Per Share (unaudited)
Three Months Ended June 30,
2019 2018
(in millions, except per share amounts) Pre- Tax Tax
Effect After- Tax Per
Share Pre- Tax Tax
Effect After- Tax Per
Share Diluted EPS from continuing operations
(GAAP) $ 0.04 $ (0.40 )
Repositioning expenses $ 5.8 $ 1.5 $ 4.3 0.06 $ 1.2 $ 0.3 $ 0.9 0.01 Restructuring expenses and asset
impairments 4.4 0.1
4.3
0.06
(0.6 ) (0.2 ) (0.4 ) (0.01 )
Gain on termination and curtailment of pension and other postretirement plans —
—
—
—
(0.1 ) —
(0.1 ) —
Pension MTM adjustment and other related costs, net —
—
—
—
0.9
0.2
0.7
0.01
Legacy product, environmental and other claims 0.1
—
0.1
—
—
—
—
—
Third-party and other acquisition-related costs —
—
—
—
0.8
0.2
0.6
0.01
Loss on debt refinancing — — — — 59.8 13.0 46.8 0.65 Amortization of acquired inventory fair
value adjustment — —
—
—
0.2
—
0.2
—
Other costs 1.1 0.3 0.8 0.01 — — — — Discrete tax items, including adjustments to
uncertain tax positions — (1.4 ) 1.4
0.02
—
0.1
(0.1 ) —
Adjusted EPS (non-GAAP) $ 0.19 $ 0.27