Q2 2017 Management Investor Presentation
46
Management Investor Presentation Second Quarter 2017 September 25, 2017
Transcript of Q2 2017 Management Investor Presentation

Management Investor Presentation
Second Quarter 2017
September 25, 2017

2
Core Strengths
Strong, reliable distribution yield provided to investors
Stable, diversified portfolio of national retail tenants
Disciplined growth strategy in Canada through development and acquisition
Positioned to benefit from robust development pipeline
Experienced, performance driven management team
Dominant platform, geographically diversified across Canada with emphasis on the Country’s six largest markets
Conservative balance sheet / financial strength

3
One of North America’s Largest Retail Focused REITS
299properties in Canada
62 millionsf. total portfolio
$7.9 billionmarket cap
45 millionsf. owned
$13.9 billionenterprise value
~85%revenue generated by national and anchor tenants
~6,400 tenancies
This slide contains references to non-GAAP Measures. For a definition of such measures please refer to RioCan’s June 30, 2017 MD&A.

4
Calgary
Edmonton
Vancouver
Toronto
MontrealOttawa
BC
AB
ON
QC
11.5%
8.5%4.8%
5.0%
5.2%
40.1%
Ontario65.5%
Alberta15.3%
Quebec8.4% BC
7.9%
Eastern Canada
1.9%
Manitoba / Saskatchewan
1.0%
Annualized Rental Revenue by Province & Major MarketAs at June 30, 2017

5
RioCan continues to increase its focus in Canada’s six major markets and routinely evaluates its portfolio in order to selectively dispose of assets as a means of recycling capital. These asset sales will further enhance RioCan’s strategy to shift the portfolio’s geographic allocation away from low growth markets to Canada’s high population, high growth markets to above 80%;
• RioCan’s concentration in Canada’s six high growth markets is 75.2% (Year end 2004 - 57.7%) and is expected to continue to increase as the result of selected dispositions and development completions.
• Capital from asset sales redeployed into development and acquisition activities.• Markets with highest population growth will outperform smaller markets with little growth or negative population statistics.
Extracting Value by Recycling Capital
RioCan’s plan to continue recycle capital into higher growth assets will provide for enhancedreturns to unitholders and a reduced need for access to public equity markets to raise capital.
2004 2005 2006 2007 2008 2009 2010 2011 2012 2013 2014 2015 2016 Q22017
Target
57.7%
75.2% >80%
Increasingly Major Market Focused

6
Creating ValueUnmatched portfolio of Urban Retail Focused Mixed Use Properties
RioCan’s development pipeline of mixed use assets will create a portfolio profile unlike any other REIT in Canada
45 6
321
1. Yonge Sheppard CentreTotal retail renovation and expansion, additional 39 floor rental residential tower in Toronto, Ontario
2. Gloucester ResidentialRepurposing a discrete portion of current retail property to add up to 820 rental units with Killam in Ottawa, Ontario
3. King Portland CentreA mixed-use office/residential complex with approx. 417,000 sf. of gross floor area in Toronto, Ontario
4. The WellFlagship 3 million sf. retail office and residential development project in downtown west Toronto, Ontario
5. Sunnybrook PlazaRetail/residential redevelopment along LRT line in midtown Toronto, Ontario
6. ePlace (YENE)High profile development along two major transit lines in Toronto, Ontario with more than 1,000 residential units.

7
1 5.1% 82 2,125 7.6
2 4.9% 90 2,437 6.9
3 4.4% 29 3,607 9.7
4 4.1% 27 1,443 7.8
5 4.0% 72 1,937 7.1
6 3.6% 50 2,058 6.5
7 2.0% 107 522 6.4
8 1.8% 13 1,517 10.8
9 1.7% 28 928 8.6
10 1.7% 81 749 6.4
Top 10 Tenant Name Number Of Locations
Weighted Avg Remaining Lease Term
(Yrs)
Annualized Rental
Revenue
NLA (Sq. Ft. in '000s)
Strong & Diversified Tenant BaseTop 10 Tenants
(i) Loblaws includes Shoppers Drug Mart, No Frills, Fortinos, Zehrs and Maxi. (ii) Canadian Tire Corporation includes Canadian Tire/PartSource/Mark’s/Sport Mart/ Sport Chek/Sports Experts/National Sports/Atmosphere.
As at June 30, 2017

8
Lease Rollover Profile
Broadly Distributed Lease Expiries % Square Feet expiring / portfolio NLA
As at June 30, 2017’000s Square Feet
2.7%
12.6% 11.4% 12.2%10.3%
1,145
4,446
5,422 4,913
5,252
2.7%
10.3%
12.6%11.4%
12.2%
0.0%
5.0%
10.0%
15.0%
20.0%
25.0%
30.0%
(500)
500
1,500
2,500
3,500
4,500
5,500
6,500
7,500
8,500
2017 remainder 2018 2019 2020 2021

9
96.0% 95.0% 96.0% 95.0% 96.1% 95.6% 95.8% 96.3% 96.3% 97.1% 97.7% 97.6% 96.9%97.4% 97.4% 97.6% 97.4% 96.9% 97.0%
94.0%95.6% 96.7%
1996 1997 1998 1999 2000 2001 2002 2003 2004 2005 2006 2007 2008 2009 2010 2011 2012 2013 2014 2015 2016 2017*
Occupancy since 1996Historical Committed Occupancy Rates 1996 to Q2 2017
* As at June 30, 2017
Returning to historical average Occupancy

10
The Death of the Mall?Media reports fail to recognize differences between Canada and the U.S.

11
Current Market EnvironmentKey Differences Between Canadian and U.S. Retail
Less Retail Space
Geographic Dispersion
Fewer Anchors
Canada simply has far less retail space per capita than the U.S.
International Council of Shopping Centers (“ICSC”) reports 16.5 sf per capita in Canada (or 70%) vs. 23.6 sf per capita in the US
Number of anchors in the United States is far greater, contributing to the increased supply of retail space
Canada is essentially a country that is 100 miles deep and 3,000 miles wide, making shipping and delivery costs more expensive

12
Current Market EnvironmentLeasing Market Trends
Declining
Growing
The full price fashion category across the board continues to struggle• Department stores are reporting soft fashion sales and bankruptcies both north and south
of the border continue
• Small format fashion retailers are not opening up new locations
Shifting demand for large formats • Some pressure from the larger format tenants upon renewal as they have options to
relocate and right-size their existing boxes, e.g., Staples, who in many cases occupy boxes larger then 25,000 square feet, are looking at alternatives in the same market in the 20,000 square foot range and are giving the relocation options real consideration versus a simple renewal
• Potential relocations opening up opportunities for the discount tenants, such as Giant Tiger, who are aggressively growing
Evolving
Home Furnishings, Food, Fitness, Beauty and Value Retailers continue to be bright spots in the retail landscape, with numerous brands adding additional physical locations
• Small format service-oriented retail is performing well and numerous tenants are expanding• Continued growth from national gym operators and expansion of smaller, boutique-type
operators in urban centres• Quick Service Restaurants aggressively expanding• Value retailers such as Winners, Marshalls, Dollarama continue to grow• Specialty grocers• Entertainment – Ciniplex (Rec Room)

13
Growing RetailersThe untold story…many retailers are expanding
Dollar Stores, Discount retailers, Sporting Goods, Fitness, Food and Beverage, continue to expand

14
RioCan’s approach to the evolving retail landscape
Core strategy of urban, retail focused mixed-use assets• Capitalizing on core demographic trends of increasing urbanization• Convenience, ease of pickup for goods• Intensification strategy puts increased density of consumers adjacent to retail
offerings• Flexible box sizes to suit tenant needs
Tenant Mix• Fastest growing tenant categories are in the “experiential” retail space
• Fitness, Food and Beverage, Entertainment• These categories also work best in highly populated markets with solid
demographics
Grocery/Necessity based retail• Grocery and needs based retail remains defensive against e-commerce• Prepared food offerings from major grocers remains a core area of growth for
the grocery segment
What is RioCan doing to manage the evolving retail environment?

15
RioCan’s approach to the evolving retail landscape
Click Resistent Tenants
• Move from traditional fashion tenants toward gym, service, commercial and food service uses that are more difficult to disintermediate and have become increasingly defensive
Growing Banners
• Increased exposure to specialty grocers and discount grocery banners• Long-standing focus on discount banners such as TJX banners (Winners,
HomeSense, Marshalls), Dollarama, Costco, Giant Tiger• While these may not be considered “non-traditional”, they have shown
signs of continued growth and are typically more resistant to weakness in economic conditions
What is RioCan doing to manage the evolving retail environment?

16
Financial Results

17
Financial Highlights
This slide contains references to non-GAAP Measures. For a definition of such measures please refer to RioCan’s June 30, 2017 MD&A.
($ millions)
30-Jun-17 30-Jun-16 % Change 30-Jun-17 30-Jun-16 % Change
Revenue 285,632 275,746 3.6% 575,302 559,577 2.8%FFO 146,622 133,123 10.1% 289,387 275,755 4.9%FFO from continuing operations 145,730 116,091 25.5% 288,665 224,849 28.4%FFO (per unit - diluted) 0.45 0.41 9.8% 0.88 0.85 3.5%
Three months ended Six Months Ended
Q2 2017 Q1 2017
1.9% 1.5%Same Property NOI Growth

18
Organic Growth
Occupancy and Leasing Profile – Last eight quarters
This slide contains references to non-GAAP Measures. For a definition of such measures please refer to RioCan’s June 30, 2017 MD&A.
• Annualized incremental IFRS rental income represented by the gap between committed and economic occupancy is $13.0 million and includes amounts related to Target backfill progress as applicable.
• Of the 630,000 square feet of NLA and $13.0 million of annualized incremental IFRS rent, 55.4% of the NLA and 40.3% of the incremental IFRS rent relates to the leasing of former Target space and leasing of other tenant space in development projects expected to be completed in 2017.
Second SecondQuarter Quarter
Committed occupancy (%) 96.7 96.2 95.6 95.3 95.1 94.8 94.0 93.2
In-place occupancy (%) 95.2 94.4 93.6 93.6 92.9 92.8 93.3 92.4
Retention rate (%) 93.9 88.6 84.0 83.1 91.6 84.4 81.4 89.8
Increase in average net rent per sf. (%) 4.7 8.2 8.1 6.6 3.3 6.2 4.0 8.6
2017 2016 2015
First Quarter
Fourth Quarter
Third Quarter
First Quarter
Fourth Quarter
Third Quarter

19
Financial HighlightsFunds From Operations (“FFO”)
This slide contains references to non-GAAP Measures. For a definition of such measures please refer to RioCan’s June 30, 2017 MD&A.
* 2015 includes net settlement amount from Target of $88 million. 2016 decline reflects the lost FFO as a result of the sale of the U.S. portfolio and no Target settlement as in 2015.
1.281.47 1.56 1.65
1.951.68
0.88
0
0.5
1
1.5
2
2.5
2011 2012 2013 2014 2015* 2016* 2017YTD
FFO Per Unit
340427 471 507
622548
289
0
100
200
300
400
500
600
700
2011 2012 2013 2014 2015* 2016* 2017YTD
FFO

20
Financial Highlights
228261 281 285 293 316 312 365 397
297318 340
367401
426 433 453 458
2008 2009 2010 2011 2012 2013 2014 2015 2016
(in millions)
Distributions to Unitholders
1.041.14 1.14 1.07 1.01 1.04 1.02 0.97
1.22
1.36 1.38 1.38 1.38 1.38 1.41 1.41 1.41 1.41
2008 2009 2010 2011 2012 2013 2014 2015 2016
Distributions to Unitholders per Unit
Distributions to Unitholders net of DRIP Distributions per Unit net of DRIPTotal Distributions to Unitholders Total Distributions per Unit to Unitholders
* Distribution net of DRIP increased as a result of a lower DRIP participation rate (5.6% @ Q2 2017).
A track record of growth

21
Conservative Debt StructureGrowth in Asset vs Debt (at RioCan’s interest)
In millions
This slide contains references to non-GAAP Measures. For a definition of such measures please refer to RioCan’s June 30, 2017 MD&A.
DebtAssets
20082009
20102011
20122013
2014
2015
2016
Q22017
3,260
5,987
5,334 14,363
Debt
Assets
CAGR ‐ 7.4%
CAGR ‐ 12.4%
22
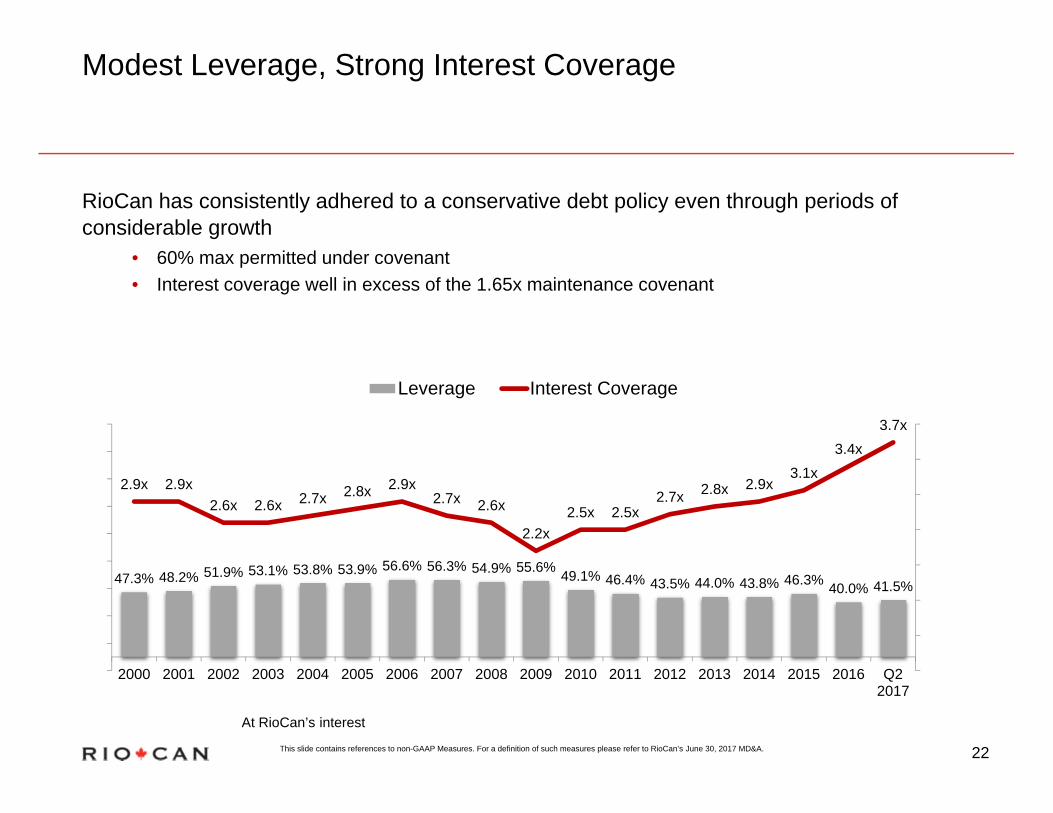
RioCan has consistently adhered to a conservative debt policy even through periods of considerable growth
• 60% max permitted under covenant• Interest coverage well in excess of the 1.65x maintenance covenant
Modest Leverage, Strong Interest Coverage
47.3% 48.2% 51.9% 53.1% 53.8% 53.9% 56.6% 56.3% 54.9% 55.6% 49.1% 46.4% 43.5% 44.0% 43.8% 46.3% 40.0% 41.5%
2.9x 2.9x2.6x 2.6x 2.7x 2.8x 2.9x
2.7x 2.6x
2.2x2.5x 2.5x
2.7x 2.8x 2.9x3.1x
3.4x3.7x
2000 2001 2002 2003 2004 2005 2006 2007 2008 2009 2010 2011 2012 2013 2014 2015 2016 Q22017
Leverage Interest Coverage
At RioCan’s interest
This slide contains references to non-GAAP Measures. For a definition of such measures please refer to RioCan’s June 30, 2017 MD&A.

23
Long‐term, staggered debt maturity profile.• The weighted average contractual interest rate at June 30, 2017 was 3.40% with a 3.4 year
weighted avg. term to maturity as compared to 3.54% and 3.42 years at Dec. 31, 2016.• Floating rate debt exposure at RioCan’s interest – 12.5%
Debt Maturity Schedule
3.42% 3.39% 3.78% 3.22% 3.49%3.30%
0.0%
1.0%
2.0%
3.0%
4.0%
5.0%
6.0%
0
400
800
1,200
1,600
2,000
2,400
2017 2018 2019 2020 2021 Thereafter
Scheduled principal amortization Mortgages payable
Floating Rate Mortgages and Lines of Credit Debentures payable
Weighted average interest rate
$ Millions
Weighted Avg. Interest R
ate on Maturing D
ebt
634832 767
867 907
1,894
*Reflects $300 million issuance of Series Z unsecured debenture with a coupon rate of 2.194%** Reflects maturity extension of Line of Credit to May 31, 2022

24
Leverage and Coverage Ratios & Targets
This slide contains references to non-GAAP Measures. For a definition of such measures please refer to RioCan’s June 30, 2017 MD&A.
Targeted Ratios
>3.00X
>2.25X
>1.10X
<8.0X
<80%
>200%
38% - 42%
>50%
Interest coverage ratio 3.74x 3.36x
Debt service coverage ratio 2.92x 2.61x
Fixed charge coverage ratio 1.12x 1.10x
Debt to Adjusted EBITDA 7.51x 8.10x
Distributions as a percentage of FFO 82.0% 83.6%
Unencumbered Assets to Unsecured Debt 231% 240%
Debt to Assets (as at) 41.5% 40.0%
% NOI generated by unencumbered assets 52.6% 49.5%
Rolling 12 Months Ended
At RioCan’s interest June 30/17 Dec. 31/16

25
Growing NAV and Future Cash Flows
Organic Growth
Expansion and Redevelopment
Strategic Partners
Capital Recycling
Urban Transit Oriented Intensification

26
Organic Growth
Diversified lease rollover profile with less than 50% of leases renewing through 2021.• In Q2 2017, achieved renewal rent increases of 4.7% or $0.83 psf with an average renewal rate of $18.45psf. • Retention rate of 93.9% in the quarter.
(thousands except psf and % amounts) Portfolio NLA 2017 2018 2019 2020 2021Total 42,994 1,145 4,446 5,422 4,913 5,252
Square Feet expiring/portfolio NLA 2.7% 10.3% 12.6% 11.4% 12.2%
Total average net rent psf $20.44 $18.48 $18.84 $17.82 $17.93
Lease Expires
$6
$9
$12
$15
$18
$21
$24
0
1,000
2,000
3,000
4,000
5,000
6,000
2008 2009 2010 2011 2012 2013 2014 2015 2016 YTD2017
2017remaining
2018 2019 2020 2021
Ren
t PS
F $
Squ
are
feet
('00
0s)
Lease Maturity Schedule and Renewal History
Square feet expiring (left axis) Square feet renewed (left axis) Achieved Renewal Rent PSF
Expired Rent PSF Expiring Rent PSF

27
RioCan’s Urban Platform holds a number of sites where the possibility for additional density through residential exist, with potential to significantly
increase NAV of the portfolio:
• Properties with the greatest potential for residential intensification are located on or near transit linesCapitalize on trend in Canada’s six high growth markets towards “densifying” existing urban locations, driven by:
• Prohibitive costs of expanding infrastructure beyond urban boundaries and urban housing • Maximizing use of mass transit• Generate higher yields as land is already owned
RioCan has identified 75 projects, of which 46 have received Zoning Approvals
Increasing NAV Through Land Use IntensificationResidential Potential & Transit Oriented Development
Toronto
Montreal

28
Development Activity - Current Portfolio
(i) Represents the portion of the development pipeline where tenants have taken possession and is included in income producing properties.(ii) Represents the remaining portion of the NLA that is yet to be completed for the 38 active projects with detailed costs estimates as of June 30, 2017, including NLA for air right sales, and includes 0.6 million square feet of vacant NLA which is primarily former Target space prior to its redevelopment.
(i) Estimated density across the various components of the development pipeline is expressed as NLA, which represents approximately 90% of GFA for residential rental and inventory developments.(ii) PUD NLA includes NLA for air right sales in addition to commercial and residential rental NLA, but excludes NLA for condominiums and townhouse projects which are reported separately as Residential Inventory.(iii) Represents the density associated with the development of our residential condominiums and townhouse projects, that are to be sold in the normal course of business upon project completion.
Zoning Status
Project Phasing and NLA Completion
Number of
Projects PUD (ii)Residential
Inventory (iii) CommercialResidential
RentalAir Rights
SalesZoning approved 46 44.6% 10,746 9,986 760 4,463 4,934 589Zoning under application submitted 8 29.4% 7,071 7,071 - 1,737 4,898 436Future estimated density 21 26.0% 6,270 6,270 - 816 5,454 -Total development pipeline 75 100.0% 24,087 23,327 760 7,016 15,286 1,025
Estimated Density (NLA) at RioCan's Interest (i)% of square
footage zoned
TotalComponents of PUD
(thousands of Completedsquare feet) (IPP)Greenfield Development 480 321 158 8 47 107 -Urban Intensification 2,924 64 2,860 - 208 571 2,081Subtotal 3,404 385 3,019 8 255 675 2,081Expansion & Redevelopment 983 - 983 383 427 27 146Active projects with detailed cost 4,387 385 4,022 391 682 702 2,227
% of Completion by year 100 11.3 0.2 7.5 19.8 61.2Cumulative % completion by year 11.3 11.5 19 38.8 100
Greenfield Development and Urban Intensification
At RioCan's Interest
Total PUD 2017 remainder
2018 2019 2020+

29
Development Activity – Estimated Project Costs
(i) Total NLA includes NLA from commercial, residential rental and air rights sales and excludes NLA from residential inventory.(ii) Development lands and other includes excess land and other properties that could be used for future developments.(iii) Represents conditional land and air right sales, which management considers as reductions to its overall development expenditures that the Trust will sell upon completion, instead of holding for long-term income.
The Trust has been funding and will continue to fund its development pipeline through its capital recycling program and strategic development partnerships.
• 38 active PUD projects with detailed costs estimates, plus the current carrying costs of the development lands and other, net of projected proceeds from dispositions.
• represents 4.4 million square feet or 18.8% of RioCan's estimated PUD development pipeline on an NLA basis• total estimated project costs excludes costs relating to condominiums or townhouse developments.
On an aggregate basis including rental residential projects, RioCan’s greenfield development and urban intensification projects are currently estimated to generate a
weighted average NOI yield of approximately 5% to 6%
Number of
Projects Completed
(IPP)
Greenfield Development 2 480 $181,401 $87,624 $60,251 $147,875 $33,526
Urban Intensification 12 2,924 1,416,694 20,968 390,946 411,914 1,004,780
Subtotal 14 3,404 1,598,095 108,592 451,197 559,789 1,038,306
Expansion & Redevelopment 24 983 510,062 - 275,007 275,007 235,055
Active projects with detailed cost estimates
38 4,387 $2,108,157 $108,592 $726,204 $834,796 $1,273,361
Development Lands and Other (ii) $280,242 - $280,242 $280,242 -
Projected proceeds from dispositions (iii) (163,569) - - - (163,569)
Total $2,224,830 $108,592 $1,006,446 $1,115,038 $1,109,792
$1,021,028 PUD Fair Value to Date
At RioCan's Interest
(thousands of dollars or thousands of square feet)
Total PUD NLA (i)
Total PUD Estimated
Costs
Costs incurred to dateEstimated PUD
Costs to CompletePUD Total

30
Development Activities - Residential IntensificationInvestment Rationale
• Demand for professionally managed, quality apartment units in Canada remains high.
• Rental rates in key major markets, like Toronto, have reached a level where the economics are attractive for redeveloping certain centres in urban, transit oriented locations. RioCan owns the underlying land, often at irreplaceable locations, thus giving it the unique opportunity to create a tremendous amount of value.
• RioCan is committed to ensuring that the individual properties in its portfolio are utilized to their highest and best use, and the addition of a residential component will enhance the value of the underlying retail element of RioCan’s property.
• It is a sector that allows a steady and continuous income stream with a growth profile that will serve as a hedge against inflation. The residential rental sector serves to diversify RioCan’s retail portfolio.
• RioCan has focused on mixed use projects containing a mix of condominium and multi-unit rental residential buildings. RioCan has identified nearly 75 projects that it deems to be strong intensification opportunities all located in Canada’s six major markets. Yonge Sheppard Centre

31
Land Use Intensification – Residential PotentialGreater Toronto Area Case Study

32
Land Use Intensification – Residential PotentialHurontario – Main LRT (Mississauga and Brampton LRT)
RioCan Sandalwood Square Shopping Centre
Shoppers World Brampton
RioCan Grand Park
With three shopping centres and approximately 82 acres of land on this LRT line, RioCan is very well positioned to take advantage of future intensification opportunities.

33
Residential AreaGloucester Residential
Development Activities Residential Intensification
• 7.1 acre development site located adjacent to RioCan's Gloucester Silver City Shopping Centre in Ottawa, Ontario.
• RioCan and Killam entered into 50/50 joint venture to develop the property.
• RioCan will act as the development manager, and upon completion, Killam will act as the residential property manager.
• The site has zoning approval for a total of four residential towers containing up to an aggregate of 840 units.
• Site work has commenced and occupancy is anticipated in mid-2019.
• The first phase of the development will include a 217,000 square foot, 23-storey tower containing approximately 222 units.
• This leading edge development will maximize efficiency with the incorporation of a geothermal energy system for the building's heating and cooling.

34
Location: Toronto, OntarioIntersection: Yonge & Eglinton Total Proposed Commercial (NLA): 43,500 square feetRetail NLA (incl. in Commercial): 23,000 Square feet*Proposed Rental Residential Units: ~460 UnitsDesign Concept: Urban RetailAnticipated Completion: 2018 & 2019RioCan Interest 50%
Yonge & Eglinton Northeast Corner - Toronto, Ontario
• Located across the street from RioCan’s head office.
• 59 storey condominium tower at corner of Yonge and Eglinton and a 36 storey rental tower fronting Roehampton Avenue (first street north of Eglinton).
• Condominium portion of the project is 100% pre-sold.
• North tower to be developed as rental residential. Current plans are for a 466 unit residential apartment building.
• In September 2017, RioCan announced that it had entered into an agreement to acquire the remaining 50% interest in the rental residential units from its partners.
• RioCan will purchase 100% of the retail NLA at a 7% capitalization rate upon completion of the project. Anchored by 18,000 sf TD Bank.
Investing for the Future - Creating New Cash Flow SourcesResidential Intensification

35
• Acquired in 2007 for $22.8 million.
• Located at the busy intersection of Bayview Avenue and Eglinton Avenue in midtown Toronto.
• The site benefits from excellent demographics and is adjacent to a stop along the proposed Eglinton LRT line.
• RioCan has filed for rezoning to permit a 316,000 sf mixed use, retail/residential redevelopment project.
• Recently entered into a joint venture with Concert Real Estate Corporation to develop the project:
• Concert paid RioCan $26.3 million for a 50% interest in the development.
• Both parties will share in the development costs on a 50/50 basis.
• Concert will be the development manager and property manager for residential portion on completion.
• RioCan will be the retail property manager on completion.
RioCan has a number of Urban Intensification opportunities in the GTA market
Sunnybrook Plaza, Toronto, ON
Proposed
Investing for the Future Creating New Cash Flow SourcesResidential Intensification
36
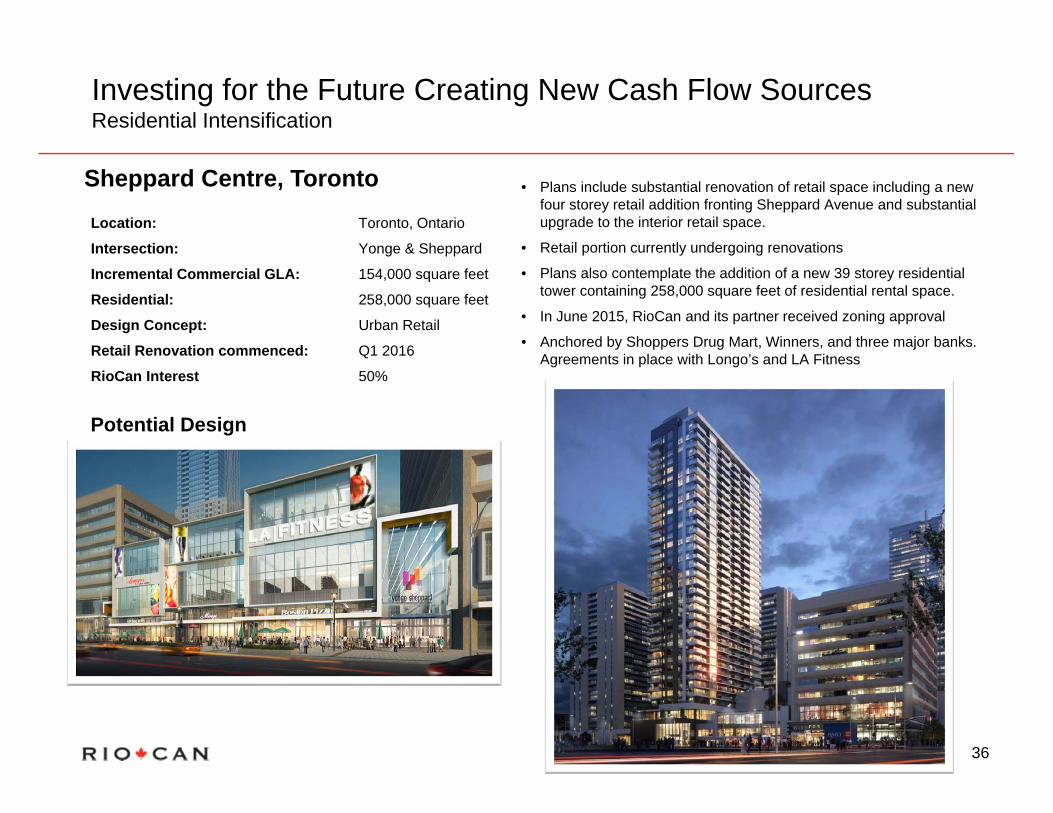
Sheppard Centre, Toronto Location: Toronto, Ontario
Intersection: Yonge & Sheppard
Incremental Commercial GLA: 154,000 square feet
Residential: 258,000 square feet
Design Concept: Urban Retail
Retail Renovation commenced: Q1 2016
RioCan Interest 50%
• Plans include substantial renovation of retail space including a new four storey retail addition fronting Sheppard Avenue and substantial upgrade to the interior retail space.
• Retail portion currently undergoing renovations
• Plans also contemplate the addition of a new 39 storey residential tower containing 258,000 square feet of residential rental space.
• In June 2015, RioCan and its partner received zoning approval
• Anchored by Shoppers Drug Mart, Winners, and three major banks. Agreements in place with Longo’s and LA Fitness
Potential Design
Investing for the Future Creating New Cash Flow SourcesResidential Intensification

37
Development Pipeline
• RioCan and its partners have received an Official Plan Amendment from The City of Toronto for approximately 3.1 million sf. of Gross Floor Area.
• Project is expected to be approximately 3.0 million sf. of mixed use space including approximately 1.5 million sf. of retail and office space and 1.5 million sf. of residential space.
RioCan, Allied Properties REIT, & Diamond Corporation Joint Venture
The site is approximately 7.7 acres.

38
Development Pipeline
• The joint venture is structured on a 40/40/20 basis between RioCan, Allied and Diamond. RioCan and Allied will act as joint development and construction managers. Upon completion of any projects RioCan will act as property manager for any retail portion of the property and Allied will act as property manager for any office portion.
• Entered into an agreement with Tridel and Woodbourne to sell the residential density at the project. RioCan will retain a 50% interest in one of the towers.
• Demolition and site work commenced in Q2 2017
RioCan, Allied Properties REIT, & Diamond Corporation Joint Venture

39
The Well
Exterior Concept Open air pedestrian walkway
RioCan, Allied Properties REIT, & Diamond Corporation Joint Venture

40
Floorplan Market Hall
The WellRioCan, Allied Properties REIT, & Diamond Corporation Joint Venture
Food Hall
The Well will bring a truly unique modern market concept to Toronto with food shopping, discovery, learning and tasting. The old-world inspired Food Market will be brimming with fresh local produce, quality meat and seafood and artisan food and beverage.
The Well’s Food Hall will transform the traditional food court into an elegant, urban food experience. Here upscale kitchens will offer an exciting array of multicultural food to satiate Toronto foodies whether they want to grab something on the go or stay and linger.

41
RioCan and Allied Properties announced in July 2012 that they had entered into a joint venture arrangement on a non exclusive basis to acquire sites in the urban areas of major Canadian cities that are suitable for mixed use intensification.
The joint venture is structured on a 50/50 basis between RioCan and Allied. Upon completion of any projects RioCan will act as property manager for any retail portion of the property and Allied will act as property manager for any office portion.
First two sites to be developed are:• King Portland Centre which will be developed into a mixed
use complex with approx. 425,000 square feet of gross floor area in Toronto, Ontario. Office component 93% leased with Shopify and Indigo.
• Construction commenced development of this project Q2 2016.
• College and Manning will be developed into a mixed use complex with approx. 113,000 square feet, including 63,000 square feet of commercial space, and 50,000 square feet of residential density.
Development PipelineRioCan & Allied Properties REIT Joint Venture
King Portland Centre
College and Manning

42
Development PipelineGreenfield Development
Sage Hill Crossing, Calgary
• Sage Hill Crossing, a 32 acre greenfield development site in Northwest Calgary.
• RioCan owns the development on a 50/50 basis with KingSett Capital.
• Development commenced in 2013, with completion expected in 2018. 370,000 square feet (185,000 sf at RioCan’s interest) of this development has been transferred to income producing as at June 30, 2017.
• Once completed, the anticipated gross leasable area is 384,000 square feet of retail use.
• The property is 94% leased with Walmart and Loblaws as anchor tenants. Walmart commenced operations in January 2015. Loblaws opened in January 2016.
• Other major tenants include, RBC, Scotiabank, McDonalds, Liquor Max, Bulk Barn and London Drugs.
• RioCan is responsible for the development, management and leasing of the property.

43
Creating Value in existing urban locations
RioCan Yonge Eglinton Centre –The CubeLocation: Toronto, OntarioIntersection: Yonge & Eglinton Total GLA: 45,000 square feet Design Concept: Urban RetailConstruction Start: Q2 2013Completed: 2015RioCan Interest: 100%Occupancy: Retail 98%, Office 99%
RioCan has leased the media screens to CBS Outdoor Canada, which generates additional revenue at the site.
Before After

44
Creating Value – Backfill of Target spaces
BURLINGTON MALL
• Rental revenue from vacated Target space will generate will be about 36 PERCENT HIGHER ($3.9 million per year) than what was generated by Target.
• Increased tenant DIVERSITY• Improved foot traffic and greater
customer APPEAL

45
TRIBUTE JOINT VENTURE
FUTURERESIDENTIAL
Creating Value – Windfields Farm
• 100+ acre site at Hwy 407 and Simcoe Road in Oshawa Ontario. Near University of Ontario Institute of Technology
• Originally purchased with retail uses in mind• Market for retail development of that size (> 1 million square feet) is not there• Extracting value by partnering with Tribute Communities for residential together with commercial
development • Will generate sizable gains in 2018 through 2020 as townhouse units are completed. Phase one of 169
townhomes virtually sold out.

46
NON-GAAP MEASURESRioCan’s consolidated financial statements are prepared in accordance with IFRS. Consistent with RioCan’s management framework, management usescertain financial measures to assess RioCan’s financial performance, which are not generally accepted accounting principles (GAAP) under IFRS.
The following measures, RioCan’s Proportionate Share (or Interest), Funds From Operations (“FFO”), Net Operating Income (“NOI”), AdjustedEarnings before interest, taxes, depreciation and amortization (“Adjusted EBITDA”), Debt to Adjusted EBITDA, Same Property NOI, InterestCoverage, Debt Service Coverage, Fixed Charge Coverage, and Total Enterprise Value as well as other measures discussed in this presentation, do nothave a standardized definition prescribed by IFRS and are, therefore, unlikely to be comparable to similar measures presented by other reporting issuers.
Non-GAAP measures should not be considered as alternatives to net earnings or comparable metrics determined in accordance with IFRS as indicators ofRioCan’s performance, liquidity, cash flow, and profitability. For a full definition of these measures, please refer to the “Non-GAAP Measures” in RioCan’sManagement’s Discussion and Analysis for the period ended June 30, 2017. RioCan uses these measures to better assess the Trust’s underlying performanceand provides these additional measures so that investors may do the same.
Certain information included in this presentation contains forward-looking statements within the meaning of applicable securities laws including, among others,statements concerning our objectives, our strategies to achieve those objectives, as well as statements with respect to management's beliefs, plans, estimates,and intentions, and similar statements concerning anticipated future events, results, circumstances, performance or expectations that are not historical facts.Certain material factors, estimates or assumptions were applied in drawing a conclusion or making a forecast or projection as reflected in these statements andactual results could differ materially from such conclusions, forecasts or projections.
Additional information on the material risks that could cause our actual results to differ materially from the conclusions, forecast or projections in thesestatements and the material factors, estimates or assumptions that were applied in drawing a conclusion or making a forecast or projection as reflected in theforward-looking information can be found in our most recent annual information form and annual report that are available on our website and atwww.sedar.com.
Except as required by applicable law, RioCan undertakes no obligation to publicly update or revise any forward-looking statement, whether as a result of newinformation, future events or otherwise.
46
FORWARD LOOKING INFORMATION