Q2 2015 results - Shire: Investor...
34
Flemming Ornskov, MD CEO Jeff Poulton CFO Q2 2015 results Progressing our transformation to a leading global biotech, whilst upgrading full year earnings guidance July 23, 2015
Transcript of Q2 2015 results - Shire: Investor...

Flemming Ornskov, MD CEO
Jeff Poulton CFO
Q2 2015 results Progressing our transformation to a leading global biotech, whilst upgrading full year earnings guidance July 23, 2015
2
Statements included in this announcement that are not historical facts, including without limitation statements concerning our 10x20 ambitions and targets, are forward-looking statements. Such forward-looking statements involve a number of risks and uncertainties and are subject to change at any time. In the event such risks or uncertainties materialize, Shire’s results could be materially adversely affected. The risks and uncertainties include, but are not limited to, that: • Shire’s products may not be a commercial success; • product sales from ADDERALL XR® and INTUNIV® are subject to generic competition; • the failure to obtain and maintain reimbursement, or an adequate level of reimbursement, by third-party payers in a timely manner for Shire's
products may affect future revenues, financial condition and results of operations; • Shire conducts its own manufacturing operations for certain of its products and is reliant on third party contract manufacturers to manufacture
other products and to provide goods and services. Some of the Shire’s products or ingredients are only available from a single approved source for manufacture. Any disruption to the supply chain for any of the Shire’s products may result in Shire being unable to continue marketing or developing a product or may result in Shire being unable to do so on a commercially viable basis for some period of time;
• the manufacture of Shire’s products is subject to extensive oversight by various regulatory agencies. Regulatory approvals or interventions associated with changes to manufacturing sites, ingredients or manufacturing processes could lead to significant delays, an increase in operating costs, lost product sales, an interruption of research activities or the delay of new product launches;
• Shire has a portfolio of products in various stages of research and development. The successful development of these products is highly uncertain and requires significant expenditures and time, and there is no guarantee that these products will receive regulatory approval;
• the actions of certain customers could affect Shire's ability to sell or market products profitably. Fluctuations in buying or distribution patterns by such customers can adversely affect Shire’s revenues, financial conditions or results of operations;
• investigations or enforcement action by regulatory authorities or law enforcement agencies relating to Shire’s activities in the highly regulated markets in which it operates may result in significant legal costs and the payment of substantial compensation or fines;
• adverse outcomes in legal matters and other disputes, including Shire’s ability to enforce and defend patents and other intellectual property rights required for its business, could have a material adverse effect on Shire’s revenues, financial condition or results of operations;
• Shire faces intense competition for highly qualified personnel from other companies and organizations. Shire is undergoing a corporate reorganization and was the subject of an unsuccessful acquisition proposal and the consequent uncertainty could adversely affect Shire’s ability to attract and/or retain the highly skilled personnel needed for Shire to meet its strategic objectives;
• failure to achieve Shire’s strategic objectives with respect to the acquisition of NPS Pharmaceuticals, Inc. may adversely affect Shire’s financial condition and results of operations;
and other risks and uncertainties detailed from time to time in Shire’s filings with the US Securities and Exchange Commission, including its most recent Annual Report on Form 10-K.
“SAFE HARBOR” statement under the Private Securities Litigation Reform Act of 1995

3
Our continuous transformation
2013-2015 Becoming OneShire • Step-change in performance • Effective and efficient organization • Set basis for long-term growth
Investing to create further long-term value
2013 2014 2015 2016 2017 2018 2019 2020+
2014-2020+ Building a leading global biotech company • Creating scale and momentum • Culture of bold innovation –
internal and external • Patient-centric Rare Diseases
mindset to all business On track to meet 10x20 targets

4
Q2 2015: Progress towards becoming a leading global biotechnology company
Strong US launch for NATPARA in HPT
Continued strong growth for VYVANSE post BED launch
GATTEX performing well; implementation of enhanced commercial plans
GROWTH Double digit CER(1) product sales growth excluding INTUNIV
Phase 3 pediatrics study for SHP465 initiated six weeks ahead of schedule
Positive End of Phase 2 meeting with FDA for SHP620; considering progressing into Phase 3 in 2016
OPUS3 study for lifitegrast fully enrolled; results expected Q4 2015
INNOVATION
Significant investment in expected future growth drivers, including VYVANSE BED, GATTEX/REVESTIVE and NATPARA Phase 2 data received in three rare
liver indications with SHP625; considering options for a possible path forward
Non GAAP diluted earnings per ADS growth guidance increased to mid-to-high single digit percent range for the full year
(1) Growth at Constant exchange rates (“CER”), a Non GAAP financial measure. CER performance is determined by comparing 2015 performance (restated using 2014 exchange rates) to actual 2014 reported performance. See slide 34 for a list of items excluded from the US GAAP equivalent used to calculate all Non GAAP measures detailed above. A reconciliation of Non GAAP financial measures to the most directly comparable measure under US GAAP is presented in Shire's Q2 2015 earnings release on pages 21 to 26.

5
Delivering double digit core product sales(1) growth while investing for the future
$1,470m
+$171m
$1,476m
• Core product sales excluding INTUNIV growing 12% on a constant exchange rate basis(2)(4)
• Continuing to make significant investment in expected future growth drivers: VYVANSE BED, GATTEX/REVESTIVE and NATPARA
• H1 Non GAAP diluted earnings per ADS(3)(4) up 9% on a reported basis; 13% on a CER basis(2)(4)
-$91m
-$74m
Q2 2014 Core products
INTUNIV FX Q2 2015
GROWTH
+12% -7%
-5%
Product Sales
Non GAAP diluted earnings per ADS growth guidance increased to mid-to-high single digit percent range for the full year(3)(4)
(1) Results include NPS Pharmaceuticals Inc. in 2015 (acquired on February 21, 2015). (2) Growth in constant exchange rate (“CER”). This is a Non GAAP financial measure. CER performance is determined by comparing 2015 performance (restated using average 2014 foreign exchange rates for the relevant
period) to actual 2014 reported performance. (3) This is a Non GAAP financial measure. The most directly comparable measure under US GAAP is EPS-ADS (H1 2015: $2.88, H1 2014: $3.83). (4) See slide 34 for a list of items excluded from the US GAAP equivalent used to calculate all Non GAAP measures detailed above. A reconciliation of Non GAAP financial measures to the most directly comparable measure
under US GAAP is presented in Shire's Q2 2015 earnings release on pages 21 to 26.

6
Growth across the product portfolio
(1) Growth rates are at Constant exchange rates (“CER”), a Non GAAP financial measure. CER performance is determined by comparing 2015 performance (restated using 2014 exchange rates) to actual 2014 reported performance. See slide 34 for a list of items excluded from the US GAAP equivalent used to calculate all Non GAAP measures detailed above. A reconciliation of Non GAAP financial measures to the most directly comparable measure under US GAAP is presented in Shire's Q2 2015 earnings release on pages 21 to 26.
(2) GATTEX refers to pro-forma growth including product sales recorded by NPS prior to acquisition by Shire on a CER basis.
CINRYZE sales $139M; +8%(1)
• More patients on therapy and price increase in US • Destocking reduced Q2 sales; underlying demand and patient accruals remain strong
FIRAZYR sales $104M; +20%(1) • Increased number of patients on therapy and higher price • Continued double digit growth driven by new patient additions
VYVANSE sales $425M; +20%(1) • US growth driven by volume gains (TRx up 7.7% YoY), price, and stocking • International growth continues to benefit from gains in established markets • Reported top-line results for VYVANSE in BED maintenance study; sNDA to be filed by year end
GATTEX sales $37M; +72%(2) • Strong performance in US since acquisition of NPS; over 500 patients on therapy in US • International roll out on track; encouraging early results in Germany
GROWTH
NATPARA sales $6M • Strong US launch • ~ 1900 HCPs REMS trained; ~ 200 patients on therapy
LIALDA sales $158M; +12%(1)
• Continued strong market share growth in US; +3.3 percentage points vs June 2014 • Continued lead in US promotional share of voice in the 5-ASA category

7
Positive momentum in VYVANSE Rx trends continues post BED approval GROWTH
• Since launch of VYVANSE for BED in Q1, we have seen a steady increase in our above market performance resulting in YoY share growth
• The ADHD “summer dip” has not been as steep as previous years
• Set to execute in the back-to-school season while maintaining our adult momentum
Source: weekly IMS data End of Q2 is week 26
Weekly market share
Rolling 4 week YoY TRx growth: OVERALL – VYVANSE vs. ADHD market
Rolling 4-week YoY adult TRx growth: VYVANSE is consistently outperforming the
adult market
11.5%
12.2%
8.4%
10.3%
9.1%
10.4% 9.7% 9.7%
11.5%
10.5%
11.9% 12.8%
10.7%
9.0%
12.4%
11.5%
14.4% 14.9%
15.6%
17.8%
16.9%
6 7 8 9 10 11 12 13 14 15 16 17 18 19 20 21 22 23 24 25 26 27 28
2015 2015
ADHD VYVANSE
Above Market
6.6%
3.5% 6.0%
3.7%
5.8%
5.7%
7.6%
6.7%
5.5%
7.2%
3.4%
6.7%
4.2%
8.8% 8.9%
11.2%
10.4%
1 3 5 7 9 11 13 15 17 19 21 23 25 27
16.3%
16.6%
16.8%
16.2% 16.2%
16.1%
15.5%
15.7%
15.9%
16.1%
16.3%
16.5%
16.7%
16.9%
6 8 10 12 14 16 18 20 22 24 26 28 30 32 34 36 38 40 42 44 46 48 50 52
2013 2014 2015
BED approval
Week Week
Week

8
Leveraging Shire’s capabilities to grow GATTEX
• New field based patient support role (Onboarding & Access Specialist/OAS) to aid with initiation of therapy
• OAS also supports early experience with GATTEX
• Legacy NPS GATTEX sales team dedicated to converting patient leads • Over 500 patients on therapy in US
• US physician database analysed, segmented and prioritized based on probability of treating an SBS patient to better direct field efforts
• Using existing Shire GI salesforce to improve awareness of SBS and identify eligible patients with prioritized physicians
• Adding telesales support to cover lower priority targets
• Expanding footprint for GATTEX/REVESTIVE outside of the US using Shire’s international infrastructure
• Final stages of Pricing & Reimbursement negotiations in France and Germany
GROWTH
Three strategies for US sales growth
Patient Identification
Patient Conversion
Patient Persistence
International roll-out on track

9
Strong start for Natpara in the US
• NATPARA launched in the US April 1, 2015 • NATPAR submitted in EU December 2014; filing on track with estimated approval in Q1 2016
• Positive response from Endocrinologists to NATPARA • Over 70% of target US physicians REMS(1) trained (~1,900) as at end of June 2015 • Approximately 260 physicians have submitted a patient referral form
GROWTH
• 50-strong specialist sales force in place • Successful launch meeting and promotion underway • Initial focus on REMS registration transitioning to patient finding and Rx generation
• Over 325 patient referral forms received as of end of June 2015; ~ 200 patients on therapy • Primarily new patients due to ongoing BID(2) post approval commitment study • Implementing enhanced patient access support to increase flow of patients from Rx to
therapy
(1) REMS: Risk Evaluation and Mitigation Strategy. (2) BID: twice daily.
Target physicians
Launch
Patients
Salesforce

Our purpose We enable people with life-altering conditions to lead better lives.
Strong and innovative pipeline

11
Late stage pipeline poised to deliver
Preclinical Phase 1 Phase 2 Phase 3 Registration
TH / GCH1 GenePod
Parkinson’s Subset
26 Research Programs
SHP628 Renal Impairment
SHP608
Dystrophic E.Bullosa
SHP631
Hunter Syndrome
SHP630
adRP
SHP624
Heme B Gene Edit
SHP611 MLD
(Ph 1/2)
SHP616 (CINRYZE SC)
HAE Prophylaxis
SHP627 Focal Segmental
Glomerulosclerosis
SHP626 Non-Alcoholic
Steatohepatitis
SHP622 Friedreich’s Ataxia
SHP616 (CINRYZE) Acute Neuromyelitis
Optica
SHP610
Sanfilippo A
LDX (Japan) ADHD
SHP607 Prevention of ROP
SHP609
Hunter IT
SHP625 Primary Biliary Cirrhosis
SHP625 Progressive Familial
Intrahepatic Cholestasis
SHP616 (CINRYZE) Acute Antibody
Mediated Rejection
SHP625 Primary Sclerosing
Cholangitis
SHP625 Alagille Syndrome
SHP620 (maribavir) CMV in transplant
patients
SHP621 (Former Meritage OBS)
Eosinophilic esophagitis
FIRAZYR (Japan)
HAE
FIRAZYR ACE inhibitor-
induced AE
SHP616 (CINRYZE) (Japan)
HAE prophylaxis
SHP606 (lifitegrast)
Dry eye disease
SHP555 (US) Chronic Constipation
INTUNIV (Japan) ADHD
NATPAR (EU) Hypoparathyroidism
INTUNIV (EU) ADHD
Rare Diseases Programs
SHP465 ADHD
INNOVATION
Changes since Q1 2015 • SHP631 has entered Phase 1 studies • SHP616 (CINRYZE) in PNH and SHP602 discontinued • Totality of SHP625 data being assessed; programs under review

12
Q2 2015 Pipeline updates
• Lifitegrast (SHP606) under FDA review for the treatment of the signs and symptoms of dry eye disease; PDUFA date October 25, 2015
• No advisory committee meeting has been scheduled by FDA for the current review cycle
• OPUS 3 on track for topline results in Q4 2015 • Last patient first visit accomplished 6 weeks ahead of schedule
• Our market research, with both physicians and patients, shows a significant medical need for a differentiated product in this category
• Remain confident in totality of our data from existing development program of over 1,800 patients
SHP606 (lifitegrast)
Dry eye disease
• First patient has entered the planned Phase 3 short-term efficacy and safety study in pediatric patients with ADHD (ages 6-17) ahead of schedule; study completion targeted for Q4 2016
• FDA Class 2 submission expected by Q2 2017; anticipate a 6 month review time
INNOVATION
SHP465 ADHD

13
Q2 2015 Pipeline updates INNOVATION
SHP625 ALGS/PBC/PFIC/PSC
• In late June 2015 Shire conducted an end of Phase 2 meeting with the FDA and received further clarity on path forward
• Based upon this feedback, Shire is considering progressing the program into Phase 3 in 2016
• Phase 2 data received in three rare cholestatic liver indications (ALGS, PBC, PFIC); primary endpoints were not met
• In some patients treated with drug there was a modest decrease in serum bile acid levels and a modest decrease in itch scores
• Preliminary results of the interim analysis of the PFIC study demonstrated that in a subset of patients there was a profound decrease in serum bile acid levels, a significant decrease in itch score and in this subset of patients where there were elevated levels of biomarkers associated with liver damage at baseline there was a normalization of these biomarkers
• We are currently considering the totality of data from these studies and what path forward, if any, there may be with SHP 625
SHP620 CMV

14
Data read outs expected in 2015
✓
2015
VYVANSE BED Launch ✓ SHP611
MLD Phase 1/2 head line data
SHP625 ALGS (IMAGO study) Phase 2 head line data
rhPTH[1-84] NATPARA Launch
✓
SHP606 lifitegrast PDUFA: 25 October
SHP606 lifitegrast NDA Filing
✓
SHP620 Maribavir Phase 2 head line data ✓
SHP625 PBC Phase 2 head line data
SHP625 ALGS (ITCH study) Phase 2 head line data
Registration & Phase 4
Phase 3
Phase 2
Phase 1/2 ✓
INNOVATION
Note Future readouts of SHP625 program under review.
✓
✓ FIRAZYR ACE inhibitor-induced AE
SHP625 PFIC Interim Phase 2 data
✓
VYVANSE BED maintenance ✓
SHP606 lifitegrast OPUS 3 head line data
Intuniv EU approval

Our purpose We enable people with life-altering conditions to lead better lives.
Financial Review
Jeff Poulton, Chief Financial Officer

16
(1) Results include NPS Pharmaceuticals Inc. in 2015 (acquired on February 21, 2015). (2) This is a Non GAAP financial measure. Constant exchange rates ("CER") performance is determined by comparing 2015 performance (restated using average 2014 foreign exchange rates for the relevant period) to actual 2014 reported performance. (3) This is a Non GAAP financial measure. The most directly comparable measure under US GAAP is Net Income (Q2 2015: $160m, Q2 2014: $523m). (4) This is a Non GAAP financial measure. The most directly comparable measure under US GAAP is Net Income margin (Q2 2015: 10%, Q2 2014: 35%). (5) Non GAAP earnings before interest, tax, depreciation and amortization (“EBITDA”) as a percentage of product sales, excluding royalties and other revenues. (6) This is a Non GAAP financial measure. The most directly comparable measure under US GAAP is EPS-ADS (Q2 2015: $0.81, Q2 2014: $2.66). (7) This is a Non GAAP financial measure. The most directly comparable measure under US GAAP is Net Cash provided by operating activities (Q2 2015: $452m, Q2 2014: $834m). (8) See slide 34 for a list of items excluded from the US GAAP equivalent used to calculate all Non GAAP measures detailed above. A reconciliation of Non GAAP financial measures to the most directly comparable measure under US GAAP is presented in
Shire's Q2 2015 earnings release on pages 21 to 26.
Double digit product sales growth (excluding INTUNIV at CER(1)(2)(8)) and continued investment for future growth
Q2 2015 $m(1)
Q2 2014 $m
Reported Growth CER(2)(8)
Product Sales 1,476 1,470 0% +6%
Product Sales excluding INTUNIV 1,467 1,370 +7% +12%
Royalties and Other Revenues 82 32 +150% +159%
Total Revenue 1,558 1,502 +4% +9%
Non GAAP EBITDA(3)(8) 654 675 -3% +1%
Non GAAP EBITDA margin(4)(5)(8) 39% 44% -5% points
Non GAAP diluted EPS – ADS(6)(8) 2.63 2.67 -2% +3%
Non GAAP Cash Generation(7)(8) 505 659 -23%
Note: US GAAP operating income 133 338 -61%

17
(1) Results include NPS Pharma Inc. in 2015 (acquired on February 21, 2015). (2) Gattex growth on a pro-forma basis, including product sales recorded by NPS prior to acquisition by Shire. (3) This is a Non GAAP financial measure. Constant exchange rates ("CER") performance is determined by comparing 2015 performance (restated using average 2014 foreign exchange rates for the relevant period) to actual 2014 reported performance. (4) See slide 34 for a list of items excluded from the US GAAP equivalent used to calculate all Non GAAP measures detailed above. A reconciliation of Non GAAP financial measures to the most directly comparable measure under US GAAP is presented in
Shire's Q2 2015 earnings release on pages 21 to 26.
$1,470m $1,476m
Q2 2014 OTHERPRODUCT
SALES
TOTAL FXIMPACT
Q2 2015
CER(3)(4): Core product sales up $171M or 12%
FX headwinds held back reported product sales by $74m or 5%
INTUNIV generic entry held back reported product sales by $91m or 7%
Strong product sales growth in Q2 2015, up 12% (excluding INTUNIV and at CER(1)(3)(4))
ProductQ2 2015
$m(1)Q2 2014
$mReported Growth
CER Growth(3)(4)
VYVANSE 425 360 +18% +20%LIALDA/MEZAVANT 158 144 +10% +12%ELAPRASE 147 152 -4% +9%CINRYZE 139 130 +7% +8%REPLAGAL 117 131 -10% +4%FIRAZYR 104 89 +17% +20%ADDERALL XR 86 100 -14% -13%VPRIV 85 90 -6% +3%PENTASA 66 63 +5% +5%GATTEX(1) 37 0 n/a n/aNATPARA(1) 6 0 n/a n/aOther 97 111 -13% -2%Total Product Sales excluding INTUNIV 1,467 1,370 +7% +12%
INTUNIV 9 100 -91% -90%
Total Product Sales 1,476 1,470 +0% +6%
GATTEX Pro-Forma Product Sales(2) 37 22 +70% +72%

18
Robust H1 2015 Non GAAP EBITDA margin(8)(9)(10) whilst investing for future growth
(1) Results from continuing operations including NPS Pharmaceuticals Inc. in 2015 (acquired on February 21, 2015) and ViroPharma Inc. in 2014 (acquired on January 24, 2014) and excluding DERMAGRAFT in 2014 (treated as a discontinued operation following divestment on January 17, 2014).
(2) This is a Non GAAP financial measure. The most directly comparable measure under US GAAP is R&D (H1 2015: +62%, H1 2014: +25%). (3) This is a Non GAAP financial measure. The most directly comparable measure under US GAAP is SG&A (H1 2015: +22%, H1 2014: +16%). (4) This is a Non GAAP financial measure. The most directly comparable measure under US GAAP is Combined R&D and SG&A (H1 2015: +38%, H1 2014: +19%). (5) This is a Non GAAP financial measure. The most directly comparable measure under US GAAP is Gross Margin (H1 2015: 84.3%, H1 2014: 81.8%). (6) This is a Non GAAP financial measure. The most directly comparable measure under US GAAP is R&D (H1 2015: 33%, H1 2014: 22%). (7) This is a Non GAAP financial measure. The most directly comparable measure under US GAAP is SG&A (H1 2015: 39%, H1 2014: 33%). (8) This is a Non GAAP financial measure. The most directly comparable measure under US GAAP is Net income Margin (H1 2015: 19%, H1 2014: 26%). (9) Excluding Royalties and Other Revenues. (10) See slide 34 for a list of items excluded from the US GAAP equivalent used to calculate all Non GAAP measures detailed above. A reconciliation of Non GAAP financial measures to the most directly comparable measure under US GAAP is presented in
Shire's Q2 2015 earnings release on pages 21 to 26.
Year on Year Change: H1 2015(1) H1 2014(1)
Product Sales +4% +20%
Product Sales excluding INTUNIV +11% +21%
Non GAAP R&D(2)(10) +6% -11%
Non GAAP SG&A(3)(10) +14% +7%
Combined Non GAAP R&D and SG&A(4)(10) +11% 0%
Ratios: H1 2015(1) H1 2014(1)
% of Product Sales
Non GAAP Gross Margin(5)(10) 85.9% 85.4%
Non GAAP R&D(6)(10) 15% 14%
Non GAAP SG&A(7)(10) 29% 27%
Non GAAP EBITDA(8)(9)(10) 42% 44%

19
Strong Non GAAP cash generation(1)(3) of $0.5B in Q2 2015 Non GAAP net debt(2)(3) of $2.25B at June 30, 2015
(1) This is a Non GAAP financial measure. The most directly comparable measure under US GAAP is Net cash provided by operating activities (Q2 2015: $452m, Q2 2014: $834m). (2) This is a Non GAAP financial measure. The most directly comparable measure under US GAAP is Cash and cash equivalents (June 30, 2015: $64m, December 31, 2014: $2,982m). (3) See slide 34 for a list of items excluded from the US GAAP equivalent used to calculate all Non GAAP measures detailed above. A reconciliation of Non GAAP financial measures to the most directly comparable
measure under US GAAP is presented in Shire's Q2 2015 earnings release on pages 21 to 26.
(2,918)
(10)
18
(110)
(300)
(50)
432
(20)
(53)
505 June 30, 2015
$m December 31, 2014
$m
Cash and cash equivalents 64 2,982
Long-term borrowings (74) -
Short-term borrowings (2,230) (850)
Other debt (13) (13)
Non GAAP Net (debt)/cash(2)(3) (2,253) 2,119
Non GAAP Cash Generation(1)(3)
Non GAAP Free Cash Flow(1)(3)
Dividend payment
Other investing and financing
Net Cash outflow YTD
Tax and Interest paid, net
Capital expenditure
Net repayment of facility and term loans
Net Cash outflow QTD
Payments in respect of business combinations

20
(1) Results from continuing operations including NPS Pharmaceuticals Inc. in 2015 (acquired on February 21, 2015) and ViroPharma Inc. in 2014 (acquired on January 24, 2014) and excluding DERMAGRAFT in 2014 (treated as a discontinued operation following divestment on January 17, 2014).
(2) Based on a latest assumption of a full year 2015 weighted average number of ordinary shares of 594 million. (3) See slide 34 for a list of items excluded from the US GAAP equivalent used to calculate all Non GAAP measures detailed above. A reconciliation of Non GAAP financial measures to the most directly comparable measure under US GAAP is presented in
Shire's Q2 2015 earnings release on pages 21 to 26. (4) This is a Non GAAP financial measure. Constant exchange rates ("CER") performance is determined by comparing 2015 guidance (restated using average 2014 foreign exchange rates for the relevant period) to actual 2014 reported performance.
Increased guidance for Non GAAP diluted earnings per ADS(2)(3) to growth in the mid-to-high single digits range
Our 2015 Outlook is based on an average of H1 2015 actual exchange rates and the June 30, 2015 exchange rates holding for H2 2015 (implied full year rates of Euro:$1.12, £:$1.55, CHF:$1.06, CAD:$0.81). The estimated impact of a 10% appreciation in the US Dollar against the respective currency, over the full year, on our 2015 Guidance is as follows:
Full Year 2015 Dynamics Direction Versus
FY 14(1) CER Growth (3)(4) Impact of FX Rates on Guidance Guidance
Total Product Sales High single digit growth -3 to 4% points 4-5% higher than
2014
Product Sales excluding INTUNIV Low teens growth Low double digit
Royalties & Other Revenues 45-55% higher than in 2014
Non GAAP Gross Margins(3) ~ Similar to 2014
Non GAAP Combined R&D and SG&A(3) High single digit growth
Non GAAP Net Interest/Other(3) ~ Broadly in line with 2014
Non GAAP Tax Rate(3) Core effective tax rate of 15-17%
Non GAAP diluted Earnings per ADS(2)(3) Low double digit growth -4 to 5% points Mid-to-high single
digit growth
Revenue Earnings
EUR (1.3%) (2.2%)
GBP (0.3%) (0.2%)
CHF (0.1%) 0.4%
CAD (0.3%) (0.4%)
Other (0.6%) (0.8%)
Guidance metrics increased since Q1 2015

Our purpose We enable people with life-altering conditions to lead better lives.
Summary
Flemming Ornskov, MD, Chief Executive Officer

22
Continued execution Delivering results in 2015 …
Delivering growth in
revenues and earnings
Execution of strategy is delivering
Investing for future growth
On track to become a leading biotech
Multiple data read outs
Execute on BD opportunities
Driving VYVANSE for BED in adults
Advancing lifitegrast for Dry Eye Disease
Leveraging NPS assets ✓ GROWTH
EFFICIENCY ✓
INNOVATION ✓
PEOPLE ✓ …and beyond

Questions and Answers

Our purpose We enable people with life-altering conditions to lead better lives.
APPENDIX
25
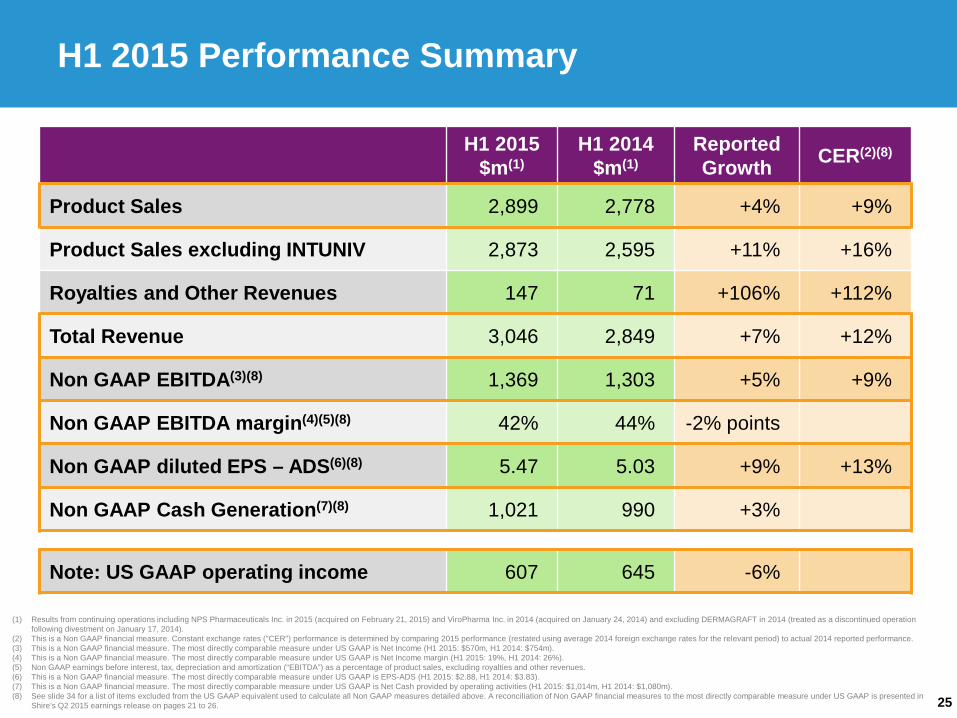
(1) Results from continuing operations including NPS Pharmaceuticals Inc. in 2015 (acquired on February 21, 2015) and ViroPharma Inc. in 2014 (acquired on January 24, 2014) and excluding DERMAGRAFT in 2014 (treated as a discontinued operation following divestment on January 17, 2014).
(2) This is a Non GAAP financial measure. Constant exchange rates ("CER") performance is determined by comparing 2015 performance (restated using average 2014 foreign exchange rates for the relevant period) to actual 2014 reported performance. (3) This is a Non GAAP financial measure. The most directly comparable measure under US GAAP is Net Income (H1 2015: $570m, H1 2014: $754m). (4) This is a Non GAAP financial measure. The most directly comparable measure under US GAAP is Net Income margin (H1 2015: 19%, H1 2014: 26%). (5) Non GAAP earnings before interest, tax, depreciation and amortization (“EBITDA”) as a percentage of product sales, excluding royalties and other revenues. (6) This is a Non GAAP financial measure. The most directly comparable measure under US GAAP is EPS-ADS (H1 2015: $2.88, H1 2014: $3.83). (7) This is a Non GAAP financial measure. The most directly comparable measure under US GAAP is Net Cash provided by operating activities (H1 2015: $1,014m, H1 2014: $1,080m). (8) See slide 34 for a list of items excluded from the US GAAP equivalent used to calculate all Non GAAP measures detailed above. A reconciliation of Non GAAP financial measures to the most directly comparable measure under US GAAP is presented in
Shire's Q2 2015 earnings release on pages 21 to 26.
H1 2015 Performance Summary
H1 2015 $m(1)
H1 2014 $m(1)
Reported Growth CER(2)(8)
Product Sales 2,899 2,778 +4% +9%
Product Sales excluding INTUNIV 2,873 2,595 +11% +16%
Royalties and Other Revenues 147 71 +106% +112%
Total Revenue 3,046 2,849 +7% +12%
Non GAAP EBITDA(3)(8) 1,369 1,303 +5% +9%
Non GAAP EBITDA margin(4)(5)(8) 42% 44% -2% points
Non GAAP diluted EPS – ADS(6)(8) 5.47 5.03 +9% +13%
Non GAAP Cash Generation(7)(8) 1,021 990 +3%
Note: US GAAP operating income 607 645 -6%

26
Q2 2015 Financial Ratios
(1) Results include NPS Pharmaceuticals Inc. in 2015 (acquired on February 21, 2015). (2) This is a Non GAAP financial measure. The most directly comparable measure under US GAAP is R&D (Q2 2015: +228%, Q2 2014: -8%). (3) This is a Non GAAP financial measure. The most directly comparable measure under US GAAP is SG&A (Q2 2015: +26%, Q2 2014: +21%). (4) This is a Non GAAP financial measure. The most directly comparable measure under US GAAP is Combined R&D and SG&A (Q2 2015: +91%, Q2 2014: +10%). (5) This is a Non GAAP financial measure. The most directly comparable measure under US GAAP is Gross Margin (Q2 2015: 84.6%, Q2 2014: 81.2%). (6) This is a Non GAAP financial measure. The most directly comparable measure under US GAAP is R&D (Q2 2015: 53%, Q2 2014: 16%). (7) This is a Non GAAP financial measure. The most directly comparable measure under US GAAP is SG&A (Q2 2015: 42%, Q2 2014: 34%) (8) This is a Non GAAP financial measure. The most directly comparable measure under US GAAP is Net income Margin (Q2 2015: 10%, Q2 2014: 35%). (9) Excluding Royalties and Other Revenues. (10) See slide 34 for a list of items excluded from the US GAAP equivalent used to calculate all Non GAAP measures detailed above. A reconciliation of Non GAAP financial measures to the most directly comparable measure under US GAAP is presented in
Shire's Q2 2015 earnings release on pages 21 to 26.
Year on Year Change: Q2 2015(1) Q2 2014
Product Sales 0% +22%
Product Sales excluding INTUNIV +7% +23%
Non GAAP R&D(2)(10) +14% -10%
Non GAAP SG&A(3)(10) +17% +10%
Combined Non GAAP R&D and SG&A(4)(10) +16% +2%
Ratios: Q2 2015(1) Q2 2014
% of Product Sales
Non GAAP Gross Margin(5)(10) 86.0% 84.7%
Non GAAP R&D(6)(10) 16% 14%
Non GAAP SG&A(7)(10) 31% 27%
Non GAAP EBITDA(8)(9)(10) 39% 44%

27
Product sales – regional analysis
US Europe LATAM Other Total
Q2 2015 Product Sales $m(1) 1,054 256 64 102 1,476 % of Product Sales 72% 17% 4% 7% 100% YoY Growth +3% -13% +7% +6% 0%
H1 2015 Product Sales $m(1) 2,098 511 92 198 2,899 % of Product Sales 72% 18% 3% 7% 100% YoY Growth +9% -10% +4% +5% +4%
FY 2014 Product Sales $m(1) 4,082 1,147 214 387 5,830 % of Product Sales 70% 20% 4% 6% 100% YoY Growth +28% +13% +3% +10% +23%
(1) Results from continuing operations including NPS Pharmaceuticals Inc. in 2015 (acquired on February 21, 2015) and ViroPharma Inc. in 2014 (acquired on January 24, 2014) and excluding DERMAGRAFT in 2014 (treated as a discontinued operation following divestment on January 17, 2014).

28
Royalties and Other Revenues
Q2 2015(1)
$m Q2 2014
$m Reported Growth
SENSIPAR 35 0 n/a
FOSRENOL 11 9 +15%
3TC and ZEFFIX 11 8 +27%
ADDERALL XR 7 5 +47%
INTUNIV 6 0 n/a
REMINYL & Other 9 7 +45%
Royalties 79 29 +171%
Other Revenues 3 3 -30%
Royalties & Other Revenues 82 32 +150%
(1) Results include NPS Pharmaceuticals Inc. in 2015 (acquired on February 21, 2015).

29
Shire income statement growth analysis
(1) Results from continuing operations including NPS Pharmaceuticals Inc. in 2015 (acquired on February 21, 2015) and ViroPharma Inc. in 2014 (acquired on January 24, 2014) and excluding DERMAGRAFT in 2014 (treated as a discontinued operation following divestment on January 17, 2014).
(2) This is a Non GAAP financial measure. The most directly comparable measure under US GAAP is Gross Margin (Q2 2015: 85%, Q2 2014: 81%). (3) This is a Non GAAP financial measure. The most directly comparable measure under US GAAP is Combined R&D and SG&A (Q2 2015: +91%, Q2 2014: +10%). (4) This is a Non GAAP financial measure. The most directly comparable measure under US GAAP is Net income Margin (Q2 2015: 10%, Q2 2014: 35%). (5) This is a Non GAAP financial measure. The most directly comparable measure under US GAAP is Tax rate (Q2 2015: -37%, Q2 2014: -51%). (6) This is a Non GAAP financial measure. The most directly comparable measure under US GAAP is EPS-ADS (Q2 2015: $0.81, Q2 2014: $2.66). (7) See slide 34 for a list of items excluded from the US GAAP equivalent used to calculate all Non GAAP measures detailed above. A reconciliation of Non GAAP financial measures to the most directly comparable measure under US GAAP is presented in
Shire's Q2 2015 earnings release on pages 21 to 26.
2014
Q1(1) 2014 Q2(1)
2014 Q3(1)
2014 Q4(1)
2014 FY(1)
2015 Q1(1)
2015 Q2(1)
FY 2015 Dynamics Direction v.
FY 14 Guidance
Total Product Sales $1,308m $1,470m $1,551m $1,501m $5,830m $1,423m $1,476m 4-5% higher than in 2014
versus prior year +19% +22% +33% +17% +23% +9% 0%
Royalties & Other Revenues $39m $32m $46m $75m $192m $65m $82m 45-55% higher than in 2014
versus prior year -14% -27% +8% +65% +8% +68% +150%
Total Revenue $1,347m $1,502m $1,597m $1,576m $6,022m $1,488m $1,558m
versus prior year +18% +20% +32% +19% +22% +11% +4%
Non GAAP Gross Margin (2)(7) 86% 85% 86% 86% 86% 86% 86% ~ Similar to 2014
Combined Non GAAP R&D and SG&A (3)(7) $539m $602m $618m $677m $2,436m $571m $697m
High single digit growth
versus prior year -3% +2% +10% +11% +5% +6% +16%
Non GAAP EBITDA Margin(4)(7) 45% 44% 46% 41% 44% 46% 39%
Non GAAP Tax Rate(5)(7) 20% 16% 18% 19% 18% 17% 13% Core effective tax rate of 15-17%
Non GAAP diluted Earnings per ADS (6)(7) $2.36 $2.67 $2.93 $2.63 $10.60 $2.84 $2.63 Mid-to-high single digit growth
versus prior year +38% +42% +60% +17% +38% +20% -2%

30
Non GAAP cash flow measures
(1) This is a Non GAAP financial measure. The most directly comparable measure under US GAAP is Net cash provided by operating activities (see details above). Non GAAP cash generation represents net cash provided by operating activities, excluding up-front and milestone payments for in-licensed and acquired products, tax and interest payments.
(2) This is a Non GAAP financial measure. The most directly comparable measure under US GAAP is Net cash provided by operating activities (see details above). Non GAAP free cash flow represents net cash provided by operating activities, excluding up-front and milestone payments for in-licensed and acquired products, but including capital expenditure in the ordinary course of business.
(3) See slide 34 for a list of items excluded from the US GAAP equivalent used to calculate all Non GAAP measures detailed above. A reconciliation of Non GAAP financial measures to the most directly comparable measure under US GAAP is presented in Shire's Q2 2015 earnings release on pages 21 to 26.
Non GAAP cash generation (1)(3) and Non GAAP free cash flow (2)(3) reconciliation
Q2 2015
$m(1) Q2 2014
$m(1)
Non GAAP cash generation(1)(3) 505 659
Tax and interest receipts/(payments), net (53) (73)
Receipt from the Canadian revenue authorities - 248
US GAAP Net cash provided by operating activities 452 834
Capital expenditure (20) (4)
Non GAAP free cash flow(2)(3) 432 830

31
Non GAAP net (debt)/cash(1)(2)
(1) This is a Non GAAP financial measure. The most directly comparable measure under US GAAP is Cash and Cash equivalents (Q2 2015: $64m, FY 2014: $2,982m). (2) See slide 34 for a list of items excluded from the US GAAP equivalent used to calculate all Non GAAP measures detailed above. A reconciliation of Non GAAP financial measures to the
most directly comparable measure under US GAAP is presented in Shire's Q2 2015 earnings release on pages 21 to 26.
At Jun 30, 2015 Shire had a $2.1bn revolving credit facility that matures in December 2019 and a $2.6bn term loan facility that matures in November 2015, of which $0.4bn remains outstanding. Shire also has a $0.85bn term loan facility that was utilised to partly fund the acquisition of NPS and matures in January 2016, although the maturity date may be extended twice, at Shire’s option, by six months on each occasion.
June 30, 2015
$m December 31, 2014
$m
Cash and cash equivalents 64 2,982
Long term borrowings (74) -
Short term borrowings (2,230) (850)
Other debt (13) (13)
Non GAAP net (debt)/cash(1)(2) (2,253) 2,119

32
Q2 2015 – Operating income US GAAP and Non GAAP
(1) Results include NPS Pharmaceuticals Inc. in 2015 (acquired on February 21, 2015). (2) This is a Non GAAP financial measure. The most directly comparable measure under US GAAP is US GAAP Operating income (see details above). (3) See slide 34 for a list of items excluded from the US GAAP equivalent used to calculate all Non GAAP measures detailed above. A reconciliation of Non GAAP financial
measures to the most directly comparable measure under US GAAP is presented in Shire's Q2 2015 earnings release on pages 21 to 26.
Q2 2015
$m(1) Q2 2014
$m Reported Growth
Non GAAP Operating Income(2)(3) from continuing operations 614 630 -3%
Intangible asset amortization (131) (61)
Impairment of IPR&D intangible assets (523) (22)
Legal and litigation costs (2) (2)
Acquisition and integration costs 207 (146)
Gains on sale of non-core assets 7 4
Reorganization costs (13) (46)
Other (26) (19)
US GAAP Operating Income from continuing operations 133 338 -61%

33
H1 2015 – Operating income US GAAP and Non GAAP
(1) Results from continuing operations including NPS Pharmaceuticals Inc. in 2015 (acquired on February 21, 2015) and ViroPharma Inc. in 2014 (acquired on January 24, 2014) and excluding DERMAGRAFT in 2014 (treated as a discontinued operation following divestment on January 17, 2014).
(2) This is a Non GAAP financial measure. The most directly comparable measure under US GAAP is US GAAP Operating income (see details above). (3) See slide 34 for a list of items excluded from the US GAAP equivalent used to calculate all Non GAAP measures detailed above. A reconciliation of Non GAAP financial
measures to the most directly comparable measure under US GAAP is presented in Shire's Q2 2015 earnings release on pages 21 to 26.
H1 2015
$m(1) H1 2014
$m(1) Reported Growth
Non GAAP Operating Income(2)(3) from continuing operations 1,297 1,221 +6%
Intangible asset amortization (220) (119)
Impairment of IPR&D intangible assets (523) (188)
Legal and litigation costs (3) (4)
Acquisition and integration costs 120 (191)
Gains on sale of non-core assets 12 40
Reorganization costs (28) (95)
Other (48) (19)
US GAAP Operating Income from continuing operations 607 645 -6%

34
This presentation contains financial measures not prepared in accordance with US GAAP. These measures are referred to as “Non GAAP” measures and include: Non GAAP operating income; Non GAAP net income; Non GAAP diluted earnings per ADS; effective tax rate on Non GAAP income before income taxes and earnings/(losses) of equity method investees (“effective tax rate on Non GAAP income”); Non GAAP cost of product sales; Non GAAP R&D; Non GAAP SG&A; Non GAAP other income/(expense); Non GAAP interest income; Non GAAP cash generation; Non GAAP free cash flow, Non GAAP net cash/(debt), Non GAAP EBITDA and Non GAAP EBITDA Margin as percentage of product sales. These Non GAAP measures exclude the effect of certain cash and non-cash items, that Shire's management believes are not related to the core performance of Shire’s business. These Non GAAP financial measures are used by Shire’s management to make operating decisions because they facilitate internal comparisons of Shire’s performance to historical results and to competitors’ results. Shire’s Remuneration Committee uses certain key Non GAAP measures when assessing the performance and compensation of employees, including Shire’s Directors. The Non GAAP measures are presented in this presentation as Shire’s management believe that they will provide investors with a means of evaluating, and an understanding of how Shire’s management evaluates, Shire’s performance and results on a comparable basis that is not otherwise apparent on a US GAAP basis, since many non-recurring, infrequent or non-cash items that Shire’s management believe are not indicative of the core performance of the business may not be excluded when preparing financial measures under US GAAP. These Non GAAP measures should not be considered in isolation from, as substitutes for, or superior to financial measures prepared in accordance with US GAAP. Where applicable the following items, including their tax effect, have been excluded when calculating Non GAAP earnings for both 2015 and 2014, and from our Outlook: Amortization and asset impairments: • Intangible asset amortization and impairment charges; and • Other than temporary impairment of investments. Acquisitions and integration activities: • Up-front payments and milestones in respect of in-licensed and acquired products; • Costs associated with acquisitions, including transaction costs, fair value adjustments on contingent consideration and acquired inventory; • Costs associated with the integration of companies; and • Noncontrolling interests in consolidated variable interest entities. Divestments, reorganizations and discontinued operations: • Gains and losses on the sale of non-core assets; • Costs associated with restructuring and reorganization activities; • Termination costs; and • Income/(losses) from discontinued operations. Legal and litigation costs: • Net legal costs related to the settlement of litigation, government investigations and other disputes (excluding internal legal team costs). Other: • Net income tax credit (being income tax, interest and estimated penalties) related to the settlement of certain tax positions with the Canadian revenue authorities. • Costs associated with AbbVie’s terminated offer for Shire, including costs of employee retention awards. • Break fee received in relation to AbbVie’s terminated offer for Shire. Depreciation, which is included in Cost of product sales, R&D and SG&A costs in our US GAAP results, has been separately disclosed for the presentation of 2015 and 2014 Non GAAP earnings.
Cash generation represents net cash provided by operating activities, excluding up-front and milestone payments for in-licensed and acquired products, tax and interest payments.
Free cash flow represents net cash provided by operating activities, excluding up-front and milestone payments for in-licensed and acquired products, but including capital expenditure in the ordinary course of business.
Growth at CER, which is a Non GAAP measure, is computed by restating 2015 results using average 2014 foreign exchange rates for the relevant period.
Average exchange rates used by Shire for the six months to June 30, 2015 were $1.53:£1.00 and $1.13:€1.00 (2014: $1.67:£1.00 and $1.37:€1.00). Average exchange rates used by Shire for Q2 2015 were $1.52:£1.00 and $1.10:€1.00 (2014: $1.68:£1.00 and $1.38:€1.00).
A reconciliation of Non GAAP financial measures to the most directly comparable measure under US GAAP is presented in Shire’s Q2 2015 earnings release on pages 21 to 26.
Non GAAP measures