Q2 2011 MOTOROLASOLUTIONS MARKET BAROMETER 2011 HOSPITALITY · How are enterprises and government...
37
PAGE 1 MOTOROLA SOLUTIONS MARKET BAROMETER 2011 HOSPITALITY Q2 2011 BUSINESS AND MARKET INTELLIGENCE MOTOROLA SOLUTIONS
Transcript of Q2 2011 MOTOROLASOLUTIONS MARKET BAROMETER 2011 HOSPITALITY · How are enterprises and government...

PAGE 1
MOTOROLA SOLUTIONSMARKET BAROMETER 2011 HOSPITALITY
Q2 2011
BUSINESS AND MARKET INTELLIGENCEMOTOROLA SOLUTIONS

PAGE 2
MOTOROLA SOLUTIONS MARKET BAROMETER 2011 – HOSPITALITY
MARKET BAROMETER 2011HOSPITALITY
INTRODUCTION
OBJECTIVES AND METHODOLOGY
FIRMOGRAPHICS AND RESPONDENT PROFILE
KEY FINDINGS
IMPORTANCE OF MOBILITY AND INVESTMENT DRIVERS
DEPLOYMENTS
WLAN STRATEGY
BUDGETS AND MOBILE INVESTMENTS
CONCLUSIONS

PAGE 3
MOTOROLA SOLUTIONS MARKET BAROMETER 2011 – HOSPITALITY
The Motorola Solutions Barometer is a market trends study conducted to better understand the changing environment and business strategies concerning mobility in enterprise and government industries.
What are the strategic mobility issues concerning mobility decision-makers? How are enterprises and government segments utilizing mobility and what are the benefits?What are the future mobile technology investment expectations?Which vertical industries and regions are leading in the adoption of mobility solutions?Which applications are most deployed and which are poised for greater adoption?
INTRODUCTION

PAGE 4
MOTOROLA SOLUTIONS MARKET BAROMETER 2011 – HOSPITALITY
MARKET BAROMETER 2011 HOSPITALITY
INTRODUCTION
OBJECTIVES AND METHODOLOGY
FIRMOGRAPHICS AND RESPONDENT PROFILE
KEY FINDINGS
IMPORTANCE OF MOBILITY AND INVESTMENT DRIVERS
DEPLOYMENTS
WLAN STRATEGY
BUDGETS AND MOBILE INVESTMENTS
CONCLUSIONS

PAGE 5
MOTOROLA SOLUTIONS MARKET BAROMETER 2011 – HOSPITALITY
OBJECTIVES AND METHODOLOGYObjectives: Motorola Solutions regularly conducts independent market research to better
understand emerging trends in Enterprise and Government mobility markets. The Motorola Solutions Barometer provides indicators of the opportunities and challenges that mobility poses to Hospitality enterprises by gathering direct feedback from the organizations that are investing and deploying these solutions.
Sampling and Methodology: The survey was conducted in Q4 2010. Respondents were screened for involvement in the decision to invest or purchase mobile and/or wireless technologies, including: wireless networks (WLAN, WiFi), cell phones, smartphones, laptops, netbooks, tablets, rugged laptops, rugged handheld computers, and two-way radio systems.
• Sample: Invitation to participate was sponsored by third party panel provider (ResearchNow). Motorola identity not disclosed. 161 respondents from Hospitality venues across North America and Western Europe completed the survey.
• Metrics: The 2011 Hospitality Barometer probed deployment status and future plans for mobile and wireless technologies in the enterprise. Key metrics included deployment status and planning, mobile employee deployments, WLAN deployment timeline, applications driving investments, and key benefits .
• Technologies: The research examined current and emerging technologies in the hospitality industry and their impact on customer satisfaction. Key technologies include mobile computing, radio, tablets, and WLAN.

PAGE 6
MOTOROLA SOLUTIONS MARKET BAROMETER 2011 – HOSPITALITY
MARKET BAROMETER 2011HOSPITALITY
INTRODUCTION
OBJECTIVES AND METHODOLOGY
FIRMOGRAPHICS AND RESPONDENT PROFILE
KEY FINDINGS
IMPORTANCE OF MOBILITY AND INVESTMENT DRIVERS
DEPLOYMENTS
WLAN STRATEGY
BUDGETS AND MOBILE INVESTMENTS
CONCLUSIONS

PAGE 7
MOTOROLA SOLUTIONS MARKET BAROMETER 2011 – HOSPITALITY
NUMBER OF EMPLOYEES AND REGION
United States 104 64.6%
Canada 6 3.7%
United Kingdom 15 9.3%
France 16 9.9%
Germany 20 12.4%
Total 161 100%
Number of Employees Total North
America Europe
N 161 110 51
250 to 499 5.0 % 4.5 % 5.9 %
500 to 999 13.0 % 12.7 % 13.7 %
1,000 to 1,999 13.0 % 10.0 % 19.6 %
2,000 to 4,999 11.2 % 10.9 % 11.8 %
5,000 to 9,999 16.1 % 16.4 % 15.7 %
10,000 to 49,999 13.7 % 13.6 % 13.7 %
50,000 to 99,999 11.8 % 14.5 % 5.9 %
Over 100,000 16.1 % 17.3 % 13.7 %
Approx. 70% of respondents represent mid- to large companies with at least 2,000 employees.
Q: “In what country is your organization headquartered?”
Q: “How many full-time employees are employed in your entire organization? Please include employees
at all stores, plants, branches, divisions, and subsidiaries worldwide.”

PAGE 8
MOTOROLA SOLUTIONS MARKET BAROMETER 2011 – HOSPITALITY
HOSPITALITY FOCUS
Total North America EuropeN 161 110 51
Hotel/Spa/Inn 39.1 % 35.5 % 47.1 %Amusement Parks/ Arcades/ Tourist Attraction 10.6 % 10.0 % 11.8 %
Casino 8.7 % 10.9 % 3.9 %Restaurant/Bar -- with Table Service 8.7 % 10.9 % 3.9 %
Restaurant -- Fast Food 8.1 % 10.9 % 2.0 %Sports Arena/Venue 4.3 % 4.5 % 3.9 %
Golf or Ski Resort 1.9 % 1.8 % 2.0 %Movie Theaters 1.9 % 1.8 % 2.0 %
Museums, Zoos and Botanical Gardens 1.9 % 1.8 % 2.0 %National/State/Government monument/park 1.9 % 0.9 % 3.9 %
Other 13.0 % 10.9 % 17.6 %
• The Barometer 2011 includes the responses of 161 decision makers in the Hospitality industry across North America and Western Europe.
• Decision makers who completed this survey represent hospitality enterprises with over four million workers combined.
Respondents represent a wide variety of hospitality enterprises including hotels, tourist attractions, casinos and restaurants.

PAGE 9
MOTOROLA SOLUTIONS MARKET BAROMETER 2011 – HOSPITALITY
TARGET CHARACTERISTICS
US $ equivalent Total N.A. Europe
N 161 110 51
$15M - 49.9 M 12.4 % 11.8 % 13.7 %
$50 - 99.9 M 11.8 % 10.0 % 15.7 %
$100 - 249.9 M 11.2 % 8.2 % 17.6 %
$250 - 499.9 M 12.4 % 10.9 % 15.7 %
$500 - 999.9 M 15.5 % 14.5 % 17.6 %
Over $1 Billion 36.6 % 44.5 % 19.6 %
Q: “Approximately what is your organization’s global annual revenue?”
More than one third of survey respondents represent companies exceeding $1 billion in revenues. Responses come from the executive suite , IT functions and management
closest to day-to-day implementation of mobile solutions.
Senior-most business leader 8.7%
Executive37.3%
Senior-most finance leader 6.2%
Executive in line of business 22.4%
Operations Manager 24.8%
Management43.4%Supply Chain Manager 4.3%
Manager in line of business 14.3%
Senior-most IT DM 4.3%IT
19.2%VP in IT 2.5%
Director in IT 4.3%Manager in IT 8.1%
Q: “Which of the following best describes your role in your organization?”

PAGE 10
MOTOROLA SOLUTIONS MARKET BAROMETER 2011 – HOSPITALITY
MARKET BAROMETER 2011HOSPITALITY
INTRODUCTION
OBJECTIVES AND METHODOLOGY
FIRMOGRAPHICS AND RESPONDENT PROFILE
KEY FINDINGS
IMPORTANCE OF MOBILITY AND INVESTMENT DRIVERS
DEPLOYMENTS
WLAN STRATEGY
BUDGETS AND MOBILE INVESTMENTS
CONCLUSIONS

PAGE 11
MOTOROLA SOLUTIONS MARKET BAROMETER 2011 – HOSPITALITY
KEY FINDINGS: HOSPITALITYHospitality enterprises recognize the increasing importance of mobile technologies (91%) and the competitive advantage for their business (78%). The majority (56%) are planning increased spending on mobile and wireless technologies in 2011 to better equip their workforces.
Elevating the guest experience• Improved guest experience is the top driver for mobility investments, cited by 76 percent of hospitality venues surveyed. • Hospitality decision makers are investing in mobile products to support customer-facing applications that handle wireless
email, guest/attendee check-in, table-side order/payment, event ticketing, among others – all to improve guest services. • 61 percent of respondents plan to deploy some form of video capabilities, including video surveillance, video conferencing
and streaming video in public access areas such as lobbies.• Of hospitality organizations surveyed, 58 percent deploying mobile technology today are seeing improved customer
satisfaction.
Empowering the mobile worker• 59 percent of respondents currently deploying mobile and wireless technology saw an increase in employee productivity and
efficiency, while 55 percent have seen improved sales results.• Managers, security and customer service associates are the primary users of mobile and wireless devices in the hospitality
companies surveyed – 71 percent of supervisors use smartphones, 52 percent of security use radios, 19 percent of ticketing agents are equipped with VoIP, while 26 percent of property managers have tablets.
• The most popular current applications on two-way radios are project management (51 percent) and collaboration (41 percent). Unified messaging and remote management/monitoring have the highest rate of planned deployments into 2012.
• Among survey respondents, tablets and VoIP handsets are the top two mobile devices planned for new deployments by 2012.
Enabling operational efficiency• 75 percent of hospitality organizations surveyed already have wireless LAN (WLAN) installed in their facilities. In North
America, approximately one third of these venues have 802.11n, while European venues predominately have 802.11b/g. • 42 percent of respondents with existing WLAN expect to be fully upgraded to 802.11n by the end of 2012. • Improving throughput and reliability, and extending range of current wireless data networks are the top three drivers behind
802.11n WLAN adoption – all critical network features to meet greater data volumes and increasing demands for access from the customer and mobile workforce.

PAGE 12
MOTOROLA SOLUTIONS MARKET BAROMETER 2011 – HOSPITALITY
MARKET BAROMETER 2011HOSPITALITY
INTRODUCTION
OBJECTIVES AND METHODOLOGY
FIRMOGRAPHICS AND RESPONDENT PROFILE
KEY FINDINGS
IMPORTANCE OF MOBILITY AND INVESTMENT DRIVERS
DEPLOYMENTS
WLAN STRATEGY
BUDGETS AND MOBILE INVESTMENTS
CONCLUSIONS

PAGE 13
MOTOROLA SOLUTIONS MARKET BAROMETER 2011 – HOSPITALITY
90.6%
AGREE NO OPINION DISAGREE
78.2%
“My organization has a competitive advantage by using mobile and wireless technologies.”
“Mobile and wireless technologies are more important to my organization today than they were last year.”
Hospitality decision-makers overwhelmingly recognize the increasing importance of mobile technologies (91%) and the competitive advantage for their business (78%); the majority
(56%) are planning increased spending on mobile and wireless technologies in 2011.
RISING IMPORTANCE OF MOBILITY“What is your organization’s plan for investing in mobile and wireless technologies in 2011?”
56.3%
34.5%
INCREASE BUDGET SAME AS 2010NOT SURE DECREASE
N=161 (Hospitality, NA and EU )
PAGE 14
MOTOROLA SOLUTIONS MARKET BAROMETER 2011 – HOSPITALITY
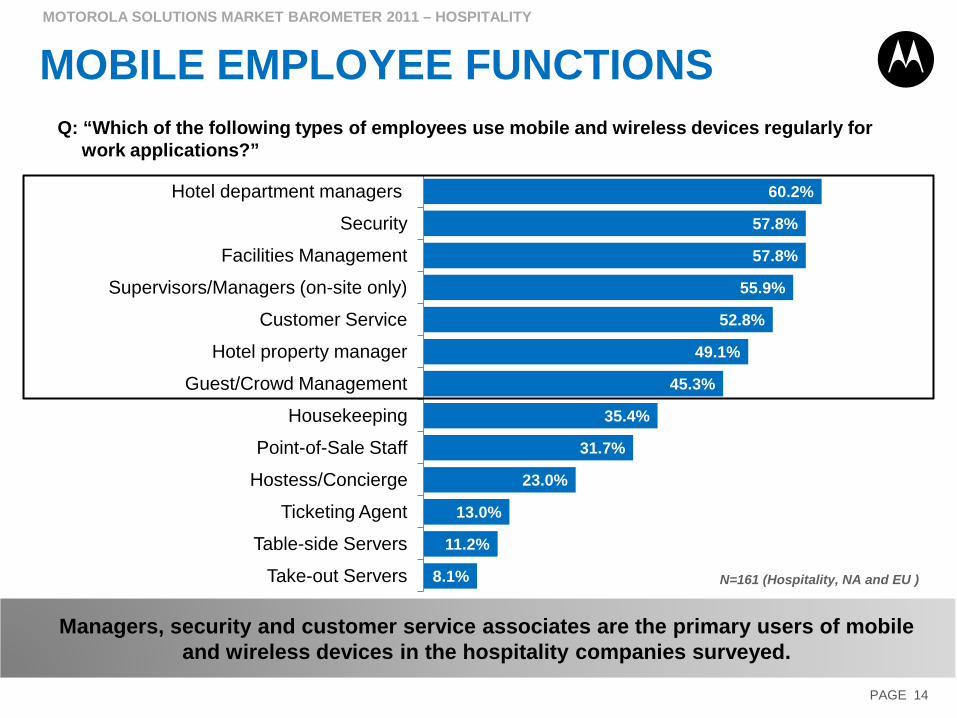
8.1%
11.2%
13.0%
23.0%
31.7%
35.4%
45.3%
49.1%
52.8%
55.9%
57.8%
57.8%
60.2%
Take-out Servers
Table-side Servers
Ticketing Agent
Hostess/Concierge
Point-of-Sale Staff
Housekeeping
Guest/Crowd Management
Hotel property manager
Customer Service
Supervisors/Managers (on-site only)
Facilities Management
Security
Hotel department managers
MOBILE EMPLOYEE FUNCTIONS
Managers, security and customer service associates are the primary users of mobile and wireless devices in the hospitality companies surveyed.
Q: “Which of the following types of employees use mobile and wireless devices regularly for work applications?”
N=161 (Hospitality, NA and EU )

PAGE 15
MOTOROLA SOLUTIONS MARKET BAROMETER 2011 – HOSPITALITY
DEVICES FOR DIFFERENT WORKERS
Smartphone Two-way Radio Portable VoIP Mobile Handset TabletSupervisors/Mgrs (on-
site and travel) 70.7% Security 51.6% Ticketing Agent 19.0% Hotel property manager 25.6%
Supervisors/Managers mobile on-site 59.1% Guest/Crowd
Management 47.2% Table-side Servers 16.7% Table-side Servers 22.2%
Hotel property manager 57.7% Housekeeping 46.4% Take-out Servers 15.4% Point-of-Sale Staff 22.0%Hotel department
managers 53.6% Facilities Management 42.9% Facilities Management 14.3% Supervisors/Mgrs (on-site and travel) 18.5%
Facilities Management 50.5% Hotel department managers 37.1% Hostess, Concierge, 13.5% Hotel department
managers 16.5%
Hostess, Concierge, 45.9% Customer Service 34.9% Customer Service 13.3% Guest/Crowd Management 15.3%
Customer Service 39.8% Hostess, Concierge, 29.7% Hotel property manager 12.8% Housekeeping 12.5%
Security 36.3% Supervisors/Managers mobile on-site 29.5% Supervisors/Mgrs (on-
site and travel) 10.9% Customer Service 12.0%
Point-of-Sale Staff 36.0% Hotel property manager 24.4% Housekeeping 10.7% Supervisors/Managers mobile on-site 11.4%
Guest/Crowd Management 33.3% Point-of-Sale Staff 24.0% Hotel department
managers 10.3% Facilities Management 11.0%
The highest levels of device deployments reflect mobile workers with different needs in different situations. 71% of supervisors use smartphones; 52% of security use radios; 19%
of ticketing agents are equipped with VoIP; and 26% of property managers have tablets.
% of enterprises deploying the device with each type of worker
xxx xxx

PAGE 16
MOTOROLA SOLUTIONS MARKET BAROMETER 2011 – HOSPITALITY
TOP MOBILITY INVESTMENT DRIVERS
Field-based and customer-facing applications are the top drivers behind investments in mobility products, besides the essential email and contacts apps.
Q: “Which mobile applications are the primary drivers behind your organization's investments in mobile products?”
59.0%
64.6%
65.2%
67.1%
67.1%
68.3%
71.4%
72.0%
72.7%
75.2%
76.4%
Logistics applications
Asset tracking/management
Inventory Management
Asset Maintenance
Industry-specific LOB applications
Security
Personalized contacts and calendar
Field Sales - Sales force applications
Wireless email
Field service applications
Customer-facing applications
N=161 (Hospitality, NA and EU )

PAGE 17
MOTOROLA SOLUTIONS MARKET BAROMETER 2011 - HOSPITALITY
DEVICE DEPLOYMENT DRIVERS
N=148 N=106 N=83 N=61 N=42
Smartphone Tablet Computer Rugged Laptop or Notebook
Rugged Handheld Computer
Rugged WearableComputer
Wireless email 43% Customer-facing applications 33% Line-of-business
applications 19% Inventory Management 25% (Mobile) CRM 21%
Contacts and calendar 31% Field Sales - SFA 25% Facilities
Management 17% Facilities Management 23% Guest/Attendee
Check-In 21%
Field Sales - SFA 27% (Mobile) CRM 22% Guest/Attendee Check-In 16% (Mobile) CRM 23% Labor
management 21%
(Mobile) CRM 27% Line-of-Business apps 21% Table- side Order/
Payment 16% Table- Side Order/ Payment 20% Contacts and
calendar 19%
Field service applications 26% Mobile Point of
Sale (POS) 21% Inventory Management 16% Logistics
applications 20% Security 19%
Customer-facing applications 21% Wireless email 20% Line Busting 16% Line-of-business
applications 18% Voice over WLAN 19%
Line-of-business applications 21% Table-Side Order/
Payment 20% Field service applications 14% Field Sales - SFA 18% Line Busting 19%
Guest/Attendee Check-In 20% Line Busting 19% Food traceability 14% Event Ticketing 18%
Security 18% Contacts and calendar 17% Logistics
applications 14% Line Busting 16%
Which applications are the primary reasons (drivers) for deploying each device?
Deployment of each form factor is driven by specific combinations of applications for which it is best suited.
Includes NA and EU

PAGE 18
MOTOROLA SOLUTIONS MARKET BAROMETER 2011 – HOSPITALITY
BENEFITS
18.6%
24.2%
26.1%
26.7%
31.1%
34.2%
50.3%
54.7%
58.4%
59.0%
Better ergonomics, reduced injuries
Improve greener operations
Lower labor costs via automated processes
Increase customer loyalty
Improve order fulfillment accuracy
Decrease employee/manual errors
Improve guest experience, quality or consistency
Improved business revenues/sales results
Customer satisfaction
Increase employee productivity/efficiency
Q: “Which of the following are the most important benefits realized by your organization due to the utilization of mobile and wireless computing and/or communication products?
Top three benefits from mobile technologies are increased productivity, customer satisfaction and improved revenues.
N=161 (Hospitality, NA and EU )

PAGE 19
MOTOROLA SOLUTIONS MARKET BAROMETER 2011 – HOSPITALITY
MARKET BAROMETER 2011HOSPITALITY
INTRODUCTION
OBJECTIVES AND METHODOLOGY
FIRMOGRAPHICS AND RESPONDENT PROFILE
KEY FINDINGS
IMPORTANCE OF MOBILITY AND INVESTMENT DRIVERS
DEPLOYMENTS
WLAN STRATEGY
BUDGETS AND MOBILE INVESTMENTS
CONCLUSIONS

PAGE 20
MOTOROLA SOLUTIONS MARKET BAROMETER 2011 – HOSPITALITY
DEVICE DEPLOYMENT STATUS
0% 20% 40% 60% 80% 100%
Rugged Wearable Computer
Rugged Tablet Computer
Vehicle-mounted Computer
Two-way radio – vehicle-mounted
Rugged Handheld Computer
Rugged Laptop or Notebook
Netbook
Portable Handset for VoIP or VoWLAN
Tablet Computer
Two-way radio – hand-held
Cell Phone
Smartphone
Laptop/Notebook
Currently Deployed/no Plans Currently Deployed & Plan upgrade/expand New Deployment by 2012
Tablets and VoIP Handsets are the top two technologies planned for new deployments by 2012. Laptops, smartphones and cellphones continue to be supported as indicated by high
rates of planned upgrades (60 -70%).
Q: “Which of the following mobile and wireless products are currently deployed by your organization for mobile employees and which do you plan to add to your deployments by 2012?”
Total Currently deployed
PlanningNew by
2012
90.7% 8.1%78.3% 13.7%80.1% 9.3%52.2% 14.3%42.2% 23.6%34.2% 29.8%42.2% 16.1%32.3% 19.3%19.3% 18.6%19.3% 14.9%15.5% 18.0%11.8% 18.0%9.9% 16.1%

PAGE 21
MOTOROLA SOLUTIONS MARKET BAROMETER 2011 – HOSPITALITY
EMERGING APPLICATION TRENDS
Currently Using or Deployed
Planning to Deploy by 2012
Applications that require a persistent internet connection. Browser-based Applications* 44.1% 22.4%
SaaS is a cloud deployment of shared and standardized business applications based on a multitenant architecture. Software-as-a-Service (SaaS)* 32.9% 14.9%
Defined as pay-per-use hosting of virtual servers from service providers such as Amazon Web Services, Savvis,
or Rackspace/Mosso or other local service providers..
Cloud Computing or Infrastructure-as-a-service
(IaaS)18.0% 24.8%
conferencing/telepresence, video systems for collaboration. Video capabilities 37.9% 23.0%
Communications technology [voice, video, and data] that is integrated with desktop applications such as presence,
conferencing, and unified messages through an integrated software platform.
Unified communications 27.3% 23.6%
Include RFID, sensors, GPS technologies, and smart cards that collect and transfer data on the condition of
physical assets or people.
Machine-to-Machine (M2M) technologies 21.7% 22.4%
Q: “What is your organization’s level of deployment in the following technologies?”
One third of Hospitality respondents reported already using SaaS applications and 44% indicated they are browser-based applications.* 61% will have some form of video
capabilities deployed by 2012.
N=161 (Hospitality, NA and EU )*These technologies and terminology are rapidly converging.

PAGE 22
MOTOROLA SOLUTIONS MARKET BAROMETER 2011 – HOSPITALITY
VIDEO APPLICATIONS
Q: “What is your organization’s level of deployment in the following technologies?”
10.6%
13.7%
13.7%
15.5%
14.3%
22.4%
21.1%
24.8%
5.0%
7.5%
8.7%
7.5%
9.3%
3.1%
5.6%
3.7%
Immersive videoconferencing (e.g., room-based telepresence)
High definition (HD) in-room videoconferencing
Enterprise IP/digital video for company use (e.g., video training, demos)
Desktop IP videoconferencing
IP video service/streaming for clients/customers (e.g., video feed in a lobby)
Cable or satellite TV service for clients/customers (in room)
Traditional in-room videoconferencing
Video surveillance
Currrent Planned by 2012
Video surveillance, traditional video-conferencing and in-room cable are the top current video deployments. HD and IP video technologies are expected to expand significantly by
2012 reaching levels close to cable/satellite services.
N= 98 (Hospitality, NA and EU)

PAGE 23
MOTOROLA SOLUTIONS MARKET BAROMETER 2011 – HOSPITALITY
APPLICATIONS SOURCING
Current Future Change
Homegrown and/or developed in-house 48.4% 21.7% -26.7%
Custom applications developed by an external developer 38.5% 36.6% -1.9%
Purchase mobile applications off the shelf 47.8% 40.4% -7.5%
Other (please specify) 5.0% 6.8% 1.9%
Don t know 21.7% 34.2% 12.4%
Q: “What is your organization’s primary strategy for acquiring or developing applications for mobile products currently? What is the planned strategy into 2012?”
Preferences for acquiring mobile applications are in flux, reflected by a high number of respondents (34%) who can’t say what the strategy for their organization will be in 2012.
Significantly fewer expect to develop applications in-house.
N=161 (Hospitality, NA and EU )

PAGE 24
MOTOROLA SOLUTIONS MARKET BAROMETER 2011 – HOSPITALITY
APPLICATION DEVELOPMENTQ: “What resources do you work with to develop custom mobile applications or to
customize existing applications?
2.5%
12.4%
13.7%
14.3%
16.8%
19.9%
25.5%
Don t know
By an external developer (off-shore)
Work with Web site design firm
Develop mobile applications on a purchased mobile middleware platform (e.g., Sybase I Anywhere, Antenna …
Work with system integrator to develop (local, regional or national)
Use a mobile extension of an existing packaged application from the vendor (e.g., Siebel, SAP salesforce.com)
By an external developer (local, regional or national)
N=62
When developing custom mobile apps, one quarter of respondents works with an external developer that is local, regional or national, compared to 12% who use off-shore developers.

PAGE 25
MOTOROLA SOLUTIONS MARKET BAROMETER 2011 – HOSPITALITY
TYPES OF TWO-WAY RADIO IN USE
Two-way radio handheld
Direct Radio-to-Radio(s) Communication 80.2%
Company-owned and operated system with repeaters and radios 47.2%
Service Provider's repeater/antennae system (Paid
Subscription)26.4%
Licensed (e.g., LMR/PMR) 41.5%
Un-licensed (e.g., FRS) 20.8%
Both. Some unlicensed / some licensed radios.
18.9%
Don’t Know 18.9%
Q: “Which of the following best describes your current two-way radio deployments?
Use of FRS Radio in the Enterprise Use of Repeaters/Radio Antennae Systems
Use of FRS radio in hospitality is prevalent (21% - solely FRS, 19% - in addition to LMR). Nearly one half (47%) of hospitality enterprises operate their own system for at least some
part of their deployments while 26% use a service provider.

PAGE 26
MOTOROLA SOLUTIONS MARKET BAROMETER 2011 – HOSPITALITY
TWO-WAY RADIO DEPLOYMENT PLANS
currently own and operate (no upgrades planned)
30.2%
currently own and operate / plan expansion or
upgrade 23.7%
New deployment by 2012
8.5%
No plans to deploy
Radio/repeater system23.4%
Don't know8.5%
Q: “What are your company’s plans for installing or expanding two-way radio deployments that include a radio repeater and antenna system?”
N=106 (have or plan radio products)
(No radios/ 34% of total)
% among those with current or planned two-way radios any type
Among manufacturers who have or plan to deploy two-way radios, about one quarter (24%) own and operate the radio/repeater system and plan to upgrade by 2012; 30% own and
operate with no plans to upgrade.

PAGE 27
MOTOROLA SOLUTIONS MARKET BAROMETER 2011 – HOSPITALITY
TWO-WAY RADIO: DESIRED APPSQ: “Which of the following applications do you currently have deployed on two-way radios and
which do you plan to deploy by the end of 2012?”
23.4%26.9%
30.5%32.6%33.3%33.7%34.0%34.8%35.1%36.2%
40.6%50.5%
25.5%25.8%21.1%
22.1%15.6%17.3%18.6%17.4%16.5%
21.3%12.5%
5.2%
Remote mgmt/monitoringUnified messaging/voice mail
Knowledge mgmtMulti-media messaging service (MMS)
Calendar/schedulingConferencing
Text messagingPush email
Instant messagingShort messaging service (SMS)
CollaborationProject management
Current Planned by 2012
N=95
(Among respondents with current or planned 2-way radio deployments)
The most popular current applications on two-way radios are project management (51%) and collaboration (41%). Unified messaging and remote management/monitoring have the
highest rate of planned deployments into 2012.

PAGE 28
MOTOROLA SOLUTIONS MARKET BAROMETER 2011 – HOSPITALITY
MARKET BAROMETER 2011HOSPITALITY
INTRODUCTION
OBJECTIVES AND METHODOLOGY
FIRMOGRAPHICS AND RESPONDENT PROFILE
KEY FINDINGS
IMPORTANCE OF MOBILITY AND INVESTMENT DRIVERS
DEPLOYMENTS
WLAN STRATEGY
BUDGETS AND MOBILE INVESTMENTS
CONCLUSIONS
PAGE 29
MOTOROLA SOLUTIONS MARKET BAROMETER 2011 – HOSPITALITY
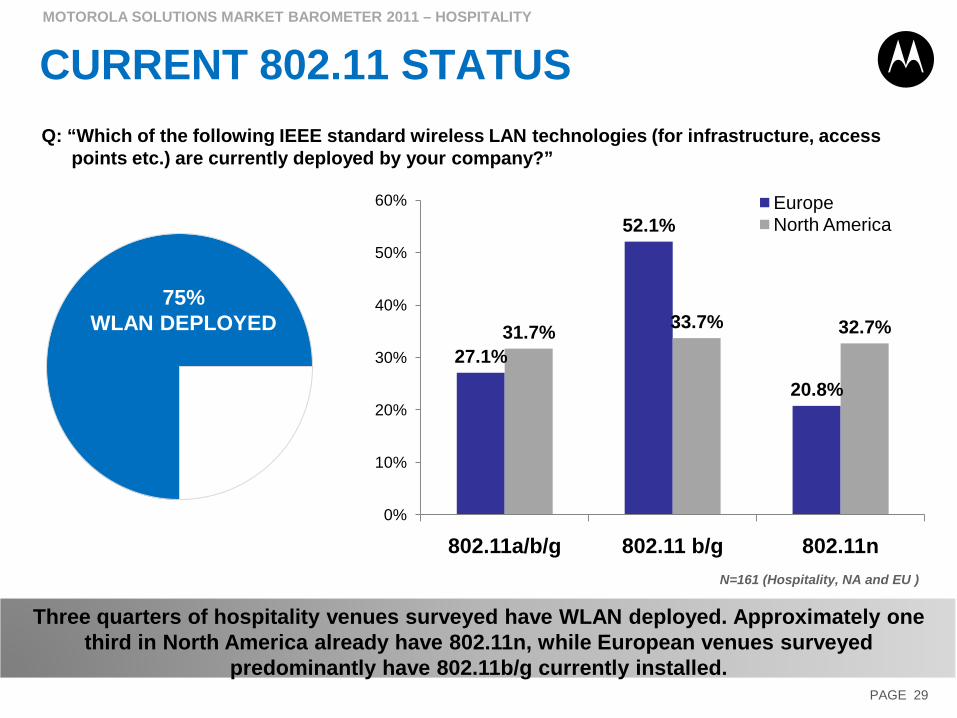
27.1%
52.1%
20.8%
31.7% 33.7% 32.7%
0%
10%
20%
30%
40%
50%
60%
802.11a/b/g 802.11 b/g 802.11n
EuropeNorth America
CURRENT 802.11 STATUSQ: “Which of the following IEEE standard wireless LAN technologies (for infrastructure, access
points etc.) are currently deployed by your company?”
Three quarters of hospitality venues surveyed have WLAN deployed. Approximately one third in North America already have 802.11n, while European venues surveyed
predominantly have 802.11b/g currently installed.
N=161 (Hospitality, NA and EU )
75%WLAN DEPLOYED

PAGE 30
MOTOROLA SOLUTIONS MARKET BAROMETER 2011 – HOSPITALITY
802.11 N SCHEDULE
28.4%32.6%
14.7%
2.1%
22.1%
13.7%
28.4%
18.9% 17.9%21.1%
0%
10%
20%
30%
40%
50%
Within 12 months By the end of 2012 In 2013 - 2014 2015 or later Not planned / Not applicable
Partial 802.11n
Complete 802.11n
Q: “On what schedule does your company expect to replace its 802.11 a/b/g or 802.11 b/g WLAN deployments with 802.11n?”
% of those who currently have a/b/g or b/g
42% of the currently deployed WLAN base expects to be fully upgraded to 802.11n by the end of 2012.
42.1%
N=95

PAGE 31
MOTOROLA SOLUTIONS MARKET BAROMETER 2011 – HOSPITALITY
WLAN DRIVERS
16.7%
28.2%
32.1%
43.6%
46.2%
56.4%
Adding support for video traffic to our wireless network
Replacing wired primary access with wireless primary access
Adding support for voice traffic to wireless network
Increasing the range of the current wireless network
Improving the reliability of current wireless networks
Increase throughput for current wireless data networks
Q: “What does your organization consider the primary driver(s) for adopting 802.11n? (% among those with current or planned WLAN deployment)
N=78
Improving throughput and reliability, and extending range are the top three drivers behind 802.11n adoption: all are critical network features to meet greater data volumes and
increasing demands for access from the customer and the mobile workforce.

PAGE 32
MOTOROLA SOLUTIONS MARKET BAROMETER 2011 – HOSPITALITY
MARKET BAROMETER 2011HOSPITALITY
INTRODUCTION
OBJECTIVES AND METHODOLOGY
FIRMOGRAPHICS AND RESPONDENT PROFILE
KEY FINDINGS
IMPORTANCE OF MOBILITY AND INVESTMENT DRIVERS
DEPLOYMENTS
WLAN STRATEGY
BUDGETS AND MOBILE INVESTMENTS
CONCLUSIONS

PAGE 33
MOTOROLA SOLUTIONS MARKET BAROMETER 2011 – HOSPITALITY
IT-TELECOM BUDGET
IT-Telecom Budget 2010
IT-Telecom Budget 2011 Change
<$250,000 19.5% 14.9% -4.6%$250,000 - $499,999 11.5% 10.3% -1.1%$500,000 - $999,999 10.3% 9.2% -1.1%$1 mill - $4.9 million 8.0% 12.6% 4.6%$5 mill - $9.9 million 10.3% 5.7% -4.6%
$10 mill - $49.9 million 9.2% 11.5% 2.3%$50 mill - $99.9 million 5.7% 6.9% 1.1%
$100 mill- $499.9 million 10.3% 9.2% -1.1%$500 million + 8.0% 11.5% 3.4%
Total 100.0% 100.0% 0.0%
Q: “What is your organization’s current total annual IT and telecom budget for 2010? and what is the budget planned for 2011?”
IT spending is increasing by approximately 20% overall in 2011 according to the planned spend among hospitality decision-makers surveyed.
N=161 (Hospitality, NA and EU )
2011 Retail IT Spend
2010 Retail IT Spend
+20%
IT Budgets / YoY comparative scale

PAGE 34
MOTOROLA SOLUTIONS MARKET BAROMETER 2011 – HOSPITALITY
5.2%
13.8%
37.9%
32.8%
5.2% 5.2%
10.3%
20.7%24.1%
37.9%
0.0%
6.9%
Increase > 25% Increase 10 to 25%
Increase 5 to 10%
About the same as 2010
Decrease 5 to10%
Don’t Know
North AmericaEurope
MOBILE INVESTMENTS 2011
Q: “What is your organization’s plan for investing in mobile and wireless technologies in 2011?”
56% of hospitality decision makers planned for increases in mobile investments in 2011. Greater average increase is expected in Europe than in North America.
N=161 (Hospitality, NA and EU )
56% overall report increases for 2011

PAGE 35
MOTOROLA SOLUTIONS MARKET BAROMETER 2011 – HOSPITALITY
MARKET BAROMETER 2011HOSPITALITY
INTRODUCTION
OBJECTIVES AND METHODOLOGY
FIRMOGRAPHICS AND RESPONDENT PROFILE
KEY FINDINGS
IMPORTANCE OF MOBILITY AND INVESTMENT DRIVERS
DEPLOYMENTS
WLAN STRATEGY
BUDGETS AND MOBILE INVESTMENTS
CONCLUSIONS

PAGE 36
MOTOROLA SOLUTIONS MARKET BAROMETER 2011 – HOSPITALITY
CONCLUSIONS• Mobility technologies are a
recognizable differentiator for hospitality venues seeking a competitive advantage for their business through increased customer satisfaction.
• Hospitality decision makers realize the increasing importance of mobile and wireless technology to their businesses and have increased their investments in 2011.
• The majority of hospitality venues have deployed wireless LAN technology and are making plans for expansion and upgrades to handle greater data volumes and increasing demands for high-speed access from the customer and mobile workforce.
Insert images

PAGE 37
THANK YOU