Q2 2009 10 Narrative final - Welcome to EPWP€¦ · · 2011-01-31This narrative should be read...
34
1 Report for the period April 2009 to September 2009 (YEAR 1) (Containing interim data and information for the period 1 April 2009 to 31 September 2009) Financial Year 2009/10 This narrative should be read in conjunction with Annexures A – H)
Transcript of Q2 2009 10 Narrative final - Welcome to EPWP€¦ · · 2011-01-31This narrative should be read...

1
Report for the period April 2009 to September 2009 (YEAR 1)
(Containing interim data and information for the period 1 April 2009 to 31 September 2009)
Financial Year 2009/10
This narrative should be read in conjunction with Annexures A – H)

2
Table of contents 1. Introduction ........................................................................................................................... 4
2. Progress per sector ............................................................................................................ 12
2.1 Infrastructure sector ................................................................................................................ 12
2.2 Social Sector............................................................................................................................ 17
2.3 Environment and Culture......................................................................................................... 22
2.4 Non State Sector ..................................................................................................................... 28
2.5 Enterprise Development .......................................................................................................... 31
3. Administration Review............................................................................................................. 33
List of Tables Table 1: Number of projects reported and projects excluded ......................................................... 5
Table 2: Number of work opportunities lost due to exclusions........................................................ 6
Table 3: Overall EPWP reported projects ....................................................................................... 7
Table 4: Overall EPWP achievements ............................................................................................ 7
Table 5: Comparison of Q1 and Q2 work opportunities achievements........................................... 8
Table 6: Overall EPWP minimum daily wages per province per sphere....................................... 11
Table 7: Infrastructure sector work opportunities per province and sphere .................................. 12
Table 8: Infrastructure Sector Q2 FTE achieved vs annual target per sphere.............................. 16
Table 9: Infrastructure sector Provincial FTEs performance against threshold per province ....... 16
Table 10: Social sector work opportunities per sphere ................................................................. 17
Table 11: Social sector work opportunities per province and sphere............................................ 18
Table 12: Social sector average minimum wage per province and sphere .................................. 21
Table 13: Social sector FTE achievements against annual target per sphere............................. 21
Table 14: Environment and culture work opportunities per province ............................................ 23
Table 15: Environment and culture work opportunities per province ............................................ 24
Table 16: Environment and culture average minimum wages per province and sphere .............. 27
Table 17: Environment and Culture sector FTE achievements vs annual target per sphere........ 27
Table 18: Non state sector progress ............................................................................................. 29
Table 18: Summary table for enterprise development .................................................................. 32
3
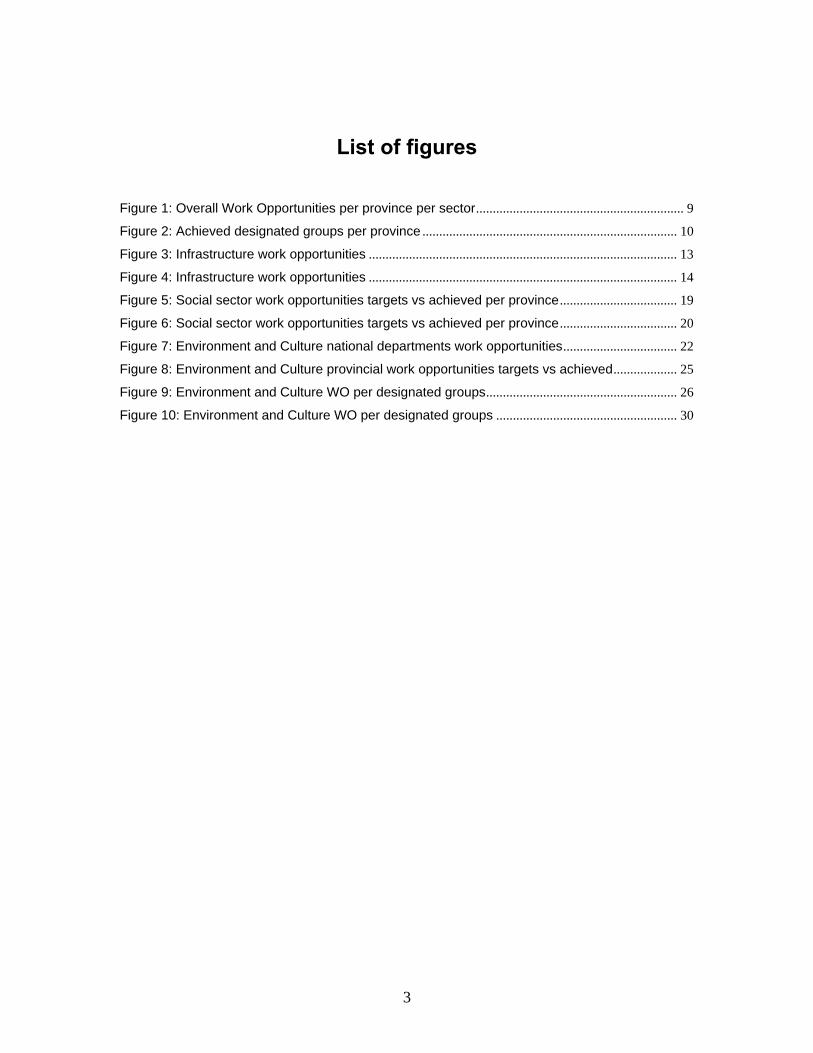
List of figures Figure 1: Overall Work Opportunities per province per sector.............................................................. 9
Figure 2: Achieved designated groups per province ............................................................................ 10
Figure 3: Infrastructure work opportunities ............................................................................................ 13
Figure 4: Infrastructure work opportunities ............................................................................................ 14
Figure 5: Social sector work opportunities targets vs achieved per province................................... 19
Figure 6: Social sector work opportunities targets vs achieved per province................................... 20
Figure 7: Environment and Culture national departments work opportunities.................................. 22
Figure 8: Environment and Culture provincial work opportunities targets vs achieved................... 25
Figure 9: Environment and Culture WO per designated groups......................................................... 26
Figure 10: Environment and Culture WO per designated groups ...................................................... 30
4
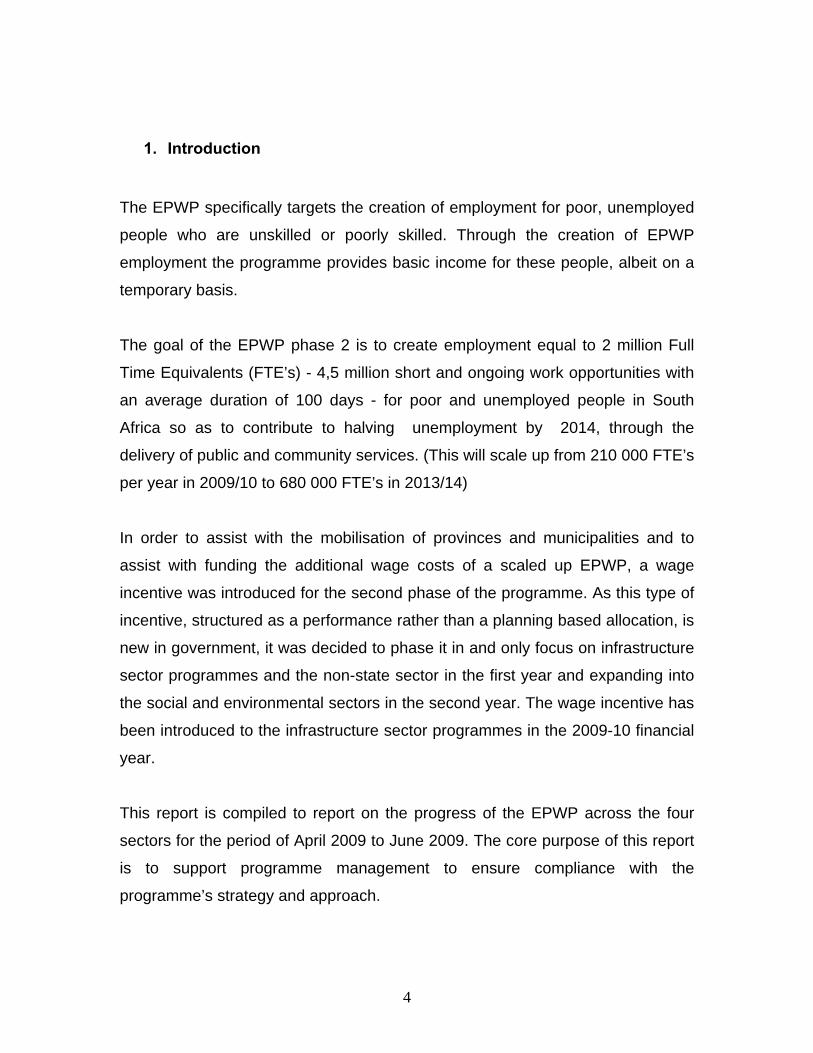
1. Introduction
The EPWP specifically targets the creation of employment for poor, unemployed
people who are unskilled or poorly skilled. Through the creation of EPWP
employment the programme provides basic income for these people, albeit on a
temporary basis.
The goal of the EPWP phase 2 is to create employment equal to 2 million Full
Time Equivalents (FTE’s) - 4,5 million short and ongoing work opportunities with
an average duration of 100 days - for poor and unemployed people in South
Africa so as to contribute to halving unemployment by 2014, through the
delivery of public and community services. (This will scale up from 210 000 FTE’s
per year in 2009/10 to 680 000 FTE’s in 2013/14)
In order to assist with the mobilisation of provinces and municipalities and to
assist with funding the additional wage costs of a scaled up EPWP, a wage
incentive was introduced for the second phase of the programme. As this type of
incentive, structured as a performance rather than a planning based allocation, is
new in government, it was decided to phase it in and only focus on infrastructure
sector programmes and the non-state sector in the first year and expanding into
the social and environmental sectors in the second year. The wage incentive has
been introduced to the infrastructure sector programmes in the 2009-10 financial
year.
This report is compiled to report on the progress of the EPWP across the four
sectors for the period of April 2009 to June 2009. The core purpose of this report
is to support programme management to ensure compliance with the
programme’s strategy and approach.

5
This will improve responsiveness of implementing bodies and ensure the
collection, processing and submission of reliable and timely data. The report
should assist in assessing if the benefits are reaching the intended beneficiaries
(e.g youth, etc.), and whether the interventions are contributing to the
achievement of the strategic objectives. The report will enable sectors to make
data-based decisions regarding interventions.
As targets were set for the first five years of the EPWP Phase 2 and definitions of
agreed indicators are spelled out in the logframe document. Some of the
important targets are that of 550, 000 work opportunities and 210,000 Full Time
equivalents ( FTE) to be achieved in the first year of the second phase.
Table 1 below gives a reflection of the total number of projects received on the
system and the number that were excluded due to non compliance.
Table 1: Number of projects reported and projects excluded
The total number of projects reported was 8,542 projects. Of those that were
reported, 3,256 (38%) were excluded due to incomplete data. Most projects were
excluded in the social sector (46%), followed by the environment and culture
sector (28%). The infrastructure sector reported 2,111 projects and 545 (25%)
were excluded.
Environmental & Culture
Infrastructure
Social
Total projects
Province Projects reported
Projects Projects reported
Projects excluded
Projects reported
Projects excluded
Projects reported
Projects excluded
EC 219 103 278 10 263 177 769 290 FS 75 23 193 33 364 112 635 168 GP 273 61 235 55 601 365 1,112 481 KN 212 52 336 39 416 349 968 440 LP 125 39 271 134 2,061 750 2,460 923 MP 148 25 190 96 408 224 751 345 NW 150 34 219 70 558 188 928 292 NC 57 28 118 15 89 17 264 60 WC 262 74 271 93 122 90 655 257
Total 1,521
439 (28%)
2,111
545 (25%)
4,882
2,272 (46%)
8,542
3,256 (38%)
6
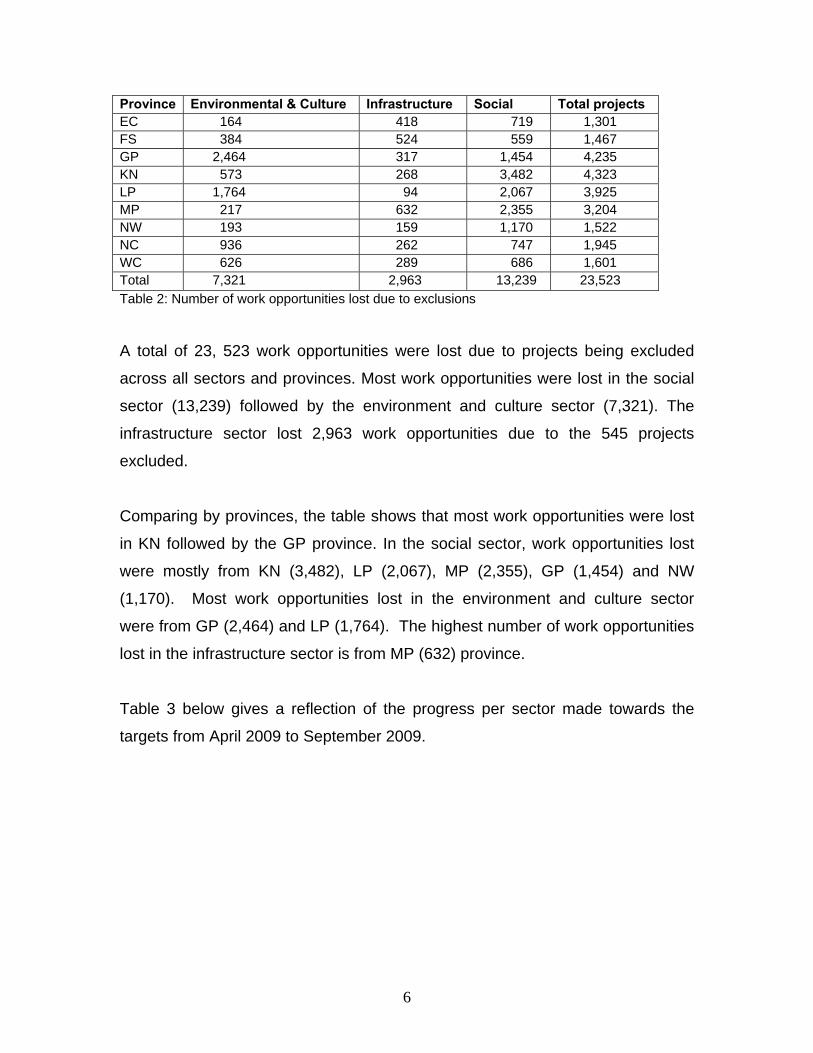
Province Environmental & Culture Infrastructure Social Total projects EC 164 418 719 1,301 FS 384 524 559 1,467 GP 2,464 317 1,454 4,235 KN 573 268 3,482 4,323 LP 1,764 94 2,067 3,925 MP 217 632 2,355 3,204 NW 193 159 1,170 1,522 NC 936 262 747 1,945 WC 626 289 686 1,601 Total 7,321 2,963 13,239 23,523 Table 2: Number of work opportunities lost due to exclusions
A total of 23, 523 work opportunities were lost due to projects being excluded
across all sectors and provinces. Most work opportunities were lost in the social
sector (13,239) followed by the environment and culture sector (7,321). The
infrastructure sector lost 2,963 work opportunities due to the 545 projects
excluded.
Comparing by provinces, the table shows that most work opportunities were lost
in KN followed by the GP province. In the social sector, work opportunities lost
were mostly from KN (3,482), LP (2,067), MP (2,355), GP (1,454) and NW
(1,170). Most work opportunities lost in the environment and culture sector
were from GP (2,464) and LP (1,764). The highest number of work opportunities
lost in the infrastructure sector is from MP (632) province.
Table 3 below gives a reflection of the progress per sector made towards the
targets from April 2009 to September 2009.
7
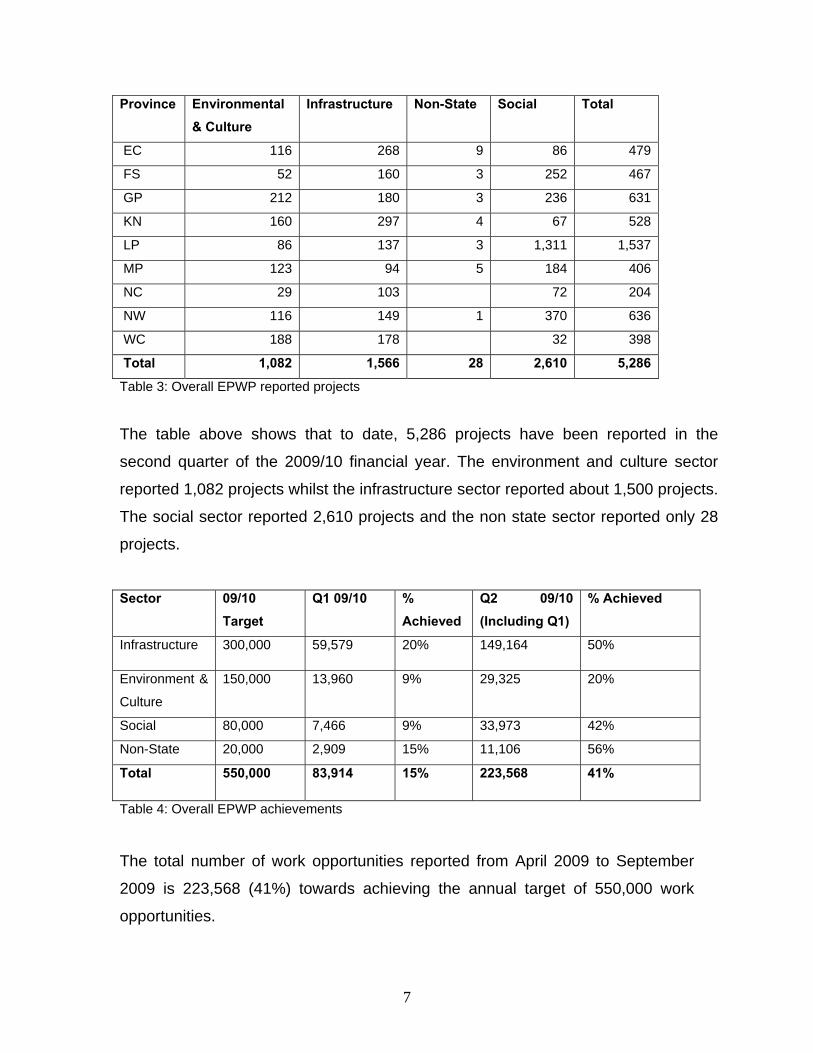
Province Environmental & Culture
Infrastructure Non-State Social Total
EC 116 268 9 86 479
FS 52 160 3 252 467
GP 212 180 3 236 631
KN 160 297 4 67 528
LP 86 137 3 1,311 1,537
MP 123 94 5 184 406
NC 29 103 72 204
NW 116 149 1 370 636
WC 188 178 32 398
Total 1,082 1,566 28 2,610 5,286
Table 3: Overall EPWP reported projects
The table above shows that to date, 5,286 projects have been reported in the
second quarter of the 2009/10 financial year. The environment and culture sector
reported 1,082 projects whilst the infrastructure sector reported about 1,500 projects.
The social sector reported 2,610 projects and the non state sector reported only 28
projects.
Sector 09/10
Target Q1 09/10 %
Achieved Q2 09/10 (Including Q1)
% Achieved
Infrastructure 300,000 59,579 20% 149,164 50%
Environment &
Culture
150,000 13,960 9% 29,325 20%
Social 80,000 7,466 9% 33,973 42%
Non-State 20,000 2,909 15% 11,106 56%
Total 550,000 83,914 15% 223,568 41%
Table 4: Overall EPWP achievements
The total number of work opportunities reported from April 2009 to September
2009 is 223,568 (41%) towards achieving the annual target of 550,000 work
opportunities.

8
The infrastructure sector has achieved 50% of its annual target of 300, 000 in
quarter 2 compared to 20% in Q1. The Environment and culture sector achieved
20% in Q2 compared to 9% achievement in Q1. The social sector has also
shown some improvement achieving 42% towards its 80,000 target compared to
Q1 when it achieved only 9%. The Non state sector increased significantly, from
15% in Q1 to 56% in Q2.
Province Q1 09/10 Q2 09/10 Q2- Q1 % Increase
EC 15,838 36,900 21,062 57%
FS 4,208 11,420 7,212 63%
GP 14,058 44,291 30,233 68%
KN 34,867 70,231 35,364 50%
LP 2,064 12,736 10,672 84%
MP 2,812 11,355 8,543 75%
NC 1,774 8,153 6,379 78%
NW 2,666 9,211 6,545 71%
WC 5,627 19,271 13,644 71%
Total 83,914 223,568 139,654 62%
Table 5: Comparison of Q1 and Q2 work opportunities achievements
Overall, there has been a 62% increase in reporting between Q1 and Q2. There
were 139,654 work opportunities created in Q2 compared to 83,914 opportunities
in Q1. The LP province showed a highest increase in reporting between Q1 and
Q2 achieving 84% increase followed by NC (78%) and MP (75%). North West
and WC provinces achieved 71% respectively.
The GP province showed a 68% increase from Q1. The least improved reporting
was seen in KN province showing a 50% increase from Q1 reporting.

9
Work oportunities per province per sector for Q2 09/10 (April-September 09)
-
10,000
20,000
30,000
40,000
50,000
60,000
70,000N
umbe
r of w
ork
oppo
rtun
ities
Environmental & Culture 5,229 1,672 4,541 6,560 2,398 1,242 874 1,649 5,160
Infrastructure 26,148 3,608 31,301 59,059 4,448 5,365 3,968 5,372 9,895
Non-State 3,200 1,470 2,331 784 1,042 1,711 568
Social 2,323 4,670 6,118 3,828 4,848 3,037 3,311 1,622 4,216
EC FS GP KN LP MP NC NW WC
Figure 1: Overall Work Opportunities per province per sector
Looking at the work opportunities reported this quarter by sector and province, it
showed that KN in the infrastructure sector reporting the highest with a total of
59,059 work opportunities. This was followed by GP province for infrastructure,
reporting 31,301 and the EC in the infrastructure sector reporting 26,148 work
opportunities.
In the environment and culture sector, the highest number of work opportunities
was reported by KN province reporting 6,560 work opportunities followed by the
EC province reporting 5,229 work opportunities.
In the FS and LP provinces, the highest number of work opportunities were
reported by the social sector compared to other sectors whilst in the other
provinces, infrastructure sector reported the highest number of work
opportunities.

10
The social sector work opportunities achieved were mostly contributed by the
Gauteng province reporting 6,118 work opportunities followed by the LP province
reporting 4,848 work opportunities.
Achieved Designated groups per provinceQ2 09/10 (April - September 2009)
37% 36%
46%
29%
42%
34%
41%
48%
40%38%
54%
27%
78%
63% 64%
45% 44% 42%
55%
5% 5%2% 0% 1% 1% 1% 2% 1% 2%
36%
0%
10%
20%
30%
40%
50%
60%
70%
80%
90%
EC FS GP KN LP MP NC NW WC GrandTotal
Perc
enta
ge Youth (40%)Women (55%)People with disabilities (2%)
Figure 2: Achieved designated groups per province
The figure above shows that overall, the programme have achieved the 55% of
women target achieving 55%, the 2% people with disabilities target achieving 2%
overall. The programme achieved 38% of youth compared to the 40% set target.
The EC and FS achieved 5% of people with disabilities respectively but could not
achieve the women and youth targets. GP province achieved 2% people with
disabilities, 46% against 40% target but did not achieve the 55% women target,
achieving only 27%. KN province, achieved 77% of women target but could not
achieve the youth and people with disabilities target. LP province exceeded the
women target (63%) and youth target (42%) but achieved only 1% for the people
with disabilities target. MP province only achieved the women target achieving

11
64% whilst NC and WC achieved the youth target only. The NW province
achieved the youth and people with disabilities target, achieving 2% people with
disabilities and 48% youth.
Province Municipal ( R ) National ( R ) Provincial ( R ) Total
EC 76 60 47 61
FS 71 36 56 53
GP 78 72 57 67
KN 82 59 61 63
LP 70 55 67 67
MP 60 58 42 50
NC 66 60 59 60
NW 81 48 42 47
WC 95 56 100 76
Total 76 57 60 61
Table 6: Overall EPWP minimum daily wages per province per sphere
On average, the minimum daily wage paid in the program is R61 per day. The
average minimum daily wage paid by municipalities is R76 whilst provincial
sphere pays R60. The national projects pay the minimum of R57 per day to
beneficiaries.
The minimum wage that is being agreed in the EPWP is R50 across all sectors
and spheres. The table above shows that some provinces are still paying less
that the EPWP minimum daily wage of R50. EC provincial sphere is paying R47,
MP and NW provincial pays R42 respectively. The FS national projects pay R36
whilst NW national pays R48 per day minimum. It is interesting to note that all
municipal projects across all provinces pay more than a minimum R50 a day.

12
2. Progress per sector
2.1 Infrastructure sector
In the infrastructure sector the emphasis is on creating additional work
opportunities through the introduction of labour-intensive construction methods.
Labour intensive construction methods involve the use of an appropriate mix of
labour and machines, with a preference for labour where technically and
economically feasible, without compromising the quality of the product. The
sector focuses on infrastructure amenable to the construction, rehabilitation and
maintenance by labour intensive methods provided by national departments,
provinces and municipalities.
Province Municipal National Provincial Total
EC 7,770 451 17,927 26,148
FS 1,150 403 2,055 3,608
GP 26,078 295 4,928 31,301
KN 18,766 40,293 59,059
LP 2,232 2,216 4,448
MP 1,832 3,533 5,365
NC 1,827 484 1,657 3,968
NW 2,439 307 2,626 5,372
WC 674 561 8,660 9,895
Total 62,768 (42%) 2,501 (1%) 83,895 (56%) 149,164
Table 7: Infrastructure sector work opportunities per province and sphere
The infrastructure sector has created 149,164 work opportunities from April to
September 2009. In the sector, most projects reported were created by provinces
reporting 83,895 work opportunities which contribute 56% of the total work
opportunities created. Municipalities creating 62,768 work opportunities,
contributing 42% of the total achieved by the sector. The projects implemented
by national departments created 2,501 work opportunities and contributed 1%

13
towards the achievement of the sector. There were no projects funded by
national departments that were reported in the KN, MP and LP province.
The GP and KN municipalities reported the highest number of work opportunities,
creating 26,078 and 18,766 respectively. The KN and EC provinces reported
more provincial (12,834) compared to 1,432 work opportunities reported by EC
municipalities. In the FS province, the nationally funded projects reported more
work opportunities (403) compared to provincial projects.
The EC, FS, KN, NW, MP and WC provinces reported more provincially funded
work opportunities than any other sphere of government. The GP, LP and NC
provinces reported more municipal work opportunities than provincial and
national.
Infrastructure Sector Q2 achievenments against targets(April-September 2009)
50%
50% 21% 39% 25% 11%
92%
62%
18%
54%
0
50,000
100,000
150,000
200,000
250,000
300,000
350,000
Num
ber o
f wor
k op
port
uniti
es
Dec Target 48,107 20,132 50,552 64,113 40,106 21,416 10,215 25,669 19,753 300,063
Achieved 26,148 3,608 31,301 59,059 4,448 5,365 3,968 5,372 9,895 149,164
EC FS GP KN LP MP NC NW WC Total
Figure 3: Infrastructure work opportunities
14
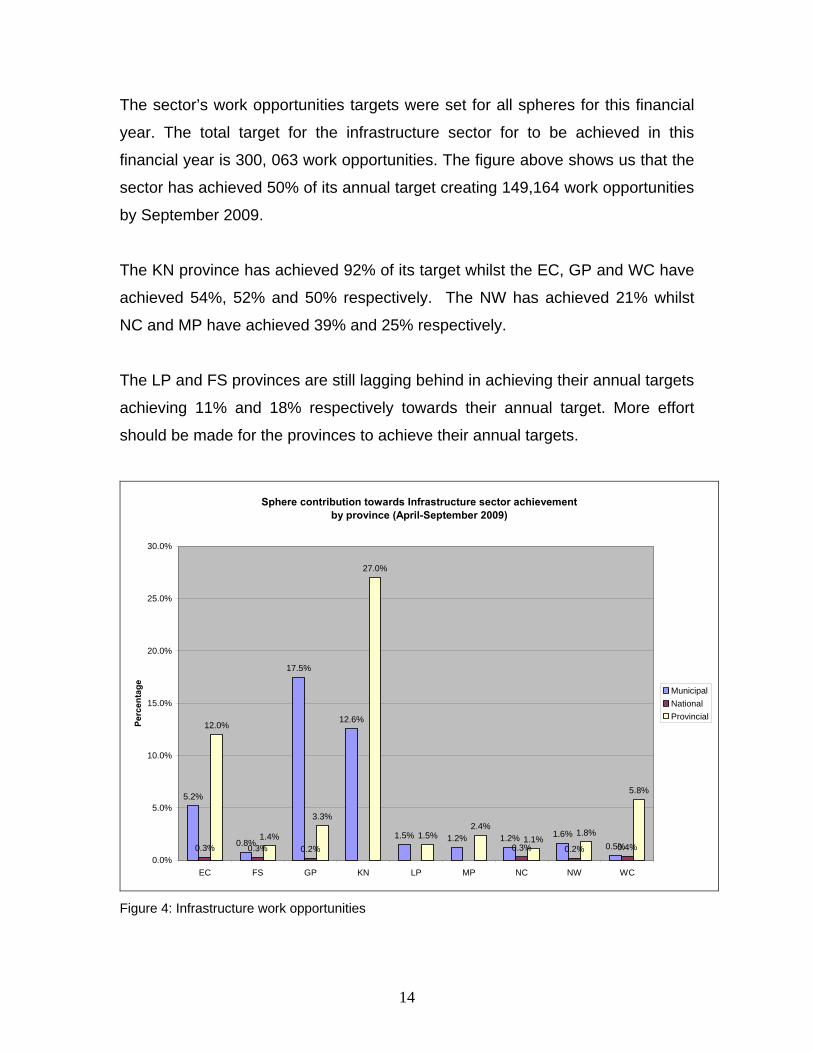
The sector’s work opportunities targets were set for all spheres for this financial
year. The total target for the infrastructure sector for to be achieved in this
financial year is 300, 063 work opportunities. The figure above shows us that the
sector has achieved 50% of its annual target creating 149,164 work opportunities
by September 2009.
The KN province has achieved 92% of its target whilst the EC, GP and WC have
achieved 54%, 52% and 50% respectively. The NW has achieved 21% whilst
NC and MP have achieved 39% and 25% respectively.
The LP and FS provinces are still lagging behind in achieving their annual targets
achieving 11% and 18% respectively towards their annual target. More effort
should be made for the provinces to achieve their annual targets.
Sphere contribution towards Infrastructure sector achievement by province (April-September 2009)
5.2%
0.8%
17.5%
12.6%
1.5% 1.2% 1.2% 1.6%0.5%0.3% 0.3% 0.2% 0.3% 0.2% 0.4%
12.0%
1.4%
3.3%
27.0%
1.5%2.4%
1.1%1.8%
5.8%
0.0%
5.0%
10.0%
15.0%
20.0%
25.0%
30.0%
EC FS GP KN LP MP NC NW WC
Perc
enta
ge MunicipalNationalProvincial
Figure 4: Infrastructure work opportunities

15
The graph above shows the contribution of the province and sphere towards the
achieved in the reporting period. The graph clearly shows the highest contributor
as KN provincial contributing 27% towards the sector’s achievement followed by
GP municipalities contributing 17.5%. The EC municipal contributed 12.6%
followed by EC provincial sphere (12%). The FS, LP, NC, MP and NW
contributed less than 2% across all spheres.
Average labour intensity per province and sphere of government (April - September 2009)
0%
10%
20%
30%
40%
50%
60%
Labo
ur in
tens
ity
Municipal 36% 11% 15% 23% 47% 6% 51% 8% 52% 25%
National 0.4% 0.0% 1% 0.38% 1% 0.07% 0.24%
Provincial 6% 1% 3% 10% 15% 9% 4% 18% 10% 9%
Grand Total 25% 3% 11% 13% 31% 6% 11% 13% 14% 15%
EC FS GP KN LP MP NC NW WC Grand Total
Figure 5: Infrastructure labour intensity
The figure above depicts average labour intensity per province and sphere of
government. The average labour intensity for the sector is 15%. However, there
is a considerable variation of labour intensity across all provinces and levels of
government. Municipality projects have the highest average labour intensity of
25% compared to 9% and 0.24% of provincial and national projects respectively.
Between provinces, Eastern Cape has the highest average labour intensity of
25% and the lowest of 3% is recorded at Free State province.

16
Sphere 09/10 Target Achieved % Achieved
Municipal 60,548 13,671 23%
Provincial 47,461 14,579 31%
National 687 508 74%
Total 108,696 28,758 26%
Table 8: Infrastructure Sector Q2 FTE achieved vs annual target per sphere
The FTE targets were broken down per annum, sector and sphere for all the
financial years. For this financial year, the infrastructure sector has a target of
108,696 FTE across all spheres and the sector has achieved 26% of the target
(28,758).
Comparing different spheres of government, the municipalities achieved 23% of
their target (13,671/60,548) FTEs whilst the provincial sphere projects achieved
31%. The national sphere projects achieved 74% towards achieving its 687 FTE
by achieving 508 FTEs.
Provincial Gov Dept
2009-10 ELIGIBILITY THRESHOLD
Q2 (April- September 2009) THRESHOLD
Q2 ACTUAL FTE PERFORMANCE
Q2 % Performance
KN 6,791 3,395 6,238 184%
WC 2,003 1,002 2,038 203%
GP 2,594 1,297 1,208 93%
EC 5,836 2,918 2,949 101%
MP 2,760 1,380 483 35%
FS 2,407 1,204 235 20%
LP 5,208 2,604 477 18%
NW 2,731 1,366 596 44%
NC 1,103 552 354 64%
TOTAL 31,434 15,718 14,579 93%
Table 9: Infrastructure sector Provincial FTEs performance against threshold per province

17
The annual FTE targets were set for the infrastructure sector for the 5 years of
the programme. Of the annual target set, quarterly thresholds were set for public
bodies to achieve per quarter in order to qualify for an incentive.
The table above shows that from the set provincial Q2 FTE targets, KN, EC and
WC reached and exceeded their quarterly thresholds with 184%, 101% and
203% respectively. The GP province achieved 93% towards their Q2 threshold.
The LP province is still lagging behind in achieving target achieving only 18% of
its Q2 threshold whilst the FS, MP, NW and NC provinces did not achieve their
threshold.
More efforts should be made to assist the provinces to achieve its work
opportunities and FTE targets.
2.2 Social Sector
The social sector’s focus was on the expansion of Home and Community Base
Care (HCBC) and on Early Childhood Development (ECD) Programmes. The
sector has expanded from the two main programmes and added other
programmes such as Safety and Security (SS) and School Nutrition (SN). All of
these programmes are highly labour-intensive and provide enormous
opportunities for the creation of work opportunities, given the large needs for
these services.
Spheres 09/10 Work
opportunities targets Achieved Percentage
National - - -
Provincial 77,256 31,740 41%
Municipal 2,744 2,233 81%
Total 80,000 33,973 42%
Table 10: Social sector work opportunities per sphere

18
The annual sector targets were set for all spheres of governments except the
national departments that do not have any targets. The provincial departments
improved significantly achieving 41% of their annual target of 77,256 compared
to 8% in Q1. The municipalities achieved 81% towards the 2,744 annual work
opportunities target set compared to 57% in Q1.
More work needs to be done to ensure that provinces report the work
opportunities created since 96% of the sector targets are in the province. The
provinces have to create 72,534 work opportunities to be able to achieve the
80,000 target set.
Province Municipal Provincial Total
EC 2,323 2,323
FS 921 3,749 4,670
GP 666 5,452 6,118
KN 646 3,182 3,828
LP 4,848 4,848
MP 3,037 3,037
NC 3,311 3,311
NW 1,622 1,622
WC 4,216 4,216
Total 2,233 (6%) 31,740 (94%) 33,973
Table 11: Social sector work opportunities per province and sphere
In Table 9, work opportunities are broken down by sphere and province to see
the performance of the provinces per sphere. It is clear that the sector is mainly
implemented by provincial departments compared to municipalities.
The GP province reported the highest number of work opportunities (5,452)
followed by the LP province (4,848). The province that reported the least number
of work opportunities created was MP reporting 3,037 work opportunities.
19
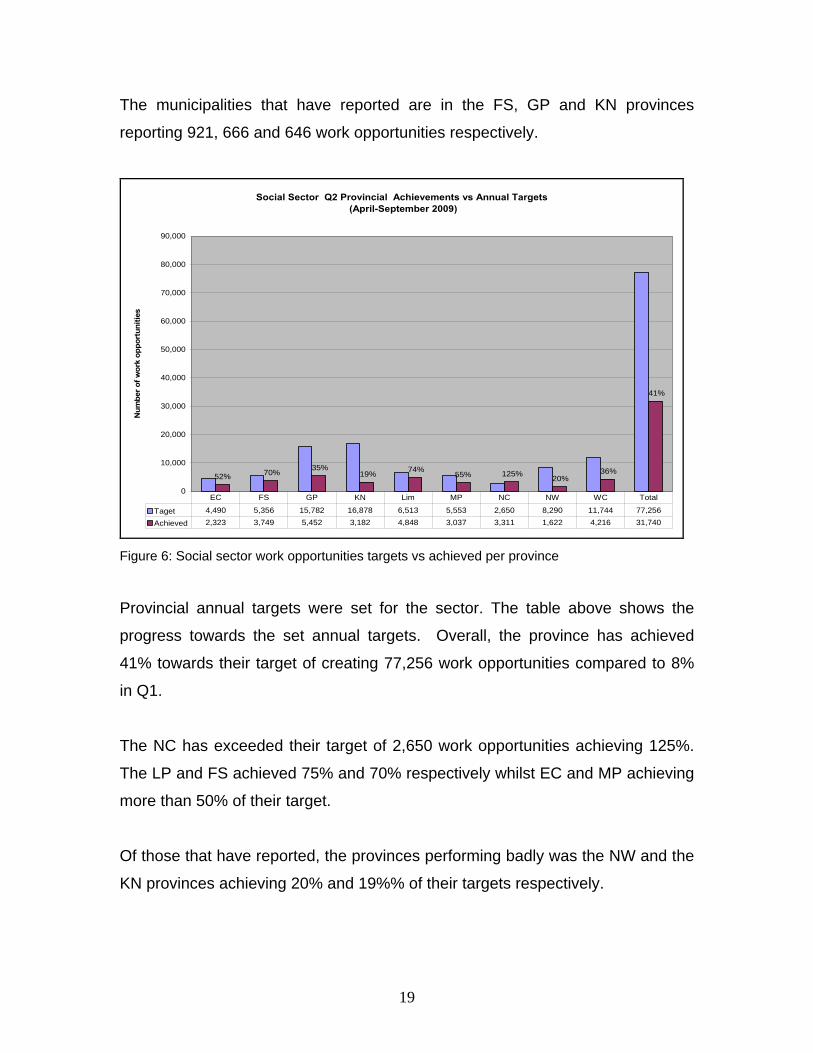
The municipalities that have reported are in the FS, GP and KN provinces
reporting 921, 666 and 646 work opportunities respectively.
Social Sector Q2 Provincial Achievements vs Annual Targets (April-September 2009)
41%
36% 20% 125% 55%
74% 19% 35% 70% 52%
0
10,000
20,000
30,000
40,000
50,000
60,000
70,000
80,000
90,000
Num
ber o
f wor
k op
port
uniti
es
Taget 4,490 5,356 15,782 16,878 6,513 5,553 2,650 8,290 11,744 77,256
Achieved 2,323 3,749 5,452 3,182 4,848 3,037 3,311 1,622 4,216 31,740
EC FS GP KN Lim MP NC NW WC Total
Figure 6: Social sector work opportunities targets vs achieved per province
Provincial annual targets were set for the sector. The table above shows the
progress towards the set annual targets. Overall, the province has achieved
41% towards their target of creating 77,256 work opportunities compared to 8%
in Q1.
The NC has exceeded their target of 2,650 work opportunities achieving 125%.
The LP and FS achieved 75% and 70% respectively whilst EC and MP achieving
more than 50% of their target.
Of those that have reported, the provinces performing badly was the NW and the
KN provinces achieving 20% and 19%% of their targets respectively.

20
Social Sector Achievements by designated groups (April-September 2009)
45%
34%
40%
61%
37%
27% 28%
36%
45%40%
100%
40%
49%
80%
91%95%
65%
94%
85%
74%
0.3% 0.3% 0.4% 0.3% 0.2% 0.0% 0.2% 0.6% 0.4% 0.3%0%
20%
40%
60%
80%
100%
120%
EC FS GP KN LP MP NC NW WC Total
Perc
enta
ge Youth (40%)Social (55%)Disabilities (2%)
Figure 7: Social sector work opportunities targets vs achieved per province
The targets for the designated groups were set at 55% for women, 40% for the
youth and 2% for people with disabilities. Overall, the sector achieved the youth
target by employing 40% youth. The majority of the work opportunities in the
sector are women (74%) and only 0.3% is people with disabilities.
All provinces except FS (40%) and GP (49%) have not achieved the 55% women
target. The youth target was achieved and exceeded by EC, GP, KN and WC
targets whilst the rest of the provinces did not achieve the 40% target. The MP
and NC achieved the least in creating work opportunities for the youth by
reporting 27% and 28% respectively.
None of the provinces have achieved the 2% target set for people with
disabilities.
21
Province Municipal Provincial Total
EC 39 39
FS 25 52 52
GP 24 51 47
KN 76 45 48
LP 65 65
MP 40 40
NC 43 43
NW 32 32
WC 96 96
Total 32 55 54
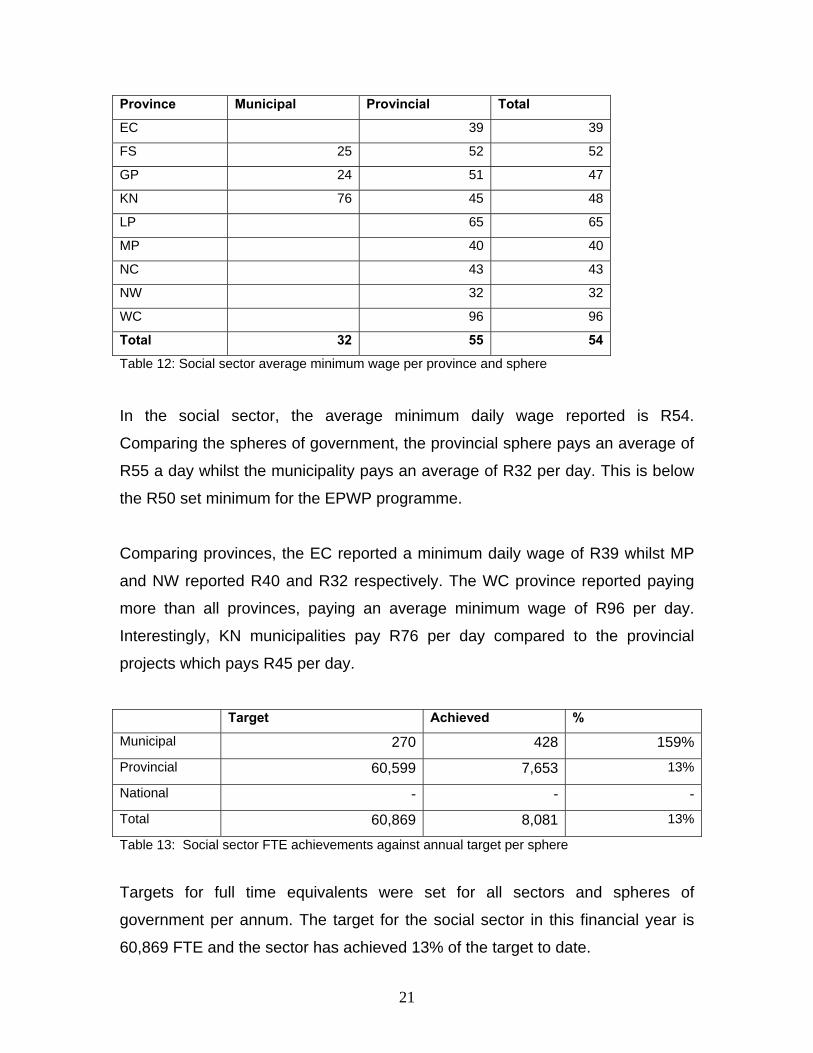
Table 12: Social sector average minimum wage per province and sphere
In the social sector, the average minimum daily wage reported is R54.
Comparing the spheres of government, the provincial sphere pays an average of
R55 a day whilst the municipality pays an average of R32 per day. This is below
the R50 set minimum for the EPWP programme.
Comparing provinces, the EC reported a minimum daily wage of R39 whilst MP
and NW reported R40 and R32 respectively. The WC province reported paying
more than all provinces, paying an average minimum wage of R96 per day.
Interestingly, KN municipalities pay R76 per day compared to the provincial
projects which pays R45 per day.
Target Achieved %
Municipal 270 428 159%
Provincial 60,599 7,653 13%
National - - -
Total 60,869 8,081 13%
Table 13: Social sector FTE achievements against annual target per sphere
Targets for full time equivalents were set for all sectors and spheres of
government per annum. The target for the social sector in this financial year is
60,869 FTE and the sector has achieved 13% of the target to date.
22
Municipal sphere exceeded the set target of 270 achieving 428 FTE whilst the
province only achieved 13% of the target.
2.3 Environment and Culture
The environment and culture sector involves the employment of people on
projects to improve their local environments, under programmes initiated by the
Department of Environmental affairs (which leads the sector), Department of
Agriculture, Department of Arts and Culture, Department of Water Affairs and
Forestry and the Department of Science and Technology.
Environment and Culture sector Q2 performance(National Departments)
1,489
6,673
11,787
20 410
20,379
-
5,000
10,000
15,000
20,000
25,000
DAC DEAT DWAF DPW NDA Total
Num
ber o
f wor
k op
port
uniti
es
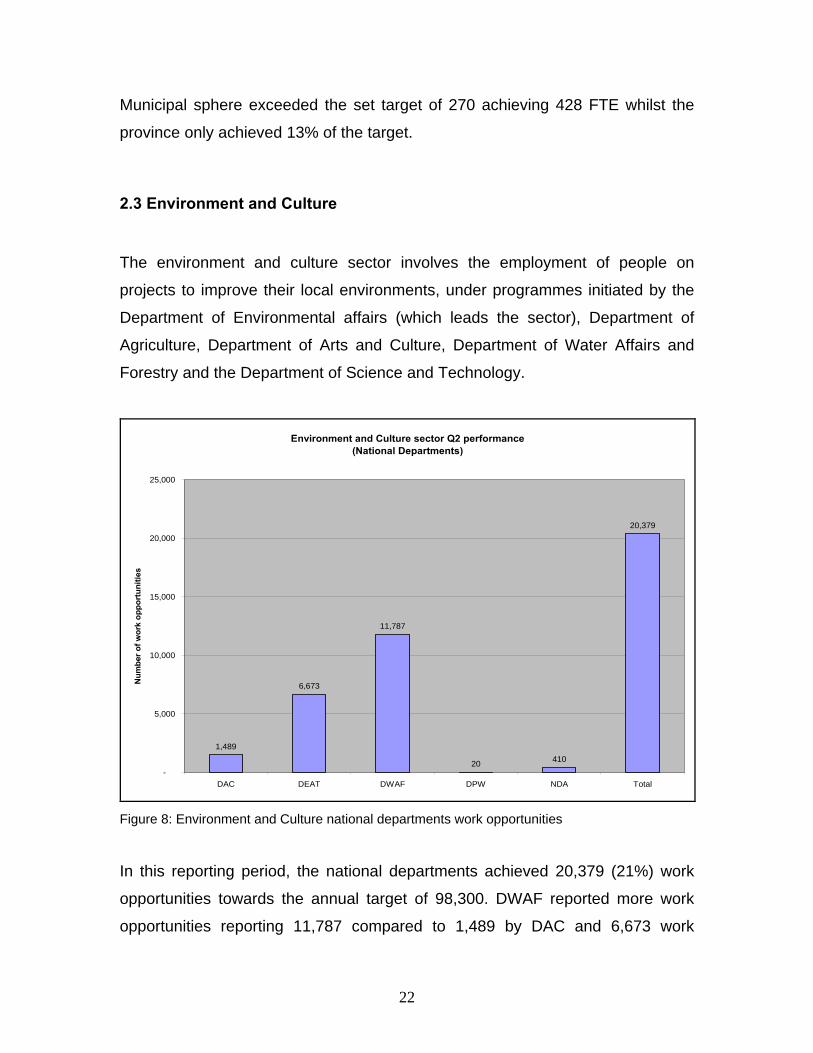
Figure 8: Environment and Culture national departments work opportunities
In this reporting period, the national departments achieved 20,379 (21%) work
opportunities towards the annual target of 98,300. DWAF reported more work
opportunities reporting 11,787 compared to 1,489 by DAC and 6,673 work
23
opportunities by DEAT. The national department of public works reported 20
work opportunities in the sector.
The table below summarises work opportunities per province and sphere of
government to see the distribution of work opportunities within the sector.
Sphere Targets Achieved Percentage
National 98,300 20,379 21%
Provincial 48,657 7,307 15%
Municipal 3,043 1,639 54%
Total 150,000 29,325 20%
Table 14: Environment and culture work opportunities per province
The above table shows that, this sector is mostly dominated by projects
implemented by national departments compared to other spheres of government.
Overall, the sector achieved 20% towards the annual target by creating 29,325
work opportunities from April to September 2009.
The national sphere of government has achieved 21% towards the annual
targets set reporting 20,379 work opportunities whilst municipalities have
achieved 54% towards their annual target reporting 1,639 work opportunities.
The provinces are lagging behind achieving 15% towards their annual target of
48,657 work opportunities.

24
Province Municipal National Provincial Total
EC 4,463 766 5,229
FS 93 1,477 102 1,672
GP 1,503 1,215 1,823 4,541
KN 4,326 2,234 6,560
LP 43 959 1,396 2,398
MP 1,178 64 1,242
NC 539 335 874
NW 1,079 570 1,649
WC 5,143 17 5,160
Total 1,639 20,379 7,307 29,325
Table 15: Environment and culture work opportunities per province
The table above shows that most work opportunities reported in the sector were
created by the national departments compared to other spheres of government.
Overall, the report shows that the KN province created more work opportunities
(6,560) followed by EC reporting 5,229 work opportunities for all spheres.
The NC reported the least work opportunities in the sector reporting only 874
work opportunities.
Looking at the provincially implemented projects, the report shows that KN
created the most work opportunities followed by GP then by LP provinces. The
least reported province is the WC, reporting only 17 work opportunities funded by
the province. The national and provincial funded projects were implemented in all
provinces whilst the municipal implemented projects were reported only in three
provinces namely GP, LP and FS.
25
Environment and Culture Provincial Achievement vs Targets per Province (April - September 2009)
15%
0.4% 10% 9% 1% 19% 28%73% 2.4%
9.5%0
10,000
20,000
30,000
40,000
50,000
60,000
Num
ber o
f wor
k op
port
uniti
es
Target 8,040 4,289 2,488 7,890 7,526 4,749 3,844 5,998 3,833 48,657
Achieved 766 102 1,823 2,234 1,396 64 335 570 17 7,307
EC FS GP KN LP MP NC NW WC Total
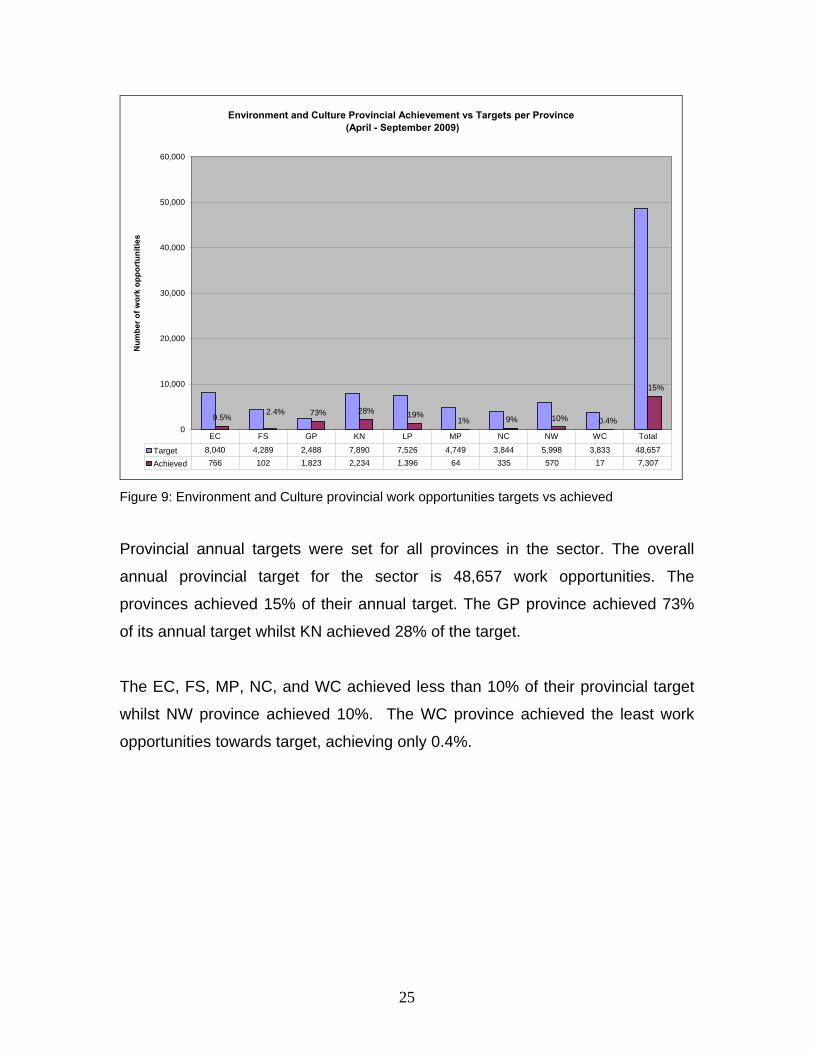
Figure 9: Environment and Culture provincial work opportunities targets vs achieved
Provincial annual targets were set for all provinces in the sector. The overall
annual provincial target for the sector is 48,657 work opportunities. The
provinces achieved 15% of their annual target. The GP province achieved 73%
of its annual target whilst KN achieved 28% of the target.
The EC, FS, MP, NC, and WC achieved less than 10% of their provincial target
whilst NW province achieved 10%. The WC province achieved the least work
opportunities towards target, achieving only 0.4%.

26
Environment and Culture Sector's WO per Designated groups per Province (April-September 2009)
35%32%
34%
51%
42%
33%
53%
21%
31%
48%
22%
26%
55%
24%
34%
26%
0.4% 1.0% 0.7% 1.2% 1.3% 1.5% 0.8% 0.4% 1.1% 0.9%
38%
20%
42%
37%
0%
10%
20%
30%
40%
50%
60%
EC FS GP KN LP MP NC NW WC Total
Perc
enta
ge Youth (40%)Women (55%)Disabled (2%)
Figure 10: Environment and Culture WO per designated groups
The performance of the sector towards against the set target for designated
groups shows that the sector did not achieve any of the targets. Overall, the
sector achieved 38% for youth, 37% for women and 0.9% for people with
disabilities.
Provincially, it shows that only KN, LP and NC achieved the 40% youth target
whilst other provinces were still below the target.
Only KN achieved the 55% target of women, achieving exactly 55% of women
employed. None of the provinces achieved the 2% people with disabilities target
with FS, KN, LP, MP and WC achieving at least 1% of the target. More efforts
should be made for the sector to achieve the set targets for designated groups.
27
Province Municipal National Provincial Total
EC 63 34 61
FS 55 51 48 51
GP 87 73 80 75
KN 59 55 58
LP 65 55 62 58
MP 58 65 58
NC 61 73 65
NW 48 62 50
WC 55 55 55
Total 82 59 63 60
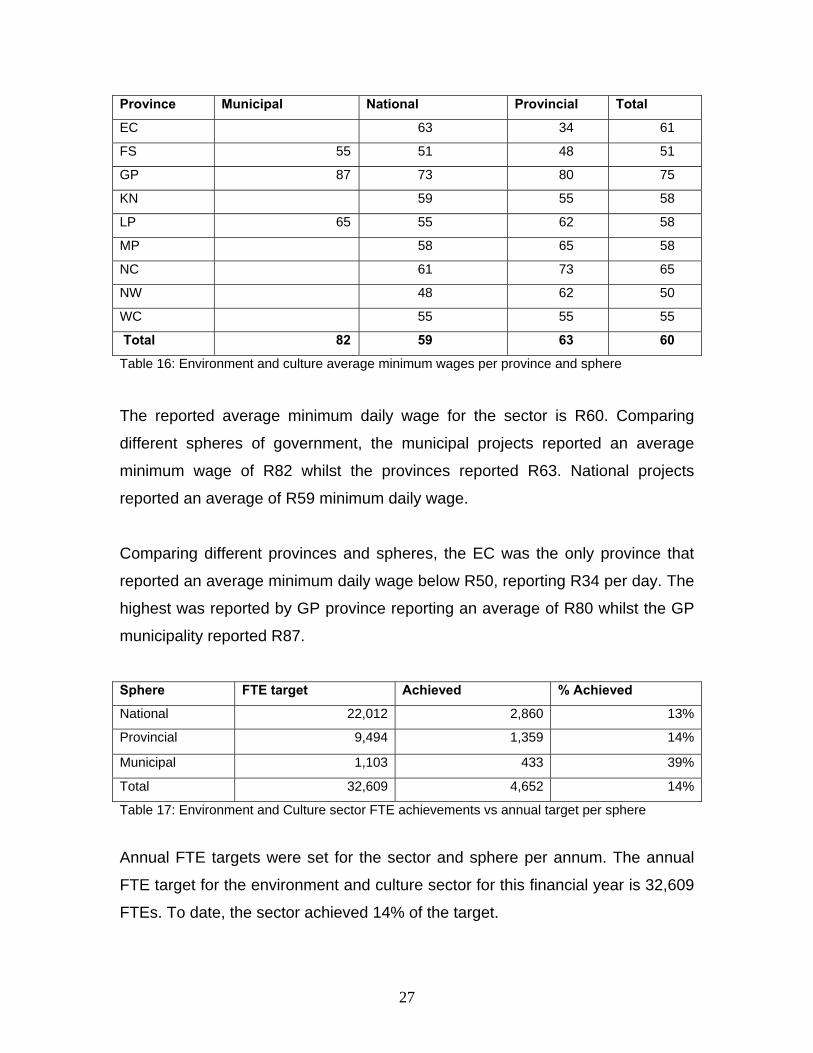
Table 16: Environment and culture average minimum wages per province and sphere
The reported average minimum daily wage for the sector is R60. Comparing
different spheres of government, the municipal projects reported an average
minimum wage of R82 whilst the provinces reported R63. National projects
reported an average of R59 minimum daily wage.
Comparing different provinces and spheres, the EC was the only province that
reported an average minimum daily wage below R50, reporting R34 per day. The
highest was reported by GP province reporting an average of R80 whilst the GP
municipality reported R87.
Sphere FTE target Achieved % Achieved
National 22,012 2,860 13%
Provincial 9,494 1,359 14%
Municipal 1,103 433 39%
Total 32,609 4,652 14%
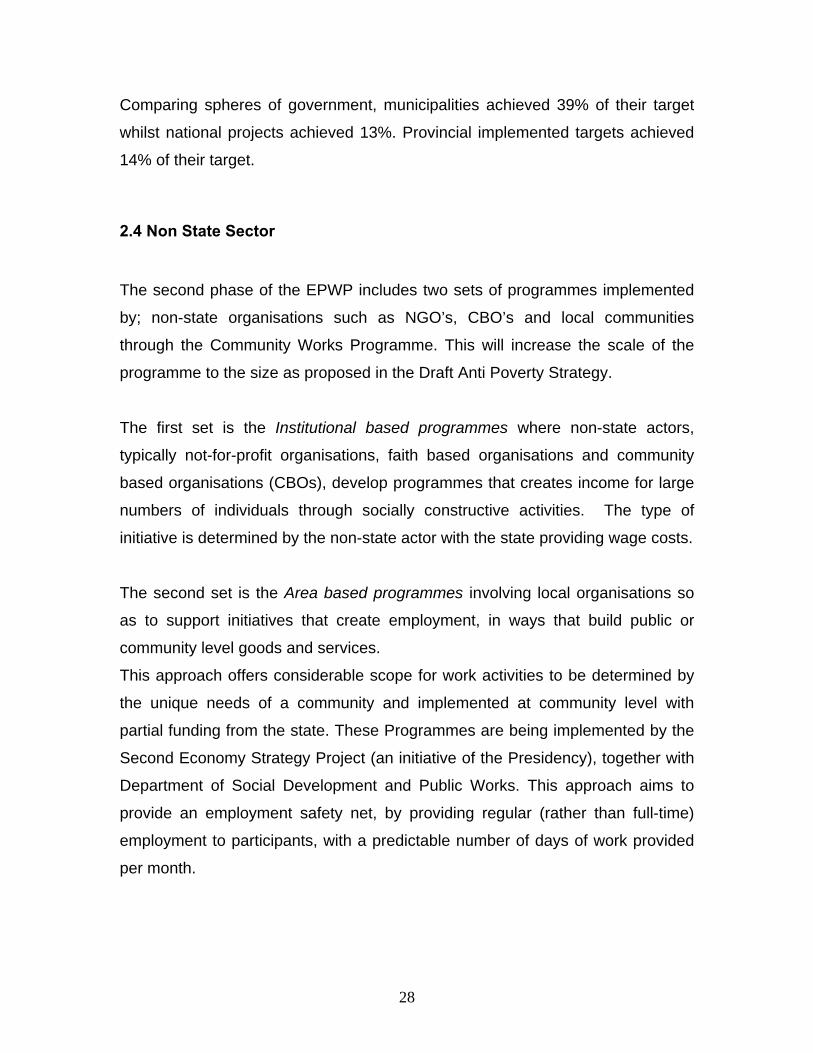
Table 17: Environment and Culture sector FTE achievements vs annual target per sphere
Annual FTE targets were set for the sector and sphere per annum. The annual
FTE target for the environment and culture sector for this financial year is 32,609
FTEs. To date, the sector achieved 14% of the target.
28
Comparing spheres of government, municipalities achieved 39% of their target
whilst national projects achieved 13%. Provincial implemented targets achieved
14% of their target.
2.4 Non State Sector
The second phase of the EPWP includes two sets of programmes implemented
by; non-state organisations such as NGO’s, CBO’s and local communities
through the Community Works Programme. This will increase the scale of the
programme to the size as proposed in the Draft Anti Poverty Strategy.
The first set is the Institutional based programmes where non-state actors,
typically not-for-profit organisations, faith based organisations and community
based organisations (CBOs), develop programmes that creates income for large
numbers of individuals through socially constructive activities. The type of
initiative is determined by the non-state actor with the state providing wage costs.
The second set is the Area based programmes involving local organisations so
as to support initiatives that create employment, in ways that build public or
community level goods and services.
This approach offers considerable scope for work activities to be determined by
the unique needs of a community and implemented at community level with
partial funding from the state. These Programmes are being implemented by the
Second Economy Strategy Project (an initiative of the Presidency), together with
Department of Social Development and Public Works. This approach aims to
provide an employment safety net, by providing regular (rather than full-time)
employment to participants, with a predictable number of days of work provided
per month.

29
Province Work opportunities FTEs Minimum daily wage
EC 3,200 182 50
FS 1,470 70 33
GP 2,331 70 38
KN 784 50 50
LP 1,042 73 40
MP 1,711 108 50
NW 568 28 43
Total 11,106 581 44
Table 18: Non state sector progress
The non state sector has a target of 20,000 work opportunities and 8,696 FTEs
for this financial year. To date, the sector has achieved 11,106 work opportunities
(55%) of the annual target and 581 FTE (6%) of the target.
Comparing provinces, the EC and GP created more work opportunities whilst
creating 3,200 and 2,331 work opportunities respectively. The KN and NW
provinces created the least work opportunities creating 784 and 568 work
opportunities respectively.
The average minimum daily wage is R44 with FS reported the least minimum
daily wage of R33.

30
Non state sector achievement per designated groups by province (April-September 09)
13%
8%11%
0%
31%
47%
0%
17%
74%
62%
54% 53%
81%
69%
50%
65%
0%
10%
20%
30%
40%
50%
60%
70%
80%
90%
EC FS GP KN LP MP NC NW WC Total
Perc
enta
ge
Youth (40%)Women (55%)
Figure 11: Non state sector WO per designated groups
The sector achieved 17% of the 40% set youth target and exceeded the 50%
women target achieving 65%.
Comparing different provinces, it shows that all provinces except GP, KN and
NW provinces have achieved the 55% of women target. The GP province
achieved 54% whilst KN and NW achieved 53% and 50% respectively. Only MP
projects achieved the 40% youth target whilst KN did not report any youth. There
were no non state sector projects reported in the NC and WC provinces.

31
2.5 Enterprise Development
SMME development is not a new phenomenon to the EPWP. In phase 1,
enterprises were created through various programmes. There are also new
programmes that have been developed by the various sectors that will be
requiring support from the Enterprise Development Unit.
Key programmes over the period 2004/05 – 2008/09 were: the Vuk’uphile
Programme; the Working for Water, Working for Wetlands and Cooperative
Development Programmes. These programmes have collectively ensured that
3201 SMMEs have been developed. SMMEs under EPWP are defined as a
separate and distinct business entity including cooperative enterprises managed
by one owner or more which including is branches or subsidiaries if any, is
predominantly carried on in any sector or sub-sector of the economy.

32
Province Sector Programme Target for
2009/10 № of SMMEs
Supported № of Job Created
Eastern Cape
Environment and Culture
Cleaning and Gardening Co-operatives
6 cooperatives 6 cooperatives 51
Eastern Cape
Infrastructure Vukuphile Buildings
50 close corporations
50 close corporations
768
Western Cape
Environment and Culture
Cape Nature: Working for Water
212 close corporations
212 close corporations
Western Cape
Environment and Culture
City of Cape Town: Waste Management
10 cooperatives 10 cooperatives 68
Northern Cape
Environment and Culture
Working for Water/Value Added Industries
3 cooperatives 3 cooperatives 28
Northern Cape & North West
Exit Support to Training Provider Capacity
Training Provider Capacity Programme
17 training providers
17 training providers
Limpopo Social School Nutrition
16 Co-ops 16 Co-ops 98
Limpopo Environment and Culture
Working for Wetlands
11 close corporations
11 close corporations
Kwa-Zulu Natal
Infrastructure Vukuphile: DOT
27 close corporations
27 close corporations
Gauteng Environment and Culture
Working for Wetlands
13 close corporations
13 close corporations
North West
Environment and Culture
Working for Wetlands
8 close corporations
8 close corporations
Table 19: Summary table for enterprise development
33
The enterprise development unit has supported a total of 356 corporations and
17 training providers. Of the 11 projects the sector is supporting, 7 (63%) are
from the environment and culture sector, 2 (18%) from infrastructure and one in
the social sector (9%). The training support project is a cross cutting training
programme.
The projects supported are from EC, WC, NC, NW, and LP with 2 projects each
whilst the GP and KN have one project each. The table above also shows that
the unit has achieved the entire 2009/10 target to support 356 corporations and
17 training providers. See attached Annexure
3. Administration Review
The National Department of Public Works has formalized the set targets with
individual public bodies through the signing of intergovernmental protocols in
which each public body have committed to a set of targets for the coming years.
The wage incentive has been accessed by KZN in the last quarter and 3
provinces are eligible for incentive this quarter.
A total of 90 data capturers have been employed to unlock the work opportunities
that could not be reported by public bodies due to lack of capacity.
More officials have been trained on the new reporting system (EPWP web based
system) which was introduced in the first quarter of the financial year. The
system has been improved to be able to accept a large volume of capturers at a
given time. Templates have been provided to all public bodies that do not have
access to the internet for reporting.

34
All agreements between the EPWP Non state sector and the intermediary (IDT)
were signed. The intermediary has signed all agreements with the non state
organizations for implementation.