Q1 FY2022 Earnings Presentation - vedantalimited.com
46
VEDANTA LIMITED INVESTOR PRESENTATION 26 JULY 2021 Q1 FY2022 Earnings Presentation
Transcript of Q1 FY2022 Earnings Presentation - vedantalimited.com

Sensitivity: Internal (C3)
VEDANTA LIMITEDINVESTOR PRESENTATION
26 JULY 2021
Q1 FY2022 Earnings Presentation
Sensitivity: Internal (C3)
VEDANTA LIMITED – Q1 FY2022 INVESTOR PRESENTATION 2
Cautionary Statement and Disclaimer
The views expressed here may contain information derived from
publicly available sources that have not been independently verified.
No representation or warranty is made as to the accuracy,
completeness, reasonableness or reliability of this information. Any
forward looking information in this presentation including, without
limitation, any tables, charts and/or graphs, has been prepared on
the basis of a number of assumptions which may prove to be
incorrect. This presentation should not be relied upon as a
recommendation or forecast by Vedanta Resources plc and Vedanta
Limited and any of their subsidiaries. Past performance of Vedanta
Resources plc and Vedanta Limited and any of their subsidiaries
cannot be relied upon as a guide to future performance.
This presentation contains 'forward-looking statements' – that is,
statements related to future, not past, events. In this context,
forward-looking statements often address our expected future
business and financial performance, and often contain words such
as 'expects,' 'anticipates,' 'intends,' 'plans,' 'believes,' 'seeks,' or
'will.' Forward–looking statements by their nature address matters
that are, to different degrees, uncertain. For us, uncertainties arise
from the behaviour of financial and metals markets including the
London Metal Exchange, fluctuations in interest and or exchange
rates and metal prices; from future integration of acquired
businesses; and from numerous other matters of national, regional
and global scale, including those of a environmental, climatic,
natural, political, economic, business, competitive or regulatory
nature. These uncertainties may cause our actual future results to
be materially different that those expressed in our forward-looking
statements. We do not undertake to update our forward-looking
statements. We caution you that reliance on any forward-looking
statement involves risk and uncertainties, and that, although we
believe that the assumption on which our forward-looking
statements are based are reasonable, any of those assumptions
could prove to be inaccurate and, as a result, the forward-looking
statement based on those assumptions could be materially
incorrect.
This presentation is not intended, and does not, constitute or form
part of any offer, invitation or the solicitation of an offer to
purchase, otherwise acquire, subscribe for, sell or otherwise dispose
of, any securities in Vedanta Resources plc and Vedanta Limited and
any of their subsidiaries or undertakings or any other invitation or
inducement to engage in investment activities, nor shall this
presentation (or any part of it) nor the fact of its distribution form
the basis of, or be relied on in connection with, any contract or
investment decision.
Sensitivity: Internal (C3)
VEDANTA LIMITED – Q1 FY2022 INVESTOR PRESENTATION 3
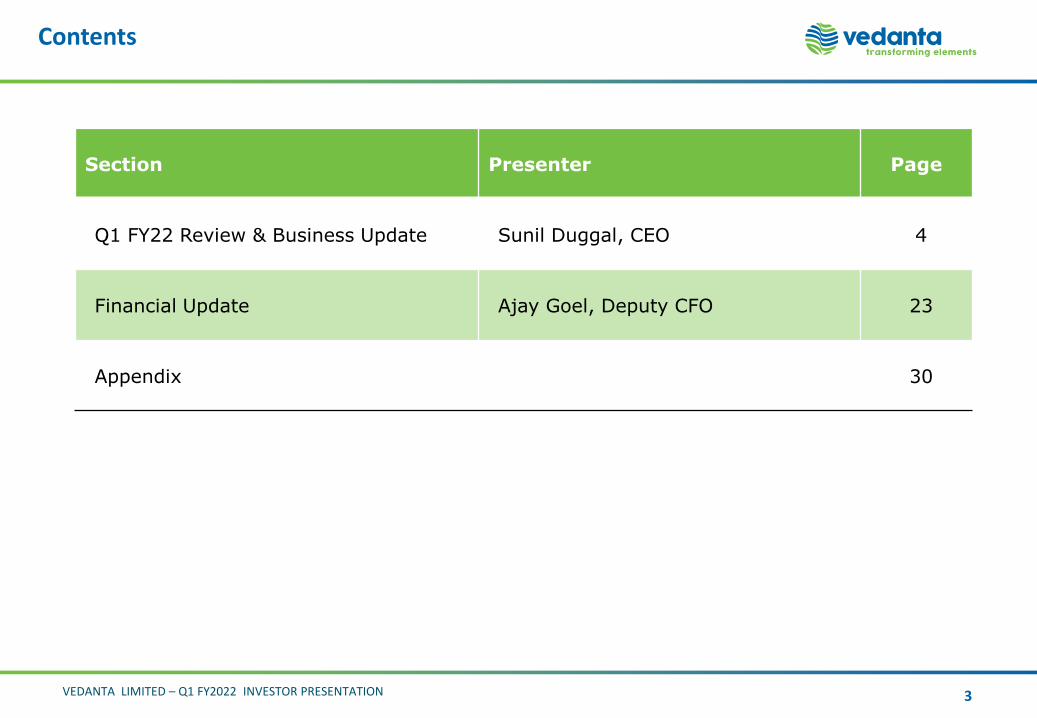
Contents
Section Presenter Page
Q1 FY22 Review & Business Update Sunil Duggal, CEO 4
Financial Update Ajay Goel, Deputy CFO 23
Appendix 30
Sensitivity: Internal (C3)
Q1 FY2022 Review and Business Update
Sunil DuggalGroup CEO & Chief Safety Officer
VEDANTA LIMITEDINVESTOR PRESENTATION
Q1 FY2022
Sensitivity: Internal (C3)
VEDANTA LIMITED – Q1 FY2022 INVESTOR PRESENTATION
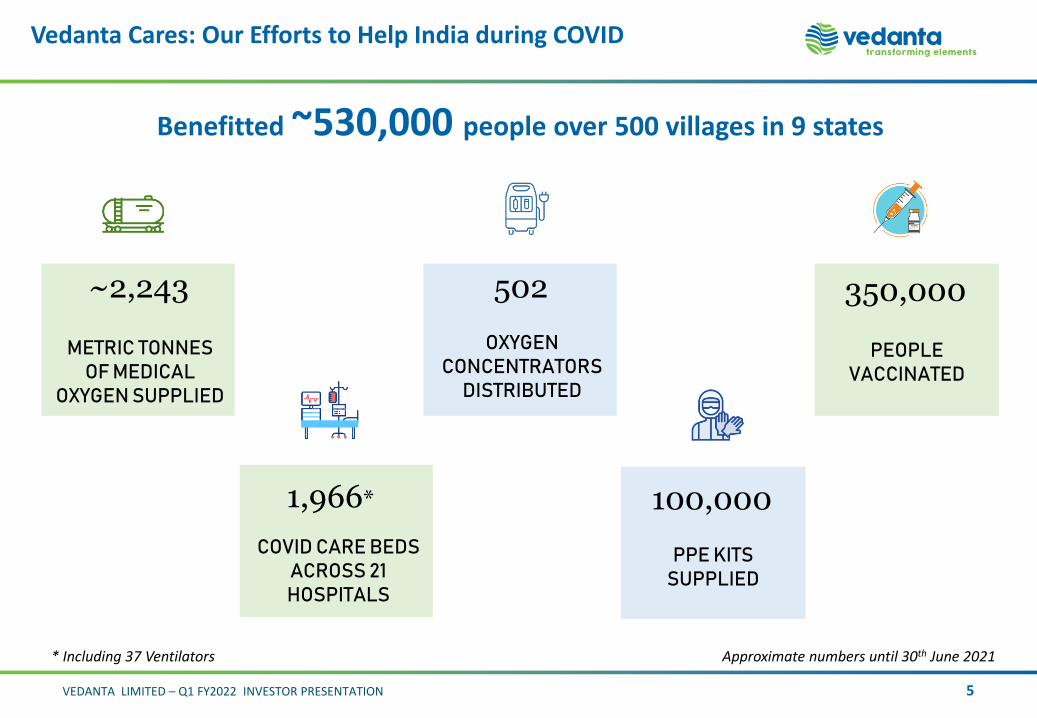
Vedanta Cares: Our Efforts to Help India during COVID
5
Approximate numbers until 30th June 2021
~2,243
METRIC TONNES OF MEDICAL
OXYGEN SUPPLIED
1,966*
350,000
COVID CARE BEDSACROSS 21 HOSPITALS
PEOPLE VACCINATED
502
OXYGEN CONCENTRATORS
DISTRIBUTED
100,000
PPE KITS SUPPLIED
Benefitted ~530,000 people over 500 villages in 9 states
* Including 37 Ventilators

Sensitivity: Internal (C3)
VEDANTA LIMITED – Q1 FY2022 INVESTOR PRESENTATION
Vedanta Cares: Roadmap for ₹ 5,000 crore in Next 5 Years
6
Vedanta has spent more than ₹ 2,000 crore in the last 5 years in CSR
Footprint: Over 75 Lacs people to be benefitted in next 5 years
Launch of Swasth Gaon Abhiyaan
Working with Global Partners
Health Care
20 Lakh people
to be benefitted
▪ Priority towards COVID relief
▪ Super specialty cancer Hospital (VMRF)
Women & Child Development
25 Lakh women
and children to be impacted
▪ Nand Ghar: Flagship project
▪ Women empowerment, early childhood care
Animal Welfare
World Class Veterinary Care
▪ India’s first of its kind animal welfare project
Sports
Benchmarked to World Class
training infrastructure
▪ Promoting grass root level sports for encouraging youth to become globally competitive
CSR across Business Units
32 Lakh beneficiaries from
communities
▪ Education
▪ Skills
▪ Water and Sanitation
▪ Agriculture
Sensitivity: Internal (C3)
VEDANTA LIMITED – Q1 FY2022 INVESTOR PRESENTATION
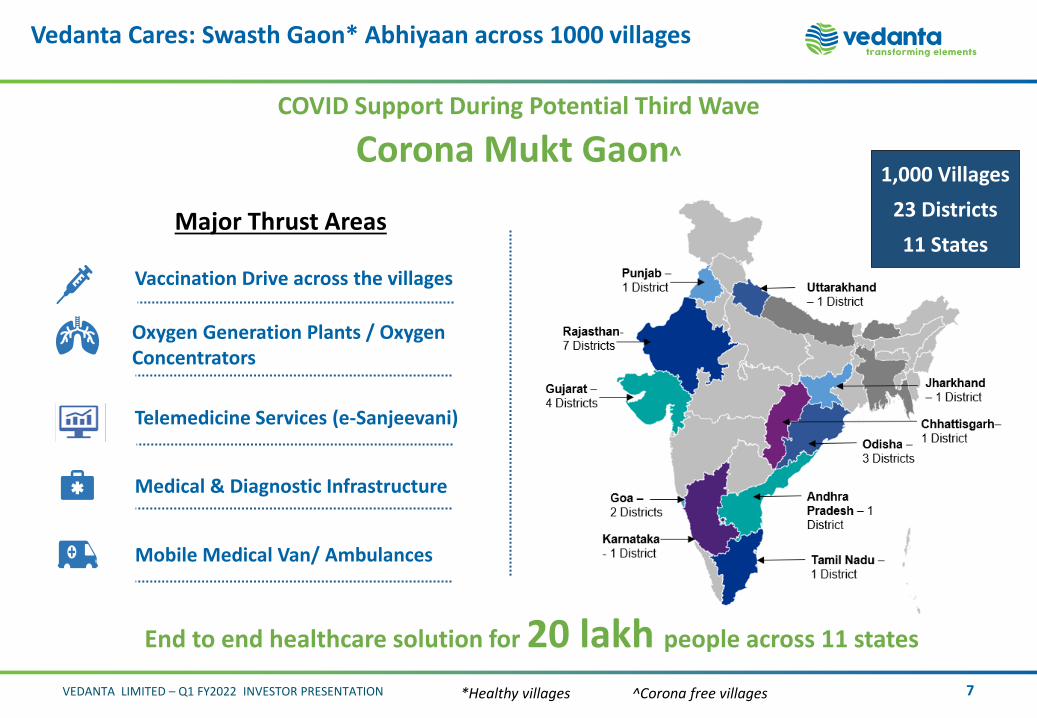
Vedanta Cares: Swasth Gaon* Abhiyaan across 1000 villages
7
End to end healthcare solution for 20 lakh people across 11 states
1,000 Villages
23 Districts
11 StatesMajor Thrust Areas
Vaccination Drive across the villages
Oxygen Generation Plants / Oxygen Concentrators
Telemedicine Services (e-Sanjeevani)
Medical & Diagnostic Infrastructure
Mobile Medical Van/ Ambulances
COVID Support During Potential Third Wave
Corona Mukt Gaon^
*Healthy villages ^Corona free villages

Sensitivity: Internal (C3)
VEDANTA LIMITED – Q1 FY2022 INVESTOR PRESENTATION
Our Preparation For COVID
8
All necessary infrastructure available at site; hospital beds, oxygen and doctor staff. Additionally, we have tie ups with hospitals for emergency
Most of our sites are equipped with; critical care units and advanced life support systems
A series of health webinars & awareness programmes for employees, business partners & community alertness conducted every month
Continued vaccination drives at sites for employees, business partners and their families
Global Standards to Manage Health & Hygiene at Workplace
24*7 health helpline for employees and their family members
Testing of all employees, business partners and families are conducted on regular intervals

Sensitivity: Internal (C3)
VEDANTA LIMITED – Q1 FY2022 INVESTOR PRESENTATION 9
Heading Towards – Zero Harm, Zero Waste, Zero Discharge
1.2 1.21.6 1.5 1.4
FY18 FY19 FY20 FY21 Q1 FY22
14 1518
5
13 1317
4
FY19 FY20 FY21 Q1 FY22
Generation Recycled
243 250 270
7267 71 8321
FY19 FY20 FY21 Q1 FY22Consumed Recycled
79
78
2
FY18 FY19 FY20 FY21 Q1 FY22
Water Consumed & Recycled (mn m3)
TRIFRFatality Waste Recycling (mMT)(High Volume Low Toxicity)
Safety Program Update
Critical risk management
▪ 11 Critical risks identified, with CEO ownership
▪ Implementation of fatality learnings across business lead by CEOs
▪ Increased leadership time on field through VFL and personal safety program
Training
▪ ICAM utilised for fatality investigation by the independent team
▪ Comprehensive HSES module completed by 73% executives, will be launched in Hindi for BPs
Rubaru: Business partner management
▪ Standardization of business partner safety management system
▪ Engagement with consultant to drive effectively at business units
Environment Update
Tailings
▪ Digitalization of tailing dam at HZL completed
▪ Second assurance of tailing dams underway by ATC William
Training▪ Capacity building on environmental risk
management by renowned expert
Certifications and awards
▪ TSPL awarded CII certificate for single use plastic free unit.
▪ HZL was awarded “Most Sustainable Company in mining industry” by World Finance Sustainability Award 2021.
Carbon▪ Risk assessment in progress, while Vedanta
aims to develop a net zero roadmap
Sensitivity: Internal (C3)
VEDANTA LIMITED – Q1 FY2022 INVESTOR PRESENTATION 10
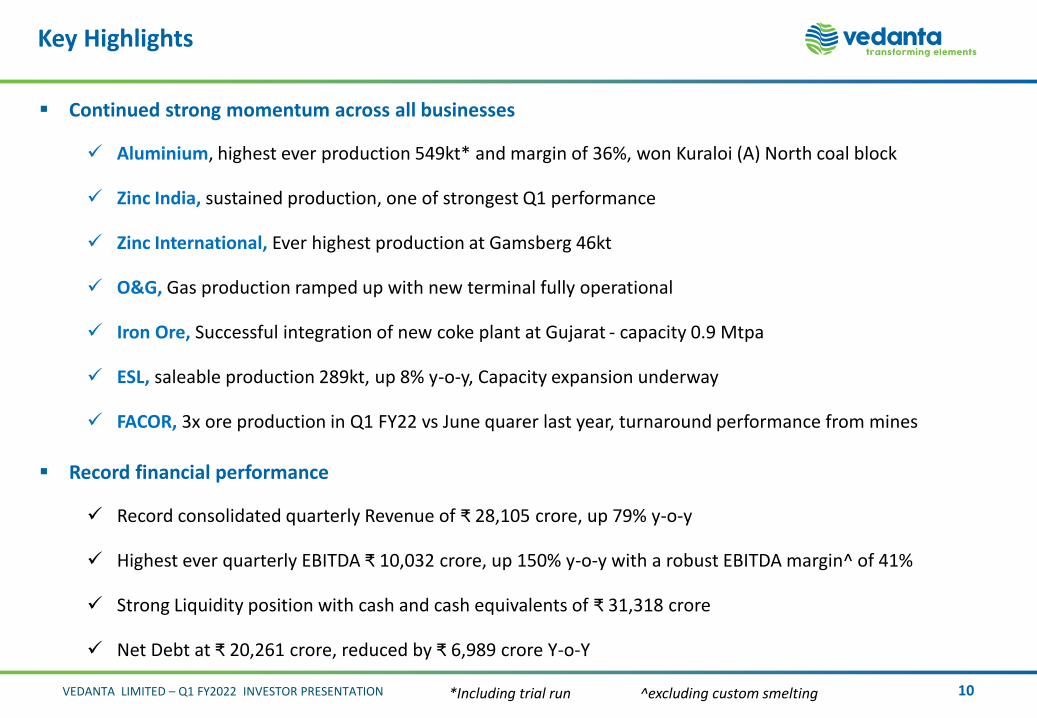
Key Highlights
▪ Continued strong momentum across all businesses
✓ Aluminium, highest ever production 549kt* and margin of 36%, won Kuraloi (A) North coal block
✓ Zinc India, sustained production, one of strongest Q1 performance
✓ Zinc International, Ever highest production at Gamsberg 46kt
✓ O&G, Gas production ramped up with new terminal fully operational
✓ Iron Ore, Successful integration of new coke plant at Gujarat - capacity 0.9 Mtpa
✓ ESL, saleable production 289kt, up 8% y-o-y, Capacity expansion underway
✓ FACOR, 3x ore production in Q1 FY22 vs June quarer last year, turnaround performance from mines
▪ Record financial performance
✓ Record consolidated quarterly Revenue of ₹ 28,105 crore, up 79% y-o-y
✓ Highest ever quarterly EBITDA ₹ 10,032 crore, up 150% y-o-y with a robust EBITDA margin^ of 41%
✓ Strong Liquidity position with cash and cash equivalents of ₹ 31,318 crore
✓ Net Debt at ₹ 20,261 crore, reduced by ₹ 6,989 crore Y-o-Y
*Including trial run ^excluding custom smelting

Sensitivity: Internal (C3)
VEDANTA LIMITED – Q1 FY2022 INVESTOR PRESENTATION 11
Key Highlights
▪ Portfolio
✓ Sweet spot - production ramping up across all businesses
✓ Diversified product portfolio
✓ Best among peers with ferro chrome & Met coke recent additions
▪ Growth
✓ Continue ramp up in Oil & Gas, Zinc India, Zinc International, Steel and Aluminium
✓ Leveraging structural reduction in cost and better capital management
✓ Potential to achieve - 2.3 mtpa @ $1200 COP Aluminum, 300 Kt in Gamsberg, 300 Kboepd in Oil & Gas, 1.2
Mtpa Mined metal production and 1,000 tonnes of Silver in Zinc India and 3.0 Mtpa at ESL Steels
▪ Strategic matters
✓ Aim to resolve all regulatory matters amicably in Oil & Gas, Iron ore Goa and Tuticorin

Sensitivity: Internal (C3)
VEDANTA LIMITED – Q1 FY2022 INVESTOR PRESENTATION 12
Key Focus Areas For Value Delivery
1
45
2
36
7
8
Key focus areas for value delivery
People focus and Performance culture
Centre of Excellence set up (R&D, Asset health, Innovation and Quality)
Brownfield Expansion
ESG▪ Disproportionate focus on sustainable ways of working▪ Upgraded sustainability board committee to ESG board committee
Digital transformation
Business Potential Mapping
1
2
3
4
6
7
Resources & Reserves8
Partnership with government5

Sensitivity: Internal (C3)
VEDANTA LIMITED – Q1 FY2022 INVESTOR PRESENTATION
Aluminium: Success Continues; Growing Value in Dynamic World
Highest Ever Aluminium Production* Alumina Production & COP
13
476 496 482
218246 258
Q1 FY21 Q4 FY21 Q1 FY22
Production (kt) COP ($/T)
*Including trial run
469
531 549
1,268
1,4331,526
Q1 FY21 Q4 FY21 Q1 FY22
Production (kt) COP ($/t)
▪ Further pots ramp up going on in Jharsuguda.
Achieved 2.2 Mtpa run rate, on track of
achieving 2.3 – 2.4 Mtpa run rate
▪ Highest ever EBITDA margin of 36%
▪ Kuraloi (A) North Coal Block: Vedanta declared
as successful bidder for the block in Jharsuguda
district, Odisha
▪ Lanjigarh Expansion: site mobilization on
track
▪ Lanjigarh refinery continues to operate at
over 1.90 Mtpa production run rate
▪ Lanjigarh production marginally down due
to planned calciner shutdown

Sensitivity: Internal (C3)
VEDANTA LIMITED – Q1 FY2022 INVESTOR PRESENTATION 14
1.92.2
2.8
FY21 FY22 e 1-2 years
Cap
acit
y (M
tpa)
▪ Jharsuguda Line 6 ramp-up
▪ 100% JSG Ramp-up
▪ 414+ kt smelter at BALCO
▪ Increase VAP Capacity to 91% at BALCO
▪ Coal Block Operationalization
1.8 2.0
5.0
1
3
5
FY21 FY22 e 1-2 years
Cap
acit
y (M
tpa)
Ste
p t
ow
ard
s V
ert
ical
Inte
grat
ion
▪ Lanjigarh expansion by Q1 FY23(Mobilization on track)
▪ Lanjigarh Debottlenecking (Projects on track)
Aluminium: Well, Poised to be among Global Leaders
Ste
ps
tow
ard
s V
ert
ical
Inte
grat
ion

Sensitivity: Internal (C3)
VEDANTA LIMITED – Q1 FY2022 INVESTOR PRESENTATION
Zinc India: Strong Foundation Driving Growth
15
202256 236
1,019
945
1,070
Q1 FY21 Q4 FY21 Q1 FY22
Metal (kt) COP ($/t)
Metal Production and COP
▪ One of the strongest Q1 performance
▪ Post Integration, the shafts at Rampura Agucha
Mine and Sindesar Khurd Mine are fully
operational
▪ Metal Production in line with mined metal
production
▪ Zinc COP up on account of higher commodity
prices mainly coal, cement and diesel
World class technologies for upgrading R&R to 550 million tonnes
Advanced technology for upgrading R&R
Digital core library for strip core logs displaying elemental values, alteration zones and structural data
High dimensional analysis for Integrated data analytics to predict exploration drilling target
Sensitivity: Internal (C3)
VEDANTA LIMITED – Q1 FY2022 INVESTOR PRESENTATION
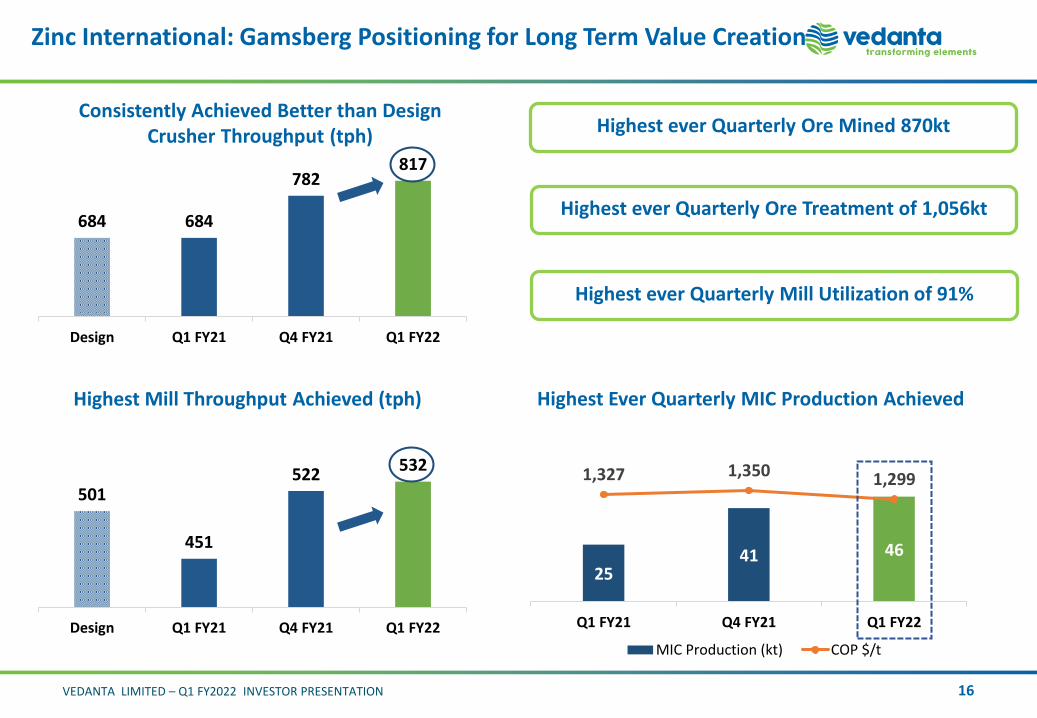
Zinc International: Gamsberg Positioning for Long Term Value Creation
16
Highest Mill Throughput Achieved (tph)
501
451
522532
Design Q1 FY21 Q4 FY21 Q1 FY22
684 684
782817
Design Q1 FY21 Q4 FY21 Q1 FY22
Consistently Achieved Better than Design Crusher Throughput (tph)
2541 46
1,327 1,350 1,299
700
900
1100
1300
1500
0
20
40
60
Q1 FY21 Q4 FY21 Q1 FY22
MIC Production (kt) COP $/t
Highest Ever Quarterly MIC Production Achieved
Highest ever Quarterly Ore Mined 870kt
Highest ever Quarterly Ore Treatment of 1,056kt
Highest ever Quarterly Mill Utilization of 91%
Sensitivity: Internal (C3)
VEDANTA LIMITED – Q1 FY2022 INVESTOR PRESENTATION
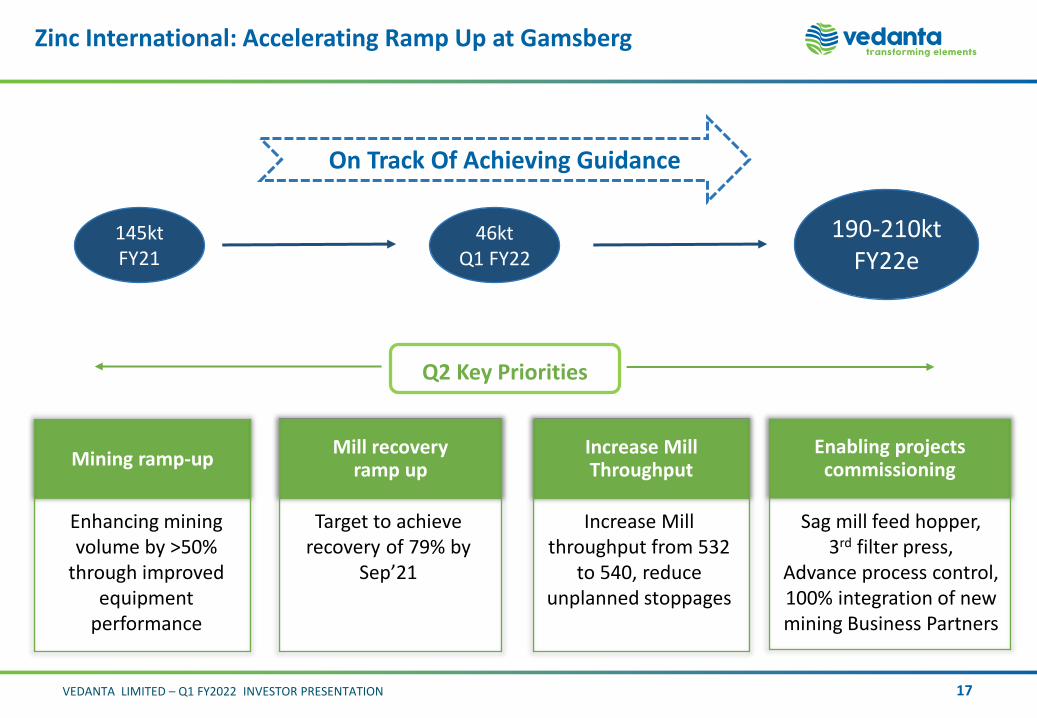
Zinc International: Accelerating Ramp Up at Gamsberg
17
On Track Of Achieving Guidance
145ktFY21
190-210ktFY22e
Mining ramp-up
Enhancing mining volume by >50%
through improved equipment
performance
Mill recovery ramp up
Target to achieve recovery of 79% by
Sep’21
Increase Mill Throughput
Increase Mill throughput from 532
to 540, reduce unplanned stoppages
Enabling projectscommissioning
Sag mill feed hopper, 3rd filter press,
Advance process control, 100% integration of new mining Business Partners
Q2 Key Priorities
46ktQ1 FY22

Sensitivity: Internal (C3)
VEDANTA LIMITED – Q1 FY2022 INVESTOR PRESENTATION
Oil & Gas: Steady Operations, Delivery Of Growth Projects on Track
Operations
▪ Production: 165 kboepd in Q1 FY22 vs 165
kboepd in Q4 FY21. Gas volumes for Rajasthan
were impacted by COVID
▪ Opex: Operating cost at $ 8.4/boe in Q1FY22 vs
$9.0/boe in Q4FY21, decrease primarily due to
higher maintenance activity in Q4FY21
18
Growth Projects
▪ Raageshwari Deep Gas:
▪ New terminal fully operational; production
ramped up to ~32 kboepd
▪ O&M partner on-boarding in Q2FY22 to
manage end-to-end operations; enabling
business to focus on R&R additions
▪ Aishwariya Barmer Hill:
▪ All 39 Wells hooked up
▪ Volumes ramped up to 9 kboepd
▪ MBA Infill & Polymer:
▪ Polymer injection ramped up to design capacity
159 165 165
Q1FY21 Q4 FY21 Q1 FY22
Gross Production (kboepd)

Sensitivity: Internal (C3)
VEDANTA LIMITED – Q1 FY2022 INVESTOR PRESENTATION 19
Infill wells to add near term volume
Exploration wells to add resources
Capex of ~$200 million to monetize 40 mmboe of reserves
▪ Mangala: Drilling commenced
▪ Aishwariya Barmer Hill: Drilling to commence in Q3 FY22
▪ Raageshwari Deep Gas: Drilling to commence in Q2 FY22
▪ Offshore: Drilling to commence in Q3 FY22
Capex of ~$150 million to grow the resource portfolio
▪ OALP Blocks: 15 well drilling program across portfolio
▪ 4 wells drilled till date
▪ Drilling ongoing in Cambay and North-East
▪ PSC Blocks: Work program across Rajasthan and Ravva
▪ Rajasthan (3 wells): First well spud in Q2 FY22
▪ Ravva: Drilling to commence in Q3 FY22
Oil & Gas: Upcoming Growth Projects
New Growth projects with Capex of $350 mn progressing as per plan

Sensitivity: Internal (C3)
VEDANTA LIMITED – Q1 FY2022 INVESTOR PRESENTATION
Iron ore: Resilient Results in Extraordinary Times
20
Capitalised opportunity of increased Global prices through Exports from Goa
Sale
s (M
nt)
Consistent Performance at Karnataka
Sale
s (M
nt)
Performance Update
▪ Highest ever quarterly margin at VAB of $184/t, up
6x y-o-y and 20% q-o-q
▪ Highest ever quarterly Hot Metal production at
VAB of 202 kt on account of productivity
improvement initiatives
0.4
1.4 1.3
Q1 FY21 Q4 FY21 Q1 FY22
0.60.8
0.4
Q1 FY21 Q4 FY21 Q1 FY22
33
153184
Q1 FY21 Q4 FY21 Q1 FY22
VA
B M
argi
n (
$/t
)
Successful integration of recently acquired coke plant at Gujarat (Gujarat NRE Coke Limited), having
capacity of 0.9 Mtpa
With this acquisition Vedanta Iron Ore business will emerge as one of the
LARGEST MERCHANT COKE PLAYER IN THE COUNTRY

Sensitivity: Internal (C3)
VEDANTA LIMITED – Q1 FY2022 INVESTOR PRESENTATION
ESL Steel: Capacity Expansion Underway
21
0.26
Doubling Hot Metal Capacity Activities Are On Track
▪ Orders for BF#3 expansion has been placed
▪ BF#3 debottlenecking is planned in Oct’21
Performance Update
▪ Saleable Production 289kt, up 8% y-o-y however
down 9% q-o-q due to instabilities and hanging
issues at blast furnace
▪ Sales 265kt, down 13% y-o-y and 18% q-o-q due
to challenging domestic conditions in Q1 FY22
amidst the COVID
▪ Margin $115/t, 160% up y-o-y however down
12% q-o-q due to higher raw material prices
44
131115
Q1 FY21 Q4 FY21 Q1 FY22
Margin ($/t)

Sensitivity: Internal (C3)
VEDANTA LIMITED – Q1 FY2022 INVESTOR PRESENTATION
FACOR: Delivering Stronger Growth
22
15 18 18
63
492
424
Q1 FY21 Q4 FY21 Q1 FY22
Fe Crome Production (kt) Margin ($/t)
3856
123
Q1 FY21 Q4 FY21 Q1 FY22
Turnaround Performance from Mines
Highest ever quarterly Ore Production
Conceptual design of 88kt Furnace
Debottnecking completed
Ore
Pro
du
ctio
n (
kt)
Stable Fe Chrome production by optimizing
operations and better process control.
Plant productivity increased by ~11% post
completion of annual maintenance shutdown of 7
days in Apr’21

Sensitivity: Internal (C3)
Finance UpdateAjay GoelDeputy Chief Financial Officer
VEDANTA LIMITEDINVESTOR PRESENTATION
Q1 FY2022

Sensitivity: Internal (C3)
VEDANTA LIMITED – Q1 FY2022 INVESTOR PRESENTATION 24
Financial snapshot
Revenue EBITDA EBITDA Margin 1 Attributable PAT(before exceptional items)
₹ 28,105 cr ₹ 10,032 cr 41% ₹ 4,280cr
Up 79% y-o-y Up 150% y-o-y Industry leading margin Up 314% y-o-y
ROCE 2 Cash and Cash equivalents
ND ND/EBITDA
c.22% ₹ 31,318 cr ₹ 20,261cr 0.6x
Up ~375 bps Q-o-Q Strong liquidity position Lower 26% y-o-y Lowest in last 4 years
1. Excludes custom smelting at Copper India and Zinc-India operations.
2. ROCE is calculated as EBIT net of tax outflow divided by average capital employed.
Sensitivity: Internal (C3)
VEDANTA LIMITED – Q1 FY2022 INVESTOR PRESENTATION
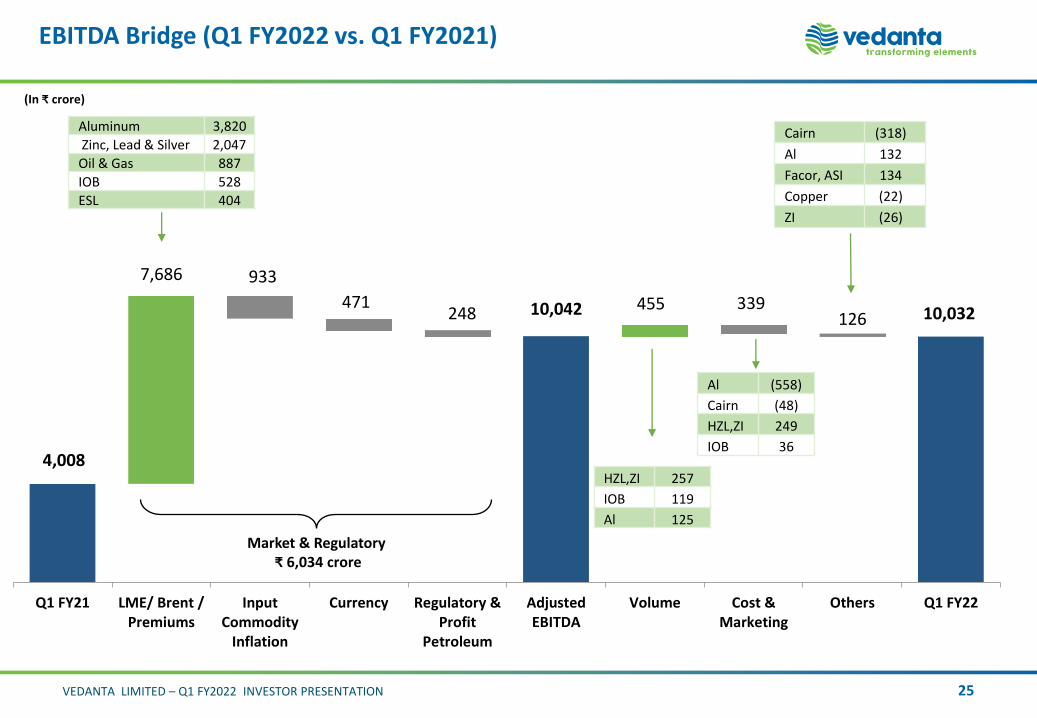
4,008
10,042126 10,032
7,686 933
471248
455 339
Q1 FY21 LME/ Brent /Premiums
InputCommodity
Inflation
Currency Regulatory &Profit
Petroleum
AdjustedEBITDA
Volume Cost &Marketing
Others Q1 FY22
25
EBITDA Bridge (Q1 FY2022 vs. Q1 FY2021)
(In ₹ crore)
Market & Regulatory₹ 6,034 crore
Aluminum 3,820
Zinc, Lead & Silver 2,047
Oil & Gas 887
IOB 528
ESL 404
Cairn (318)
Al 132
Facor, ASI 134
Copper (22)
ZI (26)
HZL,ZI 257
IOB 119
Al 125
Al (558)
Cairn (48)
HZL,ZI 249
IOB 36

Sensitivity: Internal (C3)
VEDANTA LIMITED – Q1 FY2022 INVESTOR PRESENTATION 26
EBITDA Bridge (Q1 FY2022 vs. Q4 FY2021)
1,928 … … 705190 152
Q4 FY 21 LME/ Brent /Premiums
InputCommodity
Inflation
Currency Regulatory &Profit
Petroleum
AdjustedEBITDA
Volume Cost &Marketing
Others Q1 FY 22
10,032
(In ₹ crore)
Market & Regulatory₹ 1,668 crore
Aluminium 1258
Zinc, Lead & Silver 315
Cairn 200
IOB 120
HZL (495)
IOB (154)
ESL (56)
Cairn (31)
Cairn (187)
Al 55
Power 98
ZI 97
Facor, ASI 63
35 10,775427 132
HZL (214)
Al (112)
IOB 40
Cairn 38
9,107

Sensitivity: Internal (C3)
VEDANTA LIMITED – Q1 FY2022 INVESTOR PRESENTATION
24,414
20,261
8,942
4,093
2,082 1,496109
FCF Post Capex ₹ 2,767 Cr
Net Debt for Q1 FY2022
(In ₹ crore)
27
WC Movements(Incl Buyer’s
credit)
CapexCF from Operations
Net Debt 30th Jun’21
Net Debt 1st Apr’21
Inter co. loan Repayment from VRL
Translation & Others*
*Others incl. movement in restricted cash
Inventory, Debtors & Others (2,960)
Creditors/ Customers Advance (1,133)
Sensitivity: Internal (C3)
VEDANTA LIMITED – Q1 FY2022 INVESTOR PRESENTATION
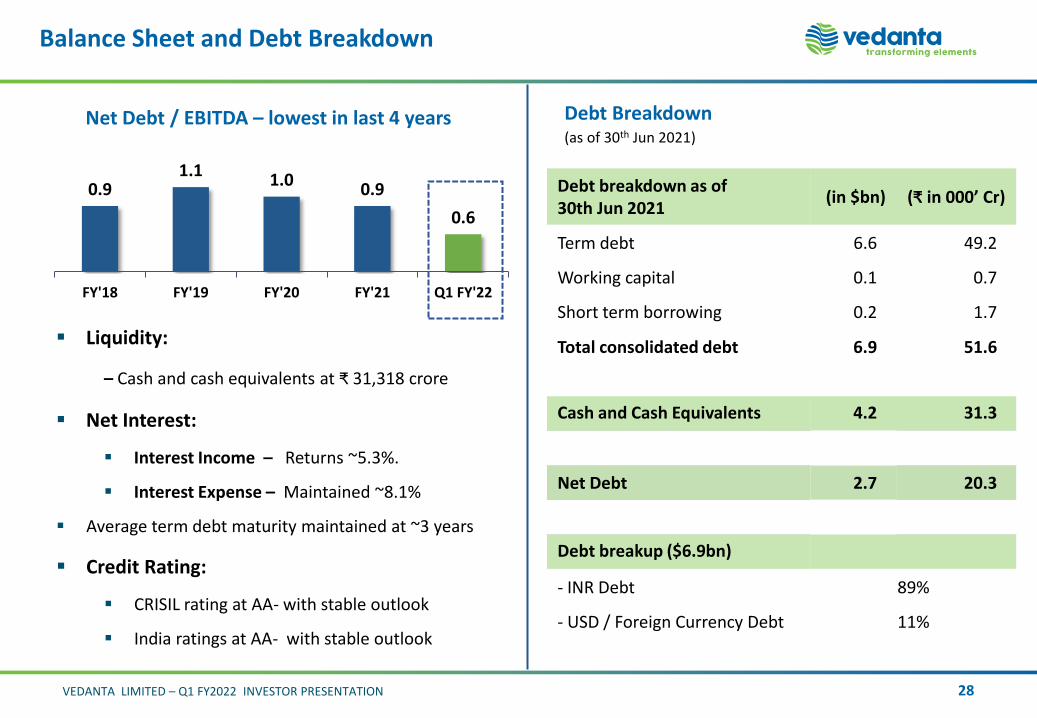
0.91.1
1.00.9
0.6
FY'18 FY'19 FY'20 FY'21 Q1 FY'22
Balance Sheet and Debt Breakdown
28
Net Debt / EBITDA – lowest in last 4 years
▪ Liquidity:
– Cash and cash equivalents at ₹ 31,318 crore
▪ Net Interest:
▪ Interest Income – Returns ~5.3%.
▪ Interest Expense – Maintained ~8.1%
▪ Average term debt maturity maintained at ~3 years
▪ Credit Rating:
▪ CRISIL rating at AA- with stable outlook
▪ India ratings at AA- with stable outlook
Debt breakdown as of 30th Jun 2021
(in $bn) (₹ in 000’ Cr)
Term debt 6.6 49.2
Working capital 0.1 0.7
Short term borrowing 0.2 1.7
Total consolidated debt 6.9 51.6
Cash and Cash Equivalents 4.2 31.3
Net Debt 2.7 20.3
Debt breakup ($6.9bn)
- INR Debt 89%
- USD / Foreign Currency Debt 11%
Debt Breakdown(as of 30th Jun 2021)

Sensitivity: Internal (C3)
VEDANTA LIMITED – Q1 FY2022 INVESTOR PRESENTATION
Strategy to Enhance Long Term Value
Continue Focus on World Class ESG Performance
Augment Our Reserves & Resources Base
Delivering on Growth Opportunities
Optimise Capital Allocation & Maintain Strong Balance Sheet
Operational Excellence and Cost Leadership
29
Sensitivity: Internal (C3)
VEDANTA LIMITEDINVESTOR PRESENTATION
Q1 FY2022
Appendix

Sensitivity: Internal (C3)
VEDANTA LIMITED – Q1 FY2022 INVESTOR PRESENTATION 31
In ₹ Crore Q1
FY’22Q1
FY’21Q4
FY’21
Revenue from operations 28,105 15,687 27,874
Other operating income 307 286 332
EBITDA 10,032 4,008 9,107
Exploration cost write off (97) - -
Depreciation & amortization (2,124) (1,733) (2,055)
Finance Cost (1,182) (1,252) (1,325)
Investment Income 726 1,016 860
Exchange gain/(loss) (50) (6) (71)
Exceptional item Credit/(Expense) (134) - (773)
Tax (Charge)/Credit (1,935) (511) 1699
Tax credit/(charge) on exceptional items 47 - 187
PAT before exceptional items 5.369 1,522 8,216
Profit/(Loss) After Taxes 5,282 1,522 7,629
Attr. profit before exceptional items 4,280 1,033 7,013
Attr. Profit/(Loss) After Taxes 4,224 1,033 6,432
Minorities % (after exceptional items) 20% 32% 16%
Income Statement
Depreciation & Amortization
▪ Higher majorly on account of project capitalization at Oil & Gas and higher ore production at Zinc business.
Finance Cost
▪ Lower finance cost primarily on account of lower average borrowings.
Investment Income
▪ Lower Q-o-Q due to one time investment income in Q4 FY21.
▪ Lower Y-o-Y majorly on account of Mark to Market movement and change in investment mix.
Taxes
▪ The normalized ETR is 26% (excl. tax on exceptional items) compared to 28% (excl. tax on exceptional and one-off items) in Q4 FY21, primarily on account of change in profit mix.
Note: Previous period figures have been regrouped or re-arranged wherever necessary to conform to the current period’s presentation
Sensitivity: Internal (C3)
VEDANTA LIMITED – Q1 FY2022 INVESTOR PRESENTATION 32
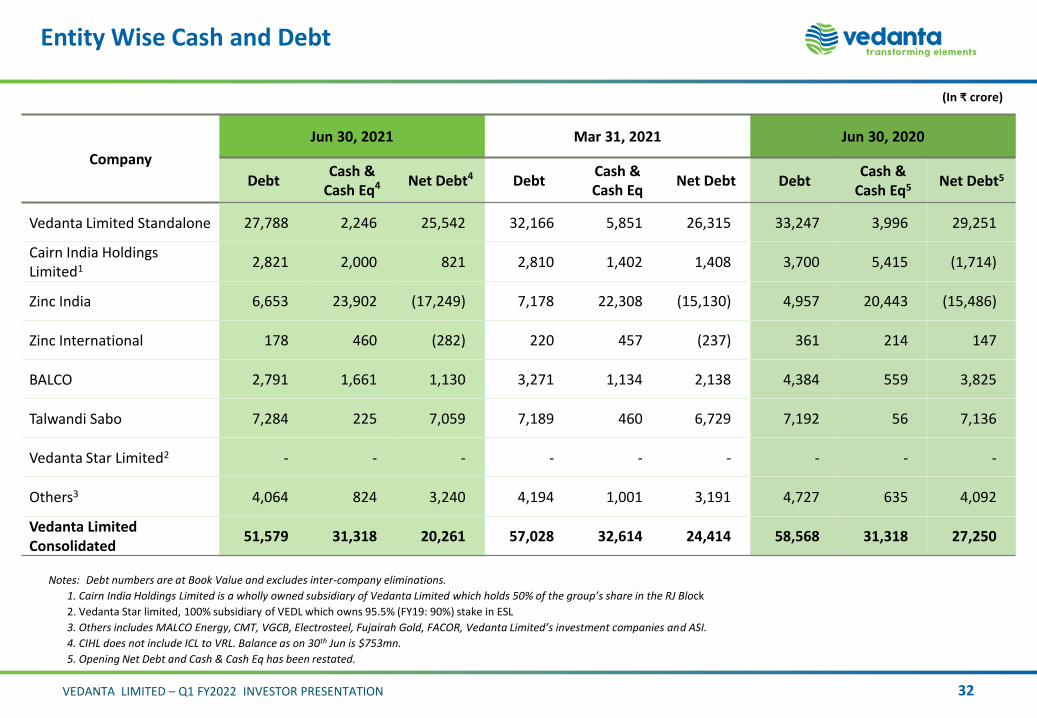
Entity Wise Cash and Debt
Notes: Debt numbers are at Book Value and excludes inter-company eliminations.
1. Cairn India Holdings Limited is a wholly owned subsidiary of Vedanta Limited which holds 50% of the group’s share in the RJ Block
2. Vedanta Star limited, 100% subsidiary of VEDL which owns 95.5% (FY19: 90%) stake in ESL
3. Others includes MALCO Energy, CMT, VGCB, Electrosteel, Fujairah Gold, FACOR, Vedanta Limited’s investment companies and ASI.
4. CIHL does not include ICL to VRL. Balance as on 30th Jun is $753mn.
5. Opening Net Debt and Cash & Cash Eq has been restated.
(In ₹ crore)
Company
Jun 30, 2021 Mar 31, 2021 Jun 30, 2020
Debt Cash &
Cash Eq4 Net Debt4 Debt Cash & Cash Eq
Net Debt Debt Cash &
Cash Eq5 Net Debt5
Vedanta Limited Standalone 27,788 2,246 25,542 32,166 5,851 26,315 33,247 3,996 29,251
Cairn India Holdings Limited1 2,821 2,000 821 2,810 1,402 1,408 3,700 5,415 (1,714)
Zinc India 6,653 23,902 (17,249) 7,178 22,308 (15,130) 4,957 20,443 (15,486)
Zinc International 178 460 (282) 220 457 (237) 361 214 147
BALCO 2,791 1,661 1,130 3,271 1,134 2,138 4,384 559 3,825
Talwandi Sabo 7,284 225 7,059 7,189 460 6,729 7,192 56 7,136
Vedanta Star Limited2 - - - - - - - - -
Others3 4,064 824 3,240 4,194 1,001 3,191 4,727 635 4,092
Vedanta Limited Consolidated
51,579 31,318 20,261 57,028 32,614 24,414 58,568 31,318 27,250

Sensitivity: Internal (C3)
VEDANTA LIMITED – Q1 FY2022 INVESTOR PRESENTATION 33
Funding Sources and Term Debt Maturities
Diversified Funding Sources for Term Debt of $6.6bn(as of 30th Jun 2021)
Note: USD–INR: ₹ 74.28 on 30th Jun 2021
66%
23%
10%
1%
Term Loans-INR
Bonds-INR
Term Loans-USD/Foreign CurrencyBonds-FC
Term debt of $3.7bn at Standalone and $2.9bn at Subsidiaries, total consolidated $6.6bn
5.2 5.42.3
14.73.3
4.4
5.5
8.3
8.5 9.87.8
23.0
FY22 FY23 FY24 FY25 & Later
Standalone Subsidiaries₹
‘00
0 C
rore
20%
16%
47%
17%
Term Debt Maturities : ₹ 49,164 Cr ($6.6bn) (as at 30th Jun’21)

Sensitivity: Internal (C3)
VEDANTA LIMITED – Q1 FY2022 INVESTOR PRESENTATION 34
Segment Summary – Zinc India
Production (in ’000 tonnes, or as stated)Q1 Q4 Full year
FY 2022 FY 2021 % change YoY FY2021 FY 2021
Mined metal content 221 202 9% 288 972
Integrated metal 236 202 17% 256 930
Refined Zinc – Integrated 188 157 20% 195 715
Refined Lead – Integrated1 48 44 9% 61 214
Refined Saleable Silver - Integrated (in tonnes)2161 117 37% 203 706
Financials (In ₹ crore, except as stated)
Revenue 6,323 3,852 64% 6,699 21,932
EBITDA 3,508 1,544 - 3,846 11,620
Zinc CoP without Royalty (₹ /MT) 79,000 76,900 3% 69,000 70,700
Zinc CoP without Royalty ($/MT) 1,070 1,019 5% 945 954
Zinc CoP with Royalty ($/MT) 1,463 1,288 14% 1,319 1,286
Zinc LME Price ($/MT) 2,916 1,961 49% 2,750 2,422
Lead LME Price ($/MT) 2,128 1,673 27% 2,018 1,868
Silver LBMA Price ($/oz) 26.7 16.4 63% 26.3 22.9
1. Excludes captive consumption of 1,611 MT in Q1 FY 2022 vs 1,202 MT in Q1 FY 2021 & 1,825 MT in Q4 FY 2021. For FY 2021 it was 6,424 MT.2. Excludes captive consumption of 8.9 MT in Q1 FY 2022 vs 6.2 MT in Q1 FY 2021 & 9.1 MT in Q4 FY 2021. For FY 2021 it was 34.6 MT.
Sensitivity: Internal (C3)
VEDANTA LIMITED – Q1 FY2022 INVESTOR PRESENTATION 35
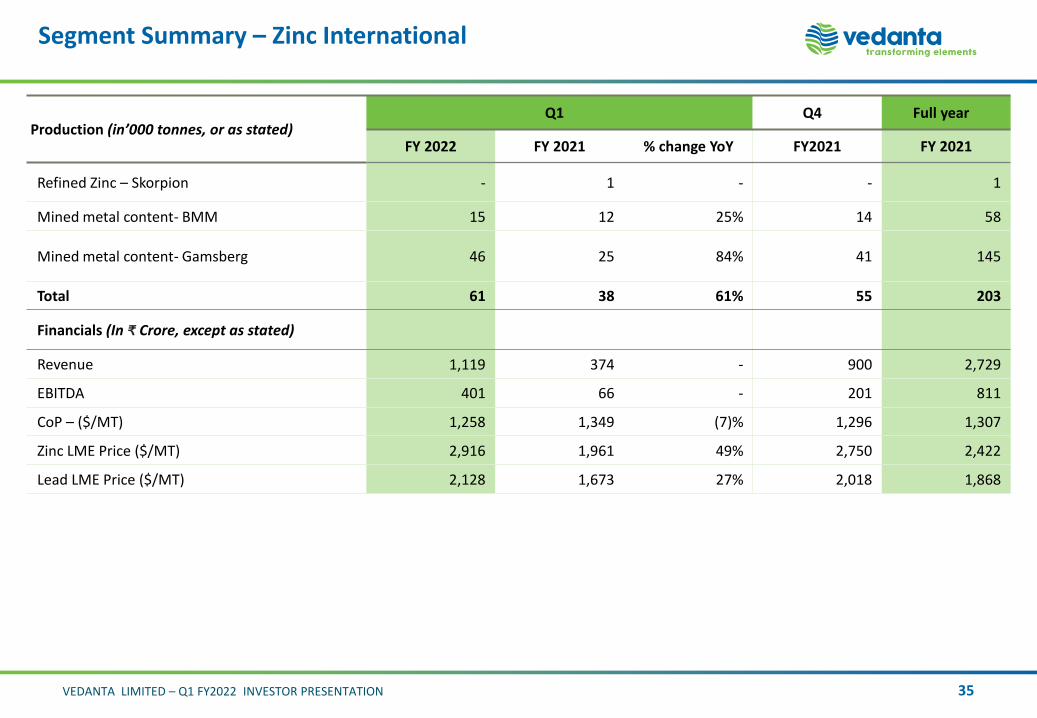
Segment Summary – Zinc International
Production (in’000 tonnes, or as stated)Q1 Q4 Full year
FY 2022 FY 2021 % change YoY FY2021 FY 2021
Refined Zinc – Skorpion - 1 - - 1
Mined metal content- BMM 15 12 25% 14 58
Mined metal content- Gamsberg 46 25 84% 41 145
Total 61 38 61% 55 203
Financials (In ₹ Crore, except as stated)
Revenue 1,119 374 - 900 2,729
EBITDA 401 66 - 201 811
CoP – ($/MT) 1,258 1,349 (7)% 1,296 1,307
Zinc LME Price ($/MT) 2,916 1,961 49% 2,750 2,422
Lead LME Price ($/MT) 2,128 1,673 27% 2,018 1,868

Sensitivity: Internal (C3)
VEDANTA LIMITED – Q1 FY2022 INVESTOR PRESENTATION 36
Segment Summary – Oil & Gas
OIL AND GAS (boepd) Q1 Q4 Full year
FY 2022 FY 2021 % change YoY FY2021 FY 2021
Average Daily Gross Operated Production (boepd)
164,899 158,779 4% 165,000 162,104
Rajasthan 139,798 127,937 9% 138,057 132,599
Ravva 14,662 22,037 (33)% 16,258 19,177
Cambay 10,440 8,805 19% 10,685 10,329
Average Daily Working Interest Production (boepd)
105,863 98,528 7% 105,123 101,706
Rajasthan 97,858 89,556 9% 96,640 92,819
Ravva 3,299 4,958 (33)% 3,658 4,315
Cambay 4,176 3,522 19% 4,274 4,131
KG-ONN 2003/1 530 492 8% 552 441
Total Oil and Gas (million boe)
Oil & Gas- Gross operated 15.0 14.4 4% 14.8 59.2
Oil & Gas-Working Interest 9.6 9.0 7% 9.5 37.1
Financials (In ₹ crore, except as stated)
Revenue 2,485 1,389 79% 2,584 7,531
EBITDA 1064 491 - 1,069 3,206
Average Oil Price Realization ($ / bbl) 66.9 29.6 - 59.4 43.8
Brent Price ($/bbl) 68.8 29.2 - 60.9 44.3
Sensitivity: Internal (C3)
VEDANTA LIMITED – Q1 FY2022 INVESTOR PRESENTATION
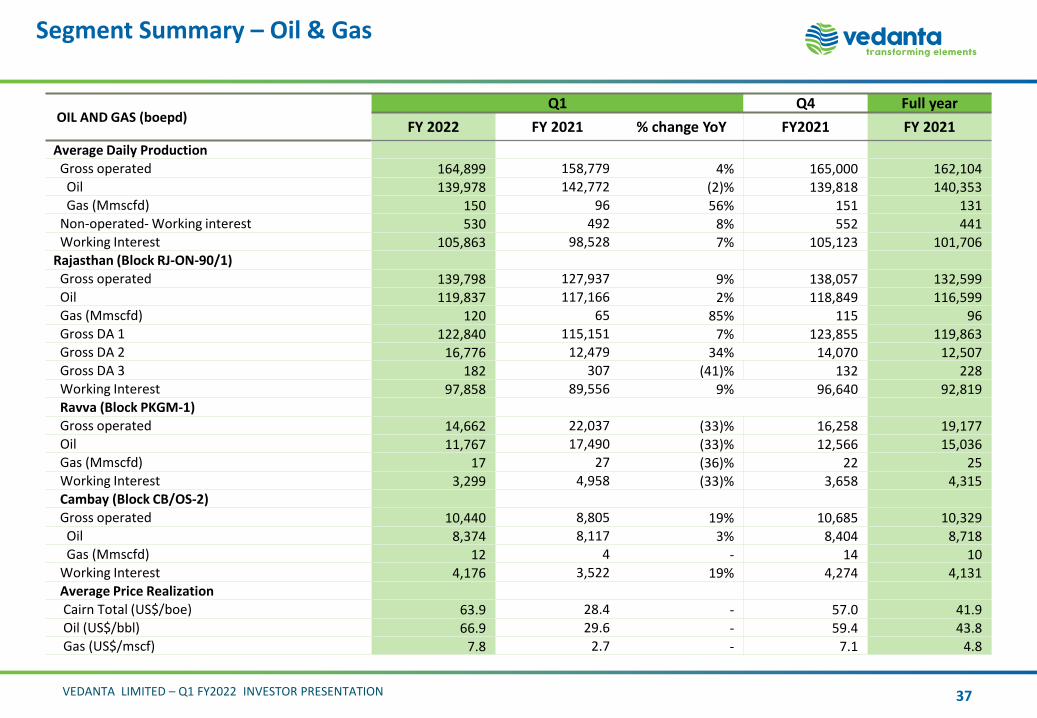
Segment Summary – Oil & Gas
OIL AND GAS (boepd) Q1 Q4 Full year
FY 2022 FY 2021 % change YoY FY2021 FY 2021
Average Daily Production
Gross operated 164,899 158,779 4% 165,000 162,104Oil 139,978 142,772 (2)% 139,818 140,353Gas (Mmscfd) 150 96 56% 151 131
Non-operated- Working interest 530 492 8% 552 441Working Interest 105,863 98,528 7% 105,123 101,706
Rajasthan (Block RJ-ON-90/1)Gross operated 139,798 127,937 9% 138,057 132,599Oil 119,837 117,166 2% 118,849 116,599Gas (Mmscfd) 120 65 85% 115 96Gross DA 1 122,840 115,151 7% 123,855 119,863Gross DA 2 16,776 12,479 34% 14,070 12,507Gross DA 3 182 307 (41)% 132 228Working Interest 97,858 89,556 9% 96,640 92,819Ravva (Block PKGM-1)
Gross operated 14,662 22,037 (33)% 16,258 19,177Oil 11,767 17,490 (33)% 12,566 15,036Gas (Mmscfd) 17 27 (36)% 22 25Working Interest 3,299 4,958 (33)% 3,658 4,315Cambay (Block CB/OS-2)Gross operated 10,440 8,805 19% 10,685 10,329Oil 8,374 8,117 3% 8,404 8,718Gas (Mmscfd) 12 4 - 14 10
Working Interest 4,176 3,522 19% 4,274 4,131Average Price Realization
Cairn Total (US$/boe) 63.9 28.4 - 57.0 41.9 Oil (US$/bbl) 66.9 29.6 - 59.4 43.8 Gas (US$/mscf) 7.8 2.7 - 7.1 4.8
37

Sensitivity: Internal (C3)
VEDANTA LIMITED – Q1 FY2022 INVESTOR PRESENTATION 38
Segment Summary – Aluminium
Particulars (in’000 tonnes, or as stated) Q1 Q4 Full year
FY 2022 FY 2021 % change YoY FY2021 FY 2021
Alumina – Lanjigarh 482 476 1% 496 1,841
Total Aluminum Production* 549 469 17% 531 1,969
Jharsuguda-I 137 132 3% 137 533
Jharsuguda-II* 267 199 34% 250 867
245kt Korba-I 66 65 2% 66 265
325kt Korba-II 78 72 8% 78 304
Financials (In ₹ crore, except as stated)
Revenue 10,263 6,043 70% 8,828 28,644
EBITDA – BALCO 972 486 - 802 2,286
EBITDA – Vedanta Aluminium 2,753 819 - 1,938 5,465
EBITDA Aluminum Segment 3,725 1,305 - 2,739 7,751
Alumina CoP – Lanjigarh ($/MT) 258 218 18% 246 235
Alumina CoP – Lanjigarh (₹ /MT) 19,000 16,500 15% 18,000 17,400
Aluminium CoP – ($/MT) 1,526 1,268 20% 1,433 1,347
Aluminium CoP – (₹ /MT) 112,600 95,700 18% 1,04,500 99,800
Aluminum CoP – Jharsuguda ($/MT) 1,486 1,234 20% 1,387 1,304
Aluminium CoP – Jharsuguda(₹ /MT) 109,600 93,100 18% 1,01,200 96,600
Aluminum CoP – BALCO ($/MT) 1,640 1,348 22% 1,554 1,450
Aluminium CoP – BALCO (₹ /MT) 120,900 1,01,800 19% 1,13,300 1,07,500
Aluminum LME Price ($/MT) 2,400 1,497 60% 2,096 1,805
* Including trial run production of 2.1 kt in Q1 FY2022 and nil kt in Q1 FY2020.For Q4 FY2021, it was 11.2 kt and 27.2 kt in FY2020.
Sensitivity: Internal (C3)
VEDANTA LIMITED – Q1 FY2022 INVESTOR PRESENTATION
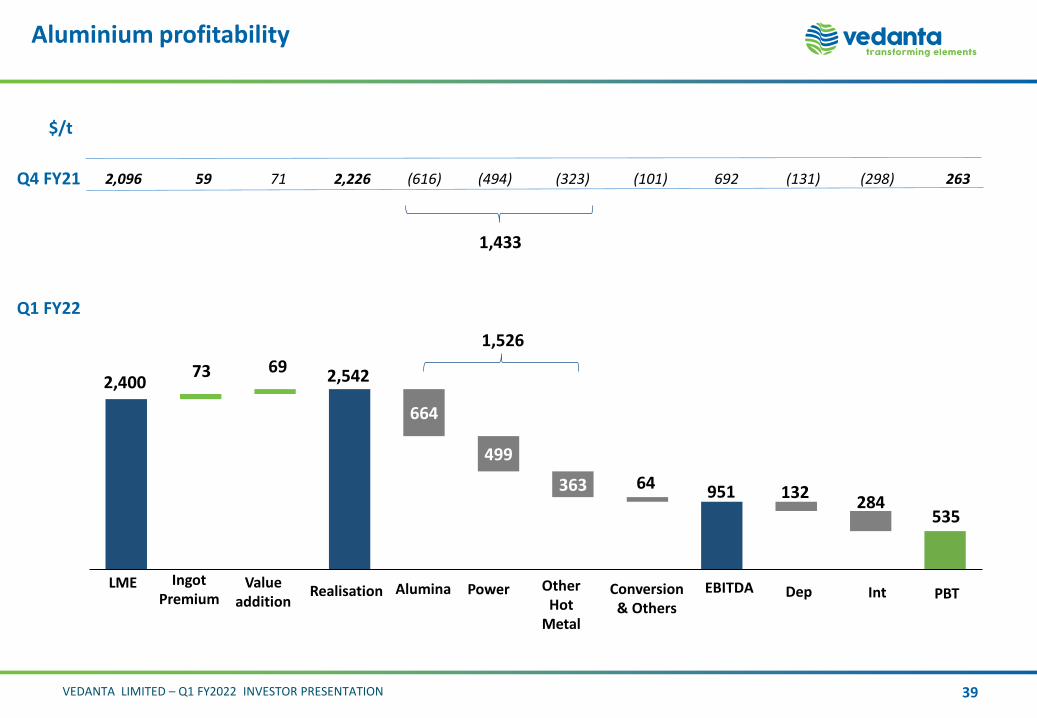
Aluminium profitability
Q4 FY21
$/t
Q1 FY22
2,400 2,542
132
664
499
363 64
EBITDA
245
LME
69
Dep Int PBT
73
284951
535
2,096 59 71 2,226 (616) (494) (323) (101) 692 (131) (298) 263
AluminaRealisationValue
addition
Ingot Premium
Power Other Hot
Metal
Conversion & Others
1,433
1,526
39
Sensitivity: Internal (C3)
VEDANTA LIMITED – Q1 FY2022 INVESTOR PRESENTATION 40
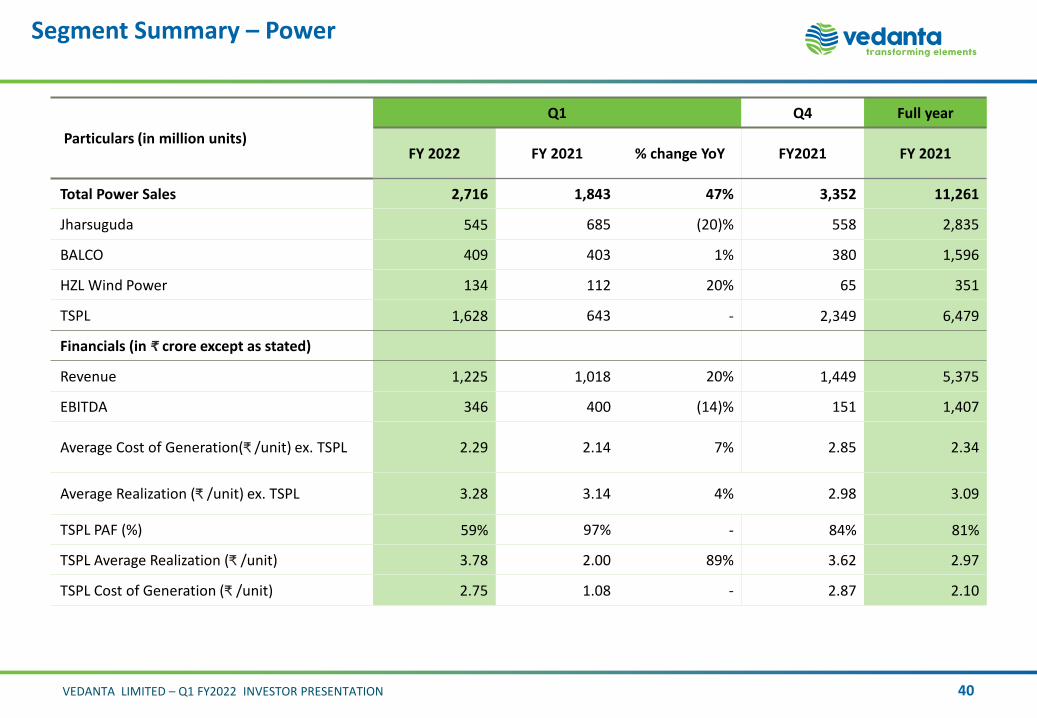
Segment Summary – Power
Particulars (in million units)
Q1 Q4 Full year
FY 2022 FY 2021 % change YoY FY2021 FY 2021
Total Power Sales 2,716 1,843 47% 3,352 11,261
Jharsuguda 545 685 (20)% 558 2,835
BALCO 409 403 1% 380 1,596
HZL Wind Power 134 112 20% 65 351
TSPL 1,628 643 - 2,349 6,479
Financials (in ₹ crore except as stated)
Revenue 1,225 1,018 20% 1,449 5,375
EBITDA 346 400 (14)% 151 1,407
Average Cost of Generation(₹ /unit) ex. TSPL 2.29 2.14 7% 2.85 2.34
Average Realization (₹ /unit) ex. TSPL 3.28 3.14 4% 2.98 3.09
TSPL PAF (%) 59% 97% - 84% 81%
TSPL Average Realization (₹ /unit) 3.78 2.00 89% 3.62 2.97
TSPL Cost of Generation (₹ /unit) 2.75 1.08 - 2.87 2.10
Sensitivity: Internal (C3)
VEDANTA LIMITED – Q1 FY2022 INVESTOR PRESENTATION 41
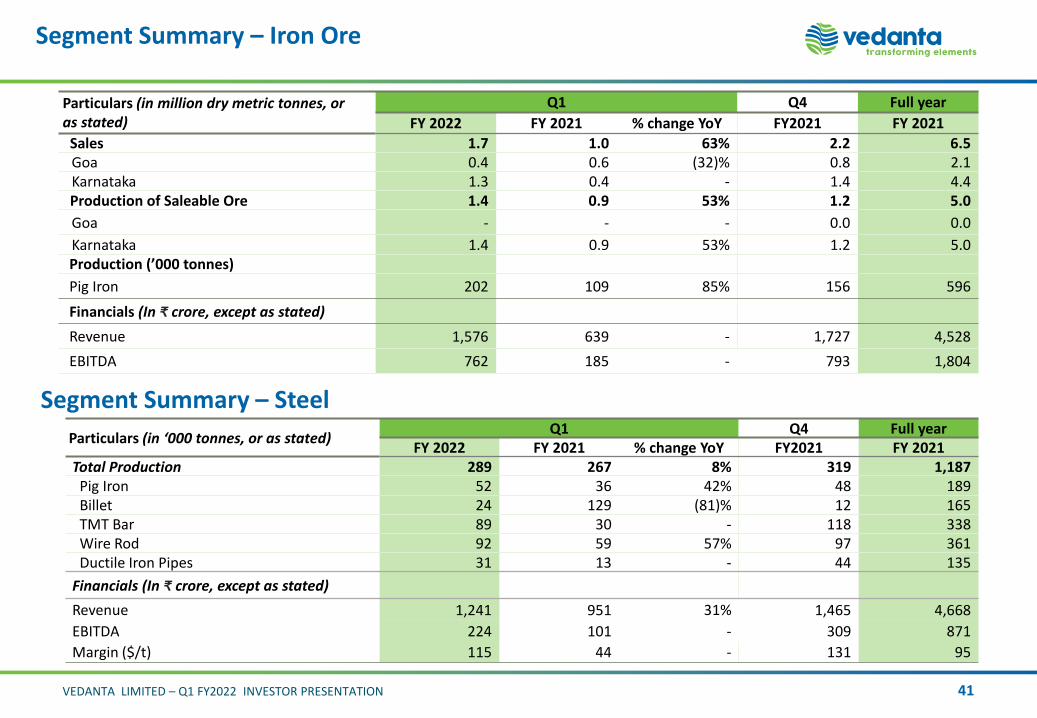
Segment Summary – Iron Ore
Particulars (in million dry metric tonnes, or as stated)
Q1 Q4 Full year
FY 2022 FY 2021 % change YoY FY2021 FY 2021
Sales 1.7 1.0 63% 2.2 6.5Goa 0.4 0.6 (32)% 0.8 2.1Karnataka 1.3 0.4 - 1.4 4.4Production of Saleable Ore 1.4 0.9 53% 1.2 5.0
Goa - - - 0.0 0.0
Karnataka 1.4 0.9 53% 1.2 5.0Production (’000 tonnes)
Pig Iron 202 109 85% 156 596
Financials (In ₹ crore, except as stated)
Revenue 1,576 639 - 1,727 4,528
EBITDA 762 185 - 793 1,804
Segment Summary – Steel
Particulars (in ‘000 tonnes, or as stated)Q1 Q4 Full year
FY 2022 FY 2021 % change YoY FY2021 FY 2021Total Production 289 267 8% 319 1,187
Pig Iron 52 36 42% 48 189Billet 24 129 (81)% 12 165TMT Bar 89 30 - 118 338Wire Rod 92 59 57% 97 361Ductile Iron Pipes 31 13 - 44 135
Financials (In ₹ crore, except as stated)
Revenue 1,241 951 31% 1,465 4,668
EBITDA 224 101 - 309 871
Margin ($/t) 115 44 - 131 95

Sensitivity: Internal (C3)
VEDANTA LIMITED – Q1 FY2022 INVESTOR PRESENTATION 42
Segment Summary – FACOR*
Segment Summary – Copper India
Particulars (in ‘000 tonnes, or as stated)Q1 Q4 Full year
FY 2022 FY 2021 % change YoY FY2021 FY 2021Total Production
Ore Production 123 38 - 56 147Ferrochrome Production 18 15 26% 18 68
Financials (In ₹ crore, except as stated)
Revenue 170 109 56% 151 274
EBITDA 62 8 - 54 69
Margin ($/t) 424 63 - 492 176
Production (in ’000 tonnes, or as stated)Q1 Q4 Full year
FY 2022 FY 2021 % change YoY FY 2021 FY 2021
Copper - Cathodes 28 17 70% 35 101
Financials (In ₹ crore, except as stated)
Revenue 3,499 1,377 - 3,945 10,890
EBITDA (106) (63) (68)% (71) (177)
Copper LME Price ($/MT) 9,700 5,356 81% 8,504 6,897
*Vedanta acquired Ferro Alloys Corporation Limited (“FACOR”) on Sep 21,2020. Previous period numbers are memorandum information for the purpose of performance evaluation of the company.
Sensitivity: Internal (C3)
VEDANTA LIMITED – Q1 FY2022 INVESTOR PRESENTATION 43
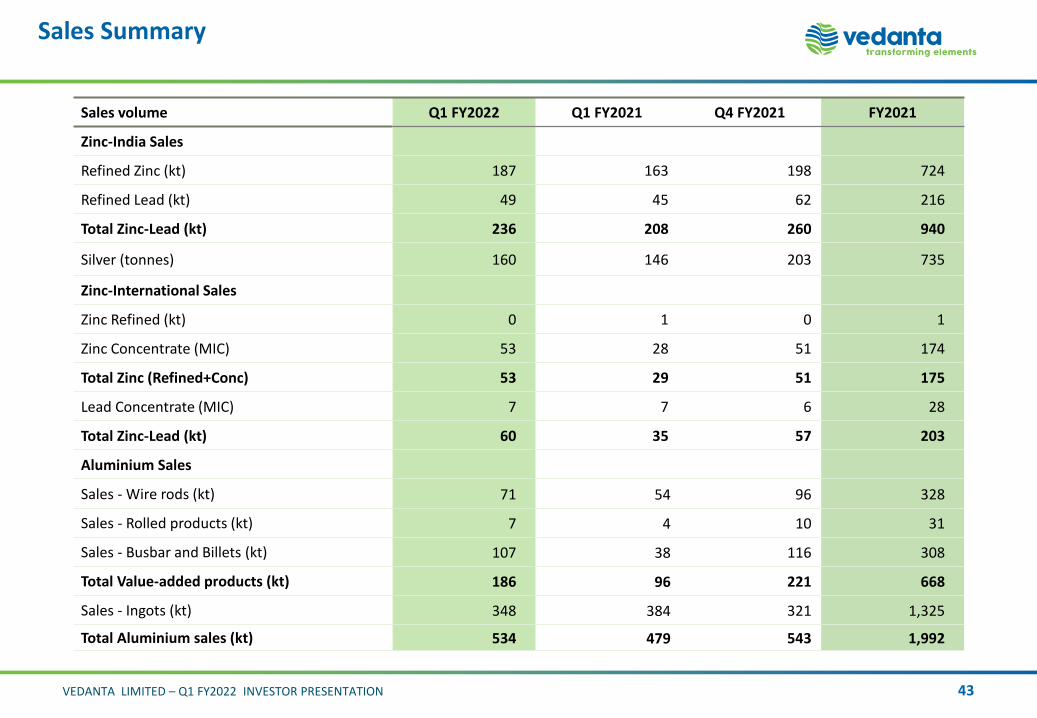
Sales Summary
Sales volume Q1 FY2022 Q1 FY2021 Q4 FY2021 FY2021
Zinc-India Sales
Refined Zinc (kt) 187 163 198 724
Refined Lead (kt) 49 45 62 216
Total Zinc-Lead (kt) 236 208 260 940
Silver (tonnes) 160 146 203 735
Zinc-International Sales
Zinc Refined (kt) 0 1 0 1
Zinc Concentrate (MIC) 53 28 51 174
Total Zinc (Refined+Conc) 53 29 51 175
Lead Concentrate (MIC) 7 7 6 28
Total Zinc-Lead (kt) 60 35 57 203
Aluminium Sales
Sales - Wire rods (kt) 71 54 96 328
Sales - Rolled products (kt) 7 4 10 31
Sales - Busbar and Billets (kt) 107 38 116 308
Total Value-added products (kt) 186 96 221 668
Sales - Ingots (kt) 348 384 321 1,325
Total Aluminium sales (kt) 534 479 543 1,992

Sensitivity: Internal (C3)
VEDANTA LIMITED – Q1 FY2022 INVESTOR PRESENTATION 44
Sales Summary
Sales volume Q1
FY 2022Q1
FY 2021Q4
FY 2021FY 2021
Iron-Ore Sales
Goa (Mn DMT) 0.4 0.6 0.8 2.1
Karnataka (Mn DMT) 1.3 0.4 1.4 4.4
Total (Mn DMT) 1.7 1.0 2.2 6.5
Pig Iron (kt) 196 108 165 609
Copper-India Sales
Copper Cathodes (kt) 4 1.1 3.9 7.8
Copper Rods (kt) 24 17 36 122
Total Steel Sales (kt) 265 305 323 1,231
Pig Iron 50 39 46 192
Billet 16 130 4 158
TMT Bar 83 47 118 356
Wire Rod 85 67 101 375
Ductile Iron Pipes 30 21 54 150
FACOR sales1
Ferrochrome (kt) 20 17 17 71
Sales volume Power Sales (mu)
Q1 FY 2022
Q1 FY 2021
Q4FY 2021
FY 2021
Jharsuguda 545 685 558 2,835
TSPL 1,628 643 2,349 6,479
BALCO 409 403 380 1,596
HZL Wind power 134 112 65 351
Total sales 2,716 1,843 3,352 11,261
Power Realisations (INR/kWh)
Jharsuguda 600 MW 2.67 2.56 2.45 2.54
TSPL2 3.78 2.00 3.62 2.97
Balco 3.82 3.85 3.62 3.85
HZL Wind power 4.08 4.18 3.84 4.01
Average Realisations3 3.28 3.14 2.98 3.09
Power Costs (INR/kWh)
Jharsuguda 600 MW 2.70 2.29 3.14 2.48
TSPL2 2.75 1.08 2.87 2.10
Balco 2.23 2.24 2.61 2.36
HZL Wind power 0.78 0.90 1.76 1.21
Average costs3 2.29 2.14 2.85 2.34
1. Vedanta acquired Ferro Alloys Corporation Limited (“FACOR”) on Sep 21,2020. Previous period numbers are memorandum information for the purpose of performance evaluation of the company.
2. Based on Availability.
3. Average excludes TSPL.

Sensitivity: Internal (C3)
VEDANTA LIMITED – Q1 FY2022 INVESTOR PRESENTATION
Currency and Commodity Sensitivities
Commodity prices – Impact of a 10% increase in Commodity Prices
CommodityQ1 FY 22
Average price
Impact on
EBITDA ($mn)
Oil ($/bbl) 69 16
Zinc ($/t) 2,916 62
Aluminium ($/t) 2,400 111
Lead ($/t) 2,128 10
Silver ($/oz) 27 14
Foreign Currency - Impact of ₹ 1 depreciation in FX Rate
Currency Increase in EBITDA
INR/USD ~ ₹ 850 crore / year
45

Sensitivity: Internal (C3)
VEDANTA LIMITED – Q1 FY2022 INVESTOR PRESENTATION 46
Results Conference Call Details
Results conference call is scheduled at 6:00 PM (IST) on July 26, 2021. The dial-in numbers for the call are given below:
Event Telephone Number
Earnings conference call on July 26, 2021 India – 6:00 PM (IST) Local Dial-in +91 7045671221Toll free:1800 120 1221, 1800 266 1221Universal access: +91 22 7115 8015+91 22 6280 1114
Singapore – 8:30 PM (Singapore Time) Toll free number: 800 101 2045Int’l Toll: +65 31575746
Hong Kong – 8:30 PM (HKT) Toll free number: 800 964 448Int’l Toll: +852 30186877
UK – 1:30 PM (UK Time)* Toll free number: 0 808 101 1573Int’l Toll: +44 2034785524
US – 8:30 AM (Eastern Time)* Toll free number: 1 866 746 2133Int’l Toll: +1 3233868721
Online Registration Link https://services.choruscall.in/DiamondPassRegistration/register?confirmationNumber=4977740&linkSecurityString=11e16eb430
Call Recording Will be available on website 27th July’21 onwards
*Considering Daylight savings