EarlyBridge case from product centric to customer centric eb

Q1 2018EARNINGS Presentation

1
This presentation contains non-GAAP financial measures relating to our performance. You can find the reconciliation of these measures to the most directly comparable GAAP financial measure in the Appendix at the end of this presentation. The non-GAAP financial measures disclosed by Intel should not be considered a substitute for, or superior to, the financial measures prepared in accordance with GAAP. Please refer to “Explanation of Non-GAAP Measures” in Intel's quarterly earnings release for a detailed explanation of the adjustments made to the comparable GAAP measures, the ways management uses the non-GAAP measures and the reasons why management believes the non-GAAP measures provide investors with useful supplemental information.
Statements in this presentation that refer to business outlook, future plans and expectations are forward-looking statements that involve a number of risks and uncertainties. Words such as "anticipates," "expects," "intends," "goals," "plans," "believes," "seeks," "estimates," "continues," "may," "will," “would,” "should," “could,” and variations of such words and similar expressions are intended to identify such forward-looking statements. Statements that refer to or are based on projections, uncertain events or assumptions also identify forward-looking statements. Such statements are based on management's expectations as of April 26, 2018 and involve many risks and uncertainties that could cause actual results to differ materially from those expressed or implied in these forward-looking statements. Important factors that could cause actual results to differ materially from the company's expectations are set forth in Intel's earnings release dated April 26, 2018, which is included as an exhibit to Intel’s Form 8-K furnished to the SEC on such date. Additional information regarding these and other factors that could affect Intel's results is included in Intel's SEC filings, including the company's most recent reports on Forms 10-K and 10-Q. Copies of Intel's Form 10-K, 10-Q and 8-K reports may be obtained by visiting our Investor Relations website at www.intc.com or the SEC's website at www.sec.gov.
All information in this presentation reflects management’s views as of April 26, 2018. Intel does not undertake, and expressly disclaims any duty, to update any statement made in this presentation, whether as a result of new information, new developments or otherwise, except to the extent that disclosure may be required by law.
Disclosures

2
CEO key messages• Transformation accelerating… Data-centric businesses reach all-time high,
approaching 50% of revenue
• Continued strong PC-centric execution funding data-centric investments
• Data-centric investments building momentum… Strength across all segments of DCG… Intel FPGAs winning data center designs… Mobileye demonstrating AD leadership
• Industry leading products on 14nm… Shipping low volume 10nm… Higher volume shifting to 2019
• Our Security-First Pledge… Not just the best performance…Best secure performance
• Record first-quarter… Driving free cash flow and shareholder returns…On track to Intel’s best year ever

3
CFO key messagesGreat start to 2018… Data-centric driving record Q1 Revenue & EPS
• Revenue of $16.1B, up 13% (excl. McAfee) on strength across data-centric businesses
• Data-centric growth, strong Op Margin leverage, and lower tax rate drive non-GAAP EPS to $0.87, up 32%
• Generated $6.3B cash flow from operations… Returned $3.3B to shareholders
• Raising full-year 2018 revenue to $67.5B… Raising EPS to $3.85… FCF up $1.5B to $14.5B

4
Q1'17 Q1'18PC-centric Data-centric
$16.1B$14.8B
1. Q1’17 revenue includes McAfee.2. Data-centric businesses include DCG, IOTG, NSG, PSG and All Other.3. When compared with Mobileye Q1’17 reported revenue.
2
Revenue up 13% excluding McAfee
1
Strong growth… The transformation ContinuesFrom PC-centric to Data-centric
Data-centric (excluding McAfee) up 25%; DCG, IOTG, NSG, PSG and Mobileye all up double digits
PC-centric up 3% on strength in notebook, desktop, and modem
3
Data-centric approaching 50% of Total Revenue… All-Time High

5
$0.66
$0.87
($0.04)
$0.62
$0.13 $0.06
($0.03)
$0.01
$0.10
($0.02)
Q1'17
Non-GAAP
Equity
Adj.
Q1'17
EPS less
Equity Adj.
Platform
Volume
Platform
ASP
Platform
Cost
Adjacent
Biz
Spending Other Q1'18
Non-GAAP
Non-GAAP EPS up ~32%… Op Margin up 3 PPTS EPS Drivers Year-Over-Year
1. EPS and operating margin are presented on a non-GAAP basis. Refer to the Appendix for a reconciliation of these non-GAAP measures.2. Adjustment for prior period realized gains and impairments on marketable equity securities, net of tax. 2018 Non-GAAP results exclude mark to market adjustments.3. Platform includes CCG, DCG and IOTG microprocessors and chipsets.4. Adjacent Business includes gross margin impact from non-platform products.5. Other includes McAfee, Interest and Other, and lower tax rate based on U.S. Tax Reform.
EPS up $0.21 (up $0.25 excl. Equity Adj.)
Platform Execution
• Server: Strength across Cloud and Comms SP segments
• Client: PC up on strong mix and Commercial segment growth
Adjacent Business Growth
• NSG +20%, Modem +8% and PSG +17%
Spending
• Significant leverage, investing in growth
Other
• Lower 2018 tax rate due to Tax Reform
2
4
5
1
30%27%
3
Operatingmargin

6
Total spending as a % of revenue Down from 36.6% to 32.4%
22.4% 20.6%
Q1'17 Q1'18
R&D… down ~2 ppt
14.2%
11.8%
Q1'17 Q1'18
SG&A… down >2 ppt
…Tracking to 30% by 2018, two years ahead of original commitment
• Balancing R&D leverage and efficiency with growing revenue
• Investing in product leadership, AI and Autonomous Driving
• Program co-location and IP efficiency initiatives
• Realizing SG&A leverage and efficiency with growing revenue
• McAfee spin-out drives ~1 ppt reduction
• Intel Inside program changes drive reductions

7
$1.5
$2.6
Q1'17 Q1'18
DATA CENTER group… Growth fueled by the cloud
$3.9$4.8
$0.4
$0.4
Q1'17 Q1'18
Revenue ($B) up 24%
Platform Adjacencies
Q1’17 to Q1’18 YoY Revenue ($)
Platform 24%
Adjacencies 16%
$5.2
$4.2
Op Margin50%
DCG Platform YoY Growth
Unit Volumes 16%
Average Selling Prices 7%
Op Margin35%
Market Segments YoY Revenue ($)
Cloud SP 45%
Comms SP 33%
Enterprise & Gov. 3%
Operating Income ($B) up 75%
Cloud Capex accelerating, hybrid cloud lifting Enterprise, network transformation driving Comms SP share gains
ASP strength from leadership products & revenue scale drive operating margin expansion
Cloud+Comms SP >60% of revenue

8
IOTG, NSG & PSG business Segments… Revenue UP 18%
$425$498
$92 $97
Q1'17 Q1'18
PSG ($M)
Rev Op Income
• IOTG revenue up 17% on Retail & Video
• IOTG Op margin up on revenue scale & autonomous driving (AD) investment shift to Mobileye
• Intel autonomous vehicle test fleet operating in Israel and expanding to other geographies
• PSG revenue up 17% driven by strength in Datacenter, Embedded & last-time-buys
• Data Center business more than doubled YoY; Advanced products (28nm, 20nm,14nm) grew >40%
• Largest design win quarter ever
• NSG revenue up 20%
• 3D NAND cost improving with TLC/64L ramp
• Announced Intel® Optane™ SSD 800P for storage in client systems
$866
$1,040
$(129) $(81)
Q1'17 Q1'18
NSG ($M)
Rev Op Income
$721 $840
$105 $227
Q1'17 Q1'18
IOTG + Mobileye ($M)
Rev Op Income$151
$10
Mobileye
1
1. Mobileye is not part of IOTG segment.

9
$3.0$2.8
Q1'17 Q1'18
Q1’17 to Q1’18 YoY Revenue ($)
Platform 3%
Modem/Adjacencies 4%
Market Segments YoY Revenue ($)
Notebook 4%
Desktop 2%
Operating Income ($B) down 8%
Op Margin 38%
Op Margin 34%
CCG Platform YoY Growth
PC Volumes flat
Notebook ASP 1%
Desktop ASP 7%
1. CCG adjacencies include modem, home gateway products and set-top box components.
Client Computing Group… continued execution
1
$7.4 $7.6
$0.6 $0.6
Q1'17 Q1'18
Revenue ($B) up 3%
Platform Modem/Adjacencies
$8.2$8.0
Client growth driven by strength in Commercial
Operating Margin lower on 10nm transition costs and modem ramp, partially offset by strong mix

10
$14.0
$6.3
($2.9) ($1.4)($1.9)
$1.8 $0.3
2018 Beg Total
Cash Investment
Cash From
Operations
Capex Dividend Buyback Net Debt Other 2018 YTD Total
Cash Investment
$16.2
Sources & Uses of Cash2018 YTD ($B)
$3.4 GAAP Cash and Cash Equivalents $3.6
$14.0 Total Cash Investments $16.2
$26.8 Total Debt $28.6
1
2
1. Total cash investments include cash and cash equivalents, short-term investments and trading assets.2. Total debt includes short-term and long-term debt.
NSG customer prepayments $0.30 dividend
10% increase Y/Y
Strong cash flow from operations… funds Capex & shareholder returns
$1.7B NAND strategic customer supply agreements… fund capital expansion & reduce market risk

Outlook

12
Full Year 2018 Outlook… investments paying off
$67.5BRevenue Operating Margin
$3.85EPS
1. Presented on a non-GAAP basis. Refer to the Appendix for a reconciliation of these non-GAAP measures.
Raising FCF $1.5B to ~$14.5B… on broad business strength
Gross Capex ~$14.5B… Net Capital deployed ~$12.5B… ~$2B customer pre-payments
31%(UP $2.5B VS PRIOR) (UP 1PPT VS PRIOR) (UP $0.30 VS PRIOR)
Gross margin ~flat vs prior
Hitting ~30% spending as % of rev
Data-centric up high teens YoY
PC-centric approximately flat YoY
1 1
Broad based business strength
Tax rate down ~1 ppt vs prior
13
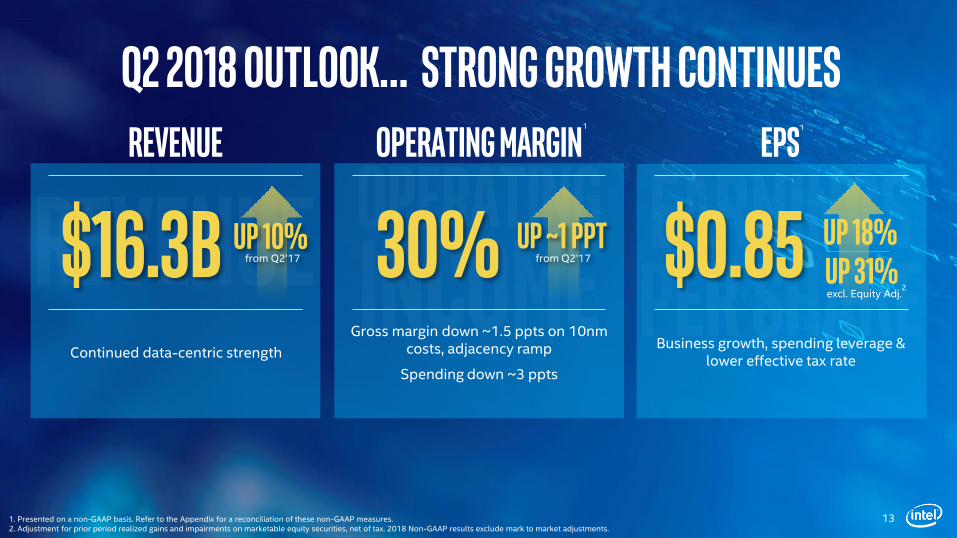
Q2 2018 Outlook… Strong Growth Continues
$16.3BRevenue Operating Margin
$0.85EPS
1. Presented on a non-GAAP basis. Refer to the Appendix for a reconciliation of these non-GAAP measures.2. Adjustment for prior period realized gains and impairments on marketable equity securities, net of tax. 2018 Non-GAAP results exclude mark to market adjustments.
Continued data-centric strength
Gross margin down ~1.5 ppts on 10nm costs, adjacency ramp
Spending down ~3 ppts
Business growth, spending leverage & lower effective tax rate
Up 10% from Q2’17
Up 18% Up 31%excl. Equity Adj.
30% Up ~1 pptfrom Q2’17
2
1 1


Q&A

appendix

Three Months Ended
(In Millions, Except Per Share Amounts) Mar 31, 2018 April 1, 2017
GAAP NET REVENUE $16,066 $14,796
ISecG (McAfee) net revenue — 534
NON-GAAP NET REVENUE EXCLUDING ISecG (McAfee) $16,066 $14,262
GAAP OPERATING INCOME $4,470 $3,632
Amortization of acquisition-related intangibles 325 247
Restructuring and other charges — 80
NON-GAAP OPERATING INCOME $4,795 $3,959
ISecG (McAfee) operating income — 95
NON-GAAP OPERATING INCOME EXCLUDING ISecG (McAfee) $4,795 $3,864
GAAP DILUTED EARNINGS (LOSS) PER COMMON SHARE $0.93 $0.61
Amortization of acquisition-related intangibles 0.07 0.05
Restructuring and other charges — 0.01
Mark to Market on marketable equity securities (0.13) —
Income tax effect — (0.01)
NON-GAAP DILUTED EARNINGS PER COMMON ITEMS $0.87 $0.66
Reconciliation of Non-GAAP Actuals
FREE CASH FLOW Mar 31, 2018
(In Millions)
GAAP CASH FROM OPERATIONS $6,284
Additions to property, plant and equipment (2,910)
FREE CASH FLOW $3,374

Q2 2018 Outlook Full-year 2018 Outlook
GAAP OPERATING MARGIN 28% approximately 29% approximately
Amortization of acquisition-related intangibles 2% 2 %
NON-GAAP OPERATING MARGIN 30% approximately 31% approximately
GAAP TAX RATE 14% approximately 13% approximately
Adjustment for the divestiture of Wind River (1)% —%
NON-GAAP TAX RATE 13% approximately 13% approximately
GAAP EARNINGS PER SHARE $0.85 +/- 5 cents $3.79 +/- 5 %
Amortization of acquisition-related intangibles 0.07 0.27
(Gains) losses from divestiture (0.08) (0.08)
Mark to market on marketable equity securities — (0.13)
Income tax effect 0.01 —
NON-GAAP EARNINGS PER SHARE $0.85 +/- 5 cents $3.85 +/- 5 %
Reconciliation of Non-GAAP Outlook
FREE CASH FLOW Full-year 2018 Outlook
(In Billions)
GAAP CASH FROM OPERATIONS $29.0
Additions to property, plant and equipment (14.5)
FREE CASH FLOW $14.5