
Q1 2017 Supplemental Presentation - NCI Building … Releases/2017/1Q 2017 Supplemental...Q1 2017...
18
Our Mission & Vision Q1 2017 Supplemental Presentation March 7, 2017
Transcript of Q1 2017 Supplemental Presentation - NCI Building … Releases/2017/1Q 2017 Supplemental...Q1 2017...

Our Mission & Vision
Q1 2017 Supplemental Presentation
March 7, 2017

Our Mission & VisionForward-looking Statements
2
Certain statements and information in this presentation may constitute forward-looking statements within the meaning of the PrivateSecurities Litigation Reform Act of 1995. The words “believe,” “anticipate,” “plan,” “intend,” “foresee,” “guidance,” “potential,”“expect,” “should,” “will” “continue,” “could,” “estimate,” “forecast,” “goal,” “may,” “objective,” “predict,” “projection,” or similarexpressions are intended to identify forward-looking statements (including those contained in certain visual depictions) in thispresentation. These forward-looking statements reflect the Company's current expectations and/or beliefs concerning future events.The Company has made every reasonable effort to ensure that the information, estimates, forecasts and assumptions on which thesestatements are based are current, reasonable and complete. Our expectations with respect to the second quarter of fiscal 2017 andthe full year 2017 that are contained in this presentation are forward looking statements based on management’s estimates, as of thedate of this presentation. The estimates are unaudited, and reflect management’s current views with respect to future results.However, the forward-looking statements in this presentation are subject to a number of risks and uncertainties that may cause theCompany's actual performance to differ materially from that projected in such statements. Among the factors that could cause actualresults to differ materially include, but are not limited to, industry cyclicality and seasonality and adverse weather conditions;challenging economic conditions affecting the nonresidential construction industry; volatility in the U.S. economy and abroad,generally, and in the credit markets; substantial indebtedness and our ability to incur substantially more indebtedness; our ability togenerate significant cash flow required to service or refinance our existing debt, including the 8.25% senior notes due 2023, andobtain future financing; our ability to comply with the financial tests and covenants in our existing and future debt obligations;operational limitations or restrictions in connection with our debt; increases in interest rates; recognition of asset impairmentcharges; commodity price increases and/or limited availability of raw materials, including steel; our ability to make strategicacquisitions accretive to earnings; retention and replacement of key personnel; our ability to carry out our restructuring plans and tofully realize the expected cost savings; enforcement and obsolescence of intellectual property rights; fluctuations in customerdemand; costs related to environmental clean-ups and liabilities; competitive activity and pricing pressure; increases in energy prices;volatility of the Company's stock price; dilutive effect on the Company's common stockholders of potential future sales of theCompany's common stock held by our sponsor; substantial governance and other rights held by our sponsor; breaches of ourinformation system security measures and damage to our major information management systems; hazards that may cause personalinjury or property damage, thereby subjecting us to liabilities and possible losses, which may not be covered by insurance; changes inlaws or regulations, including the Dodd–Frank Act; the timing and amount of our stock repurchases; and costs and other effects oflegal and administrative proceedings, settlements, investigations, claims and other matters. See also the “Risk Factors” in theCompany's Annual Report on Form 10-K for the fiscal year ended October 30, 2016, which identifies other important factors, thoughnot necessarily all such factors, that could cause future outcomes to differ materially from those set forth in the forward-lookingstatements. The Company expressly disclaims any obligation to release publicly any updates or revisions to these forward-lookingstatements, whether as a result of new information, future events, or otherwise.

Our Mission & Vision1Q 2017 Financial Overview (Page 1 of 2)
3
Sales were $391.7 million, an increase of $21.7 million or 5.9% from $370.0 million a year ago
• Revenues for the quarter benefited from tonnage volume increases, particularly in the Coatings and Component segments, and commercial pricing discipline in passing through increased input costs
Gross profit margins for the period were 21.4% compared to 24.2% in the comparable prior year period
• 190 basis points impact was from the overall product mix changes, including a significant shift in the IMP product mix to cold storage sales, which is expected to be temporary
• 130 basis points impact from rapidly rising steel input costs, compared to rapidly declining costs in 1Q 2016
• Generally, over the course of a fiscal year, steel input costs are not anticipated to affect margins, but due to timing of price changes can impact individual quarterly year-over-year margin comparisons
Operating income was $9.9 million compared to $15.3 million and Adjusted operating income was $12.5 million compared to $16.7 million in the respective prior year periods
Net income decreased to $2.0 million, or $0.03 per diluted common share compared to $5.9 million, or $0.08 per diluted common share in the prior year period. On an adjusted basis, diluted earnings were $0.05 per share compared to $0.07 in the prior year period
(1) Reconciliations of non-GAAP financial measures to the nearest GAAP measure are included in the Company’s financial tables beginning on Slide 15
Our Mission & Vision
4
1Q 2017 Financial Overview (Page 2 of 2)
Adjusted EBITDA1 was $26.2 million compared to $29.1 million in the prior year period
Consolidated backlog grew 10.3% year-over-year to $527.1 million
In January, Standard & Poor’s raised its corporate credit rating on NCI to “BB” from “BB-”. S&P also raised its ratings on the Company’s term loan to “BBB-” and the unsecured notes to “BB”
(1) Reconciliations of non-GAAP financial measures to the nearest GAAP measure are included in the Company’s financial tables beginning on Slide 15
Our Mission & Vision
5
Manufacturing• In connection with the manufacturing cost rationalization plans, the Company completed the
closure of a large manufacturing facility in the Northwest and the consolidation of a medium sized plant in the Central U.S. into an existing facility
• As planned, an IMP line was down for approximately 7 weeks to install a new laminator and conveyor system. The line was returned to service on time and will provide immediate improvements in terms of automation, turnaround time and quality
Commercial• Backlog in the Buildings segment at the end of the quarter increased 12.7% or $344.3
million, resulting in the highest January backlog since 2008• Intercompany orders for IMP products increased 101.0% on a year-over-year basis through
the Buildings and legacy Components businesses
Steel Costs• During the period, the Company deliberately increased its investment in inventory to support
existing product demand and in advance of higher steel costs which are expected during 2017
1Q 2017 Operational Overview

Our Mission & Vision1Q 2017 Financial Summary
6(1) Reconciliations of non-GAAP financial measures to the nearest GAAP measure are included in the Company’s financial tables beginning on Slide 15
(Dollars in millions, except per share amounts)
January 29, 2017
January 31, 2016 % Chg.
January 29, 2017
January 31, 2016 % Chg.
Sales 391.7$ 370.0$ 5.9% 1,706.6$ 1,610.8$ 5.9%
Gross Profit 84.0$ 89.7$ -6.4% 422.1$ 389.9$ 8.3%
Gross Profit Margin 21.4% 24.2% -11.6% 24.7% 24.2% 2.1%
Income from Operations 9.9$ 15.3$ -35.2% 103.4$ 67.5$ 53.2%
Net Income 2.0$ 5.9$ -65.4% 47.2$ 24.0$ 96.3%
Diluted EPS 0.03$ 0.08$ -62.5% 0.65$ 0.32$ 103.1%
Adjusted Operating Income1 12.5$ 16.7$ -25.2% 109.8$ 87.3$ 25.8%
Adjusted EBITDA1 26.2$ 29.1$ -10.1% 163.1$ 139.5$ 16.9%
Adjusted Diluted EPS1 0.05$ 0.07$ -28.6% 0.70$ 0.46$ 52.2%
Fiscal Three Months Ended Trailing Twelve Months Ended
Our Mission & Vision
7
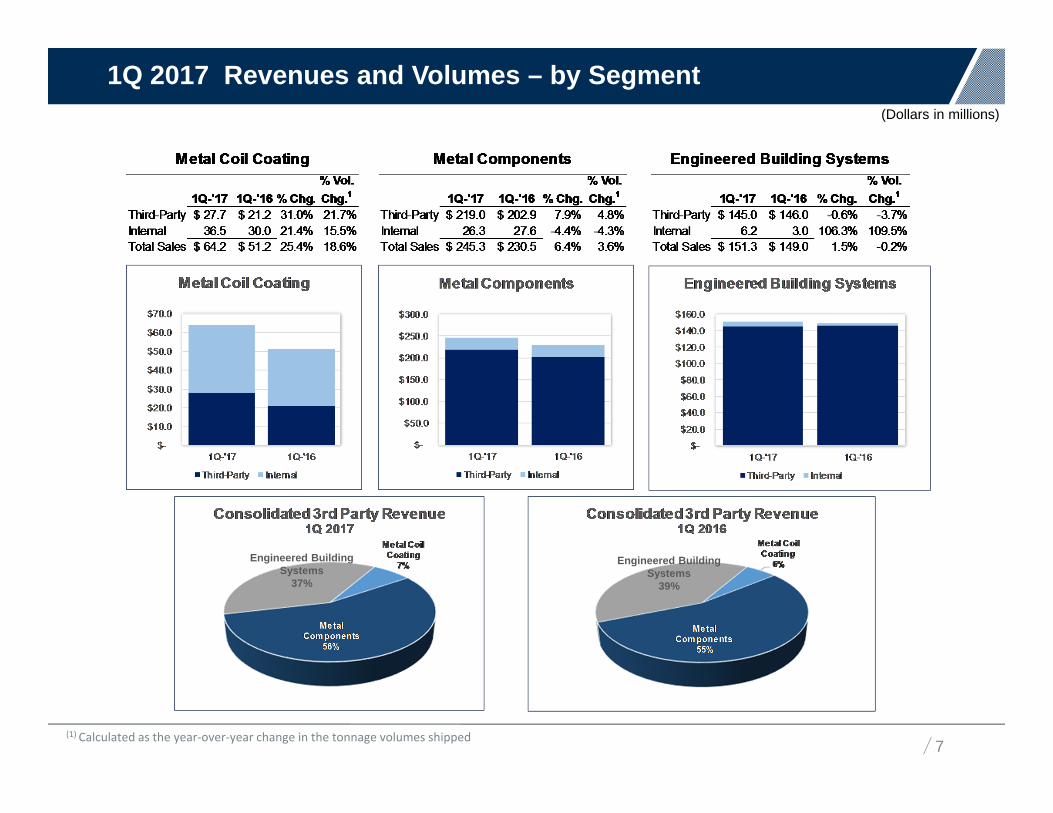
1Q 2017 Revenues and Volumes – by Segment(Dollars in millions)
Engineered Building Systems
37%
Engineered Building Systems
39%
(1) Calculated as the year-over-year change in the tonnage volumes shipped

Our Mission & Vision1Q 2017 Business Segment Results1
8
(Dollars in millions)
$27.7
$219.0
$145.0
$391.7
$21.2
$202.9
$146.0
$370.0
Coatings Components Buildings Consolidated
(1) Consolidated segments results do not include intersegment sales(2) Reconciliation of non-GAAP financial measures to the nearest GAAP measure are included in the Company’s financial tables beginning on Slide 15
Revenue
$5.2
$16.0
$6.5
$9.9
$4.8
$16.1
$12.5
$15.3
Coatings Components Buildings Consolidated
Operating Income
Adjusted Operating Income2
$6.4
$23.0
$10.6
$26.1
$6.0
$23.7
$14.0
$29.1
Coatings Components Buildings Consolidated
2017
2016Adjusted EBITDA2
$5.2
$16.3
$8.4
$12.5
$4.8
$16.8
$12.2
$16.7
Coatings Components Buildings Consolidated
Our Mission & VisionGross Margin Reconciliation
9
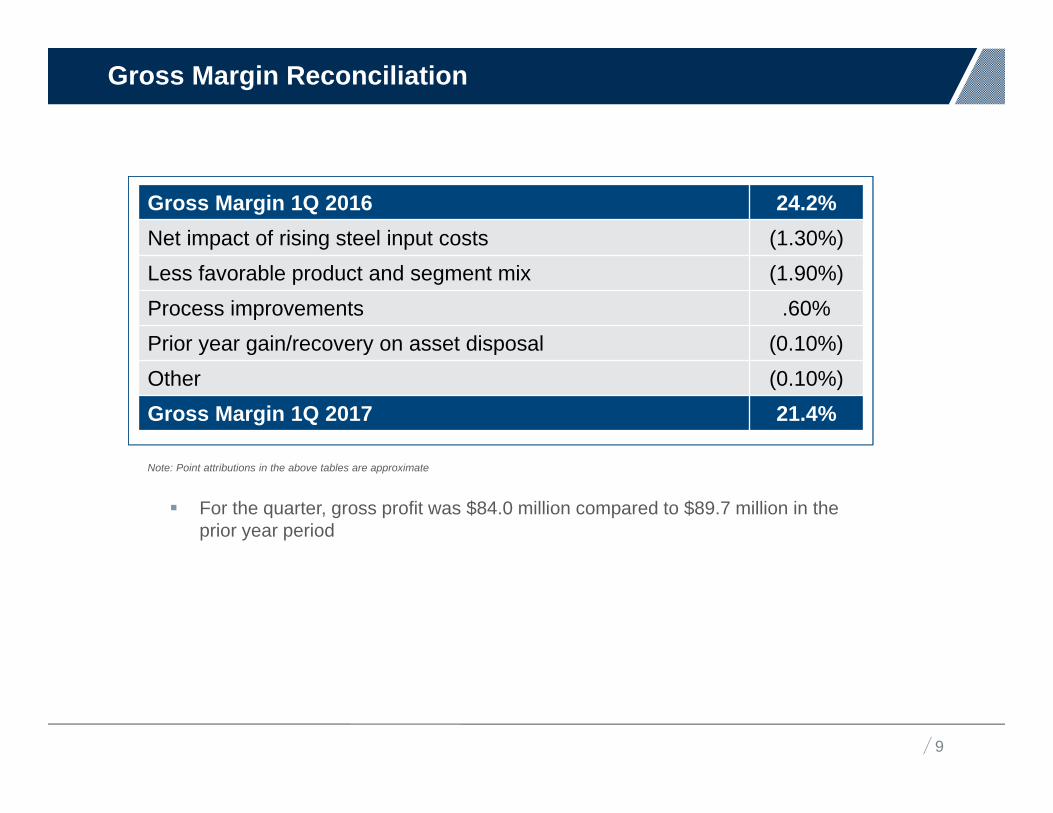
Gross Margin 1Q 2016 24.2%Net impact of rising steel input costs (1.30%) Less favorable product and segment mix (1.90%) Process improvements .60%Prior year gain/recovery on asset disposal (0.10%)Other (0.10%)Gross Margin 1Q 2017 21.4%
For the quarter, gross profit was $84.0 million compared to $89.7 million in the prior year period
Note: Point attributions in the above tables are approximate
Our Mission & VisionKey Cost Initiatives
10
$ in millionsOriginalTarget 1
2016 Cost Savings Realized
Expected2017 Cost Savings
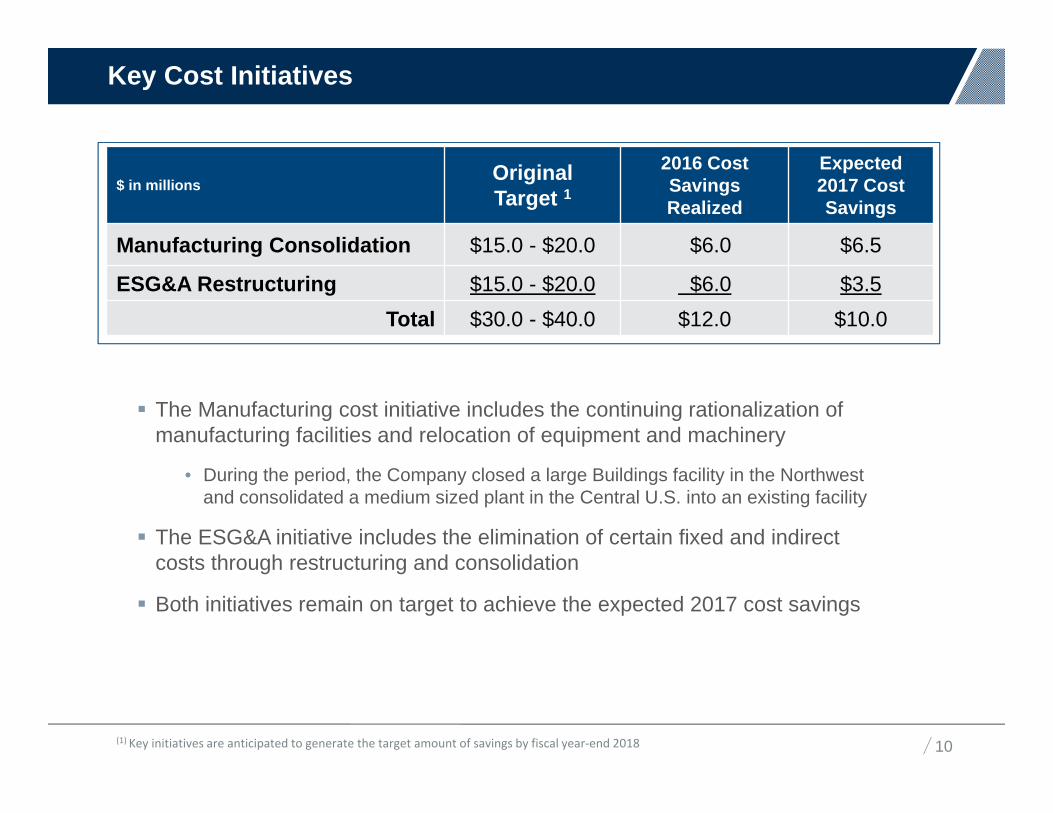
Manufacturing Consolidation $15.0 - $20.0 $6.0 $6.5
ESG&A Restructuring $15.0 - $20.0 $6.0 $3.5Total $30.0 - $40.0 $12.0 $10.0
The Manufacturing cost initiative includes the continuing rationalization of manufacturing facilities and relocation of equipment and machinery
• During the period, the Company closed a large Buildings facility in the Northwest and consolidated a medium sized plant in the Central U.S. into an existing facility
The ESG&A initiative includes the elimination of certain fixed and indirect costs through restructuring and consolidation
Both initiatives remain on target to achieve the expected 2017 cost savings
(1) Key initiatives are anticipated to generate the target amount of savings by fiscal year-end 2018
Our Mission & Vision
11
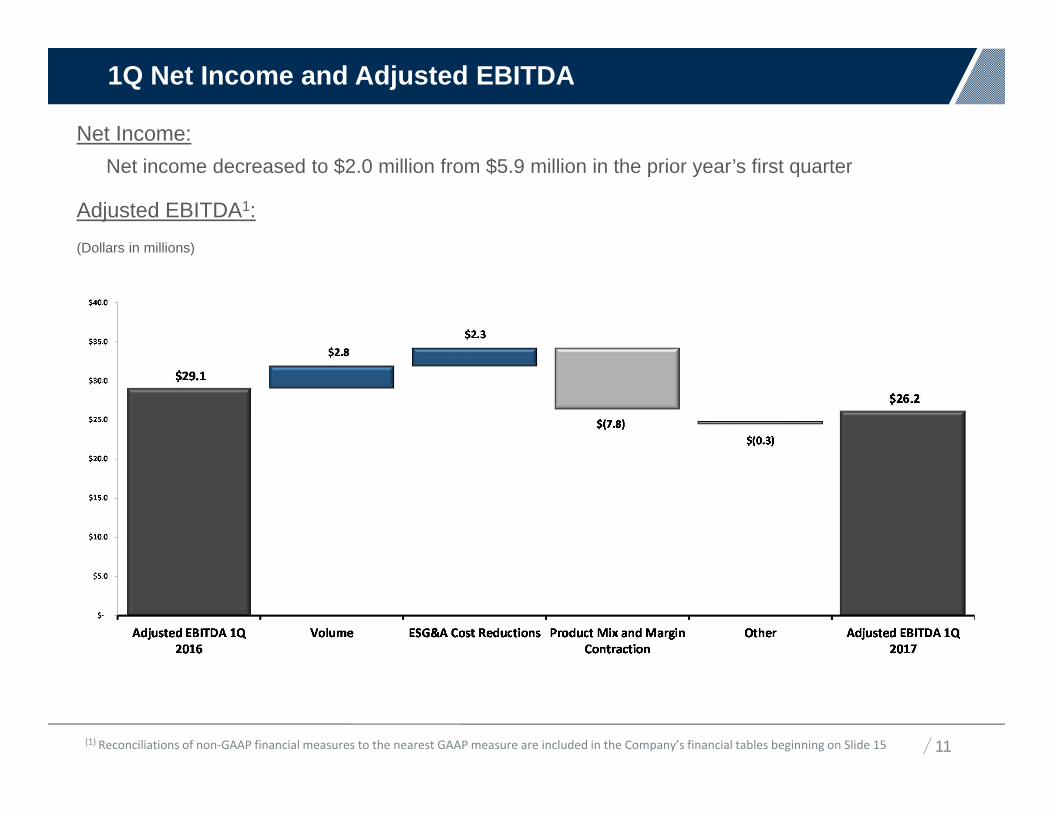
Net Income:Net income decreased to $2.0 million from $5.9 million in the prior year’s first quarter
Adjusted EBITDA1:(Dollars in millions)
1Q Net Income and Adjusted EBITDA
(1) Reconciliations of non-GAAP financial measures to the nearest GAAP measure are included in the Company’s financial tables beginning on Slide 15
Our Mission & Vision1Q 2017 Cash Flow Summary
12
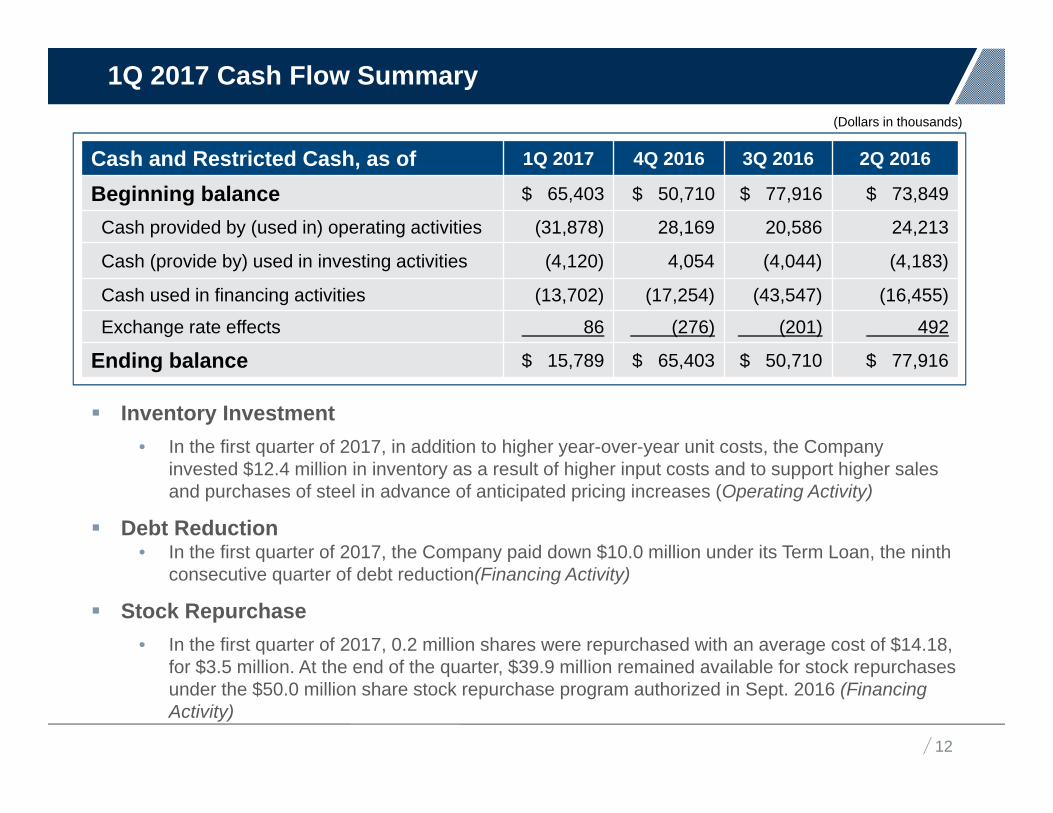
Cash and Restricted Cash, as of 1Q 2017 4Q 2016 3Q 2016 2Q 2016
Beginning balance $ 65,403 $ 50,710 $ 77,916 $ 73,849
Cash provided by (used in) operating activities (31,878) 28,169 20,586 24,213
Cash (provide by) used in investing activities (4,120) 4,054 (4,044) (4,183)
Cash used in financing activities (13,702) (17,254) (43,547) (16,455)
Exchange rate effects 86 (276) (201) 492
Ending balance $ 15,789 $ 65,403 $ 50,710 $ 77,916
Inventory Investment• In the first quarter of 2017, in addition to higher year-over-year unit costs, the Company
invested $12.4 million in inventory as a result of higher input costs and to support higher sales and purchases of steel in advance of anticipated pricing increases (Operating Activity)
Debt Reduction• In the first quarter of 2017, the Company paid down $10.0 million under its Term Loan, the ninth
consecutive quarter of debt reduction(Financing Activity)
Stock Repurchase • In the first quarter of 2017, 0.2 million shares were repurchased with an average cost of $14.18,
for $3.5 million. At the end of the quarter, $39.9 million remained available for stock repurchases under the $50.0 million share stock repurchase program authorized in Sept. 2016 (Financing Activity)
(Dollars in thousands)

Our Mission & Vision1Q 2017 Results Compared to Guidance
13
$ in MillionsRange
Low High 1Q Actuals
Revenues $370.0 $390.0 $391.7
Gross Profit Margin 21.0% 23.5% 21.4%
ESG&A Expenses $71.0 $75.0 $69.0
Intangible Asset Amortization $2.3 $2.5 $2.4
Total Depreciation & Amortization(inclusive of Intangibles above)
$10.0 $11.0 $10.3
Interest Expense $7.4 $7.6 $6.9
Effective Tax Rate 35.0% 37.0% 38.5%
Revenues were higher in lower margin products for both IMP and Coaters, which helped the Company slightly exceed the high end of the revenue guidance, while shifting the gross margins to the lower end of the range
ESG&A expenses were lower than guidance as a result of lower incentive compensation and successes with the ongoing cost reduction initiatives
Interest expense was lower during the quarter as a result of various non-recurring accrual true-ups The higher tax rate was primarily the result of non-deductible foreign currency translation losses
resulting from the strengthening dollar
Our Mission & Vision2Q and FY 2017 Guidance
14
$ in million2Q Range
Low High
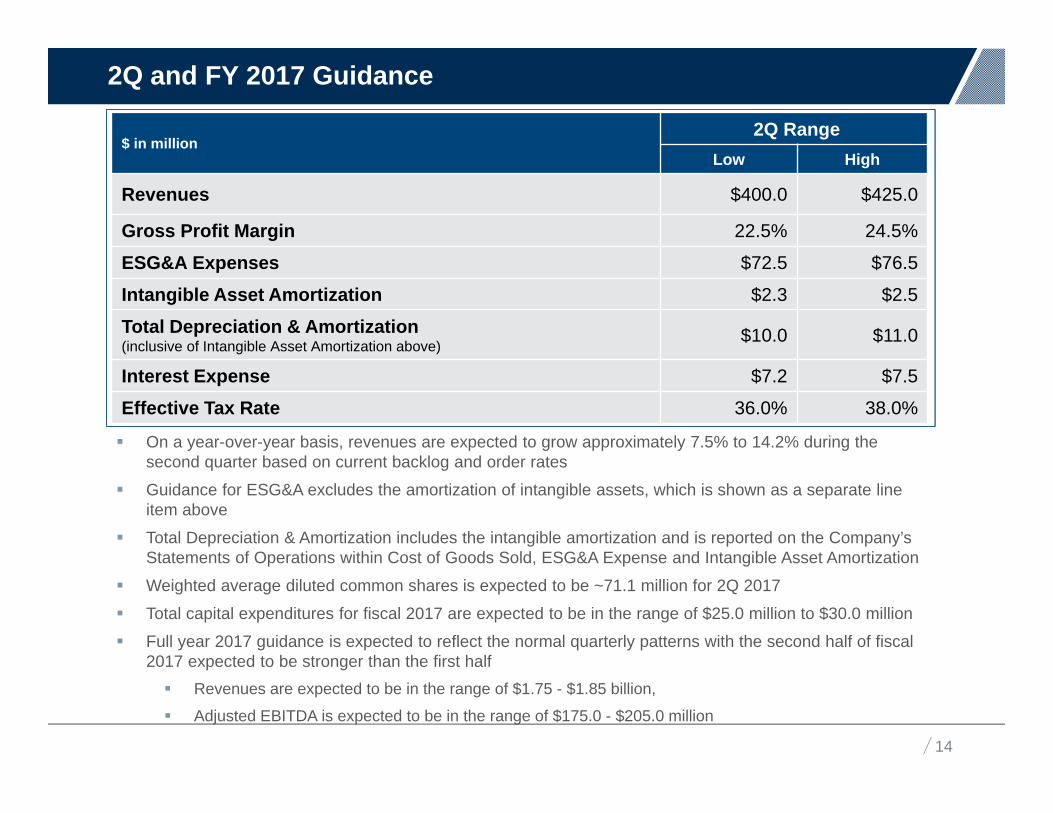
Revenues $400.0 $425.0
Gross Profit Margin 22.5% 24.5%
ESG&A Expenses $72.5 $76.5
Intangible Asset Amortization $2.3 $2.5
Total Depreciation & Amortization(inclusive of Intangible Asset Amortization above) $10.0 $11.0
Interest Expense $7.2 $7.5
Effective Tax Rate 36.0% 38.0%
On a year-over-year basis, revenues are expected to grow approximately 7.5% to 14.2% during the second quarter based on current backlog and order rates
Guidance for ESG&A excludes the amortization of intangible assets, which is shown as a separate line item above
Total Depreciation & Amortization includes the intangible amortization and is reported on the Company’s Statements of Operations within Cost of Goods Sold, ESG&A Expense and Intangible Asset Amortization
Weighted average diluted common shares is expected to be ~71.1 million for 2Q 2017
Total capital expenditures for fiscal 2017 are expected to be in the range of $25.0 million to $30.0 million
Full year 2017 guidance is expected to reflect the normal quarterly patterns with the second half of fiscal 2017 expected to be stronger than the first half Revenues are expected to be in the range of $1.75 - $1.85 billion,
Adjusted EBITDA is expected to be in the range of $175.0 - $205.0 million
Our Mission & Vision
Reconciliation of Net Income (Loss) and Adjusted Net Income (Loss) per Diluted Common Share
15
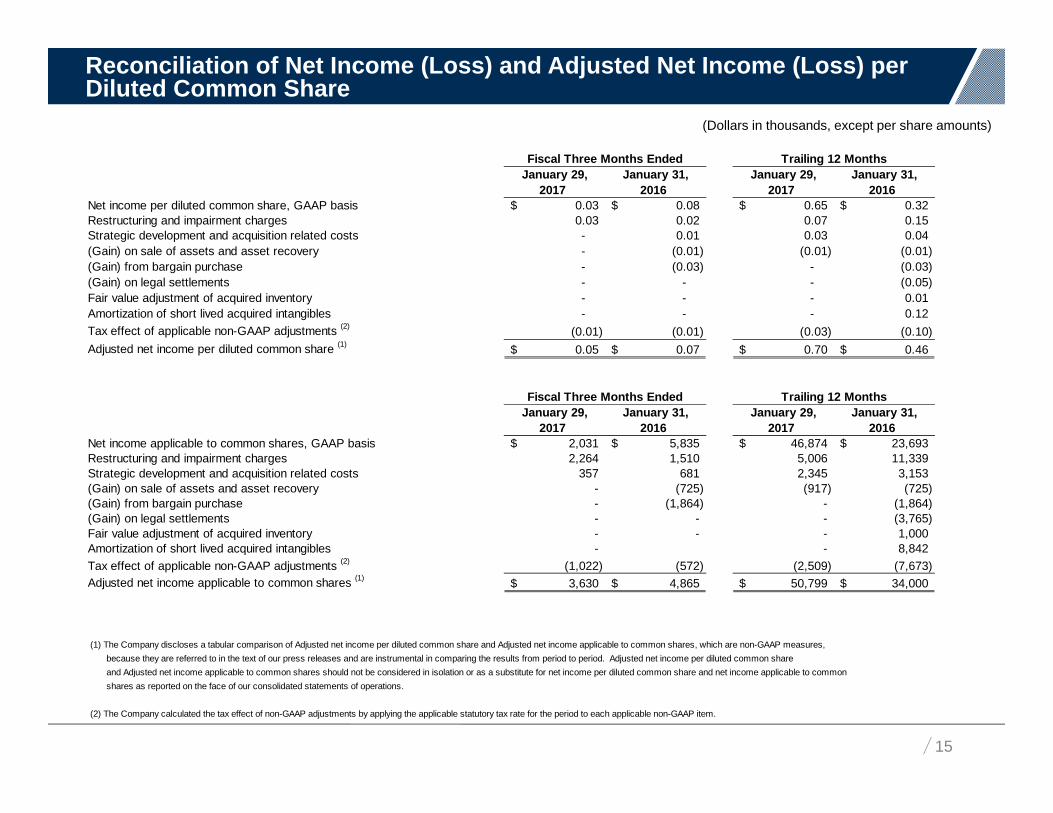
(Dollars in thousands, except per share amounts)
January 29, January 31, January 29, January 31,2017 2016 2017 2016
Net income per diluted common share, GAAP basis 0.03$ 0.08$ 0.65$ 0.32$ Restructuring and impairment charges 0.03 0.02 0.07 0.15 Strategic development and acquisition related costs - 0.01 0.03 0.04 (Gain) on sale of assets and asset recovery - (0.01) (0.01) (0.01) (Gain) from bargain purchase - (0.03) - (0.03) (Gain) on legal settlements - - - (0.05) Fair value adjustment of acquired inventory - - - 0.01 Amortization of short lived acquired intangibles - - - 0.12 Tax effect of applicable non-GAAP adjustments (2) (0.01) (0.01) (0.03) (0.10) Adjusted net income per diluted common share (1) 0.05$ 0.07$ 0.70$ 0.46$
January 29, January 31, January 29, January 31,2017 2016 2017 2016
Net income applicable to common shares, GAAP basis 2,031$ 5,835$ 46,874$ 23,693$ Restructuring and impairment charges 2,264 1,510 5,006 11,339 Strategic development and acquisition related costs 357 681 2,345 3,153 (Gain) on sale of assets and asset recovery - (725) (917) (725) (Gain) from bargain purchase - (1,864) - (1,864) (Gain) on legal settlements - - - (3,765) Fair value adjustment of acquired inventory - - - 1,000 Amortization of short lived acquired intangibles - - 8,842 Tax effect of applicable non-GAAP adjustments (2) (1,022) (572) (2,509) (7,673) Adjusted net income applicable to common shares (1) 3,630$ 4,865$ 50,799$ 34,000$
0.051063 0
(1) The Company discloses a tabular comparison of Adjusted net income per diluted common share and Adjusted net income applicable to common shares, which are non-GAAP measures, because they are referred to in the text of our press releases and are instrumental in comparing the results from period to period. Adjusted net income per diluted common share and Adjusted net income applicable to common shares should not be considered in isolation or as a substitute for net income per diluted common share and net income applicable to common shares as reported on the face of our consolidated statements of operations.
(2) The Company calculated the tax effect of non-GAAP adjustments by applying the applicable statutory tax rate for the period to each applicable non-GAAP item.
Fiscal Three Months Ended
Trailing 12 Months
Trailing 12 Months
Fiscal Three Months Ended
Our Mission & Vision
Reconciliation of 1Q 2017 Operating Income(Loss) to Adjusted Operating Income (Loss) by Segment
16
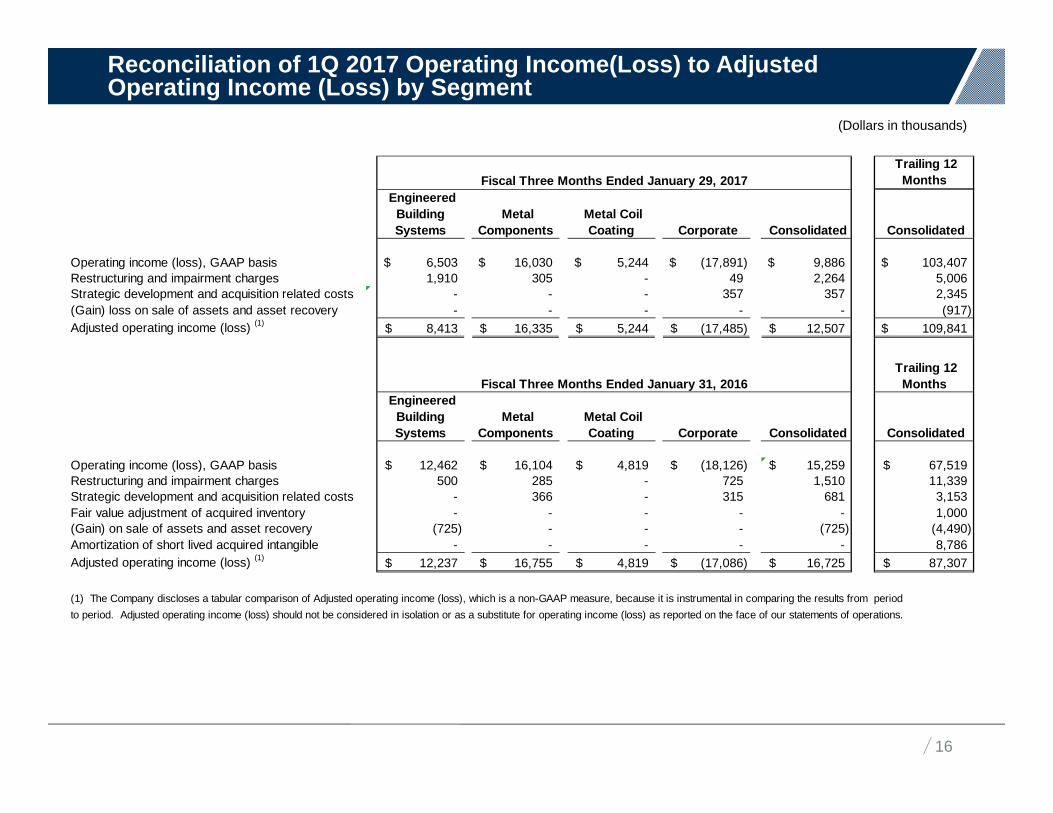
(Dollars in thousands)
Trailing 12 Months
Engineered Building Systems
Metal Components
Metal Coil Coating Corporate Consolidated Consolidated
Operating income (loss), GAAP basis 6,503$ 16,030$ 5,244$ (17,891)$ 9,886$ 103,407$ Restructuring and impairment charges 1,910 305 - 49 2,264 5,006 Strategic development and acquisition related costs # - - - 357 357 2,345 (Gain) loss on sale of assets and asset recovery - - - - - (917) Adjusted operating income (loss) (1) 8,413$ 16,335$ 5,244$ (17,485)$ 12,507$ 109,841$
Trailing 12 Months
Engineered Building Systems
Metal Components
Metal Coil Coating Corporate Consolidated Consolidated
Operating income (loss), GAAP basis # 12,462$ 16,104$ 4,819$ (18,126)$ 15,259$ 67,519$ Restructuring and impairment charges 500 285 - 725 1,510 11,339 Strategic development and acquisition related costs - 366 - 315 681 3,153 Fair value adjustment of acquired inventory - - - - - 1,000 (Gain) on sale of assets and asset recovery (725) - - - (725) (4,490) Amortization of short lived acquired intangible - - - - - 8,786 Adjusted operating income (loss) (1) 12,237$ 16,755$ 4,819$ (17,086)$ 16,725$ 87,307$
(1) The Company discloses a tabular comparison of Adjusted operating income (loss), which is a non-GAAP measure, because it is instrumental in comparing the results from periodto period. Adjusted operating income (loss) should not be considered in isolation or as a substitute for operating income (loss) as reported on the face of our statements of operations.
Fiscal Three Months Ended January 29, 2017
Fiscal Three Months Ended January 31, 2016
Our Mission & Vision
Reconciliation of 1Q 2017 Net Income (Loss) to Adjusted EBITDA by Segment
17
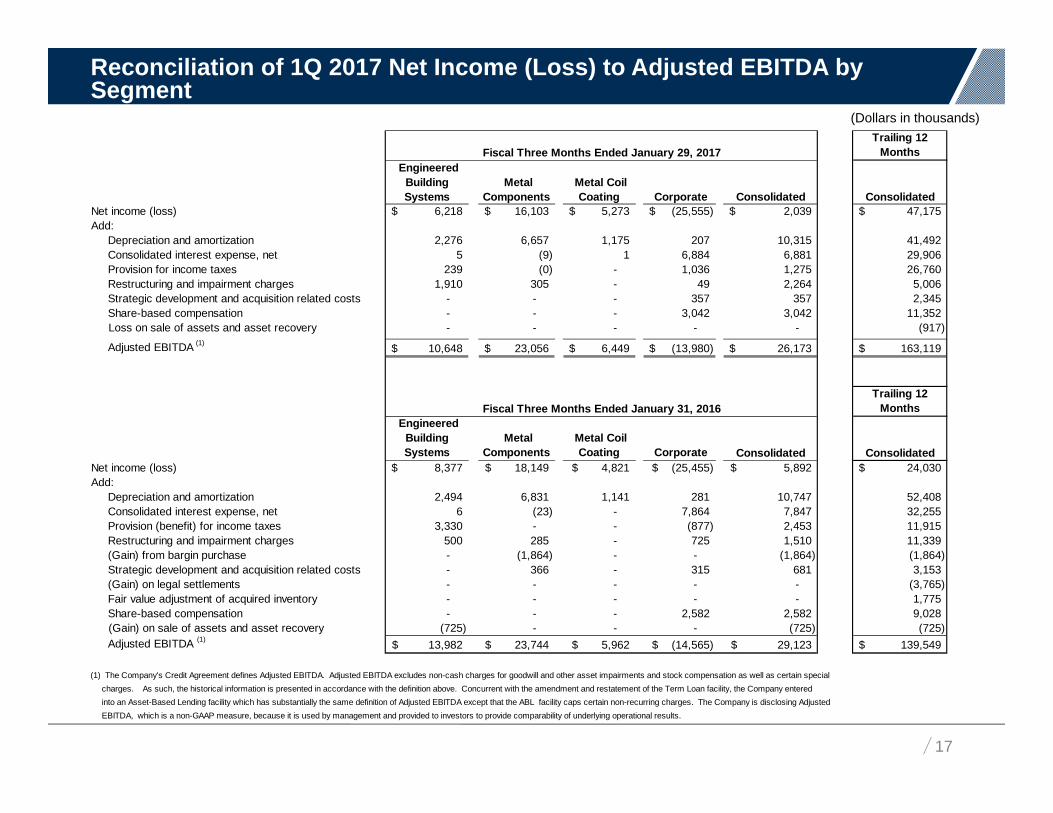
(Dollars in thousands)Trailing 12
Months Engineered
Building Systems
Metal Components
Metal Coil Coating Corporate Consolidated Consolidated
Net income (loss) 6,218$ 16,103$ 5,273$ (25,555)$ 2,039$ 47,175$ Add: Depreciation and amortization 2,276 6,657 1,175 207 10,315 41,492 Consolidated interest expense, net 5 (9) 1 6,884 6,881 29,906 Provision for income taxes 239 (0) - 1,036 1,275 26,760 Restructuring and impairment charges 1,910 305 - 49 2,264 5,006 Strategic development and acquisition related costs - - - 357 357 2,345 Share-based compensation - - - 3,042 3,042 11,352 Loss on sale of assets and asset recovery - - - - - (917)
Adjusted EBITDA (1) 10,648$ 23,056$ 6,449$ (13,980)$ 26,173$ 163,119$ -$
Trailing 12 Months
Engineered Building Systems
Metal Components
Metal Coil Coating Corporate Consolidated Consolidated
Net income (loss) 8,377$ 18,149$ 4,821$ (25,455)$ 5,892$ 24,030$ Add: Depreciation and amortization 2,494 6,831 1,141 281 10,747 52,408 Consolidated interest expense, net 6 (23) - 7,864 7,847 32,255 Provision (benefit) for income taxes 3,330 - - (877) 2,453 11,915 Restructuring and impairment charges 500 285 - 725 1,510 11,339 (Gain) from bargin purchase - (1,864) - - (1,864) (1,864) Strategic development and acquisition related costs - 366 - 315 681 3,153 (Gain) on legal settlements - - - - - (3,765) Fair value adjustment of acquired inventory - - - - - 1,775 Share-based compensation - - - 2,582 2,582 9,028 (Gain) on sale of assets and asset recovery (725) - - - (725) (725)
Adjusted EBITDA (1) 13,982$ 23,744$ 5,962$ (14,565)$ 29,123$ 139,549$ 725 1 - (1) 724
(1) The Company's Credit Agreement defines Adjusted EBITDA. Adjusted EBITDA excludes non-cash charges for goodwill and other asset impairments and stock compensation as well as certain special charges. As such, the historical information is presented in accordance with the definition above. Concurrent with the amendment and restatement of the Term Loan facility, the Company entered into an Asset-Based Lending facility which has substantially the same definition of Adjusted EBITDA except that the ABL facility caps certain non-recurring charges. The Company is disclosing Adjusted EBITDA, which is a non-GAAP measure, because it is used by management and provided to investors to provide comparability of underlying operational results.
Fiscal Three Months Ended January 29, 2017
Fiscal Three Months Ended January 31, 2016
Our Mission & Vision
K. DARCEY MATTHEWSVice President, Investor Relations
ncibuildingsystems.com


![Welcome [] · 15/12/2017 · 2012 q1 2013 q1 2014 q1 2015 q1 2016 q1 2017 q1 unemployment rate, lhs (% labour force, seasonally adjusted) Job vacancies rate, rhs (%labour force,](https://static.fdocuments.in/doc/165x107/5f9663c45f9e000e8c444eed/welcome-15122017-2012-q1-2013-q1-2014-q1-2015-q1-2016-q1-2017-q1-unemployment.jpg)


