Q1 2017 Financial Statements - Butterfield...
39
Transcript of Q1 2017 Financial Statements - Butterfield...


INDEX TO FINANCIAL STATEMENTS
Unaudited Consolidated Financial Statements PageConsolidated Balance Sheets (unaudited) as of 31 March 2017 and 31 December 2016 2Consolidated Statements of Operations (unaudited) for the Three Months Ended 31 March 2017 and 2016 3Consolidated Statements of Comprehensive Income (unaudited) for the Three Months Ended 31 March 2017 and 2016 4Consolidated Statements of Changes in Shareholders’ Equity (unaudited) for the Three Months Ended 31 March 2017 and 2016 5Consolidated Statements of Cash Flows (unaudited) for the Three Months Ended 31 March 2017 and 2016 6Notes to the Consolidated Financial Statements (unaudited) 7
1

As at31 March 2017 31 December 2016
AssetsCash and demand deposits with banks - Non-interest bearing 85,051 110,741Demand deposits with banks - Interest bearing 247,768 326,437Cash equivalents - Interest bearing 1,534,490 1,664,473
Cash due from banks 1,867,309 2,101,651Securities purchased under agreement to resell 62,669 148,813Short-term investments 542,163 519,755Investment in securities
Trading 6,470 6,313Available-for-sale 3,306,211 3,332,738Held-to-maturity (fair value: $1,222,784 (2016: $1,046,828)) 1,235,965 1,061,103
Total investment in securities 4,548,646 4,400,154Loans
Loans 3,615,945 3,614,725Allowance for credit losses (43,156) (44,247)
Loans, net of allowance for credit losses 3,572,789 3,570,478Premises, equipment and computer software 166,161 167,773Accrued interest 22,786 22,780Goodwill 19,967 19,622Intangible assets 41,447 42,289Equity method investments 13,789 13,482Other real estate owned 14,088 14,199Other assets 71,746 82,549
Total assets 10,943,560 11,103,545
Liabilities Customer deposits
BermudaNon-interest bearing 1,649,708 1,733,684Interest bearing 3,871,852 4,213,417
Non-BermudaNon-interest bearing 613,594 651,329Interest bearing 3,704,261 3,411,423
Total customer deposits 9,839,415 10,009,853Bank deposits
Bermuda 142 344Non-Bermuda 9,870 23,452
Total deposits 9,849,427 10,033,649Employee benefit plans 139,555 139,967Accrued interest 3,050 2,143Other liabilities 93,527 100,044
Total other liabilities 236,132 242,154Long-term debt 117,000 117,000
Total liabilities 10,202,559 10,392,803Commitments, contingencies and guarantees (Note 12)
Shareholders' equity
Common share capital (BMD 0.01 par; authorised voting ordinary shares 2,000,000,000 and non-voting ordinary shares 6,000,000,000) issued and outstanding: 54,255,377 (2016: 53,284,872) 543 533
Additional paid-in capital 1,147,981 1,142,608Accumulated deficit (269,117) (287,677)Less: treasury common shares, at cost: 58 (2016: 2,066) (1) (42)Accumulated other comprehensive loss (138,405) (144,680)
Total shareholders’ equity 741,001 710,742Total liabilities and shareholders’ equity 10,943,560 11,103,545
The accompanying notes are an integral part of these consolidated financial statements.
The Bank of N.T. Butterfield & Son LimitedConsolidated Balance Sheets (unaudited)
(In thousands of US dollars, except share and per share data)
2

Three months ended31 March 2017 31 March 2016
Non-interest income Asset management 5,840 4,188Banking 10,043 8,665Foreign exchange revenue 8,306 8,324Trust 11,390 10,145Custody and other administration services 2,012 2,219Other non-interest income 947 977
Total non-interest income 38,538 34,518Interest income
Interest and fees on loans 44,007 47,417Investments (none of the investment securities are intrinsically tax-exempt)
Trading — 963Available-for-sale 15,874 11,714Held-to-maturity 8,559 5,289
Deposits with banks 3,479 1,600Total interest income 71,919 66,983Interest expense
Deposits 2,793 3,483Long-term debt 1,193 1,094Securities sold under repurchase agreements — 69
Total interest expense 3,986 4,646Net interest income before provision for credit losses 67,933 62,337
Provision for credit recovery 339 342Net interest income after provision for credit losses 68,272 62,679
Net trading gains (losses) 157 1,033Net realised gains (losses) on available-for-sale investments 69 (76)Net gains (losses) on other real estate owned 68 (307)Net other gains (losses) (71) (889)
Total other gains (losses) 223 (239)Total net revenue 107,033 96,958Non-interest expense
Salaries and other employee benefits 35,995 31,238Technology and communications 12,949 14,456Property 4,922 5,019Professional and outside services 6,244 4,063Indirect taxes 4,196 4,618Amortisation of intangible assets 1,030 1,052Marketing 963 948Restructuring costs 441 4,459Other expenses 4,261 4,080
Total non-interest expense 71,001 69,933Net income before income taxes 36,032 27,025
Income tax expense (175) (264)Net income 35,857 26,761
Cash dividends declared on preference shares — (3,657)Preference shares guarantee fee — (462)
Net income attributable to common shareholders 35,857 22,642
Earnings per common share Basic earnings per share 0.67 0.49Diluted earnings per share 0.65 0.48
Dividend per share 0.32 0.10The accompanying notes are an integral part of these consolidated financial statements.
The Bank of N.T. Butterfield & Son LimitedConsolidated Statements of Operations (unaudited)
(In thousands of US dollars, except per share data)
3
Three months ended31 March 2017 31 March 2016
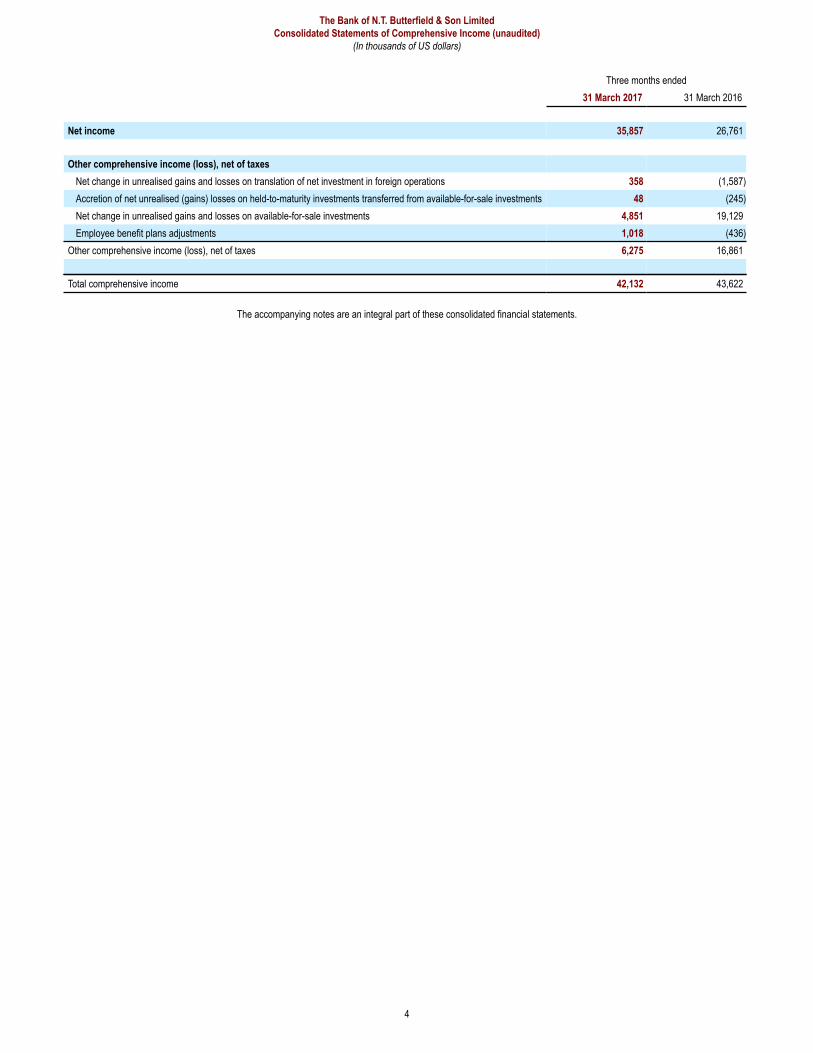
Net income 35,857 26,761
Other comprehensive income (loss), net of taxesNet change in unrealised gains and losses on translation of net investment in foreign operations 358 (1,587)Accretion of net unrealised (gains) losses on held-to-maturity investments transferred from available-for-sale investments 48 (245)Net change in unrealised gains and losses on available-for-sale investments 4,851 19,129Employee benefit plans adjustments 1,018 (436)
Other comprehensive income (loss), net of taxes 6,275 16,861
Total comprehensive income 42,132 43,622
The accompanying notes are an integral part of these consolidated financial statements.
The Bank of N.T. Butterfield & Son LimitedConsolidated Statements of Comprehensive Income (unaudited)
(In thousands of US dollars)
4

Three months ended31 March 2017 31 March 2016
Number of sharesIn thousands of
US dollars Number of sharesIn thousands of
US dollarsCommon share capital issued and outstanding
Balance at beginning of period 53,284,872 533 47,293,253 473Issuance of common shares 970,505 10 — —
Balance at end of period 54,255,377 543 47,293,253 473
Preference sharesBalance at beginning of period — — 182,863 2Repurchase and cancellation of preference shares — — — —
Balance at end of period — — 182,863 2
Additional paid-in capitalBalance at beginning of period 1,142,608 1,225,344Share-based compensation 1,741 1,791Share-based settlements (10) (6,785)Cost of issuance of common shares 22 —Issuance of common shares, net of underwriting discounts and commissions 3,621 —Sale of treasury common shares (1) —
Balance at end of period 1,147,981 1,220,350
Accumulated deficitBalance at beginning of period (287,677) (368,618)Net income for period 35,857 26,761Common share cash dividends declared and paid, $0.32 per share (2016 $0.10 per share) (17,297) (4,674)Cash dividends declared on preference shares, nil per share (2016: $20.00 per share) — (3,657)Preference shares guarantee fee — (462)
Balance at end of period (269,117) (350,650)
Treasury common sharesBalance at beginning of period 2,066 (42) 924,031 (16,350)Purchase of treasury common shares — — 16,542 (272)Sale of treasury common shares (380) 13 — —Share-based settlements (1,628) 28 (392,884) 6,941
Balance at end of period 58 (1) 547,689 (9,681)
Accumulated other comprehensive income (loss)Balance at beginning of period (144,680) (90,497)Other comprehensive income (loss), net of taxes 6,275 16,861
Balance at end of period (138,405) (73,636)Total shareholders' equity 741,001 786,858
The accompanying notes are an integral part of these consolidated financial statements.
The Bank of N.T. Butterfield & Son LimitedConsolidated Statements of Changes in Shareholders' Equity (unaudited)
5

Three months ended31 March 2017 31 March 2016
Cash flows from operating activitiesNet income 35,857 26,761Adjustments to reconcile net income to operating cash flows
Depreciation and amortisation 12,803 11,228Provision for credit (recovery) losses (339) (342)Share-based payments and settlements 1,759 1,791Net realised (gains) losses on available-for-sale investments (69) 76(Gain) loss on sale of premises and equipment — (5)Net (gains) losses on other real estate owned (68) 307(Increase) in carrying value of equity method investments (347) (364)Fair value adjustments of a contingent payment — 895
Changes in operating assets and liabilities(Increase) decrease in accrued interest receivable 94 (4,928)(Increase) decrease in other assets 11,085 (3,861)Increase in accrued interest payable 873 624Increase (decrease) in employee benefit plans and other liabilities (7,205) 2,326
Cash provided by operating activities 54,443 34,508
Cash flows from investing activities(Increase) decrease in securities purchased under agreement to resell 86,144 —Net (increase) in short-term investments (22,108) (31,194)Net change in trading investments (157) 81,725Available-for-sale investments: proceeds from sale 86 7,567Available-for-sale investments: proceeds from maturities and pay downs 124,944 130,245Available-for-sale investments: purchases (98,804) (540,674)Held-to-maturity investments: proceeds from maturities and pay downs 23,648 9,597Held-to-maturity investments: purchases (199,248) (36,346)Net decrease in loans 9,070 29,568Additions to premises, equipment and computer software (3,888) (2,780)Proceeds from sale of other real estate owned 179 2,361Dividends received on equity method investments 40 30
Cash (used in) investing activities (80,094) (349,901)
Cash flows from financing activitiesNet increase (decrease) in demand and term deposit liabilities (205,239) (200,855)Net increase (decrease) in securities sold under agreement to repurchase — 23,518Proceeds from issuance of common shares, net of underwriting discounts and commissions 13 —Common shares repurchased — (272)Proceeds from stock option exercises 3,631 156Cash dividends paid on common and contingent value convertible preference shares (17,297) (4,674)Cash dividends paid on preference shares — (3,657)Preference shares guarantee fee paid — (462)
Cash (used in) financing activities (218,892) (186,246)Net effect of exchange rates on cash due from banks 10,201 (13,208)
Net (decrease) in cash due from banks (234,342) (514,847)Cash due from banks at beginning of period 2,101,651 2,288,890Cash due from banks at end of period 1,867,309 1,774,043
The accompanying notes are an integral part of these consolidated financial statements.
The Bank of N.T. Butterfield & Son LimitedConsolidated Statements of Cash Flows (unaudited)
(In thousands of US dollars)
6
Note 1: Nature of business
The Bank of N.T. Butterfield & Son Limited (“Butterfield”, the “Bank” or the “Company”) is incorporated under the laws of Bermuda and has a banking licence under the Bank andDeposit Companies Act, 1999 (“the Act”). Butterfield is regulated by the Bermuda Monetary Authority (“BMA”), which operates in accordance with Basel principles.
Butterfield is a full service bank and wealth manager headquartered in Hamilton, Bermuda. The Bank operates its business through six geographic segments: Bermuda, theCayman Islands, and Guernsey, where its principal banking operations are located; and The Bahamas, Switzerland, and the United Kingdom, where it offers specialized financialservices. Butterfield offers banking services, comprised of retail and corporate banking, and wealth management, which consists of trust, private banking, and assetmanagement. In the Bermuda and Cayman Islands segments, Butterfield offers both banking and wealth management. In the Guernsey, Bahamas, and Switzerland segments,the Bank offers wealth management. In the United Kingdom segment, the Bank offers residential property lending.
On 16 September 2016, the Bank's common shares began to trade on the New York Stock Exchange under the symbol "NTB". On 21 September 2016, the Bank completed itsoffering of 5,957,447 common shares, at $23.50 per share. The proceeds, net of the underwriting discounts and commissions, were $131.6 million.
The Bank of N.T. Butterfield & Son LimitedNotes to the Consolidated Financial Statements (unaudited)
(In thousands of US dollars, unless otherwise stated)
7
Note 2: Significant accounting policies
The accompanying unaudited interim consolidated financial statements of the Bank have been prepared in accordance with accounting principles generally accepted in theUnited States of America (“US GAAP”) for interim financial information and should be read in conjunction with the Bank’s audited financial statements for the year ended31 December 2016.
In the opinion of Management, these unaudited interim consolidated financial statements reflect all adjustments (consisting principally of normal recurring accruals) considerednecessary for a fair statement of the Bank’s financial position and results of operations as at the end of and for the periods presented. The Bank’s results for interim periods arenot necessarily indicative of results for the full year.
The preparation of financial statements in conformity with US GAAP requires Management to make estimates and assumptions that affect the reported amounts of assets andliabilities at the date of the financial statements and the reported amounts of revenues and expenses during the reporting period. While Management believes that the amountsincluded in the unaudited interim consolidated financial statements reflect its best estimates and assumptions, actual results could differ from those estimates. The Bank’sprincipal estimates include:• Allowance for credit losses• Fair value and impairment of financial instruments• Impairment of long-lived assets• Impairment of goodwill• Employee benefit plans• Share-based payments
On 1 January 2016, the Bank changed its financial statements' reporting currency from Bermuda dollars to United States ("US") dollars for all periods presented. Assets,liabilities, revenues and expenses denominated in Bermuda dollars are translated to US dollars at par.
The following accounting developments were issued during the three months ended 31 March 2017:
In January 2017, the Financial Accounting Standards Board ("FASB") published Accounting Standards Update No. 2017-03 Accounting Changes and Error Corrections (Topic250) and Investments - Equity Method and Joint Ventures (Topic 323) - Amendments to SEC Paragraphs Pursuant to Staff Announcement at the September 22, 2016 andNovember 17, 2016 EITF Meetings. The amendments in this update reflect the SEC Staff Announcement "Disclosure of the Impact that Recently Issued Accounting StandardsWill Have on the Financial Statements of a Registrant When Such Standards Are Adopted in a Future Period (in accordance with Staff Accounting Bulletin [SAG] Topic 11.M)". Itapplies to ASU 2014-09 Revenue from Contracts with Customers (Topic 606), ASU 2016-02 Leases (Topic 842), and ASU 2016-13 Financial Instruments - Credit Losses (Topic326): Measurement of Credit Losses on Financial Instruments. The ASUs mentioned above follow with the applied amendments.
In May 2014, the FASB and the International Accounting Standards Board ("IASB") issued converged final standards on revenue recognition. The FASB issued AccountingStandards Update No. 2014-09 Revenue from Contracts with Customers (Topic 606) ("ASU 2014-09"). The core principle of the new standards is that revenue is recognizedwhen a customer obtains control of a good or service compared to the existing model that is based on the transfer of risks and rewards. As a result of the change, revenuecould be recognized earlier or later than under current GAAP and in addition, the update requires extensive new disclosures. The effective date for this update is the same asfor Accounting Standards Update No. 2015-14 Revenue from Contracts with Customers (Topic 606), Deferral of the Effective Date which defers the effective date of ASU2014-09 by one year resulting in the effective date being fiscal years, and interim periods with in those fiscal years, beginning after 15 December 2017. Earlier application ispermitted only as of annual reporting periods beginning after 15 December 2016, including interim reporting periods within that reporting period. The Bank has determined thatthis standard will affect non-interest income items that are fee generating but does not expect the impact to have a significant effect.
In February 2016, the FASB published Accounting Standards Update No. 2016-02 Leases (Topic 842) which requires the recognition of lease assets and lease liabilities bylessees for those leases classified as operating leases under previous GAAP. This update is effective for public business entities for fiscal years, and interim periods with inthose fiscal years, beginning after 15 December 2018. Early application is permitted. The Bank has determined that this standard will have an effect due to the recognition oflease assets and lease liabilities currently classified as operating leases, which will result in the recognition of assets and corresponding lease liabilities.
In June 2016, the FASB published Accounting Standards Update No. 2016-13 Financial Instruments – Credit Losses. The amendments in this update provide a new impairmentmodel, known as the current expected credit loss model that is based on expected losses rather than incurred losses. The amendments in this update are also intended toreduce the complexity and reduce the number of impairment models entities use to account for debt instruments. For public business entities that meet the GAAP definition of anSEC filer, the effective date for this update for fiscal years beginning after 15 December 2019, including interim periods within those fiscal years. The Bank is assessing theimpact of the adoption of this guidance.
In January 2017, the FASB published Accounting Standards Update No. 2017-04 Intangibles - Goodwill and Other (Topic 350) - Simplifying the Test for Goodwill Impairment. Tosimplify the subsequent measurement of goodwill, the FASB eliminated Step 2 from the goodwill impairment test, and therefore an entity should perform its annual, or interim,goodwill impairment test by comparing the fair value of a reporting unit with its carrying amount and recognize an impairment charge for the amount by which the carryingamount exceeds the reporting unit’s fair value. The loss recognized should not exceed the total amount of goodwill allocated to that reporting unit and an entity should considerincome tax effects from any tax deductible goodwill on the carrying amount of the reporting unit when measuring the goodwill impairment loss, if applicable. This update should

be adopted on a prospective basis by a public business entity that is a US Securities and Exchange Commission filer for its annual or any interim goodwill impairment tests infiscal years beginning after 15 December 2019. Early adoption is permitted for interim or annual goodwill impairment tests performed on testing dates after 1 January 2017.The Bank is assessing the impact of the adoption of this guidance.
In March 2017, the FASB published Accounting Standards Update No. 2017-07 Compensation - Retirement Benefits (Topic 715) - Improving the Presentation of Net PeriodicPension Cost and Net Periodic Post-retirement Benefit Cost. The amendments in this Update require that an employer report the service cost component in the same line itemor items as other compensation costs arising from services rendered by the pertinent employees during the period. The other components of net benefit cost are required to bepresented in the income statement separately from the service cost component and outside a subtotal of income from operations, if one is presented. The amendments in thisUpdate are effective for public business entities for annual periods beginning after 15 December 2017, including interim periods within those annual periods. Early adoption ispermitted. The amendments in this Update should be applied retrospectively for the presentation of the service cost component and the other components of net periodicpension cost and net periodic post-retirement benefit cost in the income statement and prospectively, on and after the effective date, for the capitalization of the service costcomponent of net periodic pension cost and net periodic post-retirement benefit in assets. The Bank has determined that this standard will have an effect on the presentation ofother components of net benefit cost in the consolidated statements of operations and statements of comprehensive income as the Bank currently reflects those items with theservice cost component.
The Bank of N.T. Butterfield & Son LimitedNotes to the Consolidated Financial Statements (unaudited) (continued)
(In thousands of US dollars, unless otherwise stated)
8
Note 3: Cash due from banks
31 March 2017 31 December 2016Bermuda Non-Bermuda Total Bermuda Non-Bermuda Total
Non-interest bearingCash and demand deposits with banks 22,851 62,200 85,051 28,690 82,051 110,741
Interest bearing¹Demand deposits with banks 95,727 152,041 247,768 138,123 188,314 326,437Cash equivalents 618,338 916,152 1,534,490 976,557 687,916 1,664,473
Sub-total - Interest bearing 714,065 1,068,193 1,782,258 1,114,680 876,230 1,990,910
Total cash due from banks 736,916 1,130,393 1,867,309 1,143,370 958,281 2,101,651¹ Interest bearing cash due from banks includes certain demand deposits with banks as at 31 March 2017 in the amount of $220.7 million (31 December 2016: $305.3 million)that are earning interest at a negligible rate.
Note 4: Short-term investments
31 March 2017 31 December 2016Bermuda Non-Bermuda Total Bermuda Non-Bermuda Total
UnrestrictedMaturing within three months 387,324 41,334 428,658 36,953 80,360 117,313Maturing between three to six months 41,353 50,171 91,524 343,723 40,825 384,548Maturing between six to twelve months — 409 409 — — —
Total unrestricted short-term investments 428,677 91,914 520,591 380,676 121,185 501,861
Affected by drawing restrictions related to minimum reserve and derivative margin requirementsInterest earning demand deposits 20,569 1,003 21,572 17,894 — 17,894
Total short-term investments 449,246 92,917 542,163 398,570 121,185 519,755

Note 5: Investment in securities
Amortised Cost, Carrying Amount and Fair ValueOn the consolidated balance sheets, trading and available-for-sale ("AFS") investments are carried at fair value and held-to-maturity ("HTM") investments are carried atamortised cost.
31 March 2017 31 December 2016
Amortised cost
Gross unrealised
gains
Gross unrealised
losses Fair valueAmortised
cost
Gross unrealised
gains
Gross unrealised
losses Fair valueTrading
Mutual funds 5,724 1,262 (516) 6,470 5,724 1,091 (502) 6,313Total trading 5,724 1,262 (516) 6,470 5,724 1,091 (502) 6,313
Available-for-saleUS government and federal agencies 2,411,700 8,763 (23,926) 2,396,537 2,448,207 6,773 (24,578) 2,430,402Non-US governments debt securities 27,883 181 (378) 27,686 27,895 178 (1,053) 27,020Corporate debt securities 510,563 2,417 (927) 512,053 513,881 2,139 (1,545) 514,475Asset-backed securities - Student loans 13,290 — (797) 12,493 13,290 — (797) 12,493Commercial mortgage-backed securities 151,552 111 (1,320) 150,343 151,855 43 (1,352) 150,546Residential mortgage-backed securities 209,050 29 (1,980) 207,099 200,288 56 (2,542) 197,802
Total available-for-sale 3,324,038 11,501 (29,328) 3,306,211 3,355,416 9,189 (31,867) 3,332,738
Held-to-maturity¹US government and federal agencies 1,235,965 3,176 (16,357) 1,222,784 1,061,103 2,528 (16,803) 1,046,828
Total held-to-maturity 1,235,965 3,176 (16,357) 1,222,784 1,061,103 2,528 (16,803) 1,046,828¹ For the three months ended 31 March 2017 and the year ended 31 December 2016, non-credit impairments recognised in accumulated other comprehensive loss ("AOCL") forHTM investments were nil.
Investments with Unrealised Loss PositionsThe Bank does not believe that the AFS and HTM investment securities that were in an unrealised loss position as of 31 March 2017 (and 31 December 2016), which werecomprised of 162 securities representing 64% of the AFS and HTM portfolios' fair value (31 December 2016: 170 and 76%, respectively), represent an other-than-temporaryimpairment ("OTTI"). Total gross unrealised losses were 1.6% of the fair value of affected securities (31 December 2016: 1.5%) and were attributable primarily to changes inmarket interest rates, relative to when the investment securities were purchased, and not due to the credit quality of the investment securities. The following describes theprocesses for identifying credit impairment in security types with the most significant unrealised losses as shown in the preceding tables.
Management believes that all the US government and federal agencies securities do not have any credit losses, given the explicit and implicit guarantees provided by the USfederal government.
Management believes that all the Non-US governments debt securities securities do not have any credit losses, given the explicit guarantee provided by the issuinggovernment.
The unrealised losses in Corporate debt securities relate primarily to 5 debt securities that are all of investment grade with ratings ranging from A- to AA- . Managementbelieves that the value of these securities will recover and the current unrealised loss positions are a result of interest rate movements.
Investments in Asset-backed securities - Student loans are composed primarily of securities collateralised by Federal Family Education Loan Program loans (“FFELP loans”).FFELP loans benefit from a US federal government guarantee of at least 97% of defaulted principal and accrued interest, with additional credit support provided in the form ofover-collateralisation, subordination and excess spread, which collectively total in excess of 100%. Accordingly, the vast majority of FFELP loan-backed securities are notexposed to traditional consumer credit risk.
Investments in Commercial mortgage-backed securities relate to 10 senior securities rated AAA and one senior security rated A that possess significant subordination, a formof credit enhancement expressed hereafter as the percentage of pool losses that can occur before the senior securities held by the Bank will incur its first dollar of principal loss.No credit losses were recognised on these securities as the credit support and/or the weighted average loan-to-value ratios ("LTV") range from 5% - 36% and 25% - 60%,respectively. Current credit support is significantly greater than any delinquencies experienced on the underlying mortgages.
Investments in Residential mortgage-backed securities relate to 15 securities which are rated AAA or AA+ and possess significant credit enhancement as described above.No credit losses were recognised on these securities as there are no delinquencies over 60 days on the underlying mortgages and the weighted average credit support and LTVratios range from 5% - 18% and 56% - 68%, respectively.
The Bank of N.T. Butterfield & Son LimitedNotes to the Consolidated Financial Statements (unaudited) (continued)
(In thousands of US dollars, unless otherwise stated)
9

In the following tables, debt securities with unrealised losses that are not deemed to be OTTI are categorised as being in a loss position for "less than 12 months" or "12 monthsor more" based on the point in time that the fair value most recently declined below the amortised cost basis. During 2016, Management revised the methodology forconsidering the time period during which an investment has been in an unrealized loss by looking at monthly positions rather than annually.
Less than 12 months 12 months or more
31 March 2017Fair
value
Gross unrealised
lossesFair
value
Grossunrealised
lossesTotal
fair value
Total grossunrealised
lossesAvailable-for-sale securities with unrealised losses
US government and federal agencies 1,301,698 (21,439) 268,347 (2,487) 1,570,045 (23,926)Non-US governments debt securities — — 22,360 (378) 22,360 (378)Corporate debt securities 65,063 (927) — — 65,063 (927)Asset-backed securities - Student loans — — 12,493 (797) 12,493 (797)Commercial mortgage-backed securities 133,951 (1,320) — — 133,951 (1,320)Residential mortgage-backed securities 182,270 (1,980) — — 182,270 (1,980)
Total available-for-sale securities with unrealised losses 1,682,982 (25,666) 303,200 (3,662) 1,986,182 (29,328)
Held-to-maturity securities with unrealised lossesUS government and federal agencies 908,077 (16,357) — — 908,077 (16,357)
Less than 12 months 12 months or more
31 December 2016Fair
value
Gross unrealised
lossesFair
value
Grossunrealised
lossesTotal
fair value
Total grossunrealised
lossesAvailable-for-sale securities with unrealised losses
Non-US governments debt securities 1,558,636 (21,932) 266,094 (2,646) 1,824,730 (24,578)US government and federal agencies 21,681 (1,053) — — 21,681 (1,053)Corporate debt securities 214,506 (1,545) — — 214,506 (1,545)Asset-backed securities - Student loans — — 12,493 (797) 12,493 (797)Commercial mortgage-backed securities 134,195 (1,352) — — 134,195 (1,352)Residential mortgage-backed securities 181,556 (2,542) — — 181,556 (2,542)
Total available-for-sale securities with unrealised losses 2,110,574 (28,424) 278,587 (3,443) 2,389,161 (31,867)
Held-to-maturity securities with unrealised lossesUS government and federal agencies 937,080 (16,803) — — 937,080 (16,803)
The Bank of N.T. Butterfield & Son LimitedNotes to the Consolidated Financial Statements (unaudited) (continued)
(In thousands of US dollars, unless otherwise stated)
10

Investment MaturitiesThe following table presents the remaining maturities of the Bank’s securities. The maturities are contractual for securities other than mortgage-backed securities. For mortgage-backed securities (primarily US government agencies), management presents the maturity date as the mid-point between the reporting date and the contractual maturity datewhich is determined assuming no future prepayments. By using the aforementioned mid-point, this date represents management’s best estimate of the date by which theremaining principal balance will be repaid given future principal repayments of such securities. The actual maturities may differ due to the uncertainty of the timing whenborrowers make prepayments on the underlying mortgages.
Remaining term to maturity
31 March 2017Within
3 months3 to 12
months1 to 5
years5 to 10 years
Over10 years
No specific maturity
Carrying amount
TradingMutual funds — — — — — 6,470 6,470
Available-for-sale US government and federal agencies — 5,018 81,703 702,364 1,607,452 — 2,396,537Non-US governments debt securities 685 685 3,956 22,360 — — 27,686Corporate debt securities 14,097 137,395 360,561 — — — 512,053Asset-backed securities - Student loans — — — — 12,493 — 12,493Commercial mortgage-backed securities — — — 7,072 143,271 — 150,343Residential mortgage-backed securities — — — — 207,099 — 207,099
Total available-for-sale 14,782 143,098 446,220 731,796 1,970,315 — 3,306,211
Held-to-maturityUS government and federal agencies — — 10,669 30,297 1,194,999 — 1,235,965
Total investments 14,782 143,098 456,889 762,093 3,165,314 6,470 4,548,646
Total by currencyUS dollars 14,782 143,098 456,889 762,093 3,165,314 6,262 4,548,438Other — — — — — 208 208
Total investments 14,782 143,098 456,889 762,093 3,165,314 6,470 4,548,646
Remaining term to maturity
31 December 2016Within
3 months3 to 12
months1 to 5 years
5 to 10 years
Over10 years
No specific maturity
Carrying amount
Trading Mutual funds — — — — — 6,313 6,313
Available-for-sale US government and federal agencies — 6,364 87,257 653,603 1,683,178 — 2,430,402Non-US governments debt securities — 1,371 3,967 21,682 — — 27,020Corporate debt securities 22,009 88,169 404,297 — — — 514,475Asset-backed securities - Student loans — — — — 12,493 — 12,493Commercial mortgage-backed securities — — 38,418 112,128 — — 150,546Residential mortgage-backed securities — — — — 197,802 — 197,802
Total available-for-sale 22,009 95,904 533,939 787,413 1,893,473 — 3,332,738
Held-to-maturityUS government and federal agencies — — 10,688 31,154 1,019,261 — 1,061,103
Total investments 22,009 95,904 544,627 818,567 2,912,734 6,313 4,400,154
Total by currencyUS dollars 22,009 95,904 544,627 818,567 2,912,734 6,091 4,399,932Other — — — — — 222 222
Total investments 22,009 95,904 544,627 818,567 2,912,734 6,313 4,400,154
The Bank of N.T. Butterfield & Son LimitedNotes to the Consolidated Financial Statements (unaudited) (continued)
(In thousands of US dollars, unless otherwise stated)
11

Pledged InvestmentsThe Bank pledges certain US government and federal agencies investment securities to further secure the Bank's issued customer deposit products. The secured party does nothave the right to sell or repledge the collateral.
31 March 2017 31 December 2016
Pledged Investments Amortised
cost Fair
value Amortised
cost Fair
value Available-for-sale 147,001 148,140 211,342 212,995Held-to-maturity 247,783 244,025 320,942 315,635
Sale Proceeds and Realised Gains and Losses of AFS Securities
Three months ended31 March 2017
Sale proceeds
Grossrealised
gains
Grossrealised(losses)
Pass-through note 86 69 —
Three months ended31 March 2016
Sale proceeds
Grossrealised
gains
Grossrealised(losses)
US government and federal agencies 7,567 — (76)
Taxability of Interest IncomeNone of the investments' interest income have received a specific preferential income tax treatment in any of the jurisdictions in which the Bank owns investments.
The Bank of N.T. Butterfield & Son LimitedNotes to the Consolidated Financial Statements (unaudited) (continued)
(In thousands of US dollars, unless otherwise stated)
12

Note 6: Loans
The "Bermuda" and "Non-Bermuda" classifications purpose is to reflect management segment reporting as described in Note 12: Segmented information.
The principal means of securing residential mortgages, personal, credit card and business loans are entitlements over assets and guarantees. Mortgage loans are generallyrepayable over periods of up to thirty years and personal, business and government loans are generally repayable over terms not exceeding five years. Amounts owing on creditcards are revolving and typically a minimum amount is due within 30 days from billing. The effective yield on total loans as at 31 March 2017 is 4.91% (31 December 2016:4.78%).
31 March 2017 31 December 2016
Bermuda Non-Bermuda Total Bermuda Non-Bermuda TotalCommercial loans
Government 94,871 17,908 112,779 94,504 17,908 112,412Commercial and industrial 136,114 182,908 319,022 130,171 201,652 331,823Commercial overdrafts 19,673 3,010 22,683 22,594 2,767 25,361
Total gross commercial loans 250,658 203,826 454,484 247,269 222,327 469,596Less specific allowance for credit losses (577) — (577) (577) — (577)
Net commercial loans 250,081 203,826 453,907 246,692 222,327 469,019
Commercial real estate loansCommercial mortgage 358,385 213,190 571,575 363,982 217,640 581,622Construction 24,500 11,710 36,210 24,500 4,385 28,885
Total gross commercial real estate loans 382,885 224,900 607,785 388,482 222,025 610,507Less specific allowance for credit losses (750) — (750) (750) — (750)
Net commercial real estate loans 382,135 224,900 607,035 387,732 222,025 609,757
Consumer loansAutomobile financing 13,001 6,588 19,589 13,077 6,905 19,982Credit card 55,792 19,416 75,208 57,730 20,811 78,541Overdrafts 7,053 2,947 10,000 2,380 3,202 5,582Other consumer 31,966 54,785 86,751 30,798 63,186 93,984
Total gross consumer loans 107,812 83,736 191,548 103,985 94,104 198,089Less specific allowance for credit losses (275) (3) (278) (275) (3) (278)
Net consumer loans 107,537 83,733 191,270 103,710 94,101 197,811
Residential mortgage loans 1,186,248 1,175,880 2,362,128 1,205,468 1,131,065 2,336,533Less specific allowance for credit losses (8,701) (845) (9,546) (9,559) (574) (10,133)
Net residential mortgage loans 1,177,547 1,175,035 2,352,582 1,195,909 1,130,491 2,326,400
Total gross loans 1,927,603 1,688,342 3,615,945 1,945,204 1,669,521 3,614,725Less specific allowance for credit losses (10,303) (848) (11,151) (11,161) (577) (11,738)Less general allowance for credit losses (24,399) (7,606) (32,005) (24,950) (7,559) (32,509)
Net loans 1,892,901 1,679,888 3,572,789 1,909,093 1,661,385 3,570,478
The Bank of N.T. Butterfield & Son LimitedNotes to the Consolidated Financial Statements (unaudited) (continued)
(In thousands of US dollars, unless otherwise stated)
13

Age Analysis of Past Due Loans (Including Non-Accrual Loans)The following tables summarise the past due status of the loans. The aging of past due amounts are determined based on the contractual delinquency status of payments underthe loan and this aging may be affected by the timing of the last business day at period end. Loans less than 30 days past due are included in current loans.
31 March 201730 - 59
days60 - 89
daysMore than 90
daysTotal past
due loansTotal
currentTotal
loansCommercial loans
Government — — — — 112,779 112,779Commercial and industrial 1,031 5,265 2,237 8,533 310,489 319,022Commercial overdrafts — — 65 65 22,618 22,683
Total commercial loans 1,031 5,265 2,302 8,598 445,886 454,484
Commercial real estate loansCommercial mortgage 9,155 — 6,289 15,444 556,131 571,575Construction — — — — 36,210 36,210
Total commercial real estate loans 9,155 — 6,289 15,444 592,341 607,785
Consumer loansAutomobile financing 86 14 214 314 19,275 19,589Credit card 408 60 172 640 74,568 75,208Overdrafts — — 7 7 9,993 10,000Other consumer 934 368 651 1,953 84,798 86,751
Total consumer loans 1,428 442 1,044 2,914 188,634 191,548
Residential mortgage loans 34,480 5,878 46,801 87,159 2,274,969 2,362,128
Total gross loans 46,094 11,585 56,436 114,115 3,501,830 3,615,945
31 December 201630 - 59
days60 - 89
daysMore than 90
daysTotal past
due loansTotal
currentTotal
loansCommercial loans
Government — — — — 112,412 112,412Commercial and industrial 2,712 — 584 3,296 328,527 331,823Commercial overdrafts — — 2 2 25,359 25,361
Total commercial loans 2,712 — 586 3,298 466,298 469,596
Commercial real estate loansCommercial mortgage 377 — 5,964 6,341 575,281 581,622Construction 175 — — 175 28,710 28,885
Total commercial real estate loans 552 — 5,964 6,516 603,991 610,507
Consumer loansAutomobile financing 86 23 225 334 19,648 19,982Credit card 366 177 392 935 77,606 78,541Overdrafts — — 17 17 5,565 5,582Other consumer 720 564 999 2,283 91,701 93,984
Total consumer loans 1,172 764 1,633 3,569 194,520 198,089
Residential mortgage loans 26,122 4,345 50,262 80,729 2,255,804 2,336,533
Total gross loans 30,558 5,109 58,445 94,112 3,520,613 3,614,725
Loans' Credit QualityThe four credit quality classifications set out in the following tables (which exclude purchased credit-impaired loans) are defined below and describe the credit quality of theBank's lending portfolio. These classifications each encompass a range of more granular, internal credit rating grades assigned.
A pass loan shall mean a loan that is expected to be repaid as agreed. A loan is classified as pass where the Bank is not expected to face repayment difficulties because thepresent and projected cash flows are sufficient to repay the debt and the repayment schedule as established by the agreement is being followed.
The Bank of N.T. Butterfield & Son LimitedNotes to the Consolidated Financial Statements (unaudited) (continued)
(In thousands of US dollars, unless otherwise stated)
14

A special mention loan shall mean a loan under close monitoring by the Bank’s management. Loans in this category are currently protected and still performing (current withrespect to interest and principal payments), but are potentially weak and present an undue credit risk exposure, but not to the point of justifying a classification of substandard.
A substandard loan shall mean a loan whose evident unreliability makes repayment doubtful and there is a threat of loss to the Bank unless the unreliability is averted.
A non-accrual loan shall mean either management is of the opinion full payment of principal or interest is in doubt or when principal or interest is 90 days past due and forresidential mortgage loans which are not well secured and in the process of collection.
31 March 2017 PassSpecial
mention Substandard Non-accrual
Total gross recorded
investmentsCommercial loans
Government 104,990 289 7,500 — 112,779Commercial and industrial 305,470 10,156 1,159 2,237 319,022Commercial overdrafts 20,212 2,056 350 65 22,683
Total commercial loans 430,672 12,501 9,009 2,302 454,484
Commercial real estate loansCommercial mortgage 496,558 67,045 1,684 6,288 571,575Construction 36,210 — — — 36,210
Total commercial real estate loans 532,768 67,045 1,684 6,288 607,785
Consumer loansAutomobile financing 18,953 342 25 269 19,589Credit card 75,036 — 172 — 75,208Overdrafts 9,934 59 — 7 10,000Other consumer 84,451 1,545 115 640 86,751
Total consumer loans 188,374 1,946 312 916 191,548
Residential mortgage loans 2,226,926 36,036 58,551 40,615 2,362,128
Total gross recorded loans 3,378,740 117,528 69,556 50,121 3,615,945
31 December 2016 PassSpecial
mention Substandard Non-accrual
Total gross recorded
investmentsCommercial loans
Government 104,611 301 7,500 — 112,412Commercial and industrial 325,924 4,122 1,194 583 331,823Commercial overdrafts 22,976 2,145 238 2 25,361
Total commercial loans 453,511 6,568 8,932 585 469,596
Commercial real estate loansCommercial mortgage 502,918 71,038 1,702 5,964 581,622Construction 28,885 — — — 28,885
Total commercial real estate loans 531,803 71,038 1,702 5,964 610,507
Consumer loansAutomobile financing 19,309 360 28 285 19,982Credit card 78,149 — 392 — 78,541Overdrafts 5,533 32 — 17 5,582Other consumer 91,348 1,564 360 712 93,984
Total consumer loans 194,339 1,956 780 1,014 198,089
Residential mortgage loans 2,200,807 36,739 58,087 40,900 2,336,533
Total gross recorded loans 3,380,460 116,301 69,501 48,463 3,614,725
The Bank of N.T. Butterfield & Son LimitedNotes to the Consolidated Financial Statements (unaudited) (continued)
(In thousands of US dollars, unless otherwise stated)
15

Evaluation of Loans For Impairment 31 March 2017 31 December 2016Individually
evaluatedCollectively
evaluatedIndividually evaluated
Collectively evaluated
Commercial 11,347 443,137 9,686 459,910Commercial real estate 22,024 585,761 21,893 588,614Consumer 1,402 190,146 1,746 196,343Residential mortgage 113,436 2,248,692 113,065 2,223,468Total gross loans 148,209 3,467,736 146,390 3,468,335
Changes in General and Specific Allowances For Credit Losses
Three months ended 31 March 2017
CommercialCommercial real estate Consumer
Residential mortgage Total
Allowances at beginning of period 3,377 16,224 965 23,681 44,247Provision taken (released) 657 (831) 481 (646) (339)Recoveries 1 — 271 154 426Charge-offs — — (691) (509) (1,200)Other 2 7 — 13 22
Allowances at end of period 4,037 15,400 1,026 22,693 43,156Allowances at end of period: individually evaluated for impairment 577 750 278 9,546 11,151Allowances at end of period: collectively evaluated for impairment 3,460 14,650 748 13,147 32,005
Three months ended 31 March 2016
CommercialCommercial real estate Consumer
Residential mortgage Total
Allowances at beginning of period 8,723 6,512 2,763 31,304 49,302Provision taken 256 (498) (735) 635 (342)Recoveries 22 3 389 — 414Charge-offs (15) (988) (354) (1,417) (2,774)Other (10) (73) (26) (20) (129)
Allowances at end of period 8,976 4,956 2,037 30,502 46,471Allowances at end of period: individually evaluated for impairment 590 1,604 274 14,228 16,696Allowances at end of period: collectively evaluated for impairment 8,386 3,352 1,763 16,274 29,775
The Bank of N.T. Butterfield & Son LimitedNotes to the Consolidated Financial Statements (unaudited) (continued)
(In thousands of US dollars, unless otherwise stated)
16

Non-Performing Loans (excluding purchased credit-impaired loans) 31 March 2017 31 December 2016
Non-accrual
Past due more
than 90 daysand accruing
Total non-performing
loans Non-accrual
Past due more
than 90 daysand accruing
Total non-performing
loansCommercial loans
Commercial and industrial 2,237 — 2,237 583 — 583Commercial overdrafts 65 — 65 2 — 2
Total commercial loans 2,302 — 2,302 585 — 585
Commercial real estate loansCommercial mortgage 6,288 — 6,288 5,964 — 5,964
Consumer loansAutomobile financing 269 — 269 285 2 287Credit card — 172 172 — 392 392Overdrafts 7 — 7 17 — 17Other consumer 640 40 680 712 300 1,012
Total consumer loans 916 212 1,128 1,014 694 1,708
Residential mortgage loans 40,615 7,479 48,094 40,900 8,476 49,376
Total non-performing loans 50,121 7,691 57,812 48,463 9,170 57,633
Impaired Loans (excluding purchased credit-impaired loans)A loan is considered to be impaired when, based on current information and events, the Bank determines that it will not be able to collect all amounts due according to theoriginal loan contract, including scheduled interest payments. Impaired loans include all non-accrual loans and all loans modified in a troubled debt restructuring (‘‘TDR’’) even iffull collectability is expected following the restructuring. During the three months ended 31 March 2017, the amount of gross interest income that would have been recorded hadimpaired loans been current was $0.7 million (31 March 2016: $0.6 million).
Impaired loans with an allowance Gross recorded
investment of impaired loans
without an allowance
Total impaired loans
31 March 2017
Gross recorded
investmentSpecific
allowance Net loans
Gross recorded
investmentSpecific
allowance Net loansCommercial loans
Commercial and industrial 577 (577) — 2,691 3,268 (577) 2,691Commercial overdrafts — — — 65 65 — 65
Total commercial loans 577 (577) — 2,756 3,333 (577) 2,756
Commercial real estate loansCommercial mortgage 1,690 (750) 940 6,282 7,972 (750) 7,222
Consumer loansAutomobile financing 150 (75) 75 119 269 (75) 194Overdrafts — — — 7 7 — 7Other consumer 313 (203) 110 327 640 (203) 437
Total consumer loans 463 (278) 185 453 916 (278) 638
Residential mortgage loans 28,596 (9,181) 19,415 55,811 84,407 (9,181) 75,226
Total impaired loans 31,326 (10,786) 20,540 65,302 96,628 (10,786) 85,842Specific allowance excludes $0.4 million recognized relating to purchased credit-impaired loans.
The Bank of N.T. Butterfield & Son LimitedNotes to the Consolidated Financial Statements (unaudited) (continued)
(In thousands of US dollars, unless otherwise stated)
17
Impaired loans with an allowance Gross recorded
investment of impaired loans
without an allowance
Total impaired loans
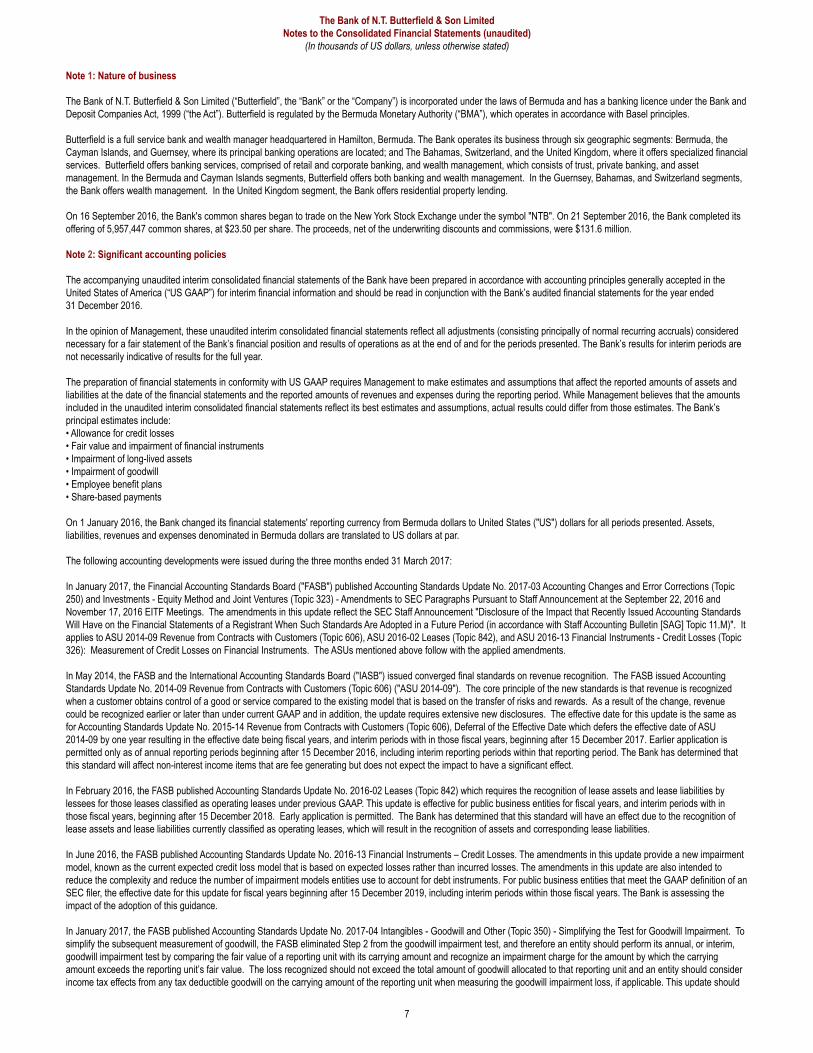
31 December 2016
Gross recorded
investmentSpecific
allowance Net loans
Gross recorded
investmentSpecific
allowance Net loansCommercial loans
Commercial and industrial 579 (577) 2 1,048 1,627 (577) 1,050Commercial overdrafts — — — 2 2 — 2
Total commercial loans 579 (577) 2 1,050 1,629 (577) 1,052
Commercial real estate loansCommercial mortgage 1,722 (750) 972 5,944 7,666 (750) 6,916
Consumer loansAutomobile financing 155 (75) 80 130 285 (75) 210Overdrafts — — — 17 17 — 17Other consumer 253 (203) 50 459 712 (203) 509
Total consumer loans 408 (278) 130 606 1,014 (278) 736
Residential mortgage loans 30,330 (9,961) 20,369 52,043 82,373 (9,961) 72,412
Total impaired loans 33,039 (11,566) 21,473 59,643 92,682 (11,566) 81,116Specific allowance excludes $0.2 million recognized relating to purchased credit-impaired loans.
Average Impaired Loan Balances and Related Recognised Interest Income
31 March 2017 31 December 2016Average gross
recorded investment
Interest income
recognised¹
Average gross recorded
investment
Interest income
recognised¹Commercial loans
Commercial and industrial 2,448 15 1,661 64Commercial overdrafts 34 — 14 —
Total commercial loans 2,482 15 1,675 64
Commercial real estate loansCommercial mortgage 7,819 29 15,496 237
Consumer loansAutomobile financing 277 — 192 —Overdrafts 12 — 14 —Other consumer 676 — 1,043 —
Total consumer loans 965 — 1,249 —
Residential mortgage loans 83,390 754 81,901 2,201
Total impaired loans 94,656 798 100,321 2,502¹ All interest income recognised on impaired loans relate to loans previously modified in a TDR.
Loans Modified in a TDRAs at 31 March 2017, the Bank had nil loans that were modified in a TDR during the preceding 12 months that subsequently defaulted (i.e. 90 days or more past due following amodification). As at 31 December 2016, the Bank had one loan which was formerly a residential mortgage that was modified in a TDR during the preceding 12 months thatsubsequently defaulted with a recorded investment of $0.9 million.
The Bank of N.T. Butterfield & Son LimitedNotes to the Consolidated Financial Statements (unaudited) (continued)
(In thousands of US dollars, unless otherwise stated)
18

TDRs entered into during the period
Three months ended 31 March 2017
Number of contracts
Pre-modification
recorded investment
Modification: interest
capitalisation
Post-modification
recorded investment
Residential mortgage loans 6 3,341 301 3,642Total loans modified in a TDR 6 3,341 301 3,642
Three months ended 31 March 2016
Number of contracts
Pre-modification
recorded investment
Modification: interest
capitalisation
Post-modification
recorded investment
Residential mortgage loans 7 4,843 — 4,843Total loans modified in a TDR 7 4,843 — 4,843
31 March 2017 31 December 2016TDRs outstanding Accrual Non-accrual Accrual Non-accrual
Commercial loans 1,031 — 1,044 —Commercial real estate loans 1,684 1,528 1,702 1,539Residential mortgage loans 43,792 4,995 41,473 5,006
Total TDRs outstanding 46,507 6,523 44,219 6,545
Purchased Credit-Impaired LoansThe Bank acquired certain credit-impaired loans as part of the 7 November 2014 acquisition of substantially all retail loans of HSBC Bank (Cayman) Limited. The accretabledifference (or "accretable yield") represents the excess of a loan's cash flows expected to be collected over the loan's carrying amount.
Three months ended 31 March 2017Contractual
principalNon-accretable
differenceAccretable difference
Carrying amount
Balance at beginning of period 8,016 (1,617) (811) 5,588Advances and increases in cash flows expected to be collected 61 — — 61Reductions resulting from repayments (545) 1 7 (537)Reductions resulting from changes in allowances for credit losses — (193) — (193)Reductions resulting from charge-offs (70) 70 — —Accretion — (6) 6 —
Balance at end of period 7,462 (1,745) (798) 4,919
Year ended 31 December 2016Contractual
principalNon-accretable
differenceAccretable difference
Carrying amount
Balance at beginning of period 8,709 (2,248) (631) 5,830Advances and increases in cash flows expected to be collected 166 408 (396) 178Reductions resulting from repayments (464) — 216 (248)Reductions resulting from changes in allowances for credit losses — (172) — (172)Reductions resulting from charge-offs (395) 395 — —
Balance at end of period 8,016 (1,617) (811) 5,588
The Bank of N.T. Butterfield & Son LimitedNotes to the Consolidated Financial Statements (unaudited) (continued)
(In thousands of US dollars, unless otherwise stated)
19

Note 7: Credit risk concentrations
Concentrations of credit risk in the lending and off-balance sheet credit-related arrangements portfolios arise when a number of customers are engaged in similar businessactivities, are in the same geographic region, or when they have similar economic features that would cause their ability to meet contractual obligations to be similarly affected bychanges in economic conditions. The Bank regularly monitors various segments of its credit risk portfolio to assess potential concentrations of risks and to obtain collateral whendeemed necessary. In the Bank's commercial portfolio, risk concentrations are evaluated primarily by industry and by geographic region of loan origination. In the consumerportfolio, concentrations are evaluated primarily by products. Credit exposures include loans, guarantees and acceptances, letters of credit and commitments for undrawn linesof credit. Unconditionally cancellable credit cards and overdraft lines of credit are excluded from the tables below.
The following tables summarise the credit exposure of the Bank by business sector and by geographic region. The on-balance sheet exposure amounts disclosed are net ofspecific allowances and the off-balance sheet exposure amounts disclosed are gross of collateral held. During 2016, Management revised the method for determining thegeographic location of cash and cash equivalents from the location of the branch to the location of the head office holding custody.
31 March 2017 31 December 2016
Business sector LoansOff-balance
sheetTotal credit
exposure LoansOff-balance
sheetTotal credit exposure
Banks and financial services 310,475 358,817 669,292 321,680 393,148 714,828Commercial and merchandising 264,993 142,634 407,627 266,976 139,264 406,240Governments 113,543 1,112 114,655 112,857 709 113,566Individuals 2,276,416 92,009 2,368,425 2,299,852 108,810 2,408,662Primary industry and manufacturing 48,598 16,933 65,531 34,304 2,095 36,399Real estate 441,844 12,664 454,508 418,946 12,467 431,413Hospitality industry 143,136 4,153 147,289 142,707 4,353 147,060Transport and communication 5,789 — 5,789 5,665 — 5,665
Sub-total 3,604,794 628,322 4,233,116 3,602,987 660,846 4,263,833General allowance (32,005) — (32,005) (32,509) — (32,509)
Total 3,572,789 628,322 4,201,111 3,570,478 660,846 4,231,324
31 March 2017 31 December 2016
Geographic region
Cash due from banks, resell
agreements and short-term
investments LoansOff-balance
sheetTotal credit
exposure
Cash due from banks, resell
agreements and short-term
investments LoansOff-balance
sheetTotal credit exposure
Australia 87,816 — — 87,816 14,242 — — 14,242Barbados — 7,500 — 7,500 — 7,500 — 7,500Belgium 3,516 — — 3,516 1,722 — — 1,722Bermuda 30,759 2,085,112 292,763 2,408,634 23,505 2,105,195 322,554 2,451,254Canada 622,338 — — 622,338 514,861 — — 514,861Cayman 45,357 698,848 221,216 965,421 40,356 706,994 231,211 978,561Guernsey 1 314,349 114,343 428,693 1 337,037 107,081 444,119Japan 22,230 — — 22,230 20,963 — — 20,963New Zealand 668 — — 668 785 — — 785Norway 142,460 — — 142,460 42,477 — — 42,477Saint Lucia — 65,188 — 65,188 — 65,117 — 65,117Sweden 1,217 — — 1,217 1,550 — — 1,550Switzerland 5,978 — — 5,978 5,833 — — 5,833The Bahamas 2,371 23,134 — 25,505 2,822 23,860 — 26,682United Kingdom 1,062,130 410,663 — 1,472,793 1,224,263 357,284 — 1,581,547United States 445,163 — — 445,163 876,642 — 876,642Other 137 — — 137 197 — — 197
Sub-total 2,472,141 3,604,794 628,322 6,705,257 2,770,219 3,602,987 660,846 7,034,052General allowance — (32,005) — (32,005) — (32,509) — (32,509)
Total 2,472,141 3,572,789 628,322 6,673,252 2,770,219 3,570,478 660,846 7,001,543
The Bank of N.T. Butterfield & Son LimitedNotes to the Consolidated Financial Statements (unaudited) (continued)
(In thousands of US dollars, unless otherwise stated)
20

Note 8: Customer deposits and deposits from banks
By MaturityDemand Term
31 March 2017Non-interest
bearingInterest bearing
Total demand
depositsWithin 3 months
3 to 6 months
6 to 12 months
After 12months
Total term
depositsTotal
deposits
CustomersBermuda
Demand or less than $100k¹ 1,649,708 3,152,550 4,802,258 10,176 4,817 12,041 15,371 42,405 4,844,663 Term - $100k or more N/A N/A — 530,703 34,110 69,203 42,881 676,897 676,897
Total Bermuda 1,649,708 3,152,550 4,802,258 540,879 38,927 81,244 58,252 719,302 5,521,560
Non-Bermuda Demand or less than $100k 613,594 2,793,373 3,406,967 21,407 3,270 4,799 556 30,032 3,436,999 Term and $100k or more N/A N/A — 729,255 113,584 30,354 7,663 880,856 880,856
Total non-Bermuda 613,594 2,793,373 3,406,967 750,662 116,854 35,153 8,219 910,888 4,317,855
Total customer deposits 2,263,302 5,945,923 8,209,225 1,291,541 155,781 116,397 66,471 1,630,190 9,839,415
BanksBermuda
Demand or less than $100k 142 — 142 — — — — — 142
Non-Bermuda Demand or less than $100k — 5,854 5,854 — — — — — 5,854 Term and $100k or more N/A N/A — 4,016 — — — 4,016 4,016
Total non-Bermuda — 5,854 5,854 4,016 — — — 4,016 9,870
Total bank deposits 142 5,854 5,996 4,016 — — — 4,016 10,012
Total deposits 2,263,444 5,951,777 8,215,221 1,295,557 155,781 116,397 66,471 1,634,206 9,849,427
Demand Term
31 December 2016Non-interest
bearingInterest bearing
Total demand deposits
Within 3 months
3 to 6 months
6 to 12 months
After 12months
Total term
depositsTotal
deposits
CustomersBermuda
Demand or less than $100k¹ 1,733,684 3,013,401 4,747,085 14,091 4,309 9,068 16,380 43,848 4,790,933 Term - $100k or more N/A N/A — 1,013,159 37,550 60,952 44,507 1,156,168 1,156,168
Total Bermuda 1,733,684 3,013,401 4,747,085 1,027,250 41,859 70,020 60,887 1,200,016 5,947,101
Non-Bermuda Demand or less than $100k 651,329 2,794,799 3,446,128 20,295 4,108 4,145 783 29,331 3,475,459 Term and $100k or more N/A N/A — 440,674 119,519 17,590 9,510 587,293 587,293
Total non-Bermuda 651,329 2,794,799 3,446,128 460,969 123,627 21,735 10,293 616,624 4,062,752
Total customer deposits 2,385,013 5,808,200 8,193,213 1,488,219 165,486 91,755 71,180 1,816,640 10,009,853
BanksBermuda
Demand or less than $100k 340 — 340 4 — — — 4 344
Non-Bermuda Demand or less than $100k — 19,751 19,751 — — — — — 19,751 Term and $100k or more N/A N/A — 3,601 100 — — 3,701 3,701
Total non-Bermuda — 19,751 19,751 3,601 100 — — 3,701 23,452
Total bank deposits 340 19,751 20,091 3,605 100 — — 3,705 23,796
Total deposits 2,385,353 5,827,951 8,213,304 1,491,824 165,586 91,755 71,180 1,820,345 10,033,649¹ As at 31 March 2017, $75 million (31 December 2016: $150 million) of the Demand deposits - Interest bearing bear a special negligible interest rate. The weighted-averageinterest rate on interest-bearing demand deposits as at 31 March 2017 is 0.07% (31 December 2016: 0.06%).
The Bank of N.T. Butterfield & Son LimitedNotes to the Consolidated Financial Statements (unaudited) (continued)
(In thousands of US dollars, unless otherwise stated)
21

By Type and Segment 31 March 2017 31 December 2016Payable
on demandPayable on a
fixed date TotalPayable
on demandPayable on a
fixed date TotalBermuda
Customers 4,802,259 719,302 5,521,561 4,747,086 1,200,016 5,947,102Banks 142 — 142 341 4 345
CaymanCustomers 2,471,493 467,623 2,939,116 2,606,305 417,750 3,024,055Banks 5,854 4,016 9,870 19,615 3,701 23,316
GuernseyCustomers 891,504 418,856 1,310,360 781,119 185,457 966,576
The BahamasCustomers 43,969 24,409 68,378 58,703 13,417 72,120
United KingdomBanks — — — 135 — 135
Total Customers 8,209,225 1,630,190 9,839,415 8,193,213 1,816,640 10,009,853Total Banks 5,996 4,016 10,012 20,091 3,705 23,796Total deposits 8,215,221 1,634,206 9,849,427 8,213,304 1,820,345 10,033,649
The Bank of N.T. Butterfield & Son LimitedNotes to the Consolidated Financial Statements (unaudited) (continued)
(In thousands of US dollars, unless otherwise stated)
22
Note 9: Employee benefit plans
The Bank maintains trusteed pension plans including non-contributory defined benefit plans and a number of defined contribution plans, and provides post-retirement medicalbenefits to its qualifying retirees. The expense related to these plans is included in the consolidated statements of operations under Salaries and other employee benefits. Thedefined benefit provisions under the pension plans are generally based upon years of service and average salary during the relevant years of employment. The defined benefitand post-retirement medical plans are not open to new participants and are non-contributory and the funding required is provided by the Bank, based upon the advice ofindependent actuaries. The defined benefit pension plans are in the Bermuda, Guernsey and United Kingdom jurisdictions and the defined benefit post-retirement medical planis in Bermuda.
The Bank includes an estimate of the 2017 Bank contribution and estimated benefit payments for the next ten years under the pension and post-retirement plans in its financialstatements for the year-ended 31 December 2016. During the three months ended 31 March 2017, there have been no material revisions to these estimates.
Three months ended31 March 2017 31 March 2016
Defined benefit pension expense (income)Interest cost 1,318 1,493Expected return on plan assets (2,015) (2,302)Amortisation of net actuarial loss 568 426
Total defined benefit pension expense (income) (129) (383)
Post-retirement medical benefit expense (income) Service cost 16 30Interest cost 1,176 1,198Amortisation of net actuarial losses 879 683Amortisation of prior service credit (190) (1,586)
Total post-retirement medical benefit expense (income) 1,881 325

Note 10: Credit related arrangements, repurchase agreements and commitments
Credit-Related ArrangementsStandby letters of credit and letters of guarantee are issued at the request of a Bank customer in order to secure the customer’s payment or performance obligations to a thirdparty. These guarantees represent an irrevocable obligation of the Bank to pay the third party beneficiary upon presentation of the guarantee and satisfaction of the documentaryrequirements stipulated therein, without investigation as to the validity of the beneficiary’s claim against the customer. Generally, the term of the standby letters of credit does notexceed one year, whilst the term of the letters of guarantee does not exceed four years. The types and amounts of collateral security held by the Bank for these standby lettersof credit and letters of guarantee is generally represented by deposits with the Bank or a charge over assets held in mutual funds.
The Bank considers the fees collected in connection with the issuance of standby letters of credit and letters of guarantee to be representative of the fair value of its obligationundertaken in issuing the guarantee. In accordance with applicable accounting standards related to guarantees, the Bank defers fees collected in connection with the issuanceof standby letters of credit and letters of guarantee. The fees are then recognised in income proportionately over the life of the credit agreements. The following table presentsthe outstanding financial guarantees. Collateral is shown at estimated market value less selling cost. Where the collateral is cash, it is shown gross including accrued income.
31 March 2017 31 December 2016Outstanding financial guarantees Gross Collateral Net Gross Collateral Net
Standby letters of credit 221,780 213,213 8,567 242,437 242,437 —Letters of guarantee 4,340 4,254 86 4,772 4,772 —
Total 226,120 217,467 8,653 247,209 247,209 —
CommitmentsThe Bank enters into contractual commitments to extend credit, normally with fixed expiration dates or termination clauses, at specified rates and for specific purposes.Substantially all of the Bank's commitments to extend credit are contingent upon customers maintaining specific credit standards at the time of loan funding. Managementassesses the credit risk associated with certain commitments to extend credit in determining the level of the allowance for possible loan losses.
The Bank has a facility by one of its custodians, whereby the Bank may offer up to US$200 million of standby letters of credit to its customers on a fully secured basis. Under thestandard terms of the facility, the custodian has the right to set-off against securities held of 110% of the utilised facility. At 31 March 2017, $109.7 million (31 December 2016:$110.3 million) of standby letters of credit were issued under this facility.
Outstanding unfunded commitments to extend credit 31 March 2017 31 December 2016Commitments to extend credit 400,526 412,568Documentary and commercial letters of credit 1,676 1,069
Total unfunded commitments to extend credit 402,202 413,637
Repurchase agreementsThe Bank utilizes repurchase agreements and resell agreements (reverse repurchase agreements) to manage liquidity. The risks of these transactions include changes in thefair value in the securities posted or received as collateral and other credit related events. The Bank manages these risks by ensuring that the collaterals involved areappropriate and by monitoring the value of the securities posted or received as collateral on a daily basis.
As at 31 March 2017, the Bank had three open positions (31 December 2016: eight) in resell agreements with a remaining maturity of less than 30 days involving pools ofmortgages issued by US federal agencies. The amortised cost of these resell agreements is $62.7 million (31 December 2016: $148.8 million) and are included in securitiespurchased under agreement to resell on the consolidated balance sheets. As at 31 March 2017, there were no positions which were offset on the balance sheet to arrive at thecarrying value, and there was no collateral amount which was available to offset against the future settlement amount.
Legal ProceedingsThere are actions and legal proceedings pending against the Bank and its subsidiaries which arose in the normal course of its business. Management, after reviewing all actionsand proceedings pending against or involving the Bank and its subsidiaries, considers that the resolution of these matters would in the aggregate not be material to theconsolidated financial position of the Bank, except as noted in the following paragraphs.
As publicly announced, in November 2013, the US Attorney’s Office for the Southern District of New York applied for and secured the issuance of so-called John DoeSummonses to six US financial institutions with which the Bank had correspondent bank relationships. The Bank has been fully cooperating with the US authorities in theirongoing investigation. Specifically, the Bank has conducted an extensive review and account remediation exercise to determine the US tax compliance status of US personaccount holders. The review process and results have been shared with the US authorities.
Management believes that as of 31 March 2017, a provision of $5.5 million (31 December 2016: $5.5 million), which has been recorded, is appropriate. As the investigationremains ongoing at this time, the timing and terms of the final resolution, including any fines or penalties, remain uncertain and the financial impact to the Bank could exceed theamount of the provision. In this regard, we note that the US authorities have not approved or commented on the adequacy or reasonableness of the estimate. The provision isincluded on the consolidated balance sheets under other liabilities and on the consolidated statements of operations under other expenses.
The Bank of N.T. Butterfield & Son LimitedNotes to the Consolidated Financial Statements (unaudited) (continued)
(In thousands of US dollars, unless otherwise stated)
23

Note 11: Exit cost obligations
During December 2015, the Bank agreed to commence an orderly wind down of the deposit taking and investment management businesses in the United Kingdom segment asreflected in management segment reporting described in Note 12: Segmented Information. In making this determination, the Bank considered the increasing regulatory pressurealong with periods of negative profitability and made the determination that an orderly wind down of the deposit taking and investment management businesses in the UnitedKingdom was prudent for Butterfield as a group. The orderly wind down was largely completed by the end of 2016 with the change in business operations to mortgage lendingservices and the change in name from Butterfield Bank (UK) Limited to Butterfield Mortgages Limited. The amounts expensed shown in the following table are all included in theconsolidated statements of operations as restructuring costs under non-interest expenses.
Related to this orderly wind down, it was determined that the core banking system utilized in the operations of the United Kingdom segment was impaired (included in premises,equipment and computer software on the consolidated balance sheets). This determination was based upon the realisable value of this software upon completion of the orderlywind down. A total of $5.1 million was expensed in the fourth quarter of the year ended 31 December 2015 and was included in impairment of fixed assets on the consolidatedstatements of operations of the relevant period.
Expense recognised by period Amounts paid by period Exit cost liability
Three monthsended
31 March 2017Year ended
31 December 2016Year ended
31 December 2015
Costs to berecognised in
the future
Total exit costsexpected to be
incurred
Three monthsended
31 March 2017Year ended
31 December 2016As at
31 March 2017As at
31 December 2016
Staff redundancy expenses — 2,810 634 118 3,562 115 3,329 — 115Professional services 225 2,284 1,549 40 4,098 295 3,763 — 70Lease termination expenses 101 — — 1,916 2,017 101 — — —Other expenses 115 1,172 — 627 1,914 115 1,172 — —Total 441 6,266 2,183 2,701 11,591 626 8,264 — 185
The Bank of N.T. Butterfield & Son LimitedNotes to the Consolidated Financial Statements (unaudited) (continued)
(In thousands of US dollars, unless otherwise stated)
24
Note 12: Segmented information
The Bank is managed by its CEO on a geographic basis. The Bank's six geographic segments are Bermuda, Cayman, Guernsey, Switzerland, The Bahamas and the UnitedKingdom. The geographic segments are determined based on the country's balance sheet size and by regulatory reporting requirements in the respective jurisdiction. Eachregion has a managing director who reports directly to the CEO. The Group CEO and the region managing director have final authority over resource allocation decisions andperformance assessment.
The geographic segments reflect this management structure and the manner in which financial information is currently evaluated by the CEO. Segment results are determinedbased upon the Bank's management reporting system, which assigns balance sheet and income statement items to each of the geographic segments. The process is designedaround the Bank's organizational and management structure and, accordingly, the results derived are not necessarily comparable with similar information published by otherfinancial institutions. A description of each reportable segment and table of financial results is presented below.
Accounting policies of the reportable segments are the same as those described in Note 2 of the Bank's audited financial statements for the year ended 31 December 2016.Transactions between segments are accounted for on an accrual basis and are all eliminated upon consolidation. The Bank generally does not allocate assets, revenues andexpenses among its business segments, with the exception of certain corporate overhead expenses and loan participation revenue and expense. Loan participation revenue andexpenses are allocated pro-rata based upon the percentage of the total loan funded by each jurisdiction participating in the loan.
Bermuda provides a full range of retail, commercial and private banking services. Retail services are offered to individuals and small to medium-sized businesses through fivebranch locations and through Internet banking, mobile banking, automated teller machines (“ATMs”) and debit cards. Retail services include deposit services, consumer andmortgage lending, credit cards and personal insurance products. Commercial banking includes commercial lending and mortgages, cash management, payroll services, remotebanking and letters of credit. Treasury services include money market and foreign exchange activities. Bermuda’s wealth management offering consists of Butterfield AssetManagement Limited, which provides investment management, advisory and brokerage services and Butterfield Trust (Bermuda) Limited, which provides trust, estate, companymanagement and custody services. Bermuda is also the location of Bank's head offices and accordingly, retains the unallocated corporate overhead expenses.
The Cayman segment provides a comprehensive range of retail, commercial and private banking services. Retail services are offered to individuals and small to medium-sizedbusinesses through three branch locations and through Internet banking, mobile banking, ATMs and debit cards. Retail services include deposit services, consumer andmortgage lending, credit cards and property/auto insurance. Commercial banking includes commercial lending and mortgages, cash management, payroll services, remotebanking and letters of credit. Treasury services include money market and foreign exchange activities. Cayman’s wealth management offering comprises investmentmanagement, advisory and brokerage services and Butterfield Trust (Cayman) Limited, which provides trust, estate and company management.
The Guernsey segment provides a broad range of services to private clients and financial institutions including private banking and treasury services, Internet banking,administered bank services, wealth management and fiduciary services.
The Switzerland segment provides fiduciary services. The Bahamas segment provides fiduciary and ancillary services.
The United Kingdom segment previously provided a broad range of services including private banking and treasury services, Internet banking and wealth management andfiduciary services to high net worth individuals and privately owned businesses. As described in Note 11, during the year-ended 31 December 2015, the Bank commenced anorderly wind down of the deposit taking and investment management businesses in the United Kingdom segment. The United Kingdom segment now provides mortgageservices for high value residential properties.

Total Assets by Segment 31 March 2017 31 December 2016Bermuda 6,220,982 6,765,125Cayman 3,225,477 3,393,256Guernsey 1,511,435 1,132,663Switzerland 2,304 2,173The Bahamas 79,116 81,604United Kingdom 42,575 151,866
Total assets before inter-segment eliminations 11,081,889 11,526,687Less: inter-segment eliminations (138,329) (423,142)
Total 10,943,560 11,103,545
Net interest incomeProvision for credit losses
Non-interest income
Revenue before gains
and lossesGains and
lossesTotal netrevenue
Totalexpenses Net income
Three months ended31 March 2017 Customer
Inter-segment
Bermuda 42,265 251 546 19,575 62,637 314 62,951 43,940 19,011Cayman 21,060 (11) (311) 11,554 32,292 (7) 32,285 15,328 16,957Guernsey 4,414 (211) 104 5,653 9,960 (65) 9,895 9,113 782Switzerland — — — 955 955 — 955 773 182The Bahamas 15 11 — 1,021 1,047 — 1,047 1,122 (75)United Kingdom 179 (40) — 581 720 (19) 701 1,701 (1,000)
Total beforeeliminations 67,933 — 339 39,339 107,611 223 107,834 71,977 35,857
Inter-segmenteliminations — — — (801) (801) — (801) (801) —
Total 67,933 — 339 38,538 106,810 223 107,033 71,176 35,857
Net interest incomeProvision for
credit lossesNon-interest
income
Revenue before gains
and lossesGains and
lossesTotal netrevenue
Totalexpenses Net income
Three months ended31 March 2016 Customer
Inter-segment
Bermuda 38,416 389 (390) 14,226 52,641 (165) 52,476 35,568 16,908Cayman 18,644 142 (199) 10,677 29,264 (815) 28,449 15,162 13,287Guernsey 3,781 (67) (26) 6,491 10,179 (490) 9,689 9,137 552Switzerland — — — 904 904 — 904 810 94The Bahamas 10 10 — 1,274 1,294 — 1,294 1,381 (87)United Kingdom 1,486 (474) 957 1,528 3,497 1,231 4,728 8,721 (3,993)
Total beforeeliminations 62,337 — 342 35,100 97,779 (239) 97,540 70,779 26,761
Inter-segmenteliminations — — — (582) (582) — (582) (582) —
Total 62,337 — 342 34,518 97,197 (239) 96,958 70,197 26,761
The Bank of N.T. Butterfield & Son LimitedNotes to the Consolidated Financial Statements (unaudited) (continued)
(In thousands of US dollars, unless otherwise stated)
25
Note 13: Derivative instruments and risk management
The Bank uses derivatives for risk management purposes and to meet the needs of its customers. The Bank’s derivative contracts principally involve over-the-counter (“OTC”)transactions that are privately negotiated between the Bank and the counterparty to the contract and include interest rate contracts and foreign exchange contracts.
The Bank may pursue opportunities to reduce its exposure to credit losses on derivatives by entering into International Swaps and Derivatives Association master agreements(“ISDAs”). Depending on the nature of the derivative transaction, bilateral collateral arrangements may be used as well. When the Bank is engaged in more than one outstandingderivative transaction with the same counterparty, and also has a legally enforceable master netting agreement with that counterparty, the net marked to market exposurerepresents the netting of the positive and negative exposures with that counterparty. When there is a net negative exposure, the Bank regards its credit exposure to thecounterparty as being zero. The net marked to market position with a particular counterparty represents a reasonable measure of credit risk when there is a legally enforceablemaster netting agreement between the Bank and that counterparty.
Certain of these agreements contain credit risk-related contingent features in which the counterparty has the option to accelerate cash settlement of the Bank's net derivativeliabilities with the counterparty in the event the Bank's credit rating falls below specified levels or the liabilities reach certain levels.
All derivative financial instruments, whether designated as hedges or not, are recorded on the consolidated balance sheets at fair value within other assets or other liabilities.These amounts include the effect of netting. The accounting for changes in the fair value of a derivative in the consolidated statements of operations depends on whether thecontract has been designated as a hedge and qualifies for hedge accounting.
Notional AmountsThe notional amounts are not recorded as assets or liabilities on the consolidated balance sheets as they represent the face amount of the contract to which a rate or price isapplied to determine the amount of cash flows to be exchanged. Notional amounts represent the volume of outstanding transactions and do not represent the potential gain orloss associated with market risk or credit risk of such instruments. Credit risk is limited to the positive fair value of the derivative instrument, which is significantly less than thenotional amount.
Fair ValueDerivative instruments, in the absence of any compensating up-front cash payments, generally have no market value at inception. They obtain value, positive or negative, asrelevant interest rates, exchange rates, equity or commodity prices or indices change. The potential for derivatives to increase or decrease in value as a result of the foregoingfactors is generally referred to as market risk. Market risk is managed within clearly defined parameters as prescribed by senior management of the Bank. The fair value isdefined as the profit or loss associated with replacing the derivative contracts at prevailing market prices.
Risk Management DerivativesThe Bank enters into interest derivative contracts as part of its overall interest rate risk management strategy to minimise significant unplanned fluctuations in earnings that arecaused by interest rate volatility. The Bank’s goal is to manage interest rate sensitivity by modifying the repricing or maturity characteristics of certain consolidated balance sheetassets and liabilities so that movements in interest rates do not adversely affect the net interest margin. Derivative instruments that are used as part of the Bank’s riskmanagement strategy include interest rate swap contracts that have indices related to the pricing of specific consolidated balance sheet assets and liabilities. Interest rate swapsgenerally involve the exchange of fixed and variable-rate interest payments between two parties, based on a common notional principal amount and maturity date. The Bankuses foreign currency derivative instruments to hedge its exposure to foreign currency risk. Certain hedging relationships are formally designated and qualify for hedgeaccounting as fair value or net investment hedges. Risk management derivatives comprise fair value hedges, net investments hedges and derivatives not formally designated ashedges as described below.
Fair value hedges consist of designated interest rate swaps and are used to minimise the Bank's exposure to changes in the fair value of assets and liabilities due tomovements in interest rates. The Bank previously entered into interest rate swaps to convert its fixed-rate long-term loans to floating-rate loans, and convert fixed-rate depositsto floating-rate deposits. During the year ended 31 December 2011, the Bank cancelled its interest rate swaps designated as fair value hedges of loans receivable and thereforediscontinued hedge accounting for these financial instruments. The fair value attributable to the hedged loans are accounted for prospectively and are being amortised to netincome over the remaining life of each individual loan, which could extend to year 2029, using the effective interest method.
Net investment hedges includes designated currency swaps and qualifying non-derivative instruments and are used to minimise the Bank’s exposure to variability in the foreigncurrency translation of net investments in foreign operations. The effective portion of changes in the fair value of the hedging instrument is recognised in AOCL consistent withthe related translation gains and losses of the hedged net investment. For net investment hedges, all critical terms of the hedged item and the hedging instrument are matchedat inception and on an ongoing basis to minimise the risk of hedge ineffectiveness.
For derivatives designated as net investment hedges, the Bank follows the method based on changes in spot exchange rates. Accordingly: - The change in the fair value of the derivative instrument that is reported in AOCL (i.e. the effective portion) is determined by the changes in spot exchange rates. - The change in the fair value of the derivative instrument attributable to changes in the difference between the forward rate and spot rate are excluded from the measure of the hedge ineffectiveness and that difference is reported directly in the consolidated statements of operations under foreign exchange revenue.Amounts recorded in AOCL are reclassified to earnings only upon the sale or substantial liquidation of an investment in a foreign subsidiary.
For foreign-currency-denominated debt instruments that are designated as hedges of net investments in foreign operations, the translation gain or loss that is recorded in AOCLis based on the spot exchange rate between the reporting currency of the Bank and the functional currency of the respective subsidiary. See Note 19 for details on the amountrecognised into AOCL during the current period from translation gain or loss.
Derivatives not formally designated as hedges are entered into to manage the interest rate risk of fixed rate deposits and foreign exchange risk of the Bank's exposure.Changes in the fair value of derivative instruments not formally designated as hedges are recognised in foreign exchange income.
Client service derivativesThe Bank enters into foreign exchange contracts and interest rate caps primarily to meet the foreign exchange needs of its customers. Foreign exchange contracts areagreements to exchange specific amounts of currencies at a future date at a specified rate of exchange. Changes in the fair value of client services derivative instruments arerecognised in foreign exchange income.
The Bank of N.T. Butterfield & Son LimitedNotes to the Consolidated Financial Statements (unaudited) (continued)
(In thousands of US dollars, unless otherwise stated)
26

The following table shows the aggregate notional amounts of derivative contracts outstanding listed by type and respective gross positive or negative fair values and classifiedby those used for risk management (sub-classified as hedging and those that do not qualify for hedge accounting), client services and credit derivatives. Fair value of derivativesis recorded in the consolidated balance sheets in other assets and other liabilities. Gross positive fair values are recorded in other assets and gross negative fair values arerecorded in other liabilities, subject to netting when master netting agreements are in place.
31 March 2017 Derivative instrumentNumber ofcontracts
Notional amounts
Gross positive
fair value
Gross negativefair value
Net fair value
Risk management derivativesNet investment hedges Currency swaps 1 77,670 14,803 — 14,803Derivatives not formally designated as hedging instruments Currency swaps 9 486,660 1,007 (5,733) (4,726)
Subtotal risk management derivatives 564,330 15,810 (5,733) 10,077
Client services derivativesSpot and forward foreignexchange 144 2,802,550 11,007 (10,822) 185
Total derivative instruments 3,366,880 26,817 (16,555) 10,262
31 December 2016 Derivative instrumentNumber of
contractsNotional amounts
Gross positive
fair value
Gross negativefair value
Net fair value
Risk management derivativesNet investment hedges Currency swaps 1 77,670 15,744 — 15,744Derivatives not formally designated as hedging instruments Currency swaps 11 676,856 5,901 (3,013) 2,888
Subtotal risk management derivatives 754,526 21,645 (3,013) 18,632
Client services derivativesSpot and forward foreignexchange 106 2,039,141 15,410 (15,267) 143
Total derivative instruments 2,793,667 37,055 (18,280) 18,775
In addition to the above, as at 31 March 2017 foreign denominated deposits of £34.5 million (31 December 2016: £34.5 million), were designated as a hedge of foreignexchange risk associated with the net investment in foreign operations.
We manage derivative exposure by monitoring the credit risk associated with each counterparty using counterparty specific credit risk limits, using master netting arrangementswhere appropriate and obtaining collateral. The Bank elected to offset in the consolidated balance sheets certain gross derivative assets and liabilities subject to nettingagreements.
The Bank also elected not to offset certain derivative assets or liabilities and all collaterals received or paid that the Bank or the counterparties could legally offset in the event ofdefault. In the tables below, these positions are deducted from the net fair value presented in the consolidated balance sheets in order to present the net exposures. Thecollateral values presented in the following table are limited to the related net derivative asset or liability balance and, accordingly, do not include excess collateral received orpaid.
The Bank of N.T. Butterfield & Son LimitedNotes to the Consolidated Financial Statements (unaudited) (continued)
(In thousands of US dollars, unless otherwise stated)
27

Gross fair value
recognised
Less: offset applied
under master netting
agreements
Net fair valuepresented in the
consolidated balance sheets
Less: positions not offset in theconsolidated balance sheets
31 March 2017Gross fair value
of derivativesCash collateral received / paid Net exposures
Derivative assetsSpot and forward foreign exchange and currency swaps 26,817 (11,580) 15,237 — (3,485) 11,752
Derivative liabilitiesSpot and forward foreign exchange and currency swaps 16,555 (11,580) 4,975 — — 4,975
Net positive fair value 10,262
Gross fair value
recognised
Less: offset applied
under master netting
agreements
Net fair valuepresented in the
consolidated balance sheets
Less: positions not offset in theconsolidated balance sheets
31 December 2016Gross fair value
of derivativesCash collateral received / paid Net exposures
Derivative assetsSpot and forward foreign exchange and currency swaps 37,055 (6,959) 30,096 (6,811) (8,292) 14,993
Derivative liabilitiesSpot and forward foreign exchange and currency swaps 18,280 (6,959) 11,321 (6,811) — 4,510
Net positive fair value 18,775
The following tables shows the location and amount of gains (losses) recorded in either the consolidated statements of operations or consolidated statements of comprehensiveincome on derivative instruments outstanding. During 2016, Management revised the following disclosures to segregate the gains and losses attributable to the specific types ofderivatives.
Three months endedDerivative instrument Consolidated statements of operations line item 31 March 2017 31 March 2016
Spot and forward foreign exchange Foreign exchange revenue 43 79Currency swaps, not designated as hedge Foreign exchange revenue (7,615) (1,044)Currency swaps - Net investment hedge Foreign exchange revenue 424 (499)
Total net gains (losses) recognised in net income (7,148) (1,464)
Derivative instrument Consolidated statements of comprehensive income line item 31 March 2017 31 March 2016
Currency swaps - Net investment hedgeNet change in unrealised gains and (losses) on translation of net investment in foreignoperations (1,365) 1,882
Total net gains (losses) recognised in comprehensive income (1,365) 1,882
The Bank of N.T. Butterfield & Son LimitedNotes to the Consolidated Financial Statements (unaudited) (continued)
(In thousands of US dollars, unless otherwise stated)
28

Note 14: Fair value measurements
The following table presents the financial assets and liabilities that are measured at fair value on a recurring basis. Management classifies these items based on the type ofinputs used in their respective fair value determination as described in Note 2 of the Bank's audited financial statements for the year ended 31 December 2016.
Management reviews the price of each security monthly, comparing market values to expectations and to the prior month’s price. Management's expectations are based uponknowledge of prevailing market conditions and developments relating to specific issuers and/or asset classes held in the investment portfolio. Where there are unusual orsignificant price movements, or where a certain asset class has performed out-of-line with expectations, the matter is reviewed by the Group Asset and Liability Committee.
Financial instruments in Level 1 include actively traded redeemable mutual funds.
Financial instruments in Level 2 include corporate bonds, mortgage-backed securities and other asset-backed securities, forward foreign exchange contracts and mutual fundsnot actively traded.
Financial instruments in Level 3 include asset-backed securities for which the market is relatively illiquid and for which information about actual trading prices is not readilyavailable.
There were no transfers between Level 1 and Level 2 or Level 2 and Level 3 during the three months ended 31 March 2017 and the year ended 31 December 2016.
31 March 2017 31 December 2016Fair value Total
carryingamount / fair value
Fair value Totalcarrying
amount / fair valueLevel 1 Level 2 Level 3 Level 1 Level 2 Level 3
Items that are recognised at fair value on a recurring basis:Financial assets
Trading investmentsMutual funds 6,262 208 — 6,470 6,091 222 — 6,313
Total trading 6,262 208 — 6,470 6,091 222 — 6,313
Available-for-sale investmentsUS government and federal agencies — 2,396,537 — 2,396,537 — 2,430,402 — 2,430,402Non-US governments debt securities — 27,686 — 27,686 — 27,020 — 27,020Corporate debt securities — 512,053 — 512,053 — 514,475 — 514,475Asset-backed securities - Student loans — — 12,493 12,493 — — 12,493 12,493Commercial mortgage-backed securities — 150,343 — 150,343 — 150,546 — 150,546Residential mortgage-backed securities — 207,099 — 207,099 — 197,802 — 197,802
Total available-for-sale — 3,293,718 12,493 3,306,211 — 3,320,245 12,493 3,332,738
Other assets - Derivatives — 15,237 — 15,237 — 30,096 — 30,096
Financial liabilitiesOther liabilities - Derivatives — 4,975 — 4,975 — 11,321 — 11,321
Level 3 ReconciliationThe Level 3 Asset-backed securities - Student loans is a federal family education loan programme guaranteed student loan security and is valued using a non-binding brokerquote. The fair value provided by the broker is based on the last trading price of similar securities but as the market for the security is illiquid, a Level 2 classification is notsupported.
Significant increases (decreases) in any of the preceding inputs in isolation could result in a significantly different fair value measurement. Generally a change in assumptionused for the probability of defaults is accompanied by a directionally similar change in the assumption used for the loss severity.
Three months ended31 March 2017
Year ended31 December 2016
Available- for-sale investments
Available- for-sale investments
Carrying amount at beginning of period 12,493 12,161Realised and unrealised gains (losses) recognised in other comprehensive income — 332
Carrying amount at end of period 12,493 12,493
The Bank of N.T. Butterfield & Son LimitedNotes to the Consolidated Financial Statements (unaudited) (continued)
(In thousands of US dollars, unless otherwise stated)
29

Items Other Than Those Recognised at Fair Value on a Recurring Basis:31 March 2017 31 December 2016
LevelCarryingamount
Fair value
Appreciation /(depreciation)
Carryingamount
Fair value
Appreciation /(depreciation)
Financial assetsCash due from banks Level 1 1,867,309 1,867,309 — 2,101,651 2,101,651 —Securities purchased under agreement to resell Level 2 62,669 62,669 — 148,813 148,813 —Short-term investments Level 1 542,163 542,163 — 519,755 519,755 —Investments held-to-maturity Level 2 1,235,965 1,222,784 (13,181) 1,061,103 1,046,828 (14,275)Loans, net of allowance for credit losses Level 2 3,572,789 3,567,118 (5,671) 3,570,478 3,566,812 (3,666)Other real estate owned¹ Level 2 14,088 14,088 — 14,199 14,199 —
Financial liabilitiesCustomer deposits
Demand deposits Level 2 8,209,225 8,209,225 — 8,193,213 8,193,213 —Term deposits Level 2 1,630,190 1,631,098 (908) 1,816,640 1,817,564 (924)
Deposits from banks Level 2 10,012 10,012 — 23,796 23,796 —Long-term debt Level 2 117,000 118,318 (1,318) 117,000 117,683 (683)
¹ The current carrying value of OREO is adjusted to fair value only when there is devaluation below carrying value.
The Bank of N.T. Butterfield & Son LimitedNotes to the Consolidated Financial Statements (unaudited) (continued)
(In thousands of US dollars, unless otherwise stated)
30

Note 15: Interest rate risk
The following tables set out the assets, liabilities and shareholders' equity and off-balance sheet instruments on the date of the earlier of contractual maturity, expected maturityor repricing date. Use of these tables to derive information about the Bank’s interest rate risk position is limited by the fact that customers may choose to terminate their financialinstruments at a date earlier than the contractual maturity or repricing date. Examples of this include fixed-rate mortgages, which are shown at contractual maturity but whichmay pre-pay earlier, and certain term deposits, which are shown at contractual maturity but which may be withdrawn before their contractual maturity subject to prepaymentpenalties. Investments are shown based on remaining contractual maturities. The remaining contractual principal maturities for mortgage-backed securities (primarily USgovernment agencies) do not consider prepayments. Remaining expected maturities will differ from contractual maturities because borrowers may have the right to prepayobligations before the underlying mortgages mature.
31 March 2017 Earlier of contractual maturity or repricing date
(in $ millions)Within 3 months
3 to 6 months
6 to 12 months
1 to 5 years
After 5 years
Non-interest bearing
funds TotalAssets
Cash due from banks 1,782 — — — — 85 1,867Securities purchased under agreement to resell 63 — — — — — 63Short-term investments 450 92 — — — — 542Investments 1,285 15 128 607 2,508 6 4,549Loans 3,339 88 28 75 39 4 3,573Other assets — — — — — 350 350
Total assets 6,919 195 156 682 2,547 445 10,944
Liabilities and shareholders' equityShareholders’ equity — — — — — 741 741Demand deposits 5,951 — — — — 2,264 8,215Term deposits 1,296 156 116 66 — — 1,634Other liabilities — — — — — 237 237Long-term debt 92 — — 25 — — 117
Total liabilities and shareholders' equity 7,339 156 116 91 — 3,242 10,944
Interest rate sensitivity gap (420) 39 40 591 2,547 (2,797) —Cumulative interest rate sensitivity gap (420) (381) (341) 250 2,797 — —
31 December 2016 Earlier of contractual maturity or repricing date
(in $ millions)Within 3 months
3 to 6 months
6 to 12 months
1 to 5 years
After 5 years
Non-interest bearing
funds TotalAssets
Cash due from banks 1,991 — — — — 111 2,102Securities purchased under agreement to resell 149 — — — — — 149Short-term investments 135 385 — — — — 520Investments 1,343 15 81 704 2,251 6 4,400Loans 3,339 53 57 81 38 2 3,570Other assets — — — — — 363 363
Total assets 6,957 453 138 785 2,289 482 11,104
Liabilities and shareholders' equityShareholders’ equity — — — — — 711 711Demand deposits 5,828 — — — — 2,385 8,213Term deposits 1,492 166 92 71 — — 1,821Other liabilities — — — — — 242 242Long-term debt 92 — — 25 — — 117
Total liabilities and shareholders' equity 7,412 166 92 96 — 3,338 11,104
Interest rate sensitivity gap (455) 287 46 689 2,289 (2,856) —Cumulative interest rate sensitivity gap (455) (168) (122) 567 2,856 — —
The Bank of N.T. Butterfield & Son LimitedNotes to the Consolidated Financial Statements (unaudited) (continued)
(In thousands of US dollars, unless otherwise stated)
31

Note 16: Earnings per share
Earnings per share have been calculated using the weighted average number of common shares outstanding during the period after deduction of the shares held as treasurystock. The dilutive effect of share-based compensation plans was calculated using the treasury stock method, whereby the proceeds received from the exercise of share-basedawards are assumed to be used to repurchase outstanding shares, using the average market price of the Bank’s shares for the year. Numbers of shares are expressed inthousands.
Prior to their conversion into common shares on 31 March 2015, outstanding contingent value convertible preference ("CVCP") shares were classified as participating securitiesas they were entitled to dividends declared to common shareholders on a 1:1 basis and were therefore included in the basic earnings per share calculation.
During the three months ended 31 March 2017, options to purchase an average of 1.7 million (31 March 2016: 2.8 million) common shares were outstanding. During the threemonths ended 31 March 2017, the average number of outstanding awards of unvested common shares was 0.9 million (31 March 2016: 0.8 million). Only awards for which thesum of 1) the expense that will be recognised in the future (i.e. the unrecognised expense) and 2) its exercise price, if any, was lower than the average market price of theBank‘s common shares were considered dilutive and, therefore, included in the computation of diluted earnings per share. An award's unrecognised expense is also consideredto be the proceeds the employees would need to pay to purchase accelerated vesting of the awards. For purposes of calculating dilution, such proceeds are assumed to beused by the Bank to buy back common shares at the average market price. The weighted-average number of outstanding awards, net of the assumed weighted-average numberof common shares bought back, is included in the number of diluted participating shares.
A warrant, outstanding until the Bank repurchased it in December 2016, to purchase 0.43 million common shares issued to the Government of Bermuda in exchange for theGovernment's guarantee of the preference shares, with an exercise price per share of $34.72 was not included in the computation of earnings per share for any period duringthe year ended 31 December 2016 because the exercise price was greater than the average market price of the Bank‘s common shares.
Three months ended31 March 2017 31 March 2016
Net income 35,857 26,761Less: Preference dividends declared and guarantee fee — (4,119)Net income attributable for common shareholders 35,857 22,642
Basic Earnings Per ShareWeighted average number of common shares issued 53,628 47,293Weighted average number of common shares held as treasury stock (1) (828)Weighted average number of common shares (in thousands) 53,627 46,465
Basic Earnings Per Share 0.67 0.49
Diluted Earnings Per ShareWeighted average number of common shares 53,627 46,465Net dilution impact related to options to purchase common shares 982 456Net dilution impact related to awards of unvested common shares 612 481Weighted average number of diluted common shares (in thousands) 55,221 47,402
Diluted Earnings Per Share 0.65 0.48
The Bank of N.T. Butterfield & Son LimitedNotes to the Consolidated Financial Statements (unaudited) (continued)
(In thousands of US dollars, unless otherwise stated)
32
Note 17: Share-based payments
The common shares transferred to employees under all share-based payments are either taken from the Bank's common treasury shares or from newly issued shares. All share-based payments are settled by the ultimate parent company, which pursuant to Bermuda law is not taxed on income. There are no income tax benefits in relation to the issue ofsuch shares as a form of compensation.
In conjunction with the 2010 capital raise, the Board of Directors approved the 2010 Omnibus Plan (the "2010 Plan"). Under the 2010 Plan, 5% of the Bank’s fully dilutedcommon shares, equal to approximately 2.95 million shares, were initially available for grant to certain officers in the form of stock options or unvested shares awards. Bothtypes of awards are detailed below. In 2012 and 2016, the Board of Directors approved an increase to the equivalent number of shares allowed to be granted under the 2010Plan to respectively 5.0 million and 7.5 million shares.
Stock Option Awards1997 Stock Option PlanPrior to the capital raise on 2 March 2010, the Bank granted stock options to employees and Directors of the Bank that entitle the holder to purchase one common share at asubscription price equal to the market price on the effective date of the grant. Generally, the options granted vest 25 percent at the end of each year for four years, however as a result of the 2010 capital raise, the options granted under the Bank's 1997 Stock Option Plan to employees became fully vested and options awarded to certain executiveswere surrendered.
2010 PlanUnder the 2010 Plan, options are awarded to Bank employees and executive management, based on predetermined vesting conditions that entitle the holder to purchase onecommon share at a subscription price usually equal to the price of the most recently traded common share when granted and have a term of 10 years. The subscription price isreduced for all special dividends declared by the Bank. Stock option awards granted under the 2010 Plan vest based on two specific types of vesting conditions i.e., time andperformance conditions, as detailed below:
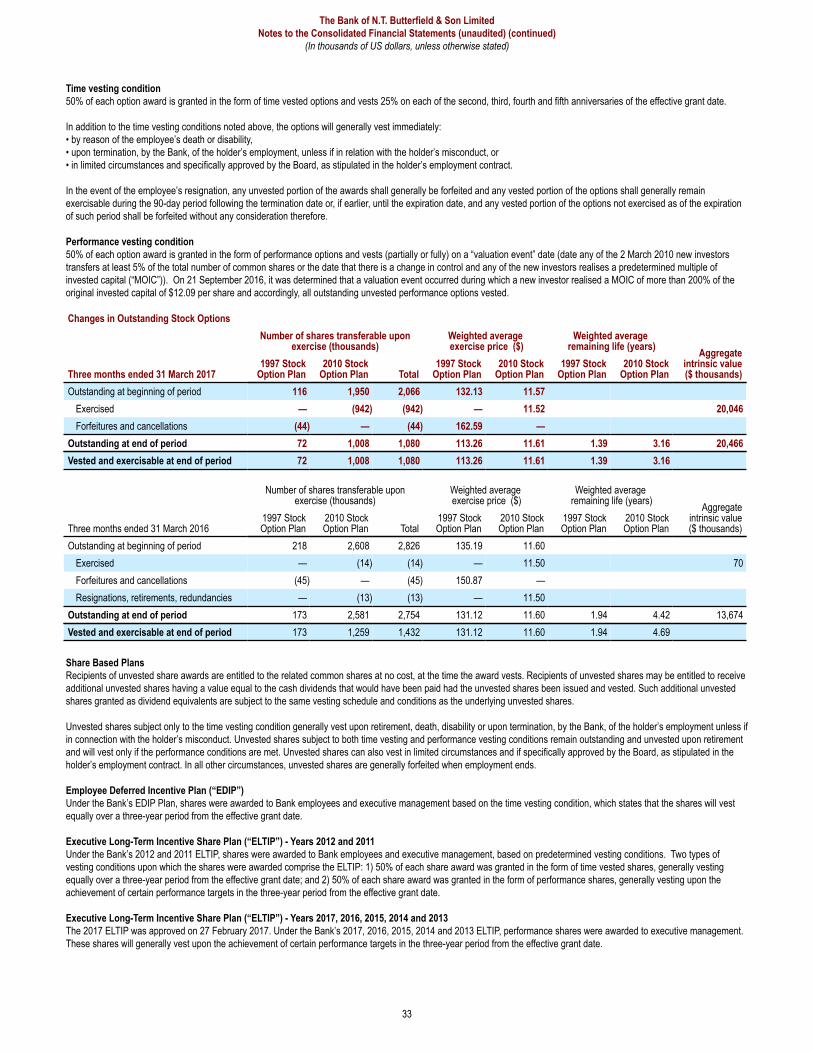
Time vesting condition50% of each option award is granted in the form of time vested options and vests 25% on each of the second, third, fourth and fifth anniversaries of the effective grant date.
In addition to the time vesting conditions noted above, the options will generally vest immediately:• by reason of the employee’s death or disability,• upon termination, by the Bank, of the holder’s employment, unless if in relation with the holder’s misconduct, or• in limited circumstances and specifically approved by the Board, as stipulated in the holder’s employment contract.
In the event of the employee’s resignation, any unvested portion of the awards shall generally be forfeited and any vested portion of the options shall generally remainexercisable during the 90-day period following the termination date or, if earlier, until the expiration date, and any vested portion of the options not exercised as of the expirationof such period shall be forfeited without any consideration therefore.
Performance vesting condition50% of each option award is granted in the form of performance options and vests (partially or fully) on a “valuation event” date (date any of the 2 March 2010 new investorstransfers at least 5% of the total number of common shares or the date that there is a change in control and any of the new investors realises a predetermined multiple ofinvested capital (“MOIC”)). On 21 September 2016, it was determined that a valuation event occurred during which a new investor realised a MOIC of more than 200% of theoriginal invested capital of $12.09 per share and accordingly, all outstanding unvested performance options vested.
Changes in Outstanding Stock OptionsNumber of shares transferable upon
exercise (thousands)Weighted average exercise price ($)
Weighted average remaining life (years) Aggregate
intrinsic value ($ thousands)Three months ended 31 March 2017
1997 Stock Option Plan
2010 StockOption Plan Total
1997 Stock Option Plan
2010 StockOption Plan
1997 Stock Option Plan
2010 StockOption Plan
Outstanding at beginning of period 116 1,950 2,066 132.13 11.57Exercised — (942) (942) — 11.52 20,046Forfeitures and cancellations (44) — (44) 162.59 —
Outstanding at end of period 72 1,008 1,080 113.26 11.61 1.39 3.16 20,466Vested and exercisable at end of period 72 1,008 1,080 113.26 11.61 1.39 3.16
Number of shares transferable uponexercise (thousands)
Weighted average exercise price ($)
Weighted average remaining life (years) Aggregate
intrinsic value ($ thousands)Three months ended 31 March 2016
1997 Stock Option Plan
2010 Stock Option Plan Total
1997 Stock Option Plan
2010 Stock Option Plan
1997 Stock Option Plan
2010 Stock Option Plan
Outstanding at beginning of period 218 2,608 2,826 135.19 11.60Exercised — (14) (14) — 11.50 70Forfeitures and cancellations (45) — (45) 150.87 —Resignations, retirements, redundancies — (13) (13) — 11.50
Outstanding at end of period 173 2,581 2,754 131.12 11.60 1.94 4.42 13,674Vested and exercisable at end of period 173 1,259 1,432 131.12 11.60 1.94 4.69
Share Based PlansRecipients of unvested share awards are entitled to the related common shares at no cost, at the time the award vests. Recipients of unvested shares may be entitled to receiveadditional unvested shares having a value equal to the cash dividends that would have been paid had the unvested shares been issued and vested. Such additional unvestedshares granted as dividend equivalents are subject to the same vesting schedule and conditions as the underlying unvested shares.
Unvested shares subject only to the time vesting condition generally vest upon retirement, death, disability or upon termination, by the Bank, of the holder’s employment unless ifin connection with the holder’s misconduct. Unvested shares subject to both time vesting and performance vesting conditions remain outstanding and unvested upon retirementand will vest only if the performance conditions are met. Unvested shares can also vest in limited circumstances and if specifically approved by the Board, as stipulated in theholder’s employment contract. In all other circumstances, unvested shares are generally forfeited when employment ends.
Employee Deferred Incentive Plan (“EDIP”)Under the Bank’s EDIP Plan, shares were awarded to Bank employees and executive management based on the time vesting condition, which states that the shares will vestequally over a three-year period from the effective grant date.
Executive Long-Term Incentive Share Plan (“ELTIP”) - Years 2012 and 2011Under the Bank’s 2012 and 2011 ELTIP, shares were awarded to Bank employees and executive management, based on predetermined vesting conditions. Two types ofvesting conditions upon which the shares were awarded comprise the ELTIP: 1) 50% of each share award was granted in the form of time vested shares, generally vestingequally over a three-year period from the effective grant date; and 2) 50% of each share award was granted in the form of performance shares, generally vesting upon theachievement of certain performance targets in the three-year period from the effective grant date.
Executive Long-Term Incentive Share Plan (“ELTIP”) - Years 2017, 2016, 2015, 2014 and 2013The 2017 ELTIP was approved on 27 February 2017. Under the Bank’s 2017, 2016, 2015, 2014 and 2013 ELTIP, performance shares were awarded to executive management.These shares will generally vest upon the achievement of certain performance targets in the three-year period from the effective grant date.
The Bank of N.T. Butterfield & Son LimitedNotes to the Consolidated Financial Statements (unaudited) (continued)
(In thousands of US dollars, unless otherwise stated)
33

Changes in Outstanding ELTIP and EDIP awards (in thousands of shares transferable upon vesting)Three months ended
31 March 2017 31 March 2016EDIP ELTIP EDIP ELTIP
Outstanding at beginning of period 215 640 226 606Granted 125 216 111 210Vested (fair value in 2017: $8.5 million, 2016: $6.3 million) (102) (148) (109) (267)Resignations, retirements, redundancies — — (2) (8)
Outstanding at end of period 238 708 226 541
Share-based Compensation Cost Recognised in Net IncomeThree months ended
31 March 2017 31 March 2016Stock
option plans
EDIP and ELTIP Total
Stockoption plans
EDIP and ELTIP Total
Cost recognised in net income — 1,741 1,741 129 1,662 1,791
Unrecognised Share-based Compensation Cost 31 March 2017 31 December 2016EDIP 1,798 2,040
ELTIPTime vesting shares 2,744 2,988Performance vesting shares 3,176 3,802
Total unrecognised expense 7,718 8,830
The Bank of N.T. Butterfield & Son LimitedNotes to the Consolidated Financial Statements (unaudited) (continued)
(In thousands of US dollars, unless otherwise stated)
34
Note 18: Share buy-back plans
The Bank initially introduced two share buy-back programmes on 1 May 2012 as a means to improve shareholder liquidity and facilitate growth in share value. Each programmewas approved by the Board of Directors for a period of 12 months, in accordance with the regulations of the BSX. The BSX must be advised monthly of shares purchasedpursuant to each programme.
From time to time the Bank's associates, insiders and insiders' associates as defined by the BSX regulations may sell shares which may result in such shares being repurchasedpursuant to each programme, provided no more than any such person's pro-rata share of the listed securities is repurchased. Pursuant to the BSX regulations, all repurchasesmade by any issuer pursuant to a securities repurchase programme must be made: (1) in the open market and not by private agreement; and (2) for a price not higher than thelast independent trade for a round lot of the relevant class of securities.
Common Share Buy-Back ProgrammeOn 19 February 2016, the Board approved, with effect from 1 April 2016, the 2016 common share buy-back programme, authorising the purchase for treasury of up to 0.8 millioncommon shares.
Three months ended Year ended 31 DecemberCommon share buy-backs 31 March 2017 2016 2015 2014 2013 2012 TotalAcquired number of shares (to the nearest 1) — 97,053 250,371 856,734 403,848 726,005 2,334,011Average cost per common share — 16.36 19.42 19.86 13.89 12.40 16.31Total cost (in US dollars) — 1,588,189 4,862,248 17,018,412 5,610,907 8,999,061 38,078,817
Preference Share Buy-Back ProgrammeOn 26 February 2015, the Board approved, with effect from 5 May 2015, the 2015 preference share buy-back programme, authorising the purchase for cancellation of up to5,000 preference shares.
Three months ended Year ended 31 DecemberPreference share buy-backs 31 March 2017 2016 2015 2014 2013 2012 TotalAcquired number of shares (to the nearest 1) — — 183 560 11,972 4,422 17,137Average cost per preference share — — 1,151.55 1,172.26 1,230.26 1,218.40 1,224.46Total cost (in US dollars) — — 210,734 656,465 14,728,624 5,387,777 20,983,600

Note 19: Accumulated other comprehensive loss
Unrealised (losses) on translation of
net investment in foreign
operationsHTM
investments
Unrealised gains (losses)
on AFS investments
Employee benefit plans
31 March 2017 Pension
Post-retirement
healthcare
Subtotal - employee
benefits plans Total AOCL
Balance at beginning of period (20,152) (979) (22,680) (63,232) (37,637) (100,869) (144,680)Other comprehensive income (loss), net of taxes 358 48 4,851 329 689 1,018 6,275
Balance at end of period (19,794) (931) (17,829) (62,903) (36,948) (99,851) (138,405)
Unrealised (losses) on translation of
net investment in foreign
operationsHTM
investments
Unrealised gains (losses)
on AFS investments
Employee benefit plans
31 March 2016 Pension
Post-retirement
healthcare
Subtotal - employee
benefits plans Total AOCL
Balance at beginning of period (13,645) (2,350) (57) (46,331) (28,114) (74,445) (90,497)Other comprehensive income (loss), net of taxes (1,587) (245) 19,129 467 (903) (436) 16,861
Balance at end of period (15,232) (2,595) 19,072 (45,864) (29,017) (74,881) (73,636)
Net Change of AOCL Components Three months endedLine item in the consolidated statements of operations, if any 31 March 2017 31 March 2016
Net unrealised gains (losses) on translation of net investment in foreign operations adjustments
Foreign currency translation adjustments N/A 2,026 (4,399)Gains (loss) on net investment hedge N/A (1,668) 2,812
Net change 358 (1,587)
Held-to-maturity investment adjustmentsAmortisation of net gains (losses) to net income Interest income on investments 48 (245)
Net change 48 (245)
Available-for-sale investment adjustmentsGross unrealised gains (losses) N/A 4,920 19,053Transfer of realised (gains) losses to net income Net realised gains (losses) on AFS investments (69) 76
Net change 4,851 19,129
Employee benefit plans adjustmentsDefined benefit pension plan
Amortisation of actuarial losses Salaries and other employee benefits 568 426Foreign currency translation adjustments of related balances N/A (239) 41
Net change 329 467
Post-retirement healthcare planAmortisation of net actuarial losses Salaries and other employee benefits 879 683Amortisation of prior service credit Salaries and other employee benefits (190) (1,586)
Net change 689 (903)
Other comprehensive income (loss), net of taxes 6,275 16,861
The Bank of N.T. Butterfield & Son LimitedNotes to the Consolidated Financial Statements (unaudited) (continued)
(In thousands of US dollars, unless otherwise stated)
35
Note 20: Capital structure
Authorised CapitalOn 16 September 2016, the Bank began trading on the New York Stock Exchange under the ticker symbol "NTB". The offering of 12,234,042 common shares consisted of5,957,447 newly issued common shares sold by Butterfield and 6,276,595 common shares sold by certain selling shareholders, including 1,595,744 common shares sold bycertain of the selling shareholders pursuant to the underwriters’ option to purchase additional shares, which was exercised in full prior to the closing.
On 25 July 2016, the Bank’s board of directors approved a consolidation of the existing common shares on the basis of a 10 to 1 ratio, subject to shareholder approval. As aresult of this consolidation, effective 6 September 2016 upon shareholder approval, every 10 common shares of par value BM$0.01 were consolidated into 1 common share ofpar value BM$0.10 (the “Share Consolidation”).
In addition, as of 6 September 2016, the par value of each issued common share and each authorised but unissued common share was reduced from BM$0.10 to BM$0.01 andthe authorised share capital of the Bank was correspondingly reduced from 2,000,000,000 common shares of par value BM$0.10 each, 6,000,000,000 non‑voting ordinaryshares of par value BM$0.01 each, 110,200,001 preference shares of par value US$0.01 each and 50,000,000 preference shares of par value £0.01 each to 2,000,000,000

common shares of par value BM$0.01 each, 6,000,000,000 non‑voting ordinary shares of par value BM$0.01 each, 110,200,001 preference shares of par value US$0.01 eachand 50,000,000 preference shares of par value £0.01 each, without any payment by the Bank to the holders of the voting ordinary shares in respect thereof (the “Reduction inPar Value” and together with the Share Consolidation, the “Reverse Share Split”).
Immediately following the Reduction in Par Value, the Bank repurchased any and all fractions of common shares issued and outstanding following the Reduction in Par Value,from the holders thereof. All share, share‑based payments and dividend information presented in these consolidated financial statements and accompanying footnotes hasbeen retroactively adjusted to reflect the decreased number of shares resulting from this action.
Prior to the Reverse Share Split, the Bank’s total authorised share capital consisted of (i) 20 billion common shares of par value BM$0.01, (ii) 6 billion non‑voting ordinary sharesof par value BM$0.01; (iii) 100,200,001 preference shares of par value US$0.01 and (iv) 50 million preference shares of par value £0.01.
Preference SharesOn 22 June 2009, the Bank issued 200,000 Government guaranteed, 8.00% non-cumulative perpetual limited voting preference shares (the “preference shares”). The issuanceprice was US$1,000 per share. The preference share buy-backs are disclosed in Note 18: Share Buy-Back Plans.
The preference share principal and dividend payments are guaranteed by the Government of Bermuda. At any time after the expiry of the guarantee offered by the Governmentof Bermuda, and subject to the approval of the BMA, the Bank would have been able to redeem, in whole or in part, any preference shares at the time issued and outstanding, ata redemption price equal to the liquidation preference plus any unpaid dividends at the time.
Holders of preference shares were entitled to receive, on each preference share only when, as and if declared by the Board of Directors, non-cumulative cash dividends at a rateper annum equal to 8.00% on the liquidation preference of US$1,000 per preference share payable quarterly in arrears. In exchange for the Government's commitment, theBank issued to the Government a warrant that, upon issuance, allowed the purchase of 427,960 common shares of the Bank at an exercise price of $70.10 per share. Thewarrant which, after adjustments in accordance with anti-dilution terms allowed for the purchase of 432,028 shares with an exercise price of $34.72 per share was repurchasedand cancelled by the Bank in December 2016.
On 15 December 2016, the Bank effected a mandatory redemption of its preference shares by paying a make-whole redemption payment (the "make-whole redemption price")of USD $1,180.00 per preference share to preference shareholders of record as at 1 December 2016. The make-whole redemption price comprises the sum of the dividend perpreference share for the current quarter, the $1,000 liquidation preference per preference share, discounted for present value, and the present value of future dividend paymentsthrough 22 June 2019. Following the payment of the make-whole redemption price, all issued and outstanding preference shares were redeemed, cancelled and reverted toauthorised but unissued preference shares of the Bank. The preference shares were also delisted from both the BSX and the Luxembourg Stock Exchange.
Dividends DeclaredDuring the three months ended 31 March 2017, the Bank paid cash dividends of $0.32 (31 March 2016: $0.10) for each common share as of the related record dates. During thethree months ended 31 March 2016, the Bank declared the full 8.00% cash dividends on preference shares. As the preference shares were completely redeemed on 15December 2016, there were nil cash dividends on preference shares for the three months ended 31 March 2017.
The Bank is required to comply with Section 54 of the Companies Act 1981 issued by the Government of Bermuda (the “Companies Act”) each time a dividend is declared orpaid by the Bank and also obtain prior written approval from the BMA pursuant to the Banks and Deposit Companies Act 1999 for any dividends declared. The Bank hascomplied with Section 54 and has obtained BMA approval for all dividends declared during the periods under review.
Regulatory CapitalEffective 1 January 2016, the Bank’s regulatory capital is determined in accordance with current Basel III guidelines as issued by the Bermuda Monetary Authority (“BMA”).Basel III adopts Common Equity Tier 1 (“CET1”) as the predominant form of regulatory capital with the CET1 ratio as a new metric. Basel III also adopts the new Leverage Ratioregime, which is calculated by dividing Tier 1 capital by an exposure measure. The Leverage Ratio Exposure Measure consists of total assets (excluding items deducted fromTier 1 capital) and certain off-balance sheet items converted into credit exposure equivalents as well as adjustments for derivatives to reflect credit risk and other risks. Prior to 1January 2016, the Bank’s regulatory capital was determined in accordance with Basel II guidelines as issued by the BMA.
The Bank is fully compliant with all regulatory capital requirements and maintains capital ratios in excess of regulatory minimums as at 31 March 2017 and 31 December 2016.The following table sets forth the Bank's capital adequacy in accordance with the Basel III framework:
31 March 2017 31 December 2016
ActualRegulatory
minimum ActualRegulatory
minimumCapital
Common Equity Tier 1 690,803 N/A 666,847 N/ATier 1 capital 690,803 N/A 666,847 N/ATier 2 capital 90,505 N/A 102,709 N/A
Total capital 781,308 N/A 769,556 N/A
Risk Weighted Assets 4,359,884 N/A 4,365,440 N/A
Leverage Ratio Exposure Measure 11,351,910 N/A 11,516,303 N/A
Capital Ratios (%)Common Equity Tier 1 15.8% 8.8% 15.3% 8.1%Total Tier 1 15.8% 10.3% 15.3% 9.6%Total Capital 17.9% 15.9% 17.6% 15.3%Leverage ratio 6.1% 5.0% 5.8% 5.0%
The Bank of N.T. Butterfield & Son LimitedNotes to the Consolidated Financial Statements (unaudited) (continued)
(In thousands of US dollars, unless otherwise stated)
36

The Bank of N.T. Butterfield & Son LimitedNotes to the Consolidated Financial Statements (unaudited) (continued)
(In thousands of US dollars, unless otherwise stated)
37
Note 21: Business combinations
Bermuda Trust Company Limited and the Private Banking Investment Management of Operations of HSBC Bank Bermuda Limited AcquisitionOn 29 April 2016, the Bank and two of its subsidiaries, Butterfield Trust (Bermuda) Limited ("BTBL") and Butterfield Asset Management Limited ("BAM"), acquired for a totalpurchase price of $21.8 million: 1) all outstanding shares of Bermuda Trust Company Limited ("BTCL", a wholly–owned subsidiary of HSBC Bank Bermuda Limited("HSBCBB")), 2) certain assets of the asset management services operations of HSBCBB and 3) certain assets of the private banking services operations of HSBCBB. Theacquisition is in line with the Bank's growth strategy of developing core businesses in existing markets and was undertaken to add scale to the Bank capacity in these marketsegments where the Bank had already a significant presence and a long history.
The acquisition date fair value of consideration transferred amounted to $21.8 million comprising cash settlement of $7.0 million paid on 29 April 2016, a second payment of $2.1million made on 6 May 2016, and contingent considerations payable in the second half of 2016 and evaluated at $12.7 million. The contingent considerations were dependenton the trust and asset management clients retention by BNTB before the end of the contingency period in September 2016 and the amount paid was $12.7 million.
The fair value of the net assets acquired and allocation of purchase is summarised as follows:
As at29 April 2016
Total consideration transferred 21,778
Assets acquiredIntangible assets 21,443Other assets 3,345
Total assets acquired 24,788
Liabilities acquired 3,010
Excess purchase price (goodwill) —
The purchase price paid by the Bank was for BTCL's net tangible value as well as intangible assets of $21.4 million in the form of customer relationships in all three segmentswith an estimated finite useful life of 15 years.
The Bank incurred transaction expenses related to this acquisition in the amount of $4.3 million, of which $3.3 million were expensed during the year ended 31 December 2016(including $0.7 million of legal and professional fees) and $1.0 million were expensed during the year ended 31 December 2015 (including $1.0 million of legal and professionalfees).
For the year ended 31 December 2016, the amount of revenues and earnings relating to the acquired HSBC Bermuda operations that are not inextricably merged into theBank’s operations are $9.8 million and $5.0 million respectively.
The following selected unaudited pro forma financial information has been provided to present a summary of the combined results of the Bank and the acquired operations fromHSBC Bermuda, assuming the transaction had been effected on 1 January 2016. The unaudited pro forma data is for informational purposes only and does not necessarilyrepresent results that would have occurred if the transaction had taken place on the basis assumed above. The pro forma have been prepared based on the actual resultsrealised by the Bank from operating the acquired activities, when such activities were not yet inextricably merged into the Bank's operations.
Three months endedUnaudited pro forma financial information 31 March 2016Total net revenue 100,622Total non-interest operating expense 71,992Pro forma net income post business combination 28,630
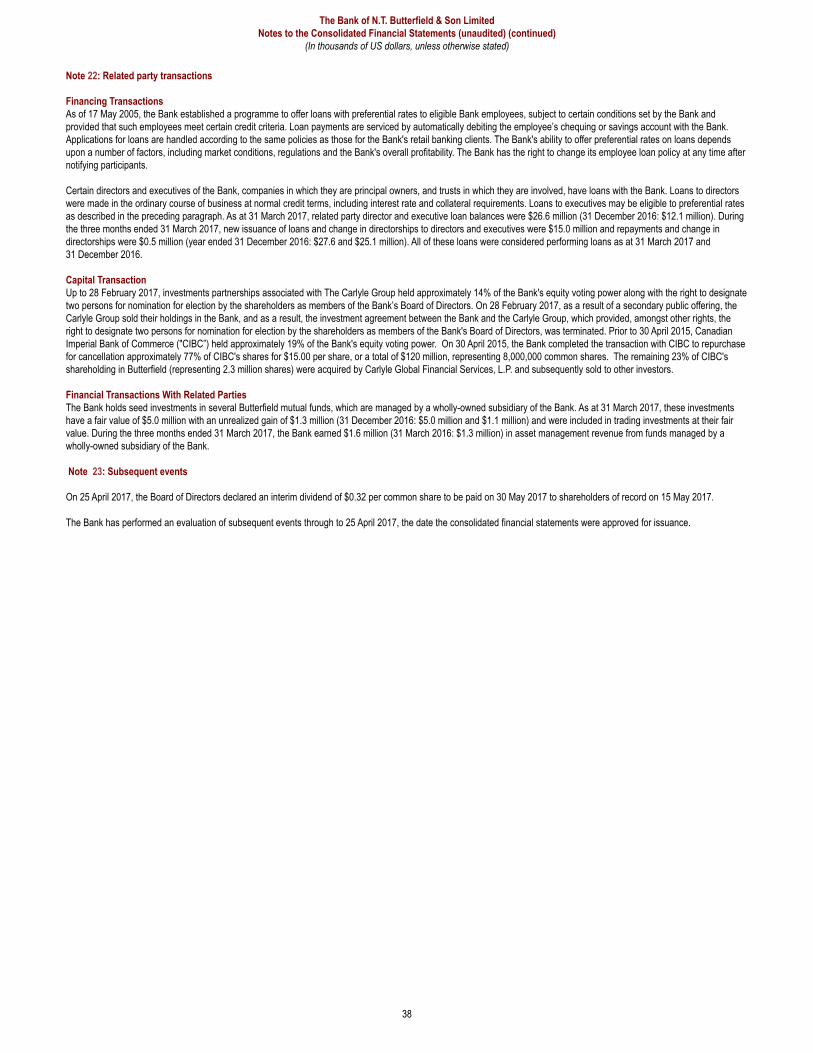
Note 22: Related party transactions
Financing Transactions As of 17 May 2005, the Bank established a programme to offer loans with preferential rates to eligible Bank employees, subject to certain conditions set by the Bank andprovided that such employees meet certain credit criteria. Loan payments are serviced by automatically debiting the employee’s chequing or savings account with the Bank.Applications for loans are handled according to the same policies as those for the Bank's retail banking clients. The Bank's ability to offer preferential rates on loans dependsupon a number of factors, including market conditions, regulations and the Bank's overall profitability. The Bank has the right to change its employee loan policy at any time afternotifying participants.
Certain directors and executives of the Bank, companies in which they are principal owners, and trusts in which they are involved, have loans with the Bank. Loans to directorswere made in the ordinary course of business at normal credit terms, including interest rate and collateral requirements. Loans to executives may be eligible to preferential ratesas described in the preceding paragraph. As at 31 March 2017, related party director and executive loan balances were $26.6 million (31 December 2016: $12.1 million). Duringthe three months ended 31 March 2017, new issuance of loans and change in directorships to directors and executives were $15.0 million and repayments and change indirectorships were $0.5 million (year ended 31 December 2016: $27.6 and $25.1 million). All of these loans were considered performing loans as at 31 March 2017 and31 December 2016.
Capital Transaction Up to 28 February 2017, investments partnerships associated with The Carlyle Group held approximately 14% of the Bank's equity voting power along with the right to designatetwo persons for nomination for election by the shareholders as members of the Bank’s Board of Directors. On 28 February 2017, as a result of a secondary public offering, theCarlyle Group sold their holdings in the Bank, and as a result, the investment agreement between the Bank and the Carlyle Group, which provided, amongst other rights, theright to designate two persons for nomination for election by the shareholders as members of the Bank's Board of Directors, was terminated. Prior to 30 April 2015, CanadianImperial Bank of Commerce ("CIBC”) held approximately 19% of the Bank's equity voting power. On 30 April 2015, the Bank completed the transaction with CIBC to repurchasefor cancellation approximately 77% of CIBC's shares for $15.00 per share, or a total of $120 million, representing 8,000,000 common shares. The remaining 23% of CIBC'sshareholding in Butterfield (representing 2.3 million shares) were acquired by Carlyle Global Financial Services, L.P. and subsequently sold to other investors.
Financial Transactions With Related PartiesThe Bank holds seed investments in several Butterfield mutual funds, which are managed by a wholly-owned subsidiary of the Bank. As at 31 March 2017, these investmentshave a fair value of $5.0 million with an unrealized gain of $1.3 million (31 December 2016: $5.0 million and $1.1 million) and were included in trading investments at their fairvalue. During the three months ended 31 March 2017, the Bank earned $1.6 million (31 March 2016: $1.3 million) in asset management revenue from funds managed by awholly-owned subsidiary of the Bank.
The Bank of N.T. Butterfield & Son LimitedNotes to the Consolidated Financial Statements (unaudited) (continued)
(In thousands of US dollars, unless otherwise stated)
38
Note 23: Subsequent events
On 25 April 2017, the Board of Directors declared an interim dividend of $0.32 per common share to be paid on 30 May 2017 to shareholders of record on 15 May 2017.
The Bank has performed an evaluation of subsequent events through to 25 April 2017, the date the consolidated financial statements were approved for issuance.