Q1 2016 results presentation - Husqvarna Group€¢Operating income increased by SEK 54m to SEK...
15
Q1 2016 results presentation 2016-04-21
Transcript of Q1 2016 results presentation - Husqvarna Group€¢Operating income increased by SEK 54m to SEK...
Q1 2016 results presentation
2016-04-21
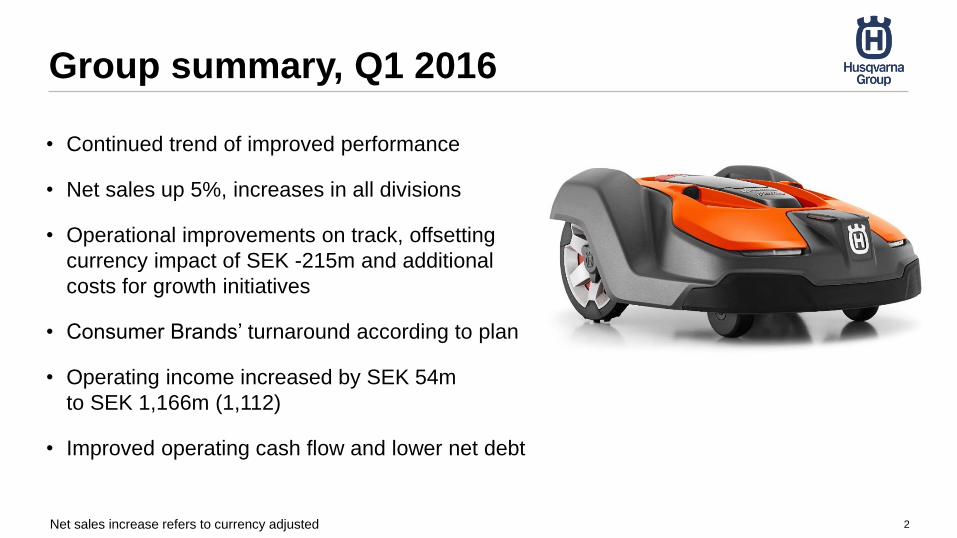
Group summary, Q1 2016
2
• Continued trend of improved performance
• Net sales up 5%, increases in all divisions
• Operational improvements on track, offsetting
currency impact of SEK -215m and additional
costs for growth initiatives
• Consumer Brands’ turnaround according to plan
• Operating income increased by SEK 54m
to SEK 1,166m (1,112)
• Improved operating cash flow and lower net debt
Net sales increase refers to currency adjusted
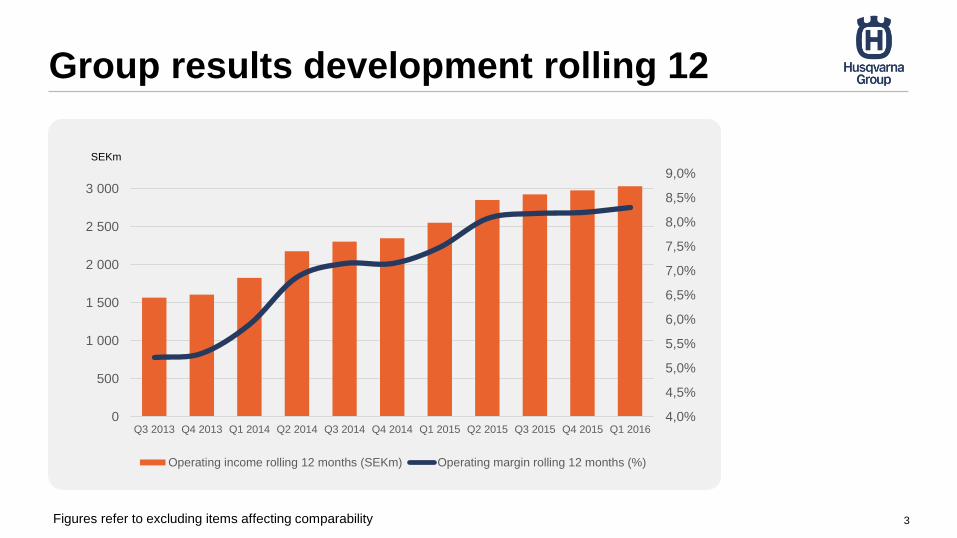
Group results development rolling 12
3
4,0%
4,5%
5,0%
5,5%
6,0%
6,5%
7,0%
7,5%
8,0%
8,5%
9,0%
0
500
1 000
1 500
2 000
2 500
3 000
Q3 2013 Q4 2013 Q1 2014 Q2 2014 Q3 2014 Q4 2014 Q1 2015 Q2 2015 Q3 2015 Q4 2015 Q1 2016
Operating income rolling 12 months (SEKm) Operating margin rolling 12 months (%)
SEKm
Figures refer to excluding items affecting comparability
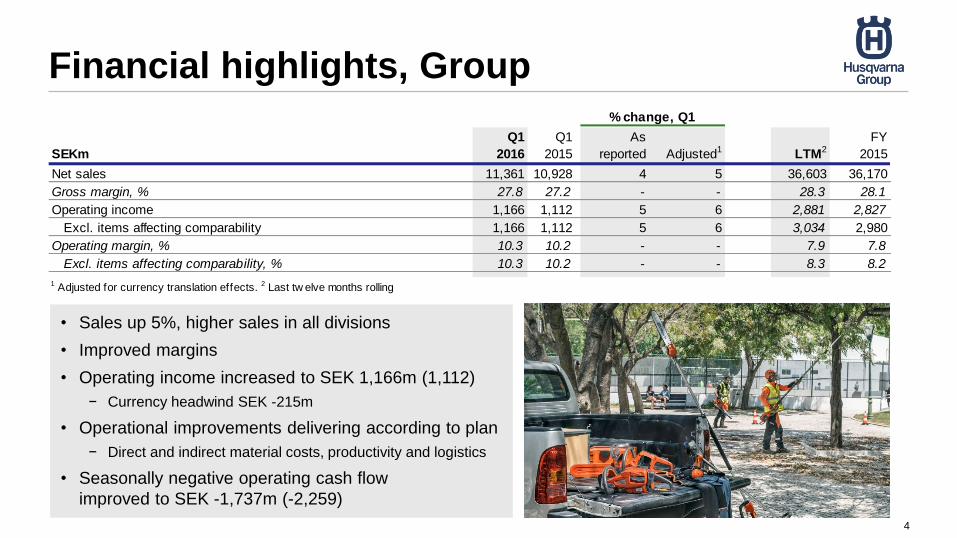
Financial highlights, Group
• Sales up 5%, higher sales in all divisions
• Improved margins
• Operating income increased to SEK 1,166m (1,112)
− Currency headwind SEK -215m
• Operational improvements delivering according to plan
− Direct and indirect material costs, productivity and logistics
• Seasonally negative operating cash flow
improved to SEK -1,737m (-2,259)
4
SEKm
Q1
2016
Q1
2015
As
reported Adjusted1 LTM2
FY
2015
Net sales 11,361 10,928 4 5 36,603 36,170
Gross margin, % 27.8 27.2 - - 28.3 28.1
Operating income 1,166 1,112 5 6 2,881 2,827
Excl. items affecting comparability 1,166 1,112 5 6 3,034 2,980
Operating margin, % 10.3 10.2 - - 7.9 7.8
Excl. items affecting comparability, % 10.3 10.2 - - 8.3 8.2
1 Adjusted for currency translation effects. 2 Last tw elve months rolling
% change, Q1

Husqvarna Division
• Increased sales
– Mainly related to EMEA
– Continued strong growth for robotic mowers
• Operational improvements almost offset FX
– Favorable volume and product mix
– Additional costs due to investments in growth initiatives
– Negative currency impact SEK -135m
5
SEKm
Q1
2016
Q1
2015
As
reported Adjusted1 LTM2
FY
2015
Net sales 5,457 5,342 2 4 17,739 17,624
Operating income 844 897 -6 -5 2,180 2,233
Excl. items affecting comparability 844 897 -6 -5 2,231 2,284
Operating margin, % 15.5 16.8 - - 12.3 12.7
Excl. items affecting comparability, % 15.5 16.8 - - 12.6 13.0
1 Adjusted for currency translation effects. 2 Last tw elve months rolling
% change, Q1

Gardena Division
6
SEKm
Q1
2016
Q1
2015
As
reported Adjusted1 LTM2
FY
2015
Net sales 1,518 1,319 15 17 4,868 4,669
Operating income 226 204 11 11 608 586
Excl. items affecting comparability 226 204 11 11 613 591
Operating margin, % 14.9 15.5 - - 12.5 12.5
Excl. items affecting comparability, % 14.9 15.5 - - 12.6 12.7
1 Adjusted for currency translation effects. 2 Last tw elve months rolling
% change, Q1
• Low trade inventory levels at end of 2015
• Further demand generated by expansion through
geography focus, new channel and products
respectively
• Higher operating income, but margin diluted by
– Currency headwind
– Higher costs for growth activities including R&D
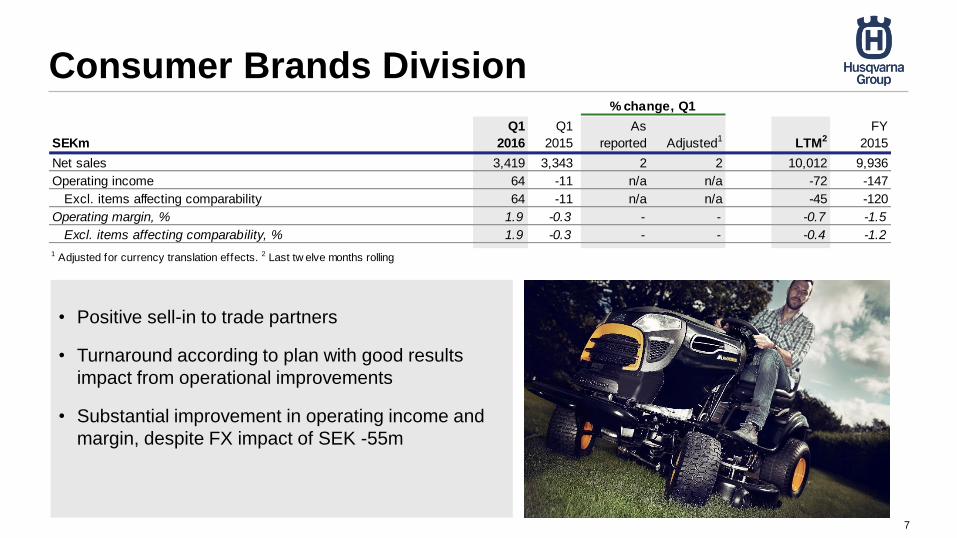
Consumer Brands Division
7
• Positive sell-in to trade partners
• Turnaround according to plan with good results
impact from operational improvements
• Substantial improvement in operating income and
margin, despite FX impact of SEK -55m
SEKm
Q1
2016
Q1
2015
As
reported Adjusted1 LTM2
FY
2015
Net sales 3,419 3,343 2 2 10,012 9,936
Operating income 64 -11 n/a n/a -72 -147
Excl. items affecting comparability 64 -11 n/a n/a -45 -120
Operating margin, % 1.9 -0.3 - - -0.7 -1.5
Excl. items affecting comparability, % 1.9 -0.3 - - -0.4 -1.2
1 Adjusted for currency translation effects. 2 Last tw elve months rolling
% change, Q1
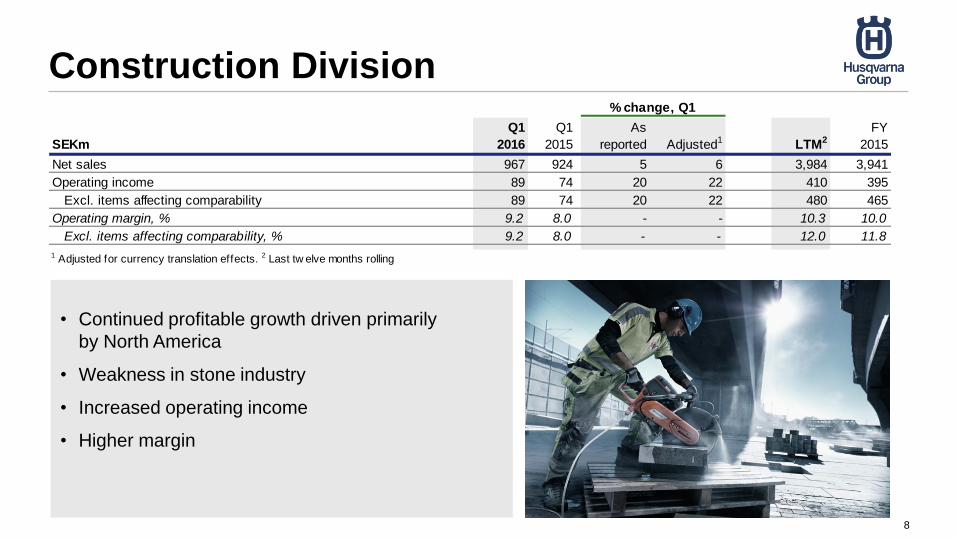
Construction Division
8
• Continued profitable growth driven primarily
by North America
• Weakness in stone industry
• Increased operating income
• Higher margin
SEKm
Q1
2016
Q1
2015
As
reported Adjusted1 LTM2
FY
2015
Net sales 967 924 5 6 3,984 3,941
Operating income 89 74 20 22 410 395
Excl. items affecting comparability 89 74 20 22 480 465
Operating margin, % 9.2 8.0 - - 10.3 10.0
Excl. items affecting comparability, % 9.2 8.0 - - 12.0 11.8
1 Adjusted for currency translation effects. 2 Last tw elve months rolling
% change, Q1
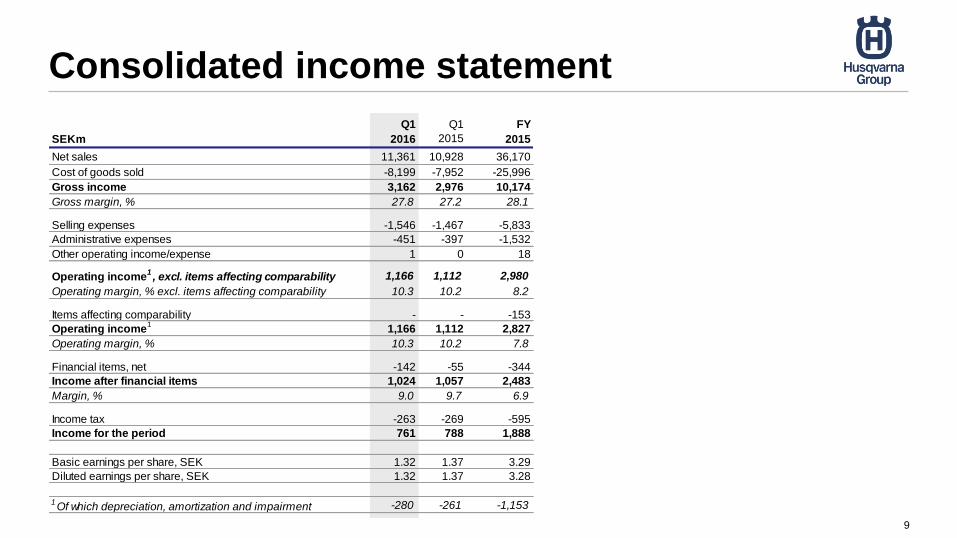
Consolidated income statement
9
SEKm
Q1
2016
Q1
2015
FY
2015
Net sales 11,361 10,928 36,170
Cost of goods sold -8,199 -7,952 -25,996
Gross income 3,162 2,976 10,174
Gross margin, % 27.8 27.2 28.1
Selling expenses -1,546 -1,467 -5,833
Administrative expenses -451 -397 -1,532
Other operating income/expense 1 0 18
Operating income1, excl. items affecting comparability 1,166 1,112 2,980
Operating margin, % excl. items affecting comparability 10.3 10.2 8.2
Items affecting comparability - - -153
Operating income1
1,166 1,112 2,827
Operating margin, % 10.3 10.2 7.8
Financial items, net -142 -55 -344
Income after financial items 1,024 1,057 2,483
Margin, % 9.0 9.7 6.9
Income tax -263 -269 -595
Income for the period 761 788 1,888
Basic earnings per share, SEK 1.32 1.37 3.29
Diluted earnings per share, SEK 1.32 1.37 3.28
1Of which depreciation, amortization and impairment -280 -261 -1,153

Consolidated balance sheet
10
SEKm
Mar. 31
2016
Mar. 31
2015
Dec. 31
2015
Non-current assets 15,675 16,299 15,749
Inventories 8,331 9,338 7,874
Trade receivables 7,766 7,805 3,126
Other current assets 1,120 655 952
Liquid funds 2,114 2,241 1,968
Total assets 35,006 36,338 29,669
Total equity 13,665 12,933 13,061
Interest-bearing liabilities 8,816 10,479 6,952
Pension liabilities 1,580 1,934 1,425
Provisions 3,017 2,693 2,953
Trade payables 5,110 5,632 3,077
Other current liabilities 2,818 2,667 2,201
Total equity and liabilities 35,006 36,338 29,669
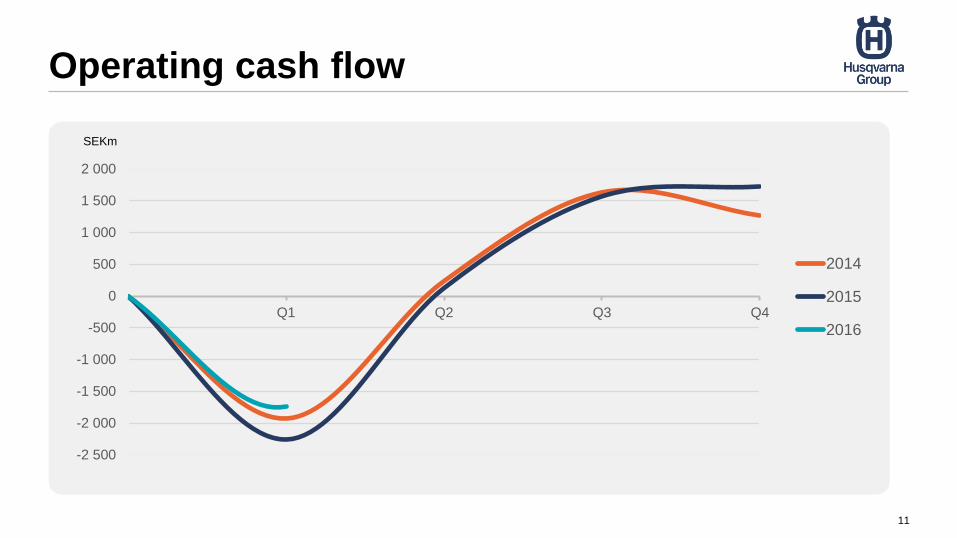
Operating cash flow
-2 500
-2 000
-1 500
-1 000
-500
0
500
1 000
1 500
2 000
Q1 Q2 Q3 Q4
2014
2015
2016
11
SEKm
Net debt / equity rolling 12 months
12
0%
10%
20%
30%
40%
50%
60%
70%
80%
90%
0
1 000
2 000
3 000
4 000
5 000
6 000
7 000
8 000
9 000
10 000
201
2 Q
1
201
2 Q
2
201
2 Q
3
201
2 Q
4
201
3 Q
1
201
3 Q
2
2013 Q
3
201
3 Q
4
201
4 Q
1
201
4 Q
2
201
4 Q
3
2014 Q
4
201
5 Q
1
201
5 Q
2
201
5 Q
3
201
5 Q
4
2016 Q
1
Net debt R12
Net debt/equity R12
SEKm
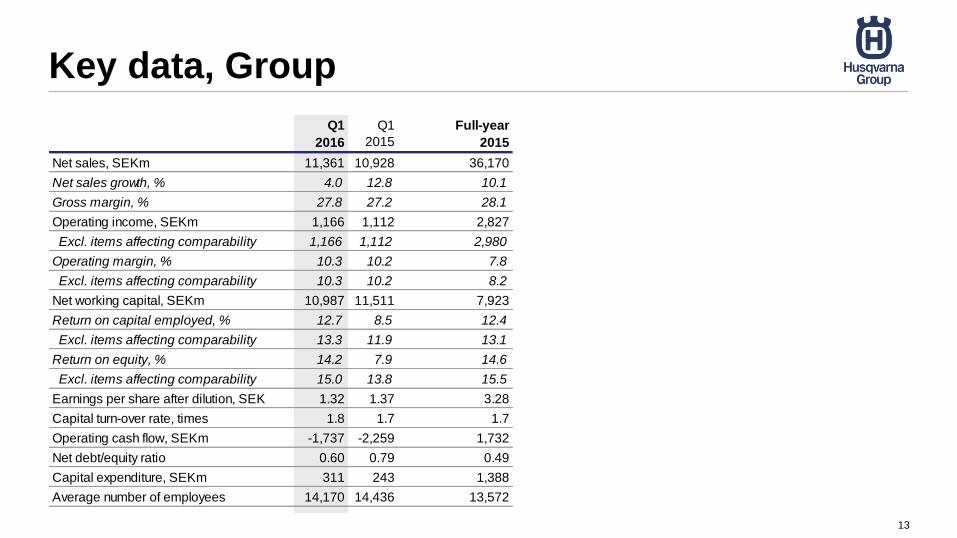
Key data, Group
13
Q1
2016
Q1
2015
Full-year
2015
Net sales, SEKm 11,361 10,928 36,170
Net sales growth, % 4.0 12.8 10.1
Gross margin, % 27.8 27.2 28.1
Operating income, SEKm 1,166 1,112 2,827
Excl. items affecting comparability 1,166 1,112 2,980
Operating margin, % 10.3 10.2 7.8
Excl. items affecting comparability 10.3 10.2 8.2
Net working capital, SEKm 10,987 11,511 7,923
Return on capital employed, % 12.7 8.5 12.4
Excl. items affecting comparability 13.3 11.9 13.1
Return on equity, % 14.2 7.9 14.6
Excl. items affecting comparability 15.0 13.8 15.5
Earnings per share after dilution, SEK 1.32 1.37 3.28
Capital turn-over rate, times 1.8 1.7 1.7
Operating cash flow, SEKm -1,737 -2,259 1,732
Net debt/equity ratio 0.60 0.79 0.49
Capital expenditure, SEKm 311 243 1,388
Average number of employees 14,170 14,436 13,572
The priority for the Group remains being to offset
both further currency headwind expected for the
remainder of the year, and to finance profitable
growth initiatives by operational improvements.
Group summary, Q1 2016
14
• Continued trend of improved performance
• Net sales up 5%, increases in all divisions
• Operational improvements on track, offsetting
currency impact of SEK -215m and additional
costs for growth initiatives
• Consumer Brands’ turnaround according to plan
• Operating income increased by SEK 54m
to SEK 1,166m (1,112)
• Improved operating cash flow and lower net debt
Net sales increase refers to currency adjusted
www.husqvarnagroup.com


![Sweets @ 435 2- ¥1,112 ,200] No. 430 Cold Rusk Honey ......Sweets @ 435 2- ¥1,112 ,200] No. 430 Cold Rusk Honey Toast No. 432 No. No. 436 No. 433 Chocolate Banana Honey Toast ¥908](https://static.fdocuments.in/doc/165x107/5f944f74a1f85d431d3f6bcc/sweets-435-2-1112-200-no-430-cold-rusk-honey-sweets-435-2-1112.jpg)