Q1 - 2015 North American Industrial Highlights
17
North American Research & Forecast Report INDUSTRIAL MARKET OUTLOOK Q1 2015 Key Takeaways > The North American industrial vacancy rate declined by 15 basis points (bps) to 6.7% in Q1 2015. In the U.S., the vacancy rate fell for the 21 st straight quarter, down 15 bps to 7.0%. In Canada, the vacancy rate decreased by 10 bps to 3.8%. > Net absorption in North America was strong once again in Q1, totaling 63.1 million square feet (MSF), among the highest levels of quarterly absorption post-recession. U.S. absorption in the quarter was 58.6 MSF, up 21.4% year-over-year. > Healthy occupier demand and the need for modern industrial space led to an upswing in construction in both the U.S. and Canada. 52.0 MSF was added to the industrial base in the first quarter, comprising 49.7 MSF in the U.S. and 2.3 MSF in Canada. In many markets, a growing supply is needed given the rate of expansion in the economy, pent-up industrial demand and tightening market conditions. > The positive absorption and tightening market conditions in several key markets are pushing up industrial rents. The average U.S. asking rent for warehouse buildings rose to $5.16/SF NNN in Q1, up 2.2% quarter-over-quarter. Currently, average asking rents are 13.9% higher than the market bottom reached in Q3 2011. > Some markets are seeing outsized increases in asking rents. For example, the average asking rent for warehouse space in Q1 was up significantly year-over-year in the following markets: Oakland (25.6%), San Jose – Silicon Valley (24.6%), Denver (19.2%) and Detroit (16.9%). Bulk asking rents were up year-over-year in Waterloo Region, Ontario (24.3%); Miami (23.6%), Denver (18.5%) and Nashville (16.0%). Markets where flex/service asking rents were up year-over-year in Q1 include: San Francisco Peninsula (43.3%), Miami (20.7%), Ottawa (17.6%), Chicago (16.1%), San Diego (15.6%) and Cincinnati (15.5%). > The results of Colliers’ North American Q1 survey were decidedly optimistic, particularly in the U.S. More than three times as many markets said they expected tenants in their markets to expand as opposed to contract in the upcoming quarter. The U.S. results were even more buoyant, as 39.1% expected to see expansion while only 10.1% expected contraction in Q2. Along those lines, 66.7% of U.S. respondents forecast declining vacancy rates and 59.4% forecast rent increases, as opposed to 8.7% that see vacancy rates increasing and zero percent that forecast rents to decline. > Led by a handful of large portfolio sales, including Blackstone’s $8.1 billion sale of its IndCor Properties unit to the Government of Singapore, North American transaction volume hit a record high of $17.5 billion in Q1 2015. The bulk of the volume, $17.2 billion, came from the U.S. while volume in Canada was $329.1 million. Industrial Market Shrugs Off Economic Slowdown to Post Strong Quarter Pete Culliney Director of Research | Global Thomas Galvin Regional Research Analyst | Research Services Summary Statistics, Q1 2015 North America Industrial Market U.S. CANADA NORTH AMERICA Vacancy Rate 7.0% 3.8% 6.7% Change from Q4 2014 (Basis Points) -15 -10 -15 Absorption (Million Square Feet) 58.6 4.5 63.1 New Supply (Million Square Feet) 49.7 2.3 52.0 Under Construction (Million Square Feet) 147.9 18.4 166.3 ASKING RENTS (USD/CAD) PER SQUARE FOOT PER YEAR Average Warehouse/ Distribution Center $5.16 $8.10 $5.61 Change from Q4 2014 2.2% 2.5% 2.2% Market Indicators Relative to prior period U.S. Q1 2015 U.S. Q2 2015* CANADA Q1 2015 CANADA Q2 2015* VACANCY NET ABSORPTION CONSTRUCTION RENTAL RATE** * Projected, relative to prior period ** Warehouse rents
-
Upload
coy-davidson -
Category
Real Estate
-
view
381 -
download
1
Transcript of Q1 - 2015 North American Industrial Highlights

North American Research & Forecast Report
INDUSTRIAL MARKET OUTLOOKQ1 2015
Key Takeaways > The North American industrial vacancy rate declined by 15 basis points (bps) to 6.7% in Q1 2015. In the U.S., the vacancy rate fell for the 21st straight quarter, down 15 bps to 7.0%. In Canada, the vacancy rate decreased by 10 bps to 3.8%.
> Net absorption in North America was strong once again in Q1, totaling 63.1 million square feet (MSF), among the highest levels of quarterly absorption post-recession. U.S. absorption in the quarter was 58.6 MSF, up 21.4% year-over-year.
> Healthy occupier demand and the need for modern industrial space led to an upswing in construction in both the U.S. and Canada. 52.0 MSF was added to the industrial base in the first quarter, comprising 49.7 MSF in the U.S. and 2.3 MSF in Canada. In many markets, a growing supply is needed given the rate of expansion in the economy, pent-up industrial demand and tightening market conditions.
> The positive absorption and tightening market conditions in several key markets are pushing up industrial rents. The average U.S. asking rent for warehouse buildings rose to $5.16/SF NNN in Q1, up 2.2% quarter-over-quarter. Currently, average asking rents are 13.9% higher than the market bottom reached in Q3 2011.
> Some markets are seeing outsized increases in asking rents. For example, the average asking rent for warehouse space in Q1 was up significantly year-over-year in the following markets: Oakland (25.6%), San Jose – Silicon Valley (24.6%), Denver (19.2%) and Detroit (16.9%). Bulk asking rents were up year-over-year in Waterloo Region, Ontario (24.3%); Miami (23.6%), Denver (18.5%) and Nashville (16.0%). Markets where flex/service asking rents were up year-over-year in Q1 include: San Francisco Peninsula (43.3%), Miami (20.7%), Ottawa (17.6%), Chicago (16.1%), San Diego (15.6%) and Cincinnati (15.5%).
> The results of Colliers’ North American Q1 survey were decidedly optimistic, particularly in the U.S. More than three times as many markets said they expected tenants in their markets to expand as opposed to contract in the upcoming quarter. The U.S. results were even more buoyant, as 39.1% expected to see expansion while only 10.1% expected contraction in Q2. Along those lines, 66.7% of U.S. respondents forecast declining vacancy rates and 59.4% forecast rent increases, as opposed to 8.7% that see vacancy rates increasing and zero percent that forecast rents to decline.
> Led by a handful of large portfolio sales, including Blackstone’s $8.1 billion sale of its IndCor Properties unit to the Government of Singapore, North American transaction volume hit a record high of $17.5 billion in Q1 2015. The bulk of the volume, $17.2 billion, came from the U.S. while volume in Canada was $329.1 million.
Industrial Market Shrugs Off Economic Slowdown to Post Strong QuarterPete Culliney Director of Research | Global Thomas Galvin Regional Research Analyst | Research Services
Summary Statistics, Q1 2015 North America Industrial Market U.S. CANADA
NORTH AMERICA
Vacancy Rate 7.0% 3.8% 6.7%
Change from Q4 2014 (Basis Points)
-15 -10 -15
Absorption (Million Square Feet)
58.6 4.5 63.1
New Supply (Million Square Feet)
49.7 2.3 52.0
Under Construction (Million Square Feet)
147.9 18.4 166.3
ASKING RENTS (USD/CAD) PER SQUARE FOOT PER YEAR
Average Warehouse/Distribution Center
$5.16 $8.10 $5.61
Change from Q4 2014 2.2% 2.5% 2.2%
Market IndicatorsRelative to prior period
U.S. Q1 2015
U.S. Q2 2015*
CANADA Q1 2015
CANADA Q2 2015*
VACANCY
NET ABSORPTION
CONSTRUCTION
RENTAL RATE**
* Projected, relative to prior period** Warehouse rents

C A N A D A
M I D W E S T N O R T H E A S T
S O U T H
W E S T
C A N A D A
Absorption Per Market (SF)q4 '14 - q1 '15
5,300,000
2,650,000
530,000
-530,000
-2,650,000
-5,300,000
4.5 billion
2.25 billion
450 mil.
Occupied Sq. Ft.
Vacant Sq. Ft.
Sq. Ft. By Region
U.S. Industrial Economic Indicators
GDP
Q1 2015 -0.7% (second estimate)
Q4 2014 2.2%, down from 5.0% in Q3 2014
ISM: Apr-15 PMI® 51.5, down 4.1 pctg. pts. from May-14
RAIL TIME INDICATORS: AAR.ORG - YTD THROUGH APRIL-15
Rail Carload Traffic - 1.4% YOY
Intermodal Traffic + 1.6% YOY
C A N A D A
M I D W E S T N O R T H E A S T
S O U T H
W E S T
C A N A D A
Absorption Per Market (SF)q4 '14 - q1 '15
5,300,000
2,650,000
530,000
-530,000
-2,650,000
-5,300,000
4.5 billion
2.25 billion
450 mil.
Occupied Sq. Ft.
Vacant Sq. Ft.
Sq. Ft. By Region
2 North American Research & Forecast Report | Q1 2015 | Industrial Market Outlook | Colliers International
The North American industrial market continues to exhibit strong performance, as economic indicators and property market fundamentals remain positive. Despite the lower-than-expected first-quarter GDP numbers, the U.S. economy is forecast to grow by nearly 3% for the year and produce another 2 million jobs. Expanding sectors include automobile sales, retail sales and housing construction, which are all strong drivers of industrial demand. The manufacturing sector is experiencing positive growth, and metrics such as the Purchasing Managers Index (PMI), new orders and production are into their third year of solid improvement. New supply, while growing relative to absorption, is not likely to pose a threat of overbuilding as industrial demand is keeping pace.
Industrial Economic Indicators The biggest boost to the industrial market has been the broad improvement in the overall economy, led by robust job growth, a rebound in auto sales and new housing construction. Real GDP contracted at an annual rate of -0.7% in Q1 due to the unusually harsh winter, the energy industry slowdown and the West Coast port strike. A likely scenario is a repeat of 2014, when Q1 GDP was below-trend and the economy shifted into a higher gear in the following quarters.
Job growth remains positive: The economy created 2.6 million jobs in 2014, and 2015 is expected to be the fourth straight year with more than 2 million jobs created. Household formations topped 2 million in 2014, one of the highest numbers since the turn of the century. Overall job growth, combined with the increased household formations by the millennial 20 to 34-year-old age cohort, is leading this surge in new household formation. Each additional household is a driver of industrial demand as related products such as furniture and other household items are warehoused and distributed through the supply chain. Moody’s Analytics estimates that 1.1 million new housing units will be built in 2015, with 1 million new jobs being created annually through 2017. Meanwhile, auto sales have climbed
to a seasonally adjusted annual rate (SAAR) of 17 million, the highest level since the last peak. This also creates demand for warehouses in the Midwest and in coastal port regions.
The ISM’s April 2015 manufacturing report indicates positive movement going forward. Although there were some weaknesses in metrics such as supplier deliveries and inventories, other parts of the index, such as new orders, production, imports and exports, were are all growing, leading to an improving manufacturing environment. Other ports such as Prince Rupert in British Columbia, as well as air freight cargo, saw an uptick in activity during this time as businesses diversified their supply chain to avert this crisis.
According to the American Association of Railroads, railcar traffic was down 1.4% during the first four months of 2015 compared with the year-earlier period, restrained by weakness in commodities shipments. However, rail traffic will likely accelerate in line with stronger economic growth during the remainder of 2015. Also, intermodal traffic growth continued to increase, up 1.6% year-over-year during the first four months of 2015, despite supply chain disruptions caused by the U.S. West Coast port strike in Q1 2015.
Vacancy
Driven by robust absorption in the top U.S. markets, the North American vacancy rate fell by 15 bps to 6.7% in Q1. The U.S. vacancy rate fell 15 bps to 7.0%, and the Canadian vacancy rate dropped 10 bps to 3.8%.
Vacancy rates declined in each U.S. region, most notably in the West, where the rate dropped 30 bps to 5.1%. The Northeast, Midwest and South each saw roughly a 10-bps decline in the vacancy rate. There is a wide disparity in rates among the regions, with the West
North American Industrial Vacancy, Inventory & Absorption Q1 2015 | NA

*** - Q3-14 data displayed.
How would you characterize current industrial rents in your market?
% of reporting marketsSource: Colliers International
ABSORPTION, UNDER CONSTRUCTION (SF) | SELECT MARKETS | Q1 2015
Rolling 4-Qtr Deal Volume Year over Year Change
-100%
0%
100%
200%
300%
$-
$20
$40
$60
Billi
ons
2007
2008
2009
2010
2011
2012
2013
2014
2015
-100%
0%
100%
200%
300%
$-
$20
$40
$60
Billi
ons
2007 2008 2009 2010 2011 2012 2013 2014 2015
Rolling 4-Qtr Deal Volume Year over Year Change
8.8 8.7
8.3
8.1 7.7 7.5
7.2 7.0
0.0
4.0
8.0
12.0
0.0
20.0
40.0
60.0
80.0
Q1 2013
Q2 Q3 Q4 Q1 2014
Q2 Q3 Q4 Q1 2015
Vaca
ncy
%
U.S. INDUSTRIAL MARKET Q1 2013 - Q1 2015
Absorption MSF Completions MSF Vacancy %
8.1 7.7 7.5
7.2 7.0
7.9
2.0
6.0
10.0
14.0
-2.0 0.0 2.0 4.0 6.0 8.0
Edmonton, ABOttawa, ON
Saskatoon, SKWinnipeg, MB****
Victoria, BC****
Regina, SKCalgary, AB
Waterloo Region, ONMontréal, QC
Toronto, ONVancouver, BC
Millions
Currently U/C Q1-15 Absorption
**** - Q4 data displayed. These markets report semi-annually.
0.0 5.0 10.0 15.0 20.0
Savannah, GA
Indianapolis, INChicago, IL
New Jersey - Central
Dallas-Ft. Worth, TXLos Angeles, CA
New Jersey - NorthernAtlanta, GA
Houston, TXLos Angeles - Inland Empire, CA
Millions
Currently U/C Q1-15 Absorption
10.0%26.1%
16.7% 10.1% 11.1%
46.2%50.0%
39.1%
39.1%
66.7%
42.0%
45.7%
30.0%21.7%
56.5%
8.3%
39.1%34.6%
7.7%13.0%
4.3%8.3%
8.7% 8.6%
0%
20%
40%
60%
80%
100%
Midwest
Northe
ast South
West
Cana
da U.S. N.A.
Excluding renewals, of the leases signed this quarter, did most tenants Expand, Hold Steady or Contract?
Contract Holding Steady Expand N/A
46.2%
46.2%46.2%
7.7%
10.0%
50.0%
30.0%
10.0%10.0% 13.0%4.3%
21.7%
39.1%
26.1%
56.5%
39.1%
16.7%
66.7%
8.3%8.3% 8.7%
39.1%
42.0%
10.1%
8.6%
34.6%
45.7%
11.1%
70.0%
60.9%
38.5%
65.2%
59.4%
25.0%
54.3%
20.0%26.1%
53.8%
30.4%
31.9%
50.0%
34.6%
25.0%3.7%10.0% 13.0%
7.7%4.3%
8.7% 7.4%
0%
20%
40%
60%
80%
100%
Northe
astSo
uth
Midwest West U.S.
Cana
da N.A.
Provide a three month forecast for rents (relative to current quarter):
70.0% 38.5% 59.4%
25.0%
60.9% 65.2%54.3%
53.8%
20.0%26.1%
30.4%
31.9%
50.0%
34.6%
25.0%
8.7% 7.4%10.0% 13.0%
7.7%4.3%
Up Same Down N/A
80.0%
78.3%
46.2%
60.9%
66.7%
25.0%
60.5%
10.0% 4.3%
38.5%23.2%
50.0%
27.2%
17.4% 15.4% 8.7%25.0%
11.1%
1.4% 1.2%
0%
20%
40%
60%
80%
100%
Northe
astSo
uth
Midwest West U.S.
Cana
da N.A.
Provide a three-month forecast for vacancy levels (relative to current quarter):
Up Same Down N/A
80.0%
78.3%
46.2%
60.9%
66.7%
25.0%
60.5%
50.0%
27.2%
10.0% 4.3%
38.5%
10.0%10.0% 17.4% 15.4%
39.1%39.1%
8.7%
23.2%
25.0%11.1%
10.1%
9.9%
16.7%
2.5%
5.8%
4.9%
13.0%
33.3%
16.0%
65.2%
41.7%
61.7%
5.8%
4.9%
0% 20% 40% 60% 80% 100%
U.S.
Canada
N.A.
How would you characterize current industrial rents in your market?
N/A
DecliningBottoming
No Clear Direction
Increasing
Peaking
65.2%
41.7%
61.7% 4.9%
33.3%
16.0%9.9%
8.3% 16.7%
13.0% 5.8%10.1%
8.3%
3 North American Research & Forecast Report | Q1 2015 | Industrial Market Outlook | Colliers International
remaining the lowest at 5.1%, trailed by the Midwest (6.8%), South (7.9%) and Northeast (8.8%). Western markets that ranked among the lowest vacancy rates include Los Angeles (1.9%), Honolulu (2.0%), San Francisco Peninsula (2.5%), Orange County (3.3%), Denver (4.0%), Seattle/Puget Sound (4.4%) and Los Angeles – Inland Empire (4.5%). New Jersey markets were among the best performers in the first quarter with Northern New Jersey’s vacancy rate dropping by 90 bps to 7.1% and Central New Jersey falling 50 bps to 7.6%. Other markets with sharp drops in vacancy rates include Little Rock, Ark. (-90 bps), Cincinnati, Las Vegas and San Diego (-70 bps); Tampa, Sacramento and Boise (-60 bps) and San Francisco Peninsula and San Jose-Silicon Valley (-50 bps). On the other end of the spectrum, markets with the largest increases include Indianapolis (70 bps), Hartford (60 bps) and Louisville (50 bps).
Canada’s larger markets generally saw declining vacancy rates in the first quarter, led by Vancouver (-40 bps) and Montreal and Toronto (-20 bps). Meanwhile, vacancies rose in Ottawa (80 bps), Calgary (40 bps) and Edmonton (30 bps).
Manufacturing at a Glance - April 2015
INDEXSERIES INDEX
(APR 2015)
SERIES INDEX
(MAR 2015)
PERCENTAGE-POINT
CHANGEDIRECTION RATE OF
CHANGETREND*
(MONTHS)
PMI® 51.5 51.5 0.0 Growing Same 28
New Orders 53.5 51.8 1.7 Growing Faster 29
Production 56 53.8 2.2 Growing Faster 32
Employment 48.3 50 -1.7 Contracting From Unchanged 1
Supplier Deliveries 50.1 50.5 -0.4 Slowing Slower 23
Inventories 49.5 51.5 -2.0 Contracting From Growing 1
Customers' Inventories 44 45.5 -1.5 Too Low Faster 5
Prices 40.5 39 1.5 Decreasing Slower 6
Backlog of Orders 49.5 49.5 0.0 Contracting Same 2
Exports 51.5 47.5 4.0 Growing From Contracting 1
Imports 54 52.5 1.5 Growing Faster 27
OVERALL ECONOMY Growing Same 71
Manufacturing Sector Growing Same 28
U.S. Industrial Market Q1 2013 to Q1 2015
Note: Latest data as of Q1 2015 Source: Colliers International
*Number of months moving in current directionSource: ISM
ABSORPTION, UNDER CONSTRUCTION (SF) | SELECT MARKETS | Q1 2015
Rolling 4-Qtr Deal Volume Year over Year Change
-100%
0%
100%
200%
300%
$-
$20
$40
$60
Billi
ons
2007
2008
2009
2010
2011
2012
2013
2014
2015
-100%
0%
100%
200%
300%
$-
$20
$40
$60
Billi
ons
2007 2008 2009 2010 2011 2012 2013 2014 2015
Rolling 4-Qtr Deal Volume Year over Year Change
10.1%
9.9%
16.7%
2.5%
5.8%
4.9%
13.0%
33.3%
16.0%
65.2%
41.7%
61.7%
5.8%
4.9%
0% 20% 40% 60% 80% 100%
U.S.
Canada
N.A.
How would you characterize current industrial rents in your market?
N/A
DecliningBottoming
No Clear Direction
Increasing
Peaking
65.2%
41.7%
61.7% 4.9%
33.3%
16.0%9.9%
8.3% 16.7%
13.0% 5.8%10.1%
8.3%
8.8 8.7
8.3
8.1 7.7 7.5
7.2 7.0
0.0
4.0
8.0
12.0
0.0
20.0
40.0
60.0
80.0
Q1 2013
Q2 Q3 Q4 Q1 2014
Q2 Q3 Q4 Q1 2015
Vaca
ncy
%
U.S. INDUSTRIAL MARKET Q1 2013 - Q1 2015
Absorption MSF Completions MSF Vacancy %
8.1 7.7 7.5
7.2 7.0
7.9
2.0
6.0
10.0
14.0
-2.0 0.0 2.0 4.0 6.0 8.0
Edmonton, ABOttawa, ON
Saskatoon, SKWinnipeg, MB****
Victoria, BC****
Regina, SKCalgary, AB
Waterloo Region, ONMontréal, QC
Toronto, ONVancouver, BC
Millions
Currently U/C Q1-15 Absorption
**** - Q4 data displayed. These markets report semi-annually.
0.0 5.0 10.0 15.0 20.0
Savannah, GA
Indianapolis, INChicago, IL
New Jersey - Central
Dallas-Ft. Worth, TXLos Angeles, CA
New Jersey - NorthernAtlanta, GA
Houston, TXLos Angeles - Inland Empire, CA
Millions
Currently U/C Q1-15 Absorption
10.0%26.1%
16.7% 10.1% 11.1%
46.2%50.0%
39.1%
39.1%
66.7%
42.0%
45.7%
30.0%21.7%
56.5%
8.3%
39.1%34.6%
7.7%13.0%
4.3%8.3%
8.7% 8.6%
0%
20%
40%
60%
80%
100%
Midwest
Northe
ast South
West
Cana
da U.S. N.A.
Excluding renewals, of the leases signed this quarter, did most tenants Expand, Hold Steady or Contract?
Contract Holding Steady Expand N/A
46.2%
46.2%46.2%
7.7%
10.0%
50.0%
30.0%
10.0%10.0% 13.0%4.3%
21.7%
39.1%
26.1%
56.5%
39.1%
16.7%
66.7%
8.3%8.3% 8.7%
39.1%
42.0%
10.1%
8.6%
34.6%
45.7%
11.1%
70.0%
60.9%
38.5%
65.2%
59.4%
25.0%
54.3%
20.0%26.1%
53.8%
30.4%
31.9%
50.0%
34.6%
25.0%3.7%10.0% 13.0%
7.7%4.3%
8.7% 7.4%
0%
20%
40%
60%
80%
100%
Northe
astSo
uth
Midwest West U.S.
Cana
da N.A.
Provide a three month forecast for rents (relative to current quarter):
70.0% 38.5% 59.4%
25.0%
60.9% 65.2%54.3%
53.8%
20.0%26.1%
30.4%
31.9%
50.0%
34.6%
25.0%
8.7% 7.4%10.0% 13.0%
7.7%4.3%
Up Same Down N/A
80.0%
78.3%
46.2%
60.9%
66.7%
25.0%
60.5%
10.0% 4.3%
38.5%23.2%
50.0%
27.2%
17.4% 15.4% 8.7%25.0%
11.1%
1.4% 1.2%
0%
20%
40%
60%
80%
100%
Northe
astSo
uth
Midwest West U.S.
Cana
da N.A.
Provide a three-month forecast for vacancy levels (relative to current quarter):
Up Same Down N/A
80.0%
78.3%
46.2%
60.9%
66.7%
25.0%
60.5%
50.0%
27.2%
10.0% 4.3%
38.5%
10.0%10.0% 17.4% 15.4%
39.1%39.1%
8.7%
23.2%
25.0%11.1%

Absorption, Under Construction (SF)Select U.S. Markets | Q1 2015
Absorption, Under Construction (SF)Select Canada Markets | Q1 2015
ABSORPTION, UNDER CONSTRUCTION (SF) | SELECT MARKETS | Q1 2015
Rolling 4-Qtr Deal Volume Year over Year Change
-100%
0%
100%
200%
300%
$-
$20
$40
$60
Billi
ons
2007
2008
2009
2010
2011
2012
2013
2014
2015
-100%
0%
100%
200%
300%
$-
$20
$40
$60
Billi
ons
2007 2008 2009 2010 2011 2012 2013 2014 2015
Rolling 4-Qtr Deal Volume Year over Year Change
10.1%
9.9%
16.7%
2.5%
5.8%
4.9%
13.0%
33.3%
16.0%
65.2%
41.7%
61.7%
5.8%
4.9%
0% 20% 40% 60% 80% 100%
U.S.
Canada
N.A.
How would you characterize current industrial rents in your market?
N/A
DecliningBottoming
No Clear Direction
Increasing
Peaking
65.2%
41.7%
61.7% 4.9%
33.3%
16.0%9.9%
8.3% 16.7%
13.0% 5.8%10.1%
8.3%
8.8 8.7
8.3
8.1 7.7 7.5
7.2 7.0
0.0
4.0
8.0
12.0
0.0
20.0
40.0
60.0
80.0
Q1 2013
Q2 Q3 Q4 Q1 2014
Q2 Q3 Q4 Q1 2015
Vaca
ncy
%
U.S. INDUSTRIAL MARKET Q1 2013 - Q1 2015
Absorption MSF Completions MSF Vacancy %
8.1 7.7 7.5
7.2 7.0
7.9
2.0
6.0
10.0
14.0
-2.0 0.0 2.0 4.0 6.0 8.0
Edmonton, ABOttawa, ON
Saskatoon, SKWinnipeg, MB****
Victoria, BC****
Regina, SKCalgary, AB
Waterloo Region, ONMontréal, QC
Toronto, ONVancouver, BC
Millions
Currently U/C Q1-15 Absorption
**** - Q4 data displayed. These markets report semi-annually.
0.0 5.0 10.0 15.0 20.0
Savannah, GA
Indianapolis, INChicago, IL
New Jersey - Central
Dallas-Ft. Worth, TXLos Angeles, CA
New Jersey - NorthernAtlanta, GA
Houston, TXLos Angeles - Inland Empire, CA
Millions
Currently U/C Q1-15 Absorption
10.0%26.1%
16.7% 10.1% 11.1%
46.2%50.0%
39.1%
39.1%
66.7%
42.0%
45.7%
30.0%21.7%
56.5%
8.3%
39.1%34.6%
7.7%13.0%
4.3%8.3%
8.7% 8.6%
0%
20%
40%
60%
80%
100%
Midwest
Northe
ast South
West
Cana
da U.S. N.A.
Excluding renewals, of the leases signed this quarter, did most tenants Expand, Hold Steady or Contract?
Contract Holding Steady Expand N/A
46.2%
46.2%46.2%
7.7%
10.0%
50.0%
30.0%
10.0%10.0% 13.0%4.3%
21.7%
39.1%
26.1%
56.5%
39.1%
16.7%
66.7%
8.3%8.3% 8.7%
39.1%
42.0%
10.1%
8.6%
34.6%
45.7%
11.1%
70.0%
60.9%
38.5%
65.2%
59.4%
25.0%
54.3%
20.0%26.1%
53.8%
30.4%
31.9%
50.0%
34.6%
25.0%3.7%10.0% 13.0%
7.7%4.3%
8.7% 7.4%
0%
20%
40%
60%
80%
100%
Northe
astSo
uth
Midwest West U.S.
Cana
da N.A.
Provide a three month forecast for rents (relative to current quarter):
70.0% 38.5% 59.4%
25.0%
60.9% 65.2%54.3%
53.8%
20.0%26.1%
30.4%
31.9%
50.0%
34.6%
25.0%
8.7% 7.4%10.0% 13.0%
7.7%4.3%
Up Same Down N/A
80.0%
78.3%
46.2%
60.9%
66.7%
25.0%
60.5%
10.0% 4.3%
38.5%23.2%
50.0%
27.2%
17.4% 15.4% 8.7%25.0%
11.1%
1.4% 1.2%
0%
20%
40%
60%
80%
100%
Northe
astSo
uth
Midwest West U.S.
Cana
da N.A.
Provide a three-month forecast for vacancy levels (relative to current quarter):
Up Same Down N/A
80.0%
78.3%
46.2%
60.9%
66.7%
25.0%
60.5%
50.0%
27.2%
10.0% 4.3%
38.5%
10.0%10.0% 17.4% 15.4%
39.1%39.1%
8.7%
23.2%
25.0%11.1%
4 North American Research & Forecast Report | Q1 2015 | Industrial Market Outlook | Colliers International
Absorption
Net absorption was strong in Q1 at 63.1 MSF, broken out into 58.6 MSF in the U.S. and 4.5 MSF in Canada. We expect positive absorption to continue this year in the vast majority of markets. In fact, of the 81 markets in North America, we forecast negative absorption in only one: Calgary.
U.S. Q1 absorption was concentrated in a handful of markets, such as Los Angeles – Inland Empire, which saw absorption of 5.3 MSF, followed by Houston (3.8 MSF), Atlanta (3.7 MSF), Northern New Jersey (3.5 MSF), Los Angeles (3.5 MSF) and Dallas-Ft. Worth (3.0 MSF). Top Canadian markets for absorption were Vancouver (1.8 MSF) and Toronto (1.7 MSF).
Excluding renewals, of the leases signed this quarter, did most tenants expand, hold steady or contract?
Provide a three month forecast for rents (relative to current quarter):
**** Q4 data displayed. These markets report semi-annually.Source: Colliers International
Provide a three month forecast for vacancy (relative to current quarter):
% of reporting marketsSource: Colliers International
ABSORPTION, UNDER CONSTRUCTION (SF) | SELECT MARKETS | Q1 2015
Rolling 4-Qtr Deal Volume Year over Year Change
-100%
0%
100%
200%
300%
$-
$20
$40
$60
Billi
ons
2007
2008
2009
2010
2011
2012
2013
2014
2015
-100%
0%
100%
200%
300%
$-
$20
$40
$60
Billi
ons
2007 2008 2009 2010 2011 2012 2013 2014 2015
Rolling 4-Qtr Deal Volume Year over Year Change
10.1%
9.9%
16.7%
2.5%
5.8%
4.9%
13.0%
33.3%
16.0%
65.2%
41.7%
61.7%
5.8%
4.9%
0% 20% 40% 60% 80% 100%
U.S.
Canada
N.A.
How would you characterize current industrial rents in your market?
N/A
DecliningBottoming
No Clear Direction
Increasing
Peaking
65.2%
41.7%
61.7% 4.9%
33.3%
16.0%9.9%
8.3% 16.7%
13.0% 5.8%10.1%
8.3%
8.8 8.7
8.3
8.1 7.7 7.5
7.2 7.0
0.0
4.0
8.0
12.0
0.0
20.0
40.0
60.0
80.0
Q1 2013
Q2 Q3 Q4 Q1 2014
Q2 Q3 Q4 Q1 2015
Vaca
ncy
%
U.S. INDUSTRIAL MARKET Q1 2013 - Q1 2015
Absorption MSF Completions MSF Vacancy %
8.1 7.7 7.5
7.2 7.0
7.9
2.0
6.0
10.0
14.0
-2.0 0.0 2.0 4.0 6.0 8.0
Edmonton, ABOttawa, ON
Saskatoon, SKWinnipeg, MB****
Victoria, BC****
Regina, SKCalgary, AB
Waterloo Region, ONMontréal, QC
Toronto, ONVancouver, BC
Millions
Currently U/C Q1-15 Absorption
**** - Q4 data displayed. These markets report semi-annually.
0.0 5.0 10.0 15.0 20.0
Savannah, GA
Indianapolis, INChicago, IL
New Jersey - Central
Dallas-Ft. Worth, TXLos Angeles, CA
New Jersey - NorthernAtlanta, GA
Houston, TXLos Angeles - Inland Empire, CA
Millions
Currently U/C Q1-15 Absorption
10.0%26.1%
16.7% 10.1% 11.1%
46.2%50.0%
39.1%
39.1%
66.7%
42.0%
45.7%
30.0%21.7%
56.5%
8.3%
39.1%34.6%
7.7%13.0%
4.3%8.3%
8.7% 8.6%
0%
20%
40%
60%
80%
100%
Midwest
Northe
ast South
West
Cana
da U.S. N.A.
Excluding renewals, of the leases signed this quarter, did most tenants Expand, Hold Steady or Contract?
Contract Holding Steady Expand N/A
46.2%
46.2%46.2%
7.7%
10.0%
50.0%
30.0%
10.0%10.0% 13.0%4.3%
21.7%
39.1%
26.1%
56.5%
39.1%
16.7%
66.7%
8.3%8.3% 8.7%
39.1%
42.0%
10.1%
8.6%
34.6%
45.7%
11.1%
70.0%
60.9%
38.5%
65.2%
59.4%
25.0%
54.3%
20.0%26.1%
53.8%
30.4%
31.9%
50.0%
34.6%
25.0%3.7%10.0% 13.0%
7.7%4.3%
8.7% 7.4%
0%
20%
40%
60%
80%
100%
Northe
astSo
uth
Midwest West U.S.
Cana
da N.A.
Provide a three month forecast for rents (relative to current quarter):
70.0% 38.5% 59.4%
25.0%
60.9% 65.2%54.3%
53.8%
20.0%26.1%
30.4%
31.9%
50.0%
34.6%
25.0%
8.7% 7.4%10.0% 13.0%
7.7%4.3%
Up Same Down N/A
80.0%
78.3%
46.2%
60.9%
66.7%
25.0%
60.5%
10.0% 4.3%
38.5%23.2%
50.0%
27.2%
17.4% 15.4% 8.7%25.0%
11.1%
1.4% 1.2%
0%
20%
40%
60%
80%
100%
Northe
astSo
uth
Midwest West U.S.
Cana
da N.A.
Provide a three-month forecast for vacancy levels (relative to current quarter):
Up Same Down N/A
80.0%
78.3%
46.2%
60.9%
66.7%
25.0%
60.5%
50.0%
27.2%
10.0% 4.3%
38.5%
10.0%10.0% 17.4% 15.4%
39.1%39.1%
8.7%
23.2%
25.0%11.1%

Source: Colliers InternationalSource: Colliers International
5 North American Research & Forecast Report | Q1 2015 | Industrial Market Outlook | Colliers International
Construction Activity
Rising industrial demand is pushing new supply to pre-recession levels. Some 52 MSF of space came online in North America in Q1, including 49.7 MSF in the U.S. and 2.3 MSF in Canada. The quarterly volume of construction activity is at the highest level since Q4 2007 with no letup in sight. 166.3 MSF are under construction in North America, including 147.9 MSF in the U.S. and 18.4 MSF in Canada. Markets with the most new supply in the first quarter were Los Angeles – Inland Empire (6.5 MSF), Dallas – Ft. Worth (6.3 MSF), Houston (3.9 MSF), Indianapolis (3.2 MSF) and Columbus (2.5 MSF). In each of those markets virtually all of the new supply was in modern distribution centers characterized by higher ceilings and a larger footprint.
In Canada, almost half of new supply in Q1 was in Vancouver (1.1 MSF), while the other markets with the most new supply were Calgary (382,000 SF) and Waterloo, Ontario (263,000 SF). Vancouver’s growing inventory could reflect increased activity in Prince Rupert, which has access to rail lines that run parallel to the U.S. border and is a convenient feeder to distribution centers in Chicago. Toronto (8.0 MSF) and Calgary (4.1 MSF) have the most space under construction.
A sign of the times is that a large portion of the new supply (60%) in the United States is speculative. In Canada, 13.4 MSF of the 18.4 MSF under construction is speculative. So far, supply and demand have been in balance with enough tenant demand to fill the development pipeline over the next 12 to 18 months.
Transaction Activity
Investor demand for all segments of U.S. real estate remains strong, helping to lift industrial transaction volume to its highest level since the height of the last cycle. North American first-quarter volume reached a record $17.5 billion according to Real Capital Analytics, fueled by the Government of Singapore’s $8.1 billion acquisition of IndCor Properties from Blackstone. This transaction demonstrated several trends: the strong performance of U.S. real estate, demand for industrial portfolios and foreign
capital flowing into the U.S. Commercial real estate is in the midst of a positive fundamentals growth cycle, and expectations are for a continued reduction in the vacancy rate and continued rent growth. Investors are drawn to the industrial sector’s low volatility compared to office or retail product, and institutions looking in this sector are willing to pay a premium for portfolios in order to allocate large chunks of capital. Compared to other options, the United States remains an attractive investment location for non-U.S. investors. One such example is Norges Bank, controlled by the government of Norway, teaming up with ProLogis to buy a $5.9 billion industrial portfolio located in the United States from KTR Capital Partners.
Demand has kept upward pressure on asset values, as capitalization rates fell 20 bps in Q1 to 7.0%, the lowest level since 2007 and down 130 bps since 2010, according to RCA. Cap rates are lowest in the West, averaging 6.7%, followed by the South (7.2%), and the East and Midwest (7.3%). The Bay Area continues to have the lowest cap rates with Oakland at 4.9% and San Francisco Peninsula at 5.0%. Cap rates in Canada averaged 6.7% in Q1, with Vancouver (5.2%) and Toronto (5.5%) remaining the lowest. Although industrial is not a high-turnover sector, it is likely that a fair number of property owners will be tempted to sell while prices remain inflated.
Deal flow is dominated by the U.S., which represents about 98% of the first-quarter volume and 95% of deals over the last year. According to RCA, the trailing 12-month average of deals $2.5 million or more was $49.5 billion, up 22% from the year-earlier period and the most-active period since Q4 2007. U.S. investment volume was concentrated in California, which had the top five investment markets in Q1: Los Angeles ($1.6 billion), Orange County ($971 million), East Bay ($703 million), San Francisco ($633 million) and San Jose ($546 million).
Industrial Real Estate Indicators U.S.
GDP: -0.7% in Q1
Inventory 14.9 BSF
Vacancy 7.0% Nationwide (down 15 bps)
Net Absorption 58.6 MSF in Q1
New Supply 49.7 MSF in Q1, up 16.4% over Q4
New Supply to Inventory 1.3% annualizedNote: Up to 2% is considered healthy
Net Absorption to New Supply Ratio 1.2:1 Q1 2015 vs. 1.6:1 Q4 2014
• Top 10 Markets account for 49.7% of 58.6 MSF net absorption in Q1.
Top 5 MSAs Q1 Net Absorption
1. Los Angeles - Inland Empire 5.2 MSF
2. Houston 3.8 MSF
3. Atlanta 3.7 MSF
4. New Jersey - Northern 3.5 MSF
5. Los Angeles 3.4 MSF

6 North American Research & Forecast Report | Q1 2015 | Industrial Market Outlook | Colliers International
Conclusion and Outlook Strong economic and market fundamentals continue to paint a positive outlook for the industrial sector for the rest of 2015. This economic strength is underpinned by our expectations for stronger GDP and job growth during the rest of 2015, coupled with rising consumer optimism and lower gas prices. The industrial market will also benefit from secular trends such as the changing e-commerce landscape and traditional retailers such as Wal-Mart looking to occupy more modern and efficient distribution centers. Another trend is occupiers’ desire to embrace technology, which means consolidating facilities or outsourcing portions of their operations to third party logistics firms. Industrial demand is exceeding supply in select markets as companies need newer, better and larger spaces to meet the ongoing demands of their businesses. Vacancy rates are down to near historical lows in many markets, and there remains upward pressure on rents. Supply is increasing rapidly as well but is being easily absorbed due to pent-up industrial demand following the downturn and robust occupier demand for modern space. Transaction volume hit record highs while pushing cap rates to cyclical lows in Q1 2015. The industrial sector is vulnerable to a general economic slowdown or an exogenous event that affects exports and/or imports. Beyond that, the signs are very positive for industrial real estate in the short run.
14.3% 8.3% 6.2% 6.5%
38.1%43.5%
75.0%
38.5% 44.2%44.4%
11.1%11.1%
19.0%52.5%
16.7%
41.5% 37.7%28.6%
13.8% 11.7%100%
Midwest
Northea
stSout
hWest
Canada U.S.
N.A.
Excluding renewals, of the leases signed this quarter,didmost tenants Expand, Hold Steady or Contract?
44.4%
16.7%
58.3%
25.0%
Holding SteadyContract Expand N/A
13.8% 18.5% 56.9% 6.2%
16.7%
11.7%
8.3%
1.3%
3.9%
41.7%
22.1%
33.3%
53.2% 7.8%
0% 20% 40% 60% 80% 100%
U.S.
Canada
NorthAmerica
How would you characterize current industrial rents in your market?
N/A
DecliningBottoming
No Clear Direction
Increasing
Peaking
44.4% 42.9%58.3% 62.5% 53.8%
8.3%46.8%
55.6%
28.6%25.0% 30.4% 32.3%
75.0%
39.0%
100%
Northea
stSout
h
Midwest West U.S.
Canada N.A.
Provide a three month forecast for rents (relative to current quarter):
Up Same Down N/A
66.7%57.1% 50.0%
65.2% 60.0%
25.0%
11.1% 14.3%41.7% 30.4% 24.6%
41.7%
22.2% 28.6%8.3% 4.3% 15.4%
33.3%
100%
Northeas
tSout
hMidw
est West U.S.Cana
da
Provide a three month forecast for vacancy levels (relative to current quarter): Down Same Up
14.3% 8.3% 6.2% 6.5%
38.1%43.5%
75.0%
38.5% 44.2%44.4%
16.7%
41.5% 37.7%28.6%
4.2%4.2% 13.8% 11.7%16.7%
58.3%
25.0%
44.4%19.0%
13.8%
11.7%
8.3%
4.6%
18.5%
41.7%
22.1%
56.9%
33.3%
53.2%
6.2%
16.7%
7.8%
44.4% 42.9%58.3% 65.2% 53.8%
8.3%46.8%
55.6%
28.6%
28.6%28.6%25.0%16.7%16.7%
30.4%4.3%4.3%
32.3%
13.8%13.8%
75.0%
16.7% 2.6%11.7%2.6%11.7%16.7%
39.0%
66.7%57.1% 50.0%
65.2% 60.0%
25.0%
11.1% 14.3%41.7% 30.4% 24.6%
41.7%
22.2% 28.6%8.3% 4.3% 15.4%
33.3%
9.1 8.8 8.7 8.3 8.1 7.9 7.7 7.4 7.1
0.0
2.0
4.0
6.0
8.0
10.0
12.0
14.0
0.0
20.0
40.0
60.0
80.0
Q4 Q1 2013
Q2 Q3 Q4 Q1 2014
Q2 Q3 Q4
Vaca
ncy
%
Absorption MSF Completions MSF Vacancy %
9.1 8.8 8.7 8.3 8.1 7.9 7.7 7.4 7.1
Winnipeg, MBSaskatoon, SKHalifax, NS**
Victoria, BCToronto, ONRegina, SK
Ottawa, ON***Edmonton, AB
Waterloo Region, ONVancouver, BC
Montréal, QCCalgary, AB
-1.0 0.0 2.0 4.01.0 3.0
8.2
5.00.0 5.0 10.0 15.0 20.0Millions
Currently U/C Q4-14 Absorp Currently U/C Q4-14 Absorp
Millions
Savannah, GADallas-Ft. Worth, TX
Houston, TXLos Angeles, CAIndianapolis, IN
Los AngelesInland Empire, CA
Chicago, ILAtlanta, GA
-100%
-50%
0%
50%
100%
150%
200%
$0 $10 $20 $30 $40 $50 $60 $70 $80
2007 2008 2009 2010 2011 2012 2013 2014
Bil.
12-Month Trailing Volume (left-axis)
Year-Over-Year % Change (right-axis)
52.5%
Industrial Transaction Volume Q1 2015 - NA
Note: Latest data as of Q1 2015; all data are 12-month trailingSources: Real Capital Analytics, Colliers International
ABSORPTION, UNDER CONSTRUCTION (SF) | SELECT MARKETS | Q1 2015
Rolling 4-Qtr Deal Volume Year over Year Change
-100%
0%
100%
200%
300%
$-
$20
$40
$60
Billi
ons
2007
2008
2009
2010
2011
2012
2013
2014
2015
-100%
0%
100%
200%
300%
$-
$20
$40
$60
Billi
ons
2007 2008 2009 2010 2011 2012 2013 2014 2015
Rolling 4-Qtr Deal Volume Year over Year Change
10.1%
9.9%
16.7%
2.5%
5.8%
4.9%
13.0%
33.3%
16.0%
65.2%
41.7%
61.7%
5.8%
4.9%
0% 20% 40% 60% 80% 100%
U.S.
Canada
N.A.
How would you characterize current industrial rents in your market?
N/A
DecliningBottoming
No Clear Direction
Increasing
Peaking
65.2%
41.7%
61.7% 4.9%
33.3%
16.0%9.9%
8.3% 16.7%
13.0% 5.8%10.1%
8.3%
8.8 8.7
8.3
8.1 7.7 7.5
7.2 7.0
0.0
4.0
8.0
12.0
0.0
20.0
40.0
60.0
80.0
Q1 2013
Q2 Q3 Q4 Q1 2014
Q2 Q3 Q4 Q1 2015
Vaca
ncy
%
U.S. INDUSTRIAL MARKET Q1 2013 - Q1 2015
Absorption MSF Completions MSF Vacancy %
8.1 7.7 7.5
7.2 7.0
7.9
2.0
6.0
10.0
14.0
-2.0 0.0 2.0 4.0 6.0 8.0
Edmonton, ABOttawa, ON
Saskatoon, SKWinnipeg, MB****
Victoria, BC****
Regina, SKCalgary, AB
Waterloo Region, ONMontréal, QC
Toronto, ONVancouver, BC
Millions
Currently U/C Q1-15 Absorption
**** - Q4 data displayed. These markets report semi-annually.
0.0 5.0 10.0 15.0 20.0
Savannah, GA
Indianapolis, INChicago, IL
New Jersey - Central
Dallas-Ft. Worth, TXLos Angeles, CA
New Jersey - NorthernAtlanta, GA
Houston, TXLos Angeles - Inland Empire, CA
Millions
Currently U/C Q1-15 Absorption
10.0%26.1%
16.7% 10.1% 11.1%
46.2%50.0%
39.1%
39.1%
66.7%
42.0%
45.7%
30.0%21.7%
56.5%
8.3%
39.1%34.6%
7.7%13.0%
4.3%8.3%
8.7% 8.6%
0%
20%
40%
60%
80%
100%
Midwest
Northe
ast South
West
Cana
da U.S. N.A.
Excluding renewals, of the leases signed this quarter, did most tenants Expand, Hold Steady or Contract?
Contract Holding Steady Expand N/A
46.2%
46.2%46.2%
7.7%
10.0%
50.0%
30.0%
10.0%10.0% 13.0%4.3%
21.7%
39.1%
26.1%
56.5%
39.1%
16.7%
66.7%
8.3%8.3% 8.7%
39.1%
42.0%
10.1%
8.6%
34.6%
45.7%
11.1%
70.0%
60.9%
38.5%
65.2%
59.4%
25.0%
54.3%
20.0%26.1%
53.8%
30.4%
31.9%
50.0%
34.6%
25.0%3.7%10.0% 13.0%
7.7%4.3%
8.7% 7.4%
0%
20%
40%
60%
80%
100%
Northe
astSo
uth
Midwest West U.S.
Cana
da N.A.
Provide a three month forecast for rents (relative to current quarter):
70.0% 38.5% 59.4%
25.0%
60.9% 65.2%54.3%
53.8%
20.0%26.1%
30.4%
31.9%
50.0%
34.6%
25.0%
8.7% 7.4%10.0% 13.0%
7.7%4.3%
Up Same Down N/A
80.0%
78.3%
46.2%
60.9%
66.7%
25.0%
60.5%
10.0% 4.3%
38.5%23.2%
50.0%
27.2%
17.4% 15.4% 8.7%25.0%
11.1%
1.4% 1.2%
0%
20%
40%
60%
80%
100%
Northe
astSo
uth
Midwest West U.S.
Cana
da N.A.
Provide a three-month forecast for vacancy levels (relative to current quarter):
Up Same Down N/A
80.0%
78.3%
46.2%
60.9%
66.7%
25.0%
60.5%
50.0%
27.2%
10.0% 4.3%
38.5%
10.0%10.0% 17.4% 15.4%
39.1%39.1%
8.7%
23.2%
25.0%11.1%
North American Industrial Overview | Q1 2015NORTH AMERICA CANADA UNITED STATES WEST MIDWEST SOUTH NORTHEAST
# of Markets 81 12 69 23 13 23 10
Inventory (Millions SF) 16,700.1 1,794.1 14,906.1 3,867.9 4,261.3 4,508.3 2,268.5
% of N.A. Inventory 100.0% 10.7% 89.3% 23.2% 25.5% 27.0% 13.6%
New Supply (Millions SF) 52.0 2.3 49.7 13.9 13.6 17.0 5.2
% of N.A. New Supply 100.0% 4.5% 95.5% 26.7% 26.1% 32.7% 10.0%
Vacancy (%) 6.7% 3.8% 7.0% 5.1% 6.8% 7.9% 8.8%
Absorption (Millions SF) 63.1 4.5 58.6 21.4 10.8 19.1 7.4
% of N.A. Absorption 100.0% 7.1% 92.9% 33.9% 17.0% 30.3% 11.7%
Sources: Real Capital Analytics, Colliers International
The Top Five MSAs in Transaction Volume Q1 2015
1. Los Angeles $1.6 bil.
2. Orange County $971 mil.
3. East Bay $703 mil.
4. San Francisco $633 mil.
5. San Jose $546 mil.
7 North American Research & Forecast Report | Q1 2015 | Industrial Market Outlook | Colliers International
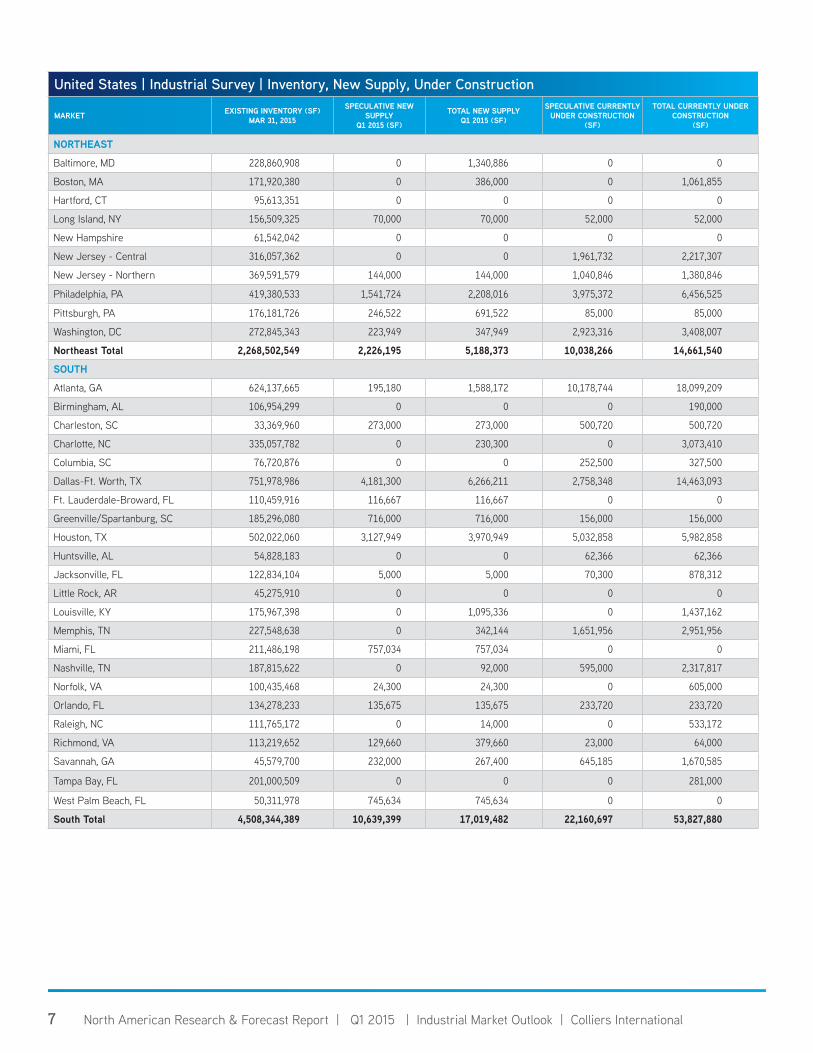
United States | Industrial Survey | Inventory, New Supply, Under Construction
MARKET EXISTING INVENTORY (SF) MAR 31, 2015
SPECULATIVE NEW SUPPLY
Q1 2015 (SF)
TOTAL NEW SUPPLY Q1 2015 (SF)
SPECULATIVE CURRENTLY UNDER CONSTRUCTION
(SF)
TOTAL CURRENTLY UNDER CONSTRUCTION
(SF)
NORTHEAST
Baltimore, MD 228,860,908 0 1,340,886 0 0
Boston, MA 171,920,380 0 386,000 0 1,061,855
Hartford, CT 95,613,351 0 0 0 0
Long Island, NY 156,509,325 70,000 70,000 52,000 52,000
New Hampshire 61,542,042 0 0 0 0
New Jersey - Central 316,057,362 0 0 1,961,732 2,217,307
New Jersey - Northern 369,591,579 144,000 144,000 1,040,846 1,380,846
Philadelphia, PA 419,380,533 1,541,724 2,208,016 3,975,372 6,456,525
Pittsburgh, PA 176,181,726 246,522 691,522 85,000 85,000
Washington, DC 272,845,343 223,949 347,949 2,923,316 3,408,007
Northeast Total 2,268,502,549 2,226,195 5,188,373 10,038,266 14,661,540
SOUTH
Atlanta, GA 624,137,665 195,180 1,588,172 10,178,744 18,099,209
Birmingham, AL 106,954,299 0 0 0 190,000
Charleston, SC 33,369,960 273,000 273,000 500,720 500,720
Charlotte, NC 335,057,782 0 230,300 0 3,073,410
Columbia, SC 76,720,876 0 0 252,500 327,500
Dallas-Ft. Worth, TX 751,978,986 4,181,300 6,266,211 2,758,348 14,463,093
Ft. Lauderdale-Broward, FL 110,459,916 116,667 116,667 0 0
Greenville/Spartanburg, SC 185,296,080 716,000 716,000 156,000 156,000
Houston, TX 502,022,060 3,127,949 3,970,949 5,032,858 5,982,858
Huntsville, AL 54,828,183 0 0 62,366 62,366
Jacksonville, FL 122,834,104 5,000 5,000 70,300 878,312
Little Rock, AR 45,275,910 0 0 0 0
Louisville, KY 175,967,398 0 1,095,336 0 1,437,162
Memphis, TN 227,548,638 0 342,144 1,651,956 2,951,956
Miami, FL 211,486,198 757,034 757,034 0 0
Nashville, TN 187,815,622 0 92,000 595,000 2,317,817
Norfolk, VA 100,435,468 24,300 24,300 0 605,000
Orlando, FL 134,278,233 135,675 135,675 233,720 233,720
Raleigh, NC 111,765,172 0 14,000 0 533,172
Richmond, VA 113,219,652 129,660 379,660 23,000 64,000
Savannah, GA 45,579,700 232,000 267,400 645,185 1,670,585
Tampa Bay, FL 201,000,509 0 0 0 281,000
West Palm Beach, FL 50,311,978 745,634 745,634 0 0
South Total 4,508,344,389 10,639,399 17,019,482 22,160,697 53,827,880

8 North American Research & Forecast Report | Q1 2015 | Industrial Market Outlook | Colliers International8
United States | Industrial Survey | Inventory, New Supply, Under Construction
MARKET EXISTING INVENTORY (SF) MAR 31, 2015
SPECULATIVE NEW SUPPLY
Q1 2015 (SF)
TOTAL NEW SUPPLY Q1 2015 (SF)
SPECULATIVE CURRENTLY UNDER CONSTRUCTION
(SF)
TOTAL CURRENTLY UNDER CONSTRUCTION
(SF)
MIDWEST
Chicago, IL 1,323,916,290 985,780 1,841,826 3,739,008 12,593,763
Cincinnati, OH 247,757,995 0 1,203,450 2,115,000 2,480,000
Cleveland, OH 393,910,588 0 0 209,000 454,000
Columbus, OH 222,653,403 1,934,128 2,463,688 0 1,822,000
Dayton, OH 104,935,425 0 1,830,000 0 1,765,500
Detroit, MI 523,920,511 0 973,358 0 1,192,859
Grand Rapids, MI 113,836,643 55,864 55,864 95,000 337,010
Indianapolis, IN 286,926,467 2,284,844 3,182,302 1,926,310 2,258,479
Kansas City, MO-KS 236,657,808 169,498 445,058 2,700,000 4,395,453
Milwaukee, WI 224,171,500 132,000 778,263 122,000 202,089
Minneapolis/St. Paul, MN 244,390,992 686,500 821,500 1,495,004 2,650,068
Omaha, NE 68,321,636 0 0 133,919 274,970
St. Louis, MO 269,948,430 0 0 0 1,529,137
Midwest Total 4,261,347,688 6,248,614 13,595,309 12,535,241 31,955,328
WEST
Albuquerque, NM 37,203,914 0 0 0 0
Bakersfield, CA 35,467,111 0 1,250,000 181,200 2,238,800
Boise, ID**** 46,373,012 0 131,305 0 80,480
Denver, CO 219,699,952 392,425 488,347 1,071,277 1,120,704
Fairfield, CA 47,633,941 136,275 136,275 1,087,394 1,861,970
Fresno, CA 67,774,220 0 0 62,680 62,680
Honolulu, HI 39,259,344 0 0 0 0
Las Vegas, NV 118,191,313 0 0 464,203 1,853,728
Los Angeles - Inland Empire, CA 446,449,500 6,520,700 6,520,700 10,829,234 13,340,800
Los Angeles, CA 891,806,800 768,300 768,300 3,153,100 3,153,100
Oakland, CA 142,563,820 0 0 1,107,634 1,107,634
Orange County, CA 184,169,900 0 0 473,600 473,600
Phoenix, AZ 284,890,635 684,420 1,089,857 1,361,131 2,311,979
Pleasanton/Tri-Valley, CA 17,391,991 0 0 0 1,298,207
Portland, OR 192,809,015 0 476,980 0 5,329,087
Reno, NV 85,207,063 0 1,227,000 0 5,724,000
Sacramento, CA 161,910,565 0 0 884,041 1,375,188
San Diego, CA 187,338,767 31,058 31,058 316,000 316,000
San Francisco Peninsula, CA 39,196,141 0 0 0 0
San Jose - Silicon Valley, CA 249,910,294 691,218 691,218 47,917 221,213
Seattle/Puget Sound, WA 257,188,858 831,127 831,127 3,662,518 3,662,518
Stockton/San Joaquin County, CA 97,772,885 257,000 257,000 1,756,062 1,910,055
Walnut Creek, CA 17,649,288 0 0 54,430 54,430
West Total 3,867,858,329 10,312,523 13,899,167 26,512,421 47,496,173
U.S. TOTALS 14,906,052,955 29,426,731 49,702,331 71,246,625 147,940,921
(continued)
**** Q4-14 data displayed

9 North American Research & Forecast Report | Q1 2015 | Industrial Market Outlook | Colliers International
United States | Industrial Survey | Absorption, Vacancy
MARKET ABSORPTION Q1 2015 (SF)
VACANCY RATE DEC 31, 2014
VACANCY RATE MAR 31, 2015
QUARTERLY CHANGE IN VACANCY
NORTHEAST
Baltimore, MD 1,168,895 9.1% 9.1% 0.0%
Boston, MA -26,972 17.8% 18.0% 0.2%
Hartford, CT -552,006 8.4% 8.9% 0.6%
Long Island, NY 43,189 4.8% 4.8% 0.0%
New Hampshire -263,432 8.4% 8.8% 0.4%
New Jersey - Central 1,438,368 8.1% 7.6% -0.5%
New Jersey - Northern 3,461,022 8.0% 7.1% -0.9%
Philadelphia, PA 1,260,623 8.6% 8.8% 0.2%
Pittsburgh, PA 755,183 7.5% 7.4% -0.1%
Washington, DC 68,462 9.8% 9.8% 0.0%
Northeast Total 7,353,332 8.9% 8.8% -0.1%
SOUTH
Atlanta, GA 3,731,664 9.0% 8.6% -0.4%
Birmingham, AL 275,423 10.2% 10.0% -0.3%
Charleston, SC 601,627 7.3% 6.2% -1.0%
Charlotte, NC 970,950 10.6% 10.4% -0.2%
Columbia, SC 214,010 9.1% 8.9% -0.3%
Dallas-Ft. Worth, TX 3,027,905 7.8% 8.0% 0.2%
Ft. Lauderdale-Broward, FL 297,181 7.4% 7.2% -0.2%
Greenville/Spartanburg, SC -353,063 7.3% 7.8% 0.5%
Houston, TX 3,773,225 4.9% 4.8% -0.1%
Huntsville, AL -258,250 8.0% 8.5% 0.5%
Jacksonville, FL -281,551 7.8% 8.1% 0.2%
Little Rock, AR 393,161 11.8% 10.8% -0.9%
Louisville, KY -289,517 6.3% 6.8% 0.5%
Memphis, TN 602,115 12.1% 11.8% -0.3%
Miami, FL 1,551,039 5.7% 5.4% -0.3%
Nashville, TN 1,097,009 7.3% 6.8% -0.5%
Norfolk, VA 347,547 8.2% 7.8% -0.3%
Orlando, FL 939,440 8.9% 8.4% -0.5%
Raleigh, NC 273,319 8.4% 8.2% -0.2%
Richmond, VA 407,395 8.0% 7.9% -0.1%
Savannah, GA 355,762 5.5% 5.2% -0.2%
Tampa Bay, FL 1,027,398 8.6% 8.0% -0.6%
West Palm Beach, FL 445,908 5.4% 5.9% 0.5%
South Total 19,149,697 8.0% 7.9% -0.1%

10 North American Research & Forecast Report | Q1 2015 | Industrial Market Outlook | Colliers International10
United States | Industrial Survey | Absorption, Vacancy
MARKET ABSORPTION Q1 2015 (SF)
VACANCY RATE DEC 31, 2014
VACANCY RATE MAR 31, 2015
QUARTERLY CHANGE IN VACANCY
MIDWEST
Chicago, IL 1,181,377 7.7% 7.6% -0.1%
Cincinnati, OH 1,580,430 5.5% 4.8% -0.7%
Cleveland, OH 781,187 5.7% 5.5% -0.2%
Columbus, OH 1,590,452 5.4% 5.7% 0.3%
Dayton, OH 1,628,842 10.1% 10.4% 0.3%
Detroit, MI 932,851 7.9% 7.7% -0.3%
Grand Rapids, MI 37,814 6.2% 6.1% 0.0%
Indianapolis, IN 877,336 6.5% 7.3% 0.7%
Kansas City, MO-KS 455,913 6.3% 6.3% 0.0%
Milwaukee, WI 1,032,069 5.7% 5.3% -0.4%
Minneapolis/St. Paul, MN 682,925 7.0% 7.0% 0.0%
Omaha, NE 112,947 2.9% 2.7% -0.2%
St. Louis, MO -141,988 7.0% 7.1% 0.1%
Midwest Total 10,752,155 6.9% 6.8% -0.1%
WEST
Albuquerque, NM -104,083 6.9% 7.1% 0.3%
Bakersfield, CA 800,027 2.2% 3.4% 1.2%
Boise, ID**** 382,442 4.2% 3.7% -0.6%
Denver, CO 915,032 4.2% 4.0% -0.2%
Fairfield, CA -40,249 5.8% 6.1% 0.4%
Fresno, CA 27,819 5.6% 5.6% 0.0%
Honolulu, HI 26,441 2.1% 2.0% -0.1%
Las Vegas, NV 881,332 8.9% 8.2% -0.7%
Los Angeles - Inland Empire, CA 5,256,200 4.5% 4.5% 0.0%
Los Angeles, CA 3,457,400 2.3% 1.9% -0.4%
Oakland, CA 42,088 3.9% 3.9% 0.0%
Orange County, CA -272,500 3.1% 3.3% 0.1%
Phoenix, AZ 1,539,476 12.0% 11.8% -0.2%
Pleasanton/Tri-Valley, CA -122,394 6.4% 6.4% 0.1%
Portland, OR 1,029,599 5.7% 5.4% -0.3%
Reno, NV 892,227 8.0% 8.3% 0.3%
Sacramento, CA 1,026,455 11.2% 10.6% -0.6%
San Diego, CA 1,351,506 6.8% 6.1% -0.7%
San Francisco Peninsula, CA 180,024 3.0% 2.5% -0.5%
San Jose - Silicon Valley, CA 1,371,033 7.3% 6.8% -0.5%
Seattle/Puget Sound, WA 1,632,426 4.8% 4.4% -0.3%
Stockton/San Joaquin County, CA 1,189,179 8.3% 7.3% -1.0%
Walnut Creek, CA -87,484 6.9% 7.4% 0.4%
West Total 21,373,996 5.4% 5.1% -0.3%
U.S. TOTALS 58,629,180 7.2% 7.0% -0.2%
(continued)
**** Q4-14 data displayed

11 North American Research & Forecast Report | Q1 2015 | Industrial Market Outlook | Colliers International
United States | Industrial Survey | 3-Month Forecasts, Sales Price, Cap Rates
MARKET VACANCY FORECAST (3 MONTHS)**
RENT FORECAST (3 MONTHS)**
ABSORPTION FORECAST (3 MONTHS)**
SALES PRICE (USD/SF)
CAP RATE
NORTHEAST
Baltimore, MD Down Up Positive $71.96 7.3%
Boston, MA Same Up Close to zero $81.00 7.8%
Hartford, CT Down Same Positive $38.00 8.5%
Long Island, NY Down Up Positive $88.00 8.0%
New Hampshire N/A N/A N/A N/A N/A
New Jersey - Central Down Up Positive $105.76 N/A
New Jersey - Northern Down Up Positive $103.27 6.6%
Philadelphia, PA Down Up Positive $63.46 6.7%
Pittsburgh, PA Down Up Positive $55.00 7.5%
Washington, DC Down Same Positive $100.00 6.0%
Northeast Average* $78.49 7.3%
SOUTH
Atlanta, GA Down Up Positive $45.00 7.8%
Birmingham, AL Down Up Positive N/A N/A
Charleston, SC Down Up Positive N/A N/A
Charlotte, NC Down N/A Positive N/A N/A
Columbia, SC Down Up Positive $22.00 N/A
Dallas-Ft. Worth, TX Up Same Positive N/A N/A
Ft. Lauderdale-Broward, FL Down Up Positive $79.01 7.2%
Greenville/Spartanburg, SC Down Up Positive N/A N/A
Houston, TX Up Same Positive $67.00 6.2%
Huntsville, AL Down Up Positive N/A N/A
Jacksonville, FL Up Same Positive $58.00 7.5%
Little Rock, AR Same Same Close to zero $65.45 9.0%
Louisville, KY Up N/A Positive N/A N/A
Memphis, TN Down Up Positive $35.00 7.5%
Miami, FL Down Up Positive $67.89 6.2%
Nashville, TN Down Up Positive $47.00 8.4%
Norfolk, VA Down Same Positive N/A N/A
Orlando, FL Down Same Positive $60.00 7.0%
Raleigh, NC Down N/A Positive N/A N/A
Richmond, VA Down Up Positive N/A N/A
Savannah, GA Down Up Positive $36.00 7.5%
Tampa Bay, FL Down Up Positive $42.00 5.0%
West Palm Beach, FL Down Up Positive $81.66 N/A
South Average* $54.31 7.2%
* Straight averages used** Forecasts for Warehouse space

12 North American Research & Forecast Report | Q1 2015 | Industrial Market Outlook | Colliers International12
* Straight averages used** Forecasts for Warehouse space**** Q4-14 data displayed
United States | Industrial Survey | 3-Month Forecasts, Sales Price, Cap Rates
MARKET VACANCY FORECAST (3 MONTHS)**
RENT FORECAST (3 MONTHS)**
ABSORPTION FORECAST (3 MONTHS)**
SALES PRICE (USD/SF)
CAP RATE
MIDWEST
Chicago, IL Down Same Positive $61.00 5.4%
Cincinnati, OH Same Up Positive $45.00 7.8%
Cleveland, OH Down Same Positive $31.00 N/A
Columbus, OH Down Up Positive $43.76 N/A
Dayton, OH Same Same Close to zero N/A N/A
Detroit, MI Down Same Positive $70.00 8.3%
Grand Rapids, MI Same Up Close to zero N/A N/A
Indianapolis, IN Up Same Positive $56.00 7.0%
Kansas City, MO-KS Same Same Positive N/A N/A
Milwaukee, WI Same Up Positive $55.00 8.2%
Minneapolis/St. Paul, MN Up Same Positive $54.00 7.2%
Omaha, NE Down Up Close to zero N/A N/A
St. Louis, MO Down N/A Positive N/A N/A
Midwest Average* $51.97 7.3%
WEST
Albuquerque, NM Same Same Close to zero $83.50 7.7%
Bakersfield, CA Same Same Positive $42.00 10.0%
Boise, ID**** Same Same Close to zero N/A N/A
Denver, CO Down Up Positive $69.45 6.2%
Fairfield, CA Down Same Positive N/A N/A
Fresno, CA Same Same Close to zero $65.02 8.2%
Honolulu, HI Down Up Positive N/A N/A
Las Vegas, NV Down Up Positive $99.57 N/A
Los Angeles - Inland Empire, CA Same Up Positive $80.00 6.5%
Los Angeles, CA Same Up Positive $95.00 6.3%
Oakland, CA Down Up Positive $130.00 4.9%
Orange County, CA Same Same Close to zero $115.00 6.3%
Phoenix, AZ Down Up Positive $73.00 7.7%
Pleasanton/Tri-Valley, CA Down Up Positive $80.77 6.5%
Portland, OR Down Up Positive $72.18 6.7%
Reno, NV Down N/A Positive N/A N/A
Sacramento, CA Down Up Positive $56.08 6.0%
San Diego, CA Down Up Positive $110.95 5.6%
San Francisco Peninsula, CA Same Up Positive $180.00 5.0%
San Jose - Silicon Valley, CA Down Same Positive $206.00 N/A
Seattle/Puget Sound, WA Down Up Positive $158.00 6.7%
Stockton/San Joaquin County, CA Down Up Positive N/A N/A
Walnut Creek, CA Same Up Close to zero N/A N/A
West Average* $100.97 6.7%
U.S. AVERAGE* $75.42 7.0%
(continued)

13 North American Research & Forecast Report | Q1 2015 | Industrial Market Outlook | Colliers International
United States | Industrial Survey | Average Asking NNN Rents As Of Mar 2015
MARKET WAREHOUSE / DISTRIBUTION SPACE (USD/SF/YR)
BULK SPACE (USD/SF/YR)
FLEX SERVICE SPACE (USD/SF/YR)
TECH / R&D SPACE (USD/SF/YR)
NORTHEAST
Baltimore, MD $4.69 $4.69 $10.59 N/A
Boston, MA $6.23 $5.90 $7.57 $12.28
Hartford, CT $3.89 $5.88 $7.89 $6.50
Long Island, NY $9.46 $9.46 $15.89 N/A
New Hampshire $5.18 N/A $5.56 $8.31
New Jersey - Central $4.95 $4.39 $11.73 N/A
New Jersey - Northern $6.06 $5.55 $9.68 N/A
Philadelphia, PA $4.35 $4.26 $7.50 $11.25
Pittsburgh, PA $4.74 $4.74 $12.21 $12.21
Washington, DC $7.08 $6.04 $11.86 $13.49
Northeast Average* $5.66 $5.66 $10.05 $10.67
SOUTH
Atlanta, GA $3.44 $3.15 $7.84 $11.04
Birmingham, AL $4.12 $3.45 $6.47 N/A
Charleston, SC $4.19 $4.53 $9.65 N/A
Charlotte, NC $3.69 $3.63 $8.06 N/A
Columbia, SC $3.16 $3.21 $8.24 N/A
Dallas-Ft. Worth, TX $3.45 $2.90 $7.50 $8.95
Ft. Lauderdale-Broward, FL $7.46 $6.40 $11.30 $6.77
Greenville/Spartanburg, SC $3.39 $3.52 $7.75 N/A
Houston, TX $6.15 $4.65 $11.57 $12.16
Huntsville, AL $4.67 $5.36 $5.71 N/A
Jacksonville, FL $3.84 $3.96 $9.20 N/A
Little Rock, AR $3.71 $3.12 $6.41 N/A
Louisville, KY $3.64 $3.68 $6.36 N/A
Memphis, TN $2.51 $2.72 $5.08 $9.75
Miami, FL $9.07 $8.23 $13.32 $14.89
Nashville, TN $4.61 $3.27 $8.13 $7.53
Norfolk, VA $4.66 $4.28 $8.09 $10.35
Orlando, FL $4.83 $4.64 $9.39 $9.10
Raleigh, NC $4.29 $4.89 $10.51 N/A
Richmond, VA $3.93 $3.81 $8.10 $9.98
Savannah, GA $3.95 $3.75 $7.00 $10.00
Tampa Bay, FL $4.33 $4.28 $8.03 $6.17
West Palm Beach, FL $8.75 $7.14 $12.02 N/A
South Average* $4.60 $4.29 $8.51 $9.72
* Straight averages used

14 North American Research & Forecast Report | Q1 2015 | Industrial Market Outlook | Colliers International14
United States | Industrial Survey | Average Asking NNN Rents As Of Mar 2015
MARKET WAREHOUSE / DISTRIBUTION SPACE (USD/SF/YR)
BULK SPACE (USD/SF/YR)
FLEX SERVICE SPACE (USD/SF/YR)
TECH / R&D SPACE (USD/SF/YR)
MIDWEST
Chicago, IL $4.34 $3.53 $9.50 N/A
Cincinnati, OH $3.54 $3.07 $6.84 $6.84
Cleveland, OH $3.24 $3.24 $6.30 $6.30
Columbus, OH $3.00 $3.00 $5.25 $5.25
Dayton, OH $2.45 $3.14 $4.52 $4.52
Detroit, MI $4.36 $3.50 $7.93 $7.07
Grand Rapids, MI $2.94 $3.08 $4.57 $4.57
Indianapolis, IN $3.00 $3.30 $4.00 $9.00
Kansas City, MO-KS $4.41 $3.97 $8.15 $7.40
Milwaukee, WI $4.32 $3.44 $5.35 N/A
Minneapolis/St. Paul, MN $5.10 $5.00 $7.00 $7.50
Omaha, NE $3.88 $3.65 $6.65 $5.04
St. Louis, MO $3.84 $3.84 $8.24 N/A
Midwest Average* $3.72 $3.52 $6.48 $6.35
WEST
Albuquerque, NM $5.27 $4.29 $9.49 $9.49
Bakersfield, CA $4.00 $3.42 $8.00 N/A
Boise, ID*** $5.30 $5.73 $6.45 N/A
Denver, CO $6.45 $5.13 $10.14 $10.83
Fairfield, CA $5.35 $5.70 $7.36 $9.65
Fresno, CA $4.30 $3.12 $4.73 $4.65
Honolulu, HI $13.80 N/A N/A N/A
Las Vegas, NV $5.64 $5.08 $6.72 $9.84
Los Angeles - Inland Empire, CA $5.26 $4.93 $7.15 $7.75
Los Angeles, CA $7.04 $5.76 $9.25 $12.50
Oakland, CA $6.48 $6.20 $6.58 $10.08
Orange County, CA $8.04 $7.30 $14.50 $11.05
Phoenix, AZ $5.67 $4.54 $11.95 $11.63
Pleasanton/Tri-Valley, CA $6.12 $6.12 N/A N/A
Portland, OR $5.36 $4.67 $11.29 $9.70
Reno, NV $4.19 $3.86 $7.18 N/A
Sacramento, CA $4.80 $3.48 $8.40 $8.52
San Diego, CA $8.28 $7.56 $12.48 $17.52
San Francisco Peninsula, CA $10.32 $10.32 $35.76 $35.76
San Jose - Silicon Valley, CA $8.52 $6.34 $9.48 $19.32
Seattle/Puget Sound, WA $6.00 $5.46 $13.76 $15.17
Stockton/San Joaquin County, CA $3.96 $4.08 $5.88 $6.60
Walnut Creek, CA $4.48 N/A N/A $13.52
West Average* $6.29 $5.39 $10.33 $12.42
U.S. AVERAGE* $5.15 $4.67 $8.89 $10.17
(continued)
* Straight averages used**** Q4-14 data displayed

15 North American Research & Forecast Report | Q1 2015 | Industrial Market Outlook | Colliers International
Canada | Industrial Survey | Inventory, New Supply, Under Construction
MARKET INVENTORY (SF) MAR 31, 2015
SPECULATIVE NEW SUPPLY Q1 2015 (SF)
TOTAL NEW SUPPLY Q1 2015 (SF)
SPECULATIVE CURRENTLY UNDER CONSTRUCTION
(SF)
TOTAL CURRENTLY UNDER CONSTRUCTION (SF)
Calgary, AB 132,832,729 382,303 382,303 3,365,849 4,081,449
Edmonton, AB 137,237,718 0 0 2,470,788 2,952,803
Montréal, QC 324,958,553 0 250,000 677,637 892,637
Ottawa, ON 44,287,959 191,600 191,600 0 0
Regina, SK 18,153,953 16,720 39,095 243,700 268,140
Saskatoon, SK 21,926,916 80,916 80,916 318,392 318,392
Toronto, ON 764,787,312 0 0 5,560,943 8,020,943
Vancouver, BC 193,133,536 464,503 1,107,954 776,482 1,251,510
Victoria, BC**** 9,159,327 0 0 0 0
Waterloo Region, ON 59,810,113 247,933 263,049 19,987 275,877
Winnipeg, MB**** 80,157,082 0 0 0 304,000
CANADA TOTAL 1,794,092,392 1,383,975 2,314,917 13,433,778 18,365,751
Canada | Industrial Survey | Absorption, Vacancy RateMARKET ABSORPTION
Q1 2015 (SF)VACANCY RATE
DEC 31, 2014VACANCY RATE MAR 31, 2015
QUARTER CHANGE IN VACANCY
Calgary, AB 93,225 3.8% 4.2% 0.4%
Edmonton, AB -392,350 2.2% 2.5% 0.3%
Montréal, QC 1,001,483 4.0% 3.7% -0.2%
Ottawa, ON -53,786 3.8% 4.6% 0.8%
Regina, SK 34,342 2.0% 2.0% 0.0%
Saskatoon, SK -1,464 5.6% 5.9% 0.4%
Toronto, ON 1,664,752 3.8% 3.6% -0.2%
Vancouver, BC 1,774,088 3.9% 3.6% -0.4%
Victoria, BC**** 0 4.6% 4.6% 0.0%
Waterloo Region, ON 354,499 7.0% 6.9% -0.1%
Winnipeg, MB**** 0 3.8% 3.8% 0.0%
CANADA TOTAL 4,474,789 3.9% 3.8% -0.1%
Canada | Industrial Survey | 3-Month Forecasts, Sales Price, Cap RatesMARKET VACANCY FORECAST
(3 MONTHS)**RENT FORECAST (3 MONTHS)**
ABSORPTION FORECAST (3 MONTHS)**
SALES PRICE (CAD/SF)
CAP RATE
Calgary, AB Up Down Negative $175.00 6.5%
Edmonton, AB Up Down Positive $164.58 7.0%
Montréal, QC Same Same Close to zero $65.00 7.3%
Ottawa, ON Same Up Close to zero $125.00 6.8%
Regina, SK Same Same Positive $168.00 7.0%
Saskatoon, SK Up Down Close to zero $165.00 7.2%
Toronto, ON Same Same Positive $86.98 5.5%
Vancouver, BC Down Up Positive $188.00 5.2%
Victoria, BC**** Same Same Positive $195.00 7.5%
Waterloo Region, ON Down Up Positive $71.00 7.0%
Winnipeg, MB**** Same Same Close to zero $100.00 7.0%
CANADA AVERAGES* $136.69 6.7%
* Straight averages used.** Forecasts are for warehouse/distribution space.**** Q4-14 data displayed. These markets report semi-annually.

16 North American Research & Forecast Report | Q1 2015 | Industrial Market Outlook | Colliers International
Canada | Industrial Survey | Average Asking Rents As Of Mar 2015
MARKETWAREHOUSE/
DISTRIBUTION SPACE (CAD/SF/YR)
BULK SPACE (CAD/SF/YR)
FLEX/SERVICE SPACE (CAD/SF/YR)
TECH/ R&D SPACE (CAD/SF/YR)
Calgary, AB $9.50 $8.25 $12.50 $12.50
Edmonton, AB $8.30 $7.80 $10.20 $17.00
Montréal, QC $4.75 $4.25 $5.75 $8.00
Ottawa, ON $8.00 $8.00 $10.00 $12.00
Regina, SK $11.00 $10.00 $12.00 $13.75
Saskatoon, SK $11.00 $10.00 $9.50 $14.00
Toronto, ON $5.24 $5.64 N/A N/A
Vancouver, BC $8.19 $7.64 $8.88 $14.00
Victoria, BC**** $11.50 $10.00 $13.50 $13.50
Waterloo Region, ON $4.99 $4.90 $8.39 $8.39
Winnipeg, MB**** $6.63 $5.50 $10.95 $12.75
CANADA AVERAGES* $8.10 $7.49 $10.06 $12.81
Canada | Vacancy Rankings
MARKET VACANCY RATE MAR 31, 2015
Regina, SK 2.0%
Edmonton, AB 2.5%
Vancouver, BC 3.6%
Toronto, ON 3.6%
Montréal, QC 3.7%
Winnipeg, MB**** 3.8%
CANADA AVERAGE 3.8%
Calgary, AB 4.2%
Victoria, BC**** 4.6%
Ottawa, ON 4.6%
Saskatoon, SK 5.9%
Waterloo Region, ON 6.9%
MARKET VACANCY RATE MAR 31, 2015
Los Angeles, CA 1.9%
Honolulu, HI 2.0%
San Francisco Peninsula, CA 2.5%
Omaha, NE 2.7%
Orange County, CA 3.3%
Bakersfield, CA 3.4%
Boise, ID**** 3.7%
Oakland, CA 3.9%
Denver, CO 4.0%
Seattle/Puget Sound, WA 4.4%
Los Angeles - Inland Empire, CA 4.5%
Houston, TX 4.8%
Long Island, NY 4.8%
Cincinnati, OH 4.8%
Savannah, GA 5.2%
Milwaukee, WI 5.3%
Portland, OR 5.4%
Miami, FL 5.4%
Cleveland, OH 5.5%
Fresno, CA 5.6%
Columbus, OH 5.7%
West Palm Beach, FL 5.9%
San Diego, CA 6.1%
MARKET VACANCY RATE MAR 31, 2015
Grand Rapids, MI 6.1%
Fairfield, CA 6.1%
Charleston, SC 6.2%
Kansas City, MO-KS 6.3%
Pleasanton/Tri-Valley, CA 6.4%
Nashville, TN 6.8%
Louisville, KY 6.8%
San Jose - Silicon Valley, CA 6.8%
U.S. AVERAGE 7.0%
Minneapolis/St. Paul, MN 7.0%
St. Louis, MO 7.1%
New Jersey - Northern 7.1%
Albuquerque, NM 7.1%
Ft. Lauderdale-Broward, FL 7.2%
Indianapolis, IN 7.3%
Stockton/San Joaquin County, CA 7.3%
Walnut Creek, CA 7.4%
Pittsburgh, PA 7.4%
Chicago, IL 7.6%
New Jersey - Central 7.6%
Detroit, MI 7.7%
Norfolk, VA 7.8%
Greenville/Spartanburg, SC 7.8%
Richmond, VA 7.9%
MARKET VACANCY RATE MAR 31, 2015
Tampa Bay, FL 8.0%
Dallas-Ft. Worth, TX 8.0%
Jacksonville, FL 8.1%
Raleigh, NC 8.2%
Las Vegas, NV 8.2%
Reno, NV 8.3%
Orlando, FL 8.4%
Huntsville, AL 8.5%
Atlanta, GA 8.6%
New Hampshire 8.8%
Philadelphia, PA 8.8%
Columbia, SC 8.9%
Hartford, CT 8.9%
Baltimore, MD 9.1%
Washington DC 9.8%
Birmingham, AL 10.0%
Charlotte, NC 10.4%
Dayton, OH 10.4%
Sacramento, CA 10.6%
Little Rock, AR 10.8%
Phoenix, AZ 11.8%
Memphis, TN 11.8%
Boston, MA 18.0%
U.S. | Vacancy Rankings
* Straight averages used.**** Q4-14 data displayed. These markets report semi-annually.
**** Q4-14 data displayed

Copyright © 2015 Colliers International.The information contained herein has been obtained from sources deemed reliable. While every reasonable effort has been made to ensure its accuracy, we cannot guarantee it. No responsibility is assumed for any inaccuracies. Readers are encouraged to consult their professional advisors prior to acting on any of the material contained in this report.
Colliers International601 Union Street, Suite 4800 Seattle, WA 98101+1 206 695 4200colliers.com
INDUSTRIAL SERVICES | contactDwight Hotchkiss
President, Brokerage Services | USANational Director, Industrial | USA
+1 213 532 [email protected]
FOR MORE INFORMATIONAndrea Cross
Office Research Manager | USA+1 415 788 3100
Pete Culliney Director of Research | Global
+1 212 716 3689 [email protected]
CONTRIBUTORSJeff Simonson
U.S. Senior Research Analyst | USA
AJ Paniagua U.S. Research Analyst | USA
Andrew Nelson Chief Economist | USA
GlossaryBulk Space – Warehouse space 100,000 square feet or more with minimum ceiling heights of 24 feet. All loading is dock-height.
Flex Space – Single-story build-ings having 10 to 18-foot ceilings with both floor-height and dock-height loading. Includes wide variation in office space utilization, ranging from retail and personal service, to distribution, light industrial and occasional heavy industrial use.
Service Space – Single-story (or mezzanine) with 10 to 16-foot ceilings with frontage treatment on one side and dock-height loading or grade-level roll-up doors on the other. Less than 15 percent office space.
Tech/R&D – One and two-story, 10 to 15-foot ceiling heights with up to 50% office/dry lab space (remainder in wet lab, workshop, storage and other support), with dock-height and floor-height loading.
Warehouse – 50,000 square feet or more with up to 15 percent office space, the balance being general warehouse space with 18 to 30-foot ceiling heights. All loading is dock-height.