Q1 2015 3 m earnings presentation
17
1 . All Rights Reserved. 23 April 2015 © 3M 2015 First Quarter Business Review April 23, 2015 (unaudited)
-
Upload
investors3m -
Category
Investor Relations
-
view
2.935 -
download
0
Transcript of Q1 2015 3 m earnings presentation

1. All Rights Reserved.23 April 2015© 3M
2015 First Quarter Business Review
April 23, 2015
(unaudited)

2. All Rights Reserved.23 April 2015© 3M
Forward Looking StatementThis presentation contains forward-looking information about 3M's financial results and estimates and business prospectsthat involve substantial risks and uncertainties. You can identify these statements by the use of words such as "anticipate,""estimate,” "expect," “aim," "project," "intend," "plan," "believe," "will," “should," “could," "target," "forecast" and otherwords and terms of similar meaning in connection with any discussion of future operating or financial performance orbusiness plans or prospects. Among the factors that could cause actual results to differ materially are the following:(1) worldwide economic and capital markets conditions and other factors beyond 3M's control, including natural and otherdisasters affecting the operations of 3M or its customers and suppliers; (2) 3M's credit ratings and its cost of capital;(3) competitive conditions and customer preferences; (4) foreign currency exchange rates and fluctuations in those rates;(5) the timing and market acceptance of new product offerings; (6) the availability and cost of purchased components,compounds, raw materials and energy (including oil and natural gas and their derivatives) due to shortages, increaseddemand or supply interruptions (including those caused by natural and other disasters and other events); (7) the impact ofacquisitions, strategic alliances, divestitures, and other unusual events resulting from portfolio management actions andother evolving business strategies, and possible organizational restructuring; (8) generating fewer productivityimprovements than estimated; (9) unanticipated problems or delays with the phased implementation of a global enterpriseresource planning (ERP) system, or security breaches and other disruptions to 3M's information technology infrastructure;and (10) legal proceedings, including significant developments that could occur in the legal and regulatory proceedingsdescribed in 3M's Annual Report on Form 10-K for the year ended December 31, 2014. Changes in such assumptions orfactors could produce significantly different results. A further description of these factors is located in the Annual Reportunder “Cautionary Note Concerning Factors That May Affect Future Results” and “Risk Factors” in Part I, Items 1 and 1A.The information contained in this presentation is as of the date indicated. 3M assumes no obligation to update any forward-looking statements contained in this presentation as a result of new information or future events or developments.

3. All Rights Reserved.23 April 2015© 3M
GAAP EPS of $1.85, up 3.4% year-on-year
Sales of $7.6 billion, down 3.2% in dollar terms
Organic local currency +3.3%
Positive growth in all business groups and geographic areas
Foreign currency (FX) reduced sales by 6.5%
Operating margins of 22.8%, up 0.9 percentage points year-on-year
All business groups > 21%
Announced acquisition of Polypore’s Separations Media business for $1.0 billion
Closed acquisition of Ivera Medical
Returned $1.5 billion to shareholders via dividends and gross share repurchases
Increased first-quarter per-share dividend by 20 percent
Q1 2015 Highlights
Refer to 3M’s April 23, 2015 press release for full details.

4. All Rights Reserved.23 April 2015© 3M
-3.2%
-6.5%
0.0%
3.3%
1.0%
2.3%
Total
FX
Acquisition/divestiture
Organic local currency
Price
Organic volume
Worldwide Sales Change Due To:
Q1 2015 Sales Recap
Organic local currency:
U.S. +3.1%
Asia Pacific +5.6%
China/Hong Kong +7%
Japan +1%
EMEA +0.3%
West Europe flat
Latin America/Canada +3.6%
Mexico +15%, Brazil -2%
FX reduced sales by 6.5%
Euro -18%, Yen -14%, Real -19%
($M) US APAC EMEA LAC
Organic volume +2.5% +5.4% -1.2% -0.2%
Price +0.6% +0.2% +1.5% +3.8%
Organic local currency +3.1% +5.6% +0.3% +3.6%
Acq/div +0.1% -0.1% 0.0% -0.1%
FX ----- -4.3% -16.2% -12.3%
Total growth +3.2% +1.2% -15.9% -8.8%

5. All Rights Reserved.23 April 2015© 3M
Q1 15
Pension/OPEB
Strategic investments
Acquisitions
FX
Productivity/other
Price/raw materials
Organic volume
Q1 14
Operating margin of 22.8%, up 0.9 percentage points
+0.3%
+1.2%
+0.2%
0.0%
Q1 2015 P&L
($M)Q1
2014Q1
2015 Change
Sales $7,831 $7,578 -3.2%
Gross profit $3,800 $3,757 -1.1%
% to sales 48.5% 49.5% +1.0 pts
SG&A $1,632 $1,564 -4.2%
% to sales 20.8% 20.6% -0.2 pts
R&D & related $452 $463 +2.4%
% to sales 5.8% 6.1% +0.3 pts
Operating income $1,716 $1,730 +0.8%
% to sales 21.9% 22.8% +0.9 pts
Net income $1,207 $1,199 -0.7%
Earnings per share $1.79 $1.85 +3.4%
21.9%
-0.1%
-0.2%
-0.5%
22.8%
Refer to 3M’s April 23, 2015 press release for full details.

6. All Rights Reserved.23 April 2015© 3M
Q1 2015 GAAP EPS
$1.79
$1.85
Q1 2014 Q1 2015
+3.4%Q1 2014 – GAAP EPS $1.79
Organic growth, margin expansion
+$0.14 Includes -$0.04 headwind from pension/
OPEB expense
FX -$0.10 Pre-tax earnings decline of ~$90M
Tax rate -$0.05 Q1 2015 29.5% vs. 27.4% Q1 2014 Increase due to country profit mix, FX,
prior year tax benefit
Shares outstanding +0.07 Average diluted shares down 4%
Q1 2015 – GAAP EPS $1.85

7. All Rights Reserved.23 April 2015© 3M
Q1 2015 Cash Flow
($M)Q1
2014Q1
2015 Change
Operating cash flow $1,092 $1,080 ($12)
Capital expenditures ($293) ($291) $2 Expecting FY 2015 of $1.4B to $1.6B
Free cash flow $799 $789 ($10)
Free cash flow conversion 66% 66% ----- Expecting FY 2015 of 90% to 100%
Dividends $566 $652 $86 Increased Q1 15 per-share dividend 20%
Gross share repurchase $1,708 $886 ($822) Expecting FY 2015 of $3B to $5B
Total cash to shareholders $2,274 $1,538 ($736)
Refer to 3M’s April 23, 2015 press release for full details.
8. All Rights Reserved.23 April 2015© 3M
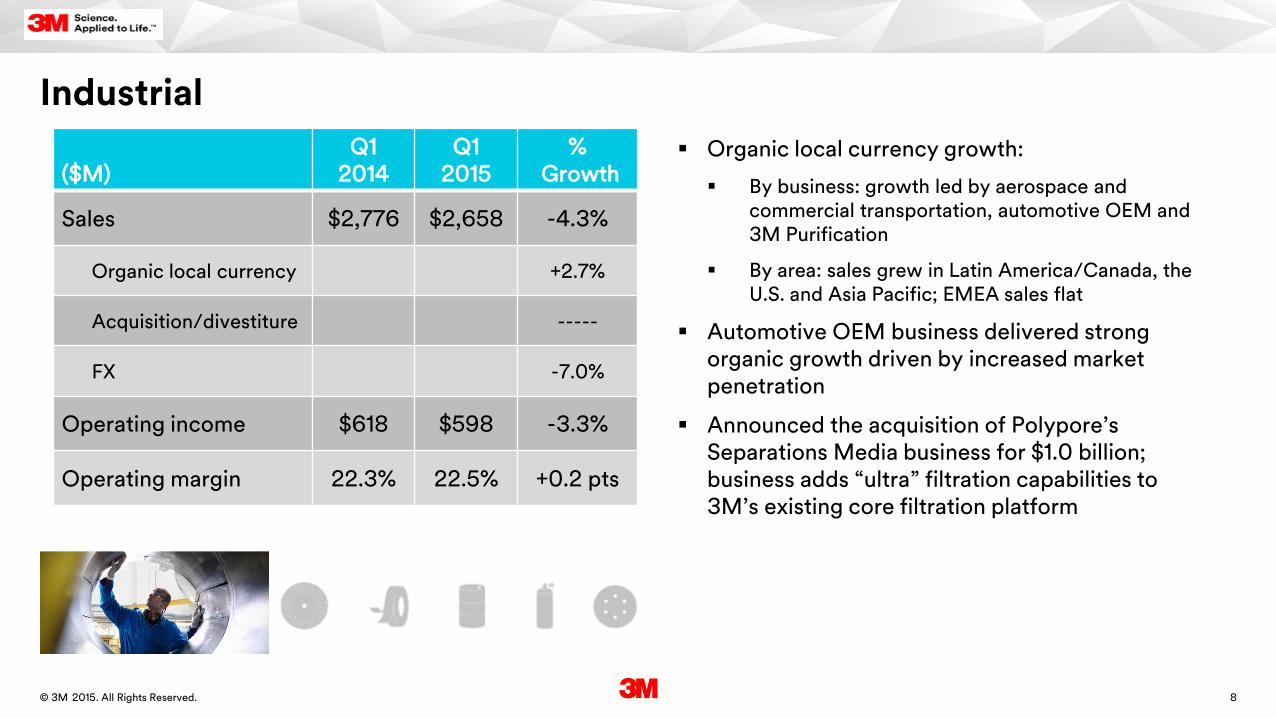
Organic local currency growth:
By business: growth led by aerospace and commercial transportation, automotive OEM and 3M Purification
By area: sales grew in Latin America/Canada, the U.S. and Asia Pacific; EMEA sales flat
Automotive OEM business delivered strong organic growth driven by increased market penetration
Announced the acquisition of Polypore’s Separations Media business for $1.0 billion; business adds “ultra” filtration capabilities to 3M’s existing core filtration platform
($M)Q1
2014Q1
2015%
Growth
Sales $2,776 $2,658 -4.3%
Organic local currency +2.7%
Acquisition/divestiture -----
FX -7.0%
Operating income $618 $598 -3.3%
Operating margin 22.3% 22.5% +0.2 pts
Industrial
9. All Rights Reserved.23 April 2015© 3M
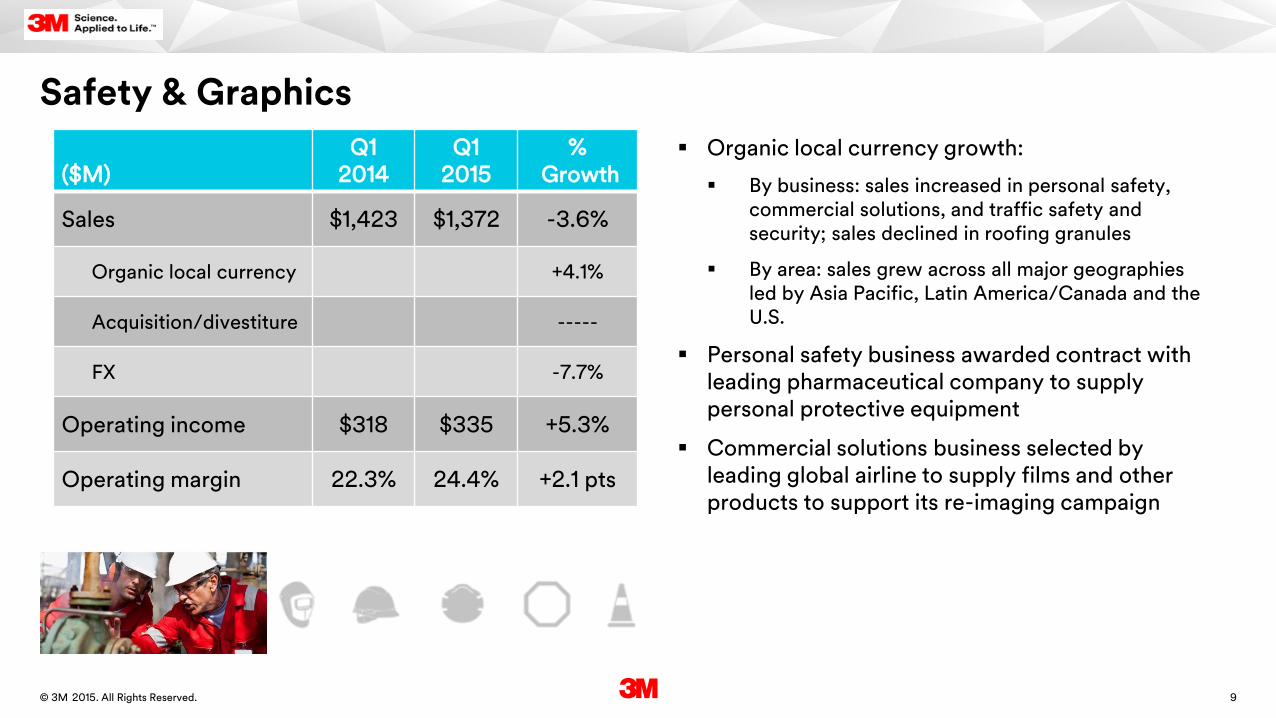
Safety & Graphics
($M)Q1
2014Q1
2015%
Growth
Sales $1,423 $1,372 -3.6%
Organic local currency +4.1%
Acquisition/divestiture -----
FX -7.7%
Operating income $318 $335 +5.3%
Operating margin 22.3% 24.4% +2.1 pts
Organic local currency growth:
By business: sales increased in personal safety, commercial solutions, and traffic safety and security; sales declined in roofing granules
By area: sales grew across all major geographies led by Asia Pacific, Latin America/Canada and the U.S.
Personal safety business awarded contract with leading pharmaceutical company to supply personal protective equipment
Commercial solutions business selected by leading global airline to supply films and other products to support its re-imaging campaign
10. All Rights Reserved.23 April 2015© 3M
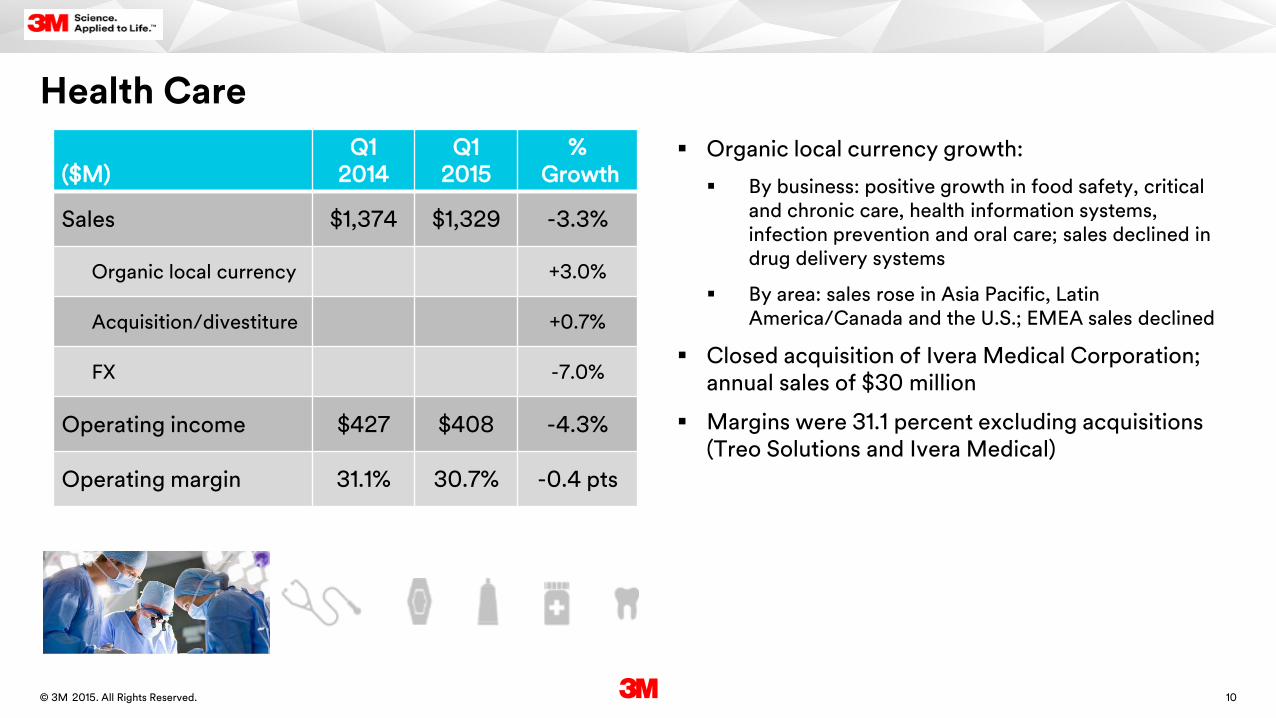
Health Care
($M)Q1
2014Q1
2015%
Growth
Sales $1,374 $1,329 -3.3%
Organic local currency +3.0%
Acquisition/divestiture +0.7%
FX -7.0%
Operating income $427 $408 -4.3%
Operating margin 31.1% 30.7% -0.4 pts
Organic local currency growth:
By business: positive growth in food safety, critical and chronic care, health information systems, infection prevention and oral care; sales declined in drug delivery systems
By area: sales rose in Asia Pacific, Latin America/Canada and the U.S.; EMEA sales declined
Closed acquisition of Ivera Medical Corporation; annual sales of $30 million
Margins were 31.1 percent excluding acquisitions (Treo Solutions and Ivera Medical)

11. All Rights Reserved.23 April 2015© 3M
Electronics & Energy
($M)Q1
2014Q1
2015%
Growth
Sales $1,311 $1,322 +0.8%
Organic local currency +5.8%
Acquisition/divestiture -0.9%
FX -4.1%
Operating income $227 $283 +24.3%
Operating margin 17.3% 21.4% +4.1 pts
Organic local currency growth:
By business: electronic-related sales rose 12% (electronic materials solutions and display materials and systems both up); energy-related sales declined 3% (electrical markets flat, telecom and renewable energy down)
By area: sales grew across all areas led by Asia Pacific, EMEA and Latin America/Canada
Completed divestiture of Static Control business on 1/2/15; annual sales were $46 million
Portfolio management actions expanding customer relevance and penetration while improving operating margins
12. All Rights Reserved.23 April 2015© 3M
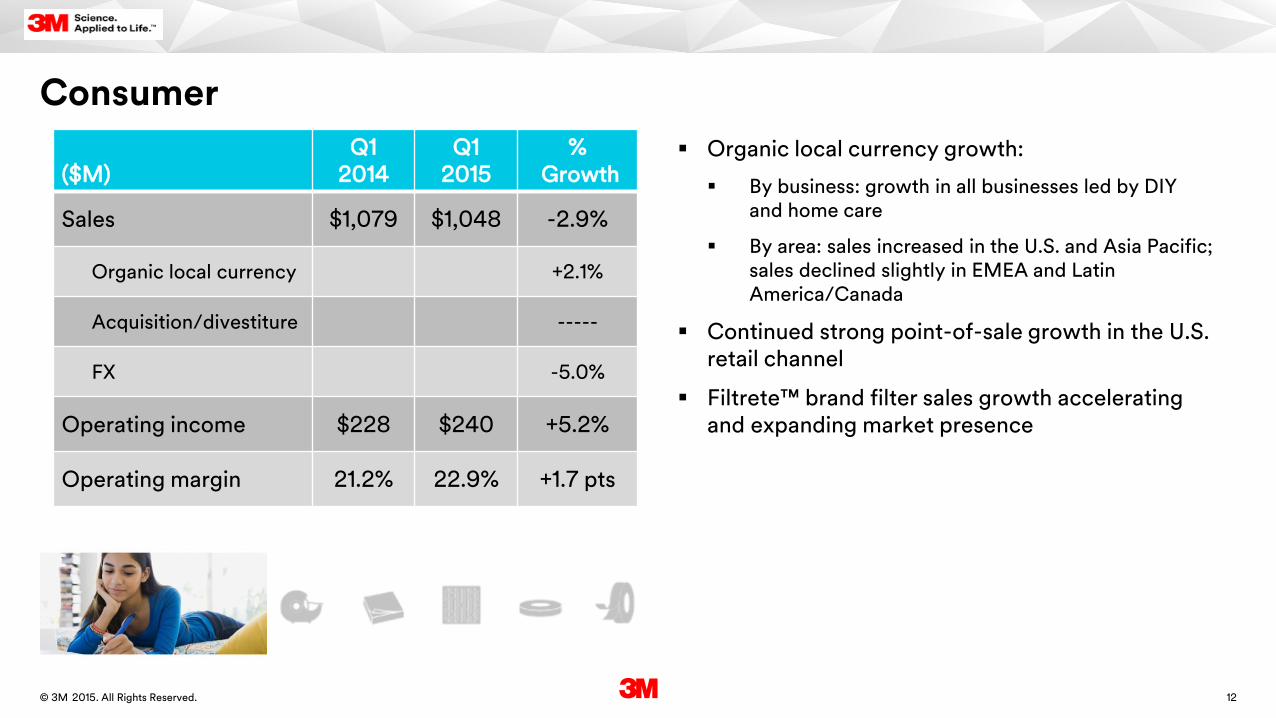
Consumer
($M)Q1
2014Q1
2015%
Growth
Sales $1,079 $1,048 -2.9%
Organic local currency +2.1%
Acquisition/divestiture -----
FX -5.0%
Operating income $228 $240 +5.2%
Operating margin 21.2% 22.9% +1.7 pts
Organic local currency growth:
By business: growth in all businesses led by DIY and home care
By area: sales increased in the U.S. and Asia Pacific; sales declined slightly in EMEA and Latin America/Canada
Continued strong point-of-sale growth in the U.S. retail channel
Filtrete™ brand filter sales growth accelerating and expanding market presence

13. All Rights Reserved.23 April 2015© 3M
Updating 2015 Planning Estimates
Q4 Earnings Call1/27/15
Today4/23/15
Sales growth:
Organic local currency
FX
+3% to +6%
-4% to -5%
+3% to +6%
-6% to -7% Broad-based USD strength Q2 estimated impact of -8%
GAAP EPS $8.00 to $8.30 $7.80 to $8.10
2015 FX impact of -$0.35 to -$0.40 vs. -$0.20 prior; assumes EUR 1.09, RMB 6.21, JPY 120, BRL 3.28
Q2 estimated FX impact of -$0.13 Above estimates exclude FX impact on
tax rate
Tax Rate 28% to 29% 28.5% to 29.5% Country profit mix, FX
Free cash flow conversion 90% to 100% 90% to 100%
Note: figures exclude pending acquisition of Polypore’s Separations Media business

14. All Rights Reserved.23 April 2015© 3M
15. All Rights Reserved.23 April 2015© 3M
Q & A

16. All Rights Reserved.23 April 2015© 3M
s
Appendix
17. All Rights Reserved.23 April 2015© 3M
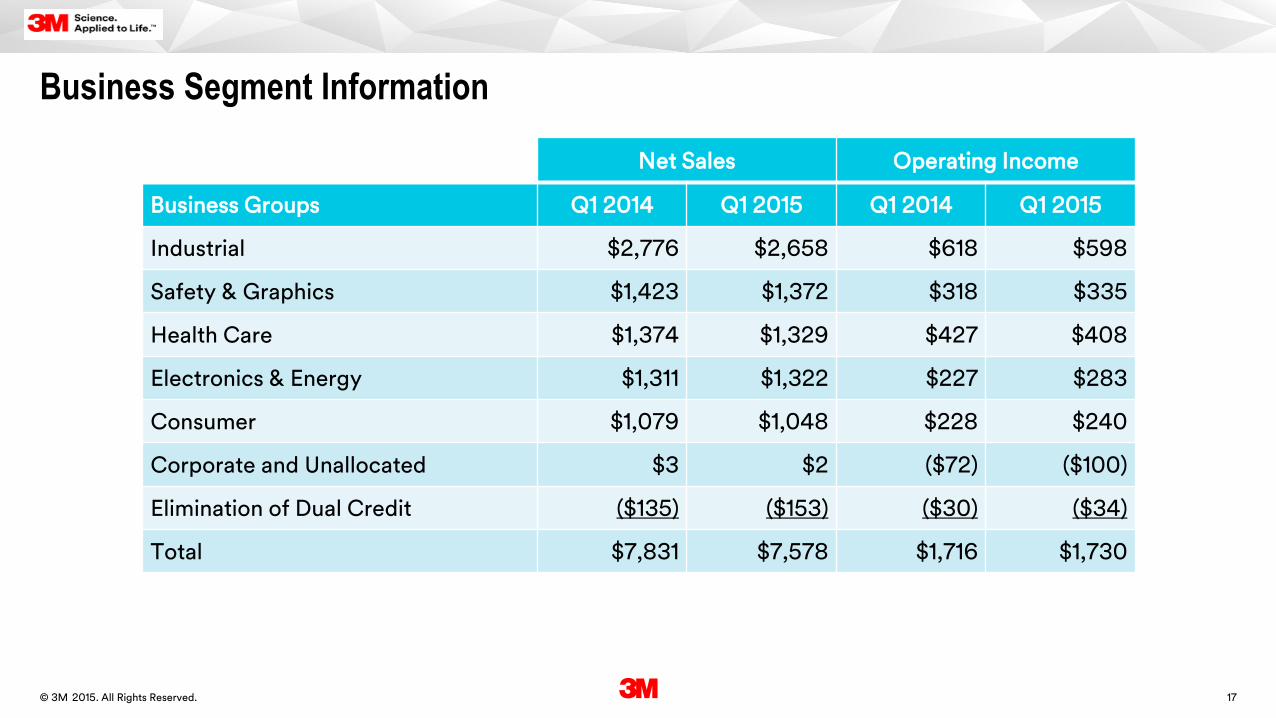
Business Segment Information
Net Sales Operating Income
Business Groups Q1 2014 Q1 2015 Q1 2014 Q1 2015
Industrial $2,776 $2,658 $618 $598
Safety & Graphics $1,423 $1,372 $318 $335
Health Care $1,374 $1,329 $427 $408
Electronics & Energy $1,311 $1,322 $227 $283
Consumer $1,079 $1,048 $228 $240
Corporate and Unallocated $3 $2 ($72) ($100)
Elimination of Dual Credit ($135) ($153) ($30) ($34)
Total $7,831 $7,578 $1,716 $1,730