
Q u a r t e r l y C o m m e n t a r y
9
VT Astute Funds Quarterly Commentary Q3 2021
Transcript of Q u a r t e r l y C o m m e n t a r y

V T A s t u t e F u n d s
Q u a r t e r l y C o m m e n t a r y
Q 3 2 0 2 1
Stagflation Frustration
Happy Birthday to the VT Astute fund range! We passed our one-year milestone in July, which eases the
regulatory restrictions on performance reporting, something the eagle-eyed among you may have noticed from
our factsheets already (as they now include performance statistics). You will also find a dedicated performance
breakdown for each of the funds at the back of this commentary. I also want to personally thank you for your
support since launch and hope this last year is just the first of many on the way to achieving your financial goals.
In case you’re wondering, there was no cake. My daughter's second birthday is shortly after, and my wife didn’t
appreciate me drawing comparisons, although if I could guarantee good behaviour from financial markets by
promising them a trampoline for Christmas, life would be much easier.
Apologies for mentioning Christmas in October but we are well and truly through the summer holidays now and
getting to the business end of the year. Easy growth comparisons to pandemic affected numbers will wash
through, both in terms of economic numbers like GDP growth and inflation but also in earnings numbers for
individual companies. Essentially the dust is beginning to settle and, as some semblance of “normal” life
resumes, we can take stock of how well the economy weathered the crisis.
Some things I have discussed in the past still look a little worrying. Labour markets certainly look tighter and
supply chain issues seem to be persisting longer than expected (see Astute Overview). Both of which feed into
inflation expectations. On balance it seems the risk that inflation stays higher for longer has increased, and that
may lead to central banks tightening more quickly than anticipated. This has been one of our principal concerns
for most of the year and while we don’t think the pace of policy tightening will accelerate all that much, we have
insulated the portfolios from this risk as much as we think we can. This worked in our favour this quarter as bond
markets, a key underweight for the funds, started to price-in interest rate increases and higher yields, pushing
bond prices lower. So, we are comfortable with the risk around inflation expectations but what about growth?
An elevated rate of inflation was always seen as an acceptable, ideally temporary, consequence of a strong
economic recovery, but what if inflation sticks around and the growth does not? Rising price pressures, transitory
or not, are placing significant costs on consumers in all sorts of areas. The hard data show household and
company balances sheets are in rude health, but you might not feel like splashing out on Christmas or a new
high-tech production line if your energy bill just doubled or your gross margin is under pressure. Without the
animal spirits to support spending it won’t matter how much “dry powder “there is, it just won't get spent.
This stagflation trap is what is occupying markets at the moment and it’s a hard scenario to defend against. It
puts policymakers in a tricky position because central banks should really continue tightening to control inflation,
but higher rates will only pour more cold water onto growth. Fiscal intervention is also unlikely as governments
have limited room to borrow more, particularly as interest rates increase. The simple reason this looks so gloomy
is why we don’t think it will materialise. Governments are designing policies, like the UK’s super deduction or the
mooted tax on share buybacks in the US, to encourage real capital investment and unlock that spending.
In summary, we are getting more worried about slowing growth and the potential for stagflation but not enough
to adjust our risk-on positioning. We will increase our efforts to defend against this outcome and search for ways
to protect the portfolios from this downside scenario should it materialise. More generally we continue to be
positive on the outlook for risky assets, albeit China is raising some questions (see Astute overview). As yields
rise, we may be able to tip-toe back into bond markets, and that will help portfolio diversification, but until then
we remain underweight fixed income. As always, we remain disciplined in our approach to managing risk, but
maintain our focus on achieving our long-term growth objectives.
F u n d M a n a g e m e n t Te a m
Scott Osborne Chief Investment Officer
Toby HulseInvestment Analyst
Mark HoughtonInvestment Analyst
Thank you for taking the time to read our Q3 commentary. As the last quarter marked the one-yearanniversary of the Astute funds launch, in July 2020, we are now able to share performance datawithin our commentary. You will find dedicated sections for each of our three funds later in thisupdate for investors who wish to see specific detail on their chosen portfolio. While the level of riskwithin each portfolio varies, the Astute view and philosophy that drives our positioning is consistentthroughout. We remain focused on our long-term investment objectives and delivering these whileminimising downside risk.
What are we discussing this quarter? With “freedom day” behind us and schools returned, many ofthe restrictions of the past 18 months are behind us. The long-term effects of the pandemic are stilluncertain, however. Despite a strong economic recovery, growth is beginning to slow, and that hasled to increasing worries about persistent inflation and a sluggish economy. This so called“stagflation” trap is the topic of our CIO letter this quarter.
In our Astute Overview section, we will look at how fragile global supply chains are creaking underdemand pressures, and at China, where the high-profile problems at the country’s largest propertydeveloper added to the wall of worry in emerging markets.
Our regular Astute Perspective shows our current conviction views, while Astute Positioning covershow those views translate into the portfolios, and what changes we have made in the past threemonths.
Finally, Astute Observations highlights some of the more interesting research, data, or charts wehave encountered recently with a few short and, hopefully, enlightening comments.
As always, we take a long-term approach to investing our clients’ assets, but success is a journey, nota destination, and the short-term views expressed herein are aimed at managing risk and makingyour investment journey as smooth as possible. By taking a risk-adjusted approach to yourinvestments, we aim to deliver reliable growth in line with our stated risk profiles and provide you,and your financial planner, the consistency and security to plan for your long-term financial future.Thank you for your continued support. If you have any further questions or require any additionalinformation, please do not hesitate to contact your usual financial planner.
Introduction
Scott Osborne PhD CFAChief Investment Officer
G L O B A L S U P P L Y C H A I N S – T H R O W I N G P E T R O L O N T H E F L A M E S
One aspect of the recovery from the pandemic we are all seeing in our daily lives is the disruption to globalsupply chains. From a shortage of semiconductor chips to a shortage of HGV drivers, both materials and themethods for moving them around the globe remain disordered. Short and long-term trends in supply chains,labour shortages across that chain, and end demand (in some cases panic buying) are all converging to stress afragile system to breaking point. Some of these bottlenecks will work out over time, but how long will temporaryimpacts last, and are some changes more permanent in nature?
First, let's examine a case study supply shortage that emerged during the pandemic: semiconductors. The basiccommodity of computing power and increasingly ubiquitous in everyday devices. Already a structural growthstory as trends around AI, “smart” devices, and 5G technology accelerated, the pandemic saw a spike in demandas consumers upgraded home PCs and other personal devices during lockdowns. Much of this immediatedemand was met by falling orders from cyclical areas, like car manufacturers. As activity recovered thesemanufacturers now find themselves out in the cold, with a chip shortage so severe it is halting production andslowing their recovery. Any other business feeding into that supply chain will also be affected, demonstrated bythe recent negative guidance from Melrose. The UK-based engineer doesn’t use chips itself but suppliesdrivetrains for new cars and reported “in month cancellations” had risen to over 20% compared to a normal rateof around 1%. Meanwhile, ASML, the Dutch company which supplies the complex printers needed to producethe most advanced chips, is flourishing. One of those companies is still well below its pre-pandemic valuation, theother is two to three times above it.
These dynamics may work out over the next year as additional chip fabricating capacity enters the market butissues like the US/China innovation war and China’s “made in China 2025” policy could influence marketdynamics for the foreseeable future. This is just one complex example, but there are many more where growth isbeing limited or redistributed due to supply chains issues, some of which were temporary but have resulted inpermanent change. The real question is what is the overall impact on growth and the consumer?
Here we can look at the recent petrol “shortage” for clues about consumer behaviour. The perception thatsomething may not be available leads to a run on supply, and the shortage becomes self-fulfilling. Panic buying,higher prices, and more buying to beat future price increases, is a classic inflationary spiral. What’s moreworrying, however, is that this behaviour defers consumption elsewhere. Despite the very healthy appearance ofmany household balance sheets, nobody likes the feeling they are being ripped off, even if they can afford it.
Bottlenecks in supply chains, either because there aren’t enough chips to go around or because your tankerdriver now delivers for Tesco, creates additional costs in the value chain and that has to be absorbed or passedon. Many company's feel they have the “pricing power” to squeeze consumers, but push too hard, or at thewrong time, and you might lose a customer forever. Worse still, they may not go shopping at all.
Astute Response:
We see this as a key driver of consumer behaviour and “animal spirits”. While changing supply chain dynamicscan create winners and losers to be exploited by talented active managers, if the net effect is to dampen overalldemand that could be negative for growth and the market as a whole. We retain our bias to active in key areasand step up our efforts to hedge against slowing growth, although it is not our base case expectation.
A s t u t e Q u a r t e r l y C o m m e n t a r y | O c t o b e r 2 0 2 1
Sources: Refinitiv; Capital Economics; Financial Times; Rogoff, Kenneth, and Yuanchen Yang. 2021. “Has China’s Housing Production Peaked?” China and the World Economy 21 (1): 1-31.
A s t u t eO v e r v i e w
C H I N A P R O P E R T Y – U N D E R P I N N I N G R E Q U I R E D
China has been one area of the markets generating a lot of headlines this year due to the Communists party’scontinued interventions in markets. Many of these policies are directed at political priorities like populationgrowth or closing wealth inequality (“common prosperity for all”), but others are sensible economic measuresdesigned to reduce financial risk in markets. The worry is that the ultimate cost of these reforms is borne byinvestors. The best example of this dynamic is the “Three Red Lines” implemented in 2020 to reduce excessiveleverage in China’s real estate market. Ultimately this has led to the partial default and now suspension ofdealing in the country’s biggest developer, Evergrande, but could have wider implications for the economy.
The three red lines were designed in response to booming prices, sales, and worrying increases in borrowing bydevelopers. If a speculative property bubble built on leverage sounds familiar to you, then you can understandwhy China is acting now to try and prevent a 2008 style bubble burst. Even controlled deflation is painfulhowever, and the restrictions on additional lending were so severe that only a tiny fraction of the market couldcomply. This forced developers like Evergrande to aggressively de-lever, essentially selling assets to pay backdebt. As it transpired, and perhaps not unexpectedly, the deleveraging could not happen quick enough and soEvergrande found themselves locked out of debt markets and unable to refinance existing debt as it came due.
If this sounds bad, it is, but the outcome was almost inevitable, and some would say desirable from China’sperspective. The public travails of Evergrande sends a strong message to the sector to get their house in orderand shares at least some of the pain with equity and bond investors, who are unlikely to be compensated fortheir risk-taking… or will they? Offshore investors may struggle, but a far larger portion of Evergrande's liabilitiesare onshore, and here the belief is that China’s pockets are deep enough to provide bailouts where necessary.They won't allow any company to become “too big to fail”, but they won't allow any failure to become too big tobail out. They can fine-tune the economic pain by the scale of their response. Of course, not everyone agrees.
The bear case centres not on China’s financial firepower but on the so-called “real economy”. Real estate is ahuge industry, some estimate construction and related services contribute as much as 29% of GDP and employsalmost 20% of the urban workforce. Over 90% of urban households already own their home and over 80% ofnew sales are to existing owners. Clearly, a drop-off in activity and a fall in prices is bad for workers and theirsense of wealth. Finally, the debt owed permeates all parts of the economy, all the way to regional authoritieswho rely on lucrative land sales to fund investment. Firepower is one thing, directing it effectively is another.
The bull case is simply that China will meet this challenge with a wall of stimulus and easing measures. There aregood companies outside of the problem sectors, on cheap valuations, that will do well regardless (manageddecline or bubble burst and blockbuster stimulus). Furthermore, the pricking of the property bubble will force areallocation of wealth away from real estate and into markets. Being too early an investor could be painful in theshort term but may still be a better outcome than missing the rally if and when it comes.
Astute Response:
We have and continue to place faith in both China’s ability to deflate this potentially damaging property bubbleand our selected managers' ability to navigate the related market volatility. However, the potential for contagioninto the real economy is larger than anticipated and the downside risk to the position is growing. As a result, wewill review our positioning and reduce our risk-taking accordingly either directly via China or elsewhere in EM.

1. P i v o t t o C y c l i c a l• Economic rebound will broaden growth opportunities, benefiting cyclical
sectors most
• Valuations more attractive for growth linked to economic rebound butcautious on long-term outlook and avoiding value traps
3. I n v e s t S u s t a i n a b l y• ESG will become the default option, and the market will shift accordingly
• If sustainable investing is the future, invest with those who have ESG wayinto their past
F i x e d I n c o m eN e g a t i v e P o s i t i v e
Sovereign Bonds
Corporate Bonds
High-yield bonds
EM Debt
A l t e r n a t i v e s N e g a t i v e P o s i t i v e
A s t u t e P e r s p e c t i v e
2. O v e r w e i g h t T e c h n o l o g y• Technological revolution will continue, lean into disruptive areas, the strong
get stronger
• Look beyond current global leaders and use specialists to stay ahead of thecurve
C o n v i c t i o n V i e w s
A key part of our process is building conviction ideas which are thenexpressed across each of the portfolios. While asset class andregional views are an important input into this process, the opinionsoutlined below will be the driving force behind any potential futurereturns.
E q u i t i e sN e g a t i v e P o s i t i v e
UK
Europe
Asia & Emerging
Japan
US
A s s e t C l a s s V i e w s
U K – N e u t r a l / O v e r w e i g h t
Larger companies remain structurally challenged
Prefer smaller companies with growth opportunities
Labour/goods shortages likely exacerbated by Brexit
N . A m e r i c a - N e u t r a l
Expect strong recovery led by record stimulus
Rising inflation putting pressure on growth names
Debt ceiling & mid-terms already looming
E u r o p e - N e u t r a l
Fiscal co-operation emerging, supportive ECB
Elections to have limited impact on co-ordination
Global leader in green and sustainable investing
J a p a n - N e u t r a l / O v e r w e i g h t
Good value but corporate nationalism persists
Changing administration very much status quo
Research & innovation remains strong suit
A s i a & E m e r g i n g - O v e r w e i g h t
Long-term growth from demographics & development
China tightening policy will slow growth versus peers
Vaccination catch-up a short-term hurdle to growth

-8.0%
-6.0%
-4.0%
-2.0%
0.0%
2.0%
4.0%
6.0%
8.0%
N.A
mer
ica
UK
Euro
pe
Jap
an
Emer
gin
g M
arke
ts
UK
Gilt
s
UK
Co
rp. B
on
ds
Glo
bal
Bo
nd
s (H
dg)
Go
ld
Do
llar
Equities Bonds Other
A s t u t e Q u a r t e r l y C o m m e n t a r y | O c t o b e r 2 0 2 1
A s t u t e P o s i t i o n i n g
The last quarter was relatively quiet in terms of portfolio activity. We did trim our US exposure early in the
period following a strong Q2, rotating capital into Europe and Japan. Our long-term growth bias continued to
benefit performance, whilst the inflation hedges we put in place during the second quarter helped to dampen
volatility, particularly in September as yields started to increase. We also opportunistically entered some
European logistics positions following a takeover bid for our student property portfolio.
Performance over the period was positive. Equity markets generally made progress, despite fading over the
course of the quarter. The obvious exception being Emerging markets where further intervention from the
Chinese government and a stronger US Dollar more generally, saw markets give back the gains of Q2. As the
summer ended and some clarity developed on both inflation and central banks’ tightening schedules, yields
ticked higher. This pushed fixed-income assets into the red but fell short of the steep losses seen when yields
spiked earlier in the year. The biggest winner was Japan. With progress made towards re-opening following a
successful Olympics, the performance gap to western markets looked incongruous and the resignation of
Prime Minister Yoshihide Suga triggered a sharp catch-up rally.
The biggest driver of performance for the Astute funds was the continued bias for equities over fixed income.
Selection in our alternatives was a strong contributor as our real estate assets performed particularly well.
Bond returns were flat but this contributed positively as most benchmarks were negative in Q3. Our corporate
bond managers suffered most as they struggled to offset the headwind of rising yields through credit
selection. All our equity components outperformed their benchmarks this quarter, the only exception being
the US, where our inflation hedges held back returns early in the period. Despite outperforming the broader
index, the overweight to EM was the obvious drag on performance. This is a position we are carefully
reviewing in light of developments in China (see Astute Overview).
There were essentially two trades made this quarter, one at the beginning and one at the end. Early in the
period, we moved to trim our US exposure and reallocate over UK, Japan, and Europe. We felt the bounce
back for high-growth names had gone a little too far and would underperform if yields started to rise again.
While we saw the risk mostly to our growth names, we trimmed broadly to maintain a balanced exposure
within our US equity component and gained cyclicality by virtue of the markets we moved into.
The other trade is somewhat forced following the bumper cash offer for GCP Student Living in July. We first
purchased this investment trust in December 2020 as we saw good potential for capital growth that would
eventually turn into a quality income play, as students returned to university. While our small shareholding
had little influence on the final decision, the 30% premium on offer matched the all-time high price and was
enough compensation for most investors to sell up. As a result, we will reluctantly part company with a quality
asset when the deal closes in December. Since those shares will be swapped for cash in the future, we
effectively were overweight cash from this point and so began the search for suitable alternatives. With a
flurry of capital raising activity from investment trusts throughout September we took advantage of a
discounted equity raise from two prime European logistics managers, Tritax EuroBox, focused on larger
warehouses and development assets, and Aberdeen Standard’s European Logistics income, focused more on
mature midsize warehouses with strong rent profiles. With Europe lagging the UK in terms of online retail
adoption we think the broader logistics story has room to run and assets in prime logistics locations like
Rotterdam will benefit.
F u n d A c t i v i t y
0.00%
2.25%
-9.10%
7.10%
2.00%
3.50%
-11.10%
5.10%
3.00%
4.00%
-7.00%
0.00%
-12% -8% -4% 0% 4% 8% 12%
Int. Equity
UK Equity
Fixed Income
Alternatives
Growth Balanced Conservative
Ta c t i c a l A s s e t A l l o c a t i o n 1
U n d e r w e i g h t O v e r w e i g h t
A s s e t C l a s s R e t u r n s 2
Sources: Refinitiv Lipper for Investment Management & Astute Investment Management as at 30/09/2021. Past Performance is not a reliable indicator of future results.1 – Relative positioning is expressed versus Astute’s long-term strategic weights. 2 – Total returns in GBP. Broad market indices are used to represent the performance of different regions over the period
Ne
w P
urc
has
e
Invesco S&P 500 ETF Con, Bal, Gro
Tritax EuroBox PLC Con & Bal
Aberdeen European Logistics Income Con & Bal
Top
Up
Gresham House Energy Storage Con & Bal
ES R&M European Bal & Gro
Jupiter Japan Bal & Gro
JPM UK Equity Con, Bal, Gro
Trim
Invesco Physical Gold ETC Con & Bal
Granahan US Smid Select Bal & Gro
VT Gravis Clean Energy Income Con & Bal
SPDR® MSCI USA Small Cap ETF Bal & Gro
L&G US Equity ETF Con, Bal, Gro
Baillie Gifford American Con, Bal, Gro
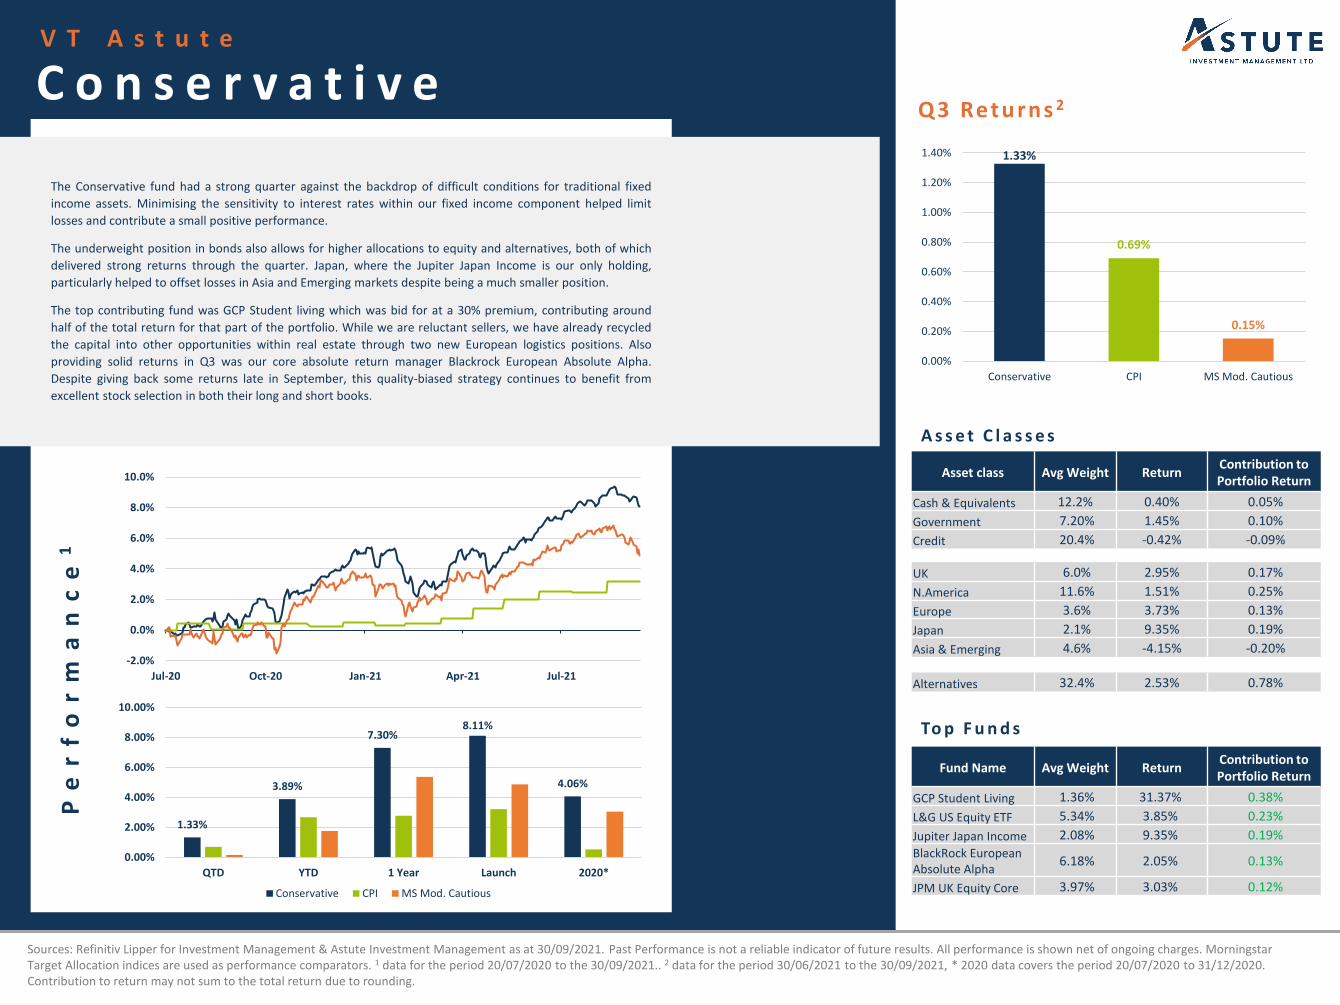
The Conservative fund had a strong quarter against the backdrop of difficult conditions for traditional fixed
income assets. Minimising the sensitivity to interest rates within our fixed income component helped limit
losses and contribute a small positive performance.
The underweight position in bonds also allows for higher allocations to equity and alternatives, both of which
delivered strong returns through the quarter. Japan, where the Jupiter Japan Income is our only holding,
particularly helped to offset losses in Asia and Emerging markets despite being a much smaller position.
The top contributing fund was GCP Student living which was bid for at a 30% premium, contributing around
half of the total return for that part of the portfolio. While we are reluctant sellers, we have already recycled
the capital into other opportunities within real estate through two new European logistics positions. Also
providing solid returns in Q3 was our core absolute return manager Blackrock European Absolute Alpha.
Despite giving back some returns late in September, this quality-biased strategy continues to benefit from
excellent stock selection in both their long and short books.
Sources: Refinitiv Lipper for Investment Management & Astute Investment Management as at 30/09/2021. Past Performance is not a reliable indicator of future results. All performance is shown net of ongoing charges. Morningstar Target Allocation indices are used as performance comparators. 1 data for the period 20/07/2020 to the 30/09/2021.. 2 data for the period 30/06/2021 to the 30/09/2021, * 2020 data covers the period 20/07/2020 to 31/12/2020. Contribution to return may not sum to the total return due to rounding.
Q3 Retu rns 2
Asset class Avg Weight ReturnContribution to Portfolio Return
Cash & Equivalents 12.2% 0.40% 0.05%
Government 7.20% 1.45% 0.10%
Credit 20.4% -0.42% -0.09%
UK 6.0% 2.95% 0.17%
N.America 11.6% 1.51% 0.25%
Europe 3.6% 3.73% 0.13%
Japan 2.1% 9.35% 0.19%
Asia & Emerging 4.6% -4.15% -0.20%
Alternatives 32.4% 2.53% 0.78%
Fund Name Avg Weight ReturnContribution to Portfolio Return
GCP Student Living 1.36% 31.37% 0.38%
L&G US Equity ETF 5.34% 3.85% 0.23%
Jupiter Japan Income 2.08% 9.35% 0.19%
BlackRock European Absolute Alpha
6.18% 2.05% 0.13%
JPM UK Equity Core 3.97% 3.03% 0.12%
To p F u n d s
C o n s e r v a t i v eP
er
fo
rm
an
ce
1
1.33%
0.69%
0.15%
0.00%
0.20%
0.40%
0.60%
0.80%
1.00%
1.20%
1.40%
Conservative CPI MS Mod. Cautious
1.33%
3.89%
7.30%8.11%
4.06%
0.00%
2.00%
4.00%
6.00%
8.00%
10.00%
QTD YTD 1 Year Launch 2020*
Conservative CPI MS Mod. Cautious
V T A s t u t e
A s s e t C l a s s e s
-2.0%
0.0%
2.0%
4.0%
6.0%
8.0%
10.0%
Jul-20 Oct-20 Jan-21 Apr-21 Jul-21

The Balanced fund had a strong quarter both compared to our peer comparator and our CPI+ benchmark,
despite UK inflation continuing to accelerate through the quarter. Minimising the sensitivity to interest rates
within our fixed income component helped avoid losses seen in the wider market. The smaller allocation to
credit also helped as corporate bond managers generally struggled to compensate for rising yields through
credit selection.
Within equities, we saw strong performance from Europe and Japan. The Jupiter Japan Income fund
particularly helped to offset losses in Asia and Emerging markets despite being a much smaller position.
Although our US equity exposure lagged the market, the largest contribution outside our core tracker position
was the USA Financials ETF, a key part of our inflation and interest rate hedging strategy. This demonstrates
the benefit of hedging some of our longer-term growth conviction while rate speculation drives up volatility.
GCP Student living was also a top performer, after receiving a bid at a 30% premium. This contributed around
half of the total return from our alternatives. While we are reluctant sellers, we have already recycled the
capital into other opportunities within real estate through two new European logistics positions.
Sources: Refinitiv Lipper for Investment Management & Astute Investment Management as at 30/09/2021. Past Performance is not a reliable indicator of future results. All performance is shown net of ongoing charges. Morningstar Target Allocation indices are used as performance comparators. 1 data for the period 20/07/2020 to the 30/09/2021.. 2 data for the period 30/06/2021 to the 30/09/2021, * 2020 data covers the period 20/07/2020 to 31/12/2020. Contribution to return may not sum to the total return due to rounding.
Q3 Retu rns 2
Asset class Avg Weight ReturnContribution to Portfolio Return
Cash & Equivalents 6.1% 0.55% 0.03%
Government 3.1% 1.45% 0.04%
Credit 8.2% 0.20% 0.02%
UK 11.2% 3.09% 0.35%
N.America 25.2% 1.39% 0.42%
Europe 7.7% 3.71% 0.29%
Japan 4.6% 8.14% 0.38%
Asia & Emerging 9.3% -4.37% -0.39%
Alternatives 24.8% 2.86% 0.69%
Fund Name Avg Weight ReturnContribution to Portfolio Return
L&G US Equity ETF 7.68% 3.85% 0.37%
GCP Student Living 1.26% 31.37% 0.36%
Jupiter Japan Income 3.05% 9.35% 0.29%
Xtrackers MSCI USA Financials ETF
3.09% 6.68% 0.20%
JPM UK Equity Core 6.04% 3.03% 0.18%
To p F u n d s
B a l a n c e dP
er
fo
rm
an
ce
1
V T A s t u t e
A s s e t C l a s s e s
1.80%
6.98%
13.09%
15.44%
7.91%
0.00%
5.00%
10.00%
15.00%
20.00%
QTD YTD 1 Year Launch 2020*
Balanced CPI + 1.5% MS Moderate
1.80%
1.07%
0.61%
0.00%
0.20%
0.40%
0.60%
0.80%
1.00%
1.20%
1.40%
1.60%
1.80%
2.00%
Balanced CPI + 1.5% MS Moderate
-5.0%
0.0%
5.0%
10.0%
15.0%
20.0%
Jul-20 Oct-20 Jan-21 Apr-21 Jul-21
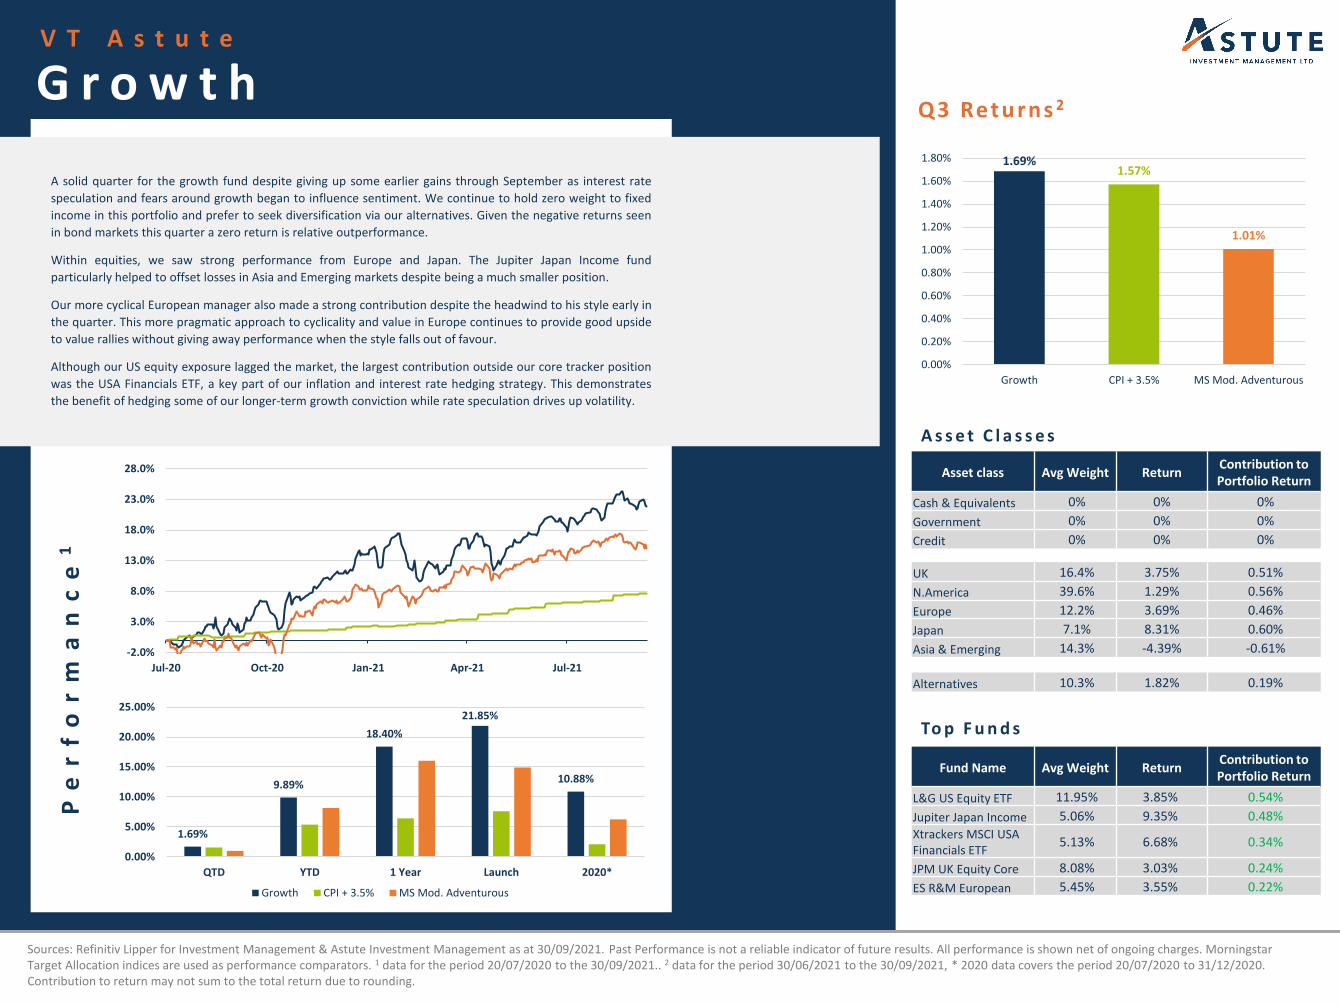
A solid quarter for the growth fund despite giving up some earlier gains through September as interest rate
speculation and fears around growth began to influence sentiment. We continue to hold zero weight to fixed
income in this portfolio and prefer to seek diversification via our alternatives. Given the negative returns seen
in bond markets this quarter a zero return is relative outperformance.
Within equities, we saw strong performance from Europe and Japan. The Jupiter Japan Income fund
particularly helped to offset losses in Asia and Emerging markets despite being a much smaller position.
Our more cyclical European manager also made a strong contribution despite the headwind to his style early in
the quarter. This more pragmatic approach to cyclicality and value in Europe continues to provide good upside
to value rallies without giving away performance when the style falls out of favour.
Although our US equity exposure lagged the market, the largest contribution outside our core tracker position
was the USA Financials ETF, a key part of our inflation and interest rate hedging strategy. This demonstrates
the benefit of hedging some of our longer-term growth conviction while rate speculation drives up volatility.
Sources: Refinitiv Lipper for Investment Management & Astute Investment Management as at 30/09/2021. Past Performance is not a reliable indicator of future results. All performance is shown net of ongoing charges. Morningstar Target Allocation indices are used as performance comparators. 1 data for the period 20/07/2020 to the 30/09/2021.. 2 data for the period 30/06/2021 to the 30/09/2021, * 2020 data covers the period 20/07/2020 to 31/12/2020. Contribution to return may not sum to the total return due to rounding.
Q3 Retu rns 2
Asset class Avg Weight ReturnContribution to Portfolio Return
Cash & Equivalents 0% 0% 0%
Government 0% 0% 0%
Credit 0% 0% 0%
UK 16.4% 3.75% 0.51%
N.America 39.6% 1.29% 0.56%
Europe 12.2% 3.69% 0.46%
Japan 7.1% 8.31% 0.60%
Asia & Emerging 14.3% -4.39% -0.61%
Alternatives 10.3% 1.82% 0.19%
Fund Name Avg Weight ReturnContribution to Portfolio Return
L&G US Equity ETF 11.95% 3.85% 0.54%
Jupiter Japan Income 5.06% 9.35% 0.48%
Xtrackers MSCI USA Financials ETF
5.13% 6.68% 0.34%
JPM UK Equity Core 8.08% 3.03% 0.24%
ES R&M European 5.45% 3.55% 0.22%
To p F u n d s
G r o w t hP
er
fo
rm
an
ce
1
V T A s t u t e
A s s e t C l a s s e s
1.69%1.57%
1.01%
0.00%
0.20%
0.40%
0.60%
0.80%
1.00%
1.20%
1.40%
1.60%
1.80%
Growth CPI + 3.5% MS Mod. Adventurous
1.69%
9.89%
18.40%
21.85%
10.88%
0.00%
5.00%
10.00%
15.00%
20.00%
25.00%
QTD YTD 1 Year Launch 2020*
Growth CPI + 3.5% MS Mod. Adventurous
-2.0%
3.0%
8.0%
13.0%
18.0%
23.0%
28.0%
Jul-20 Oct-20 Jan-21 Apr-21 Jul-21
A s t u t e O b s e r v a t i o n s
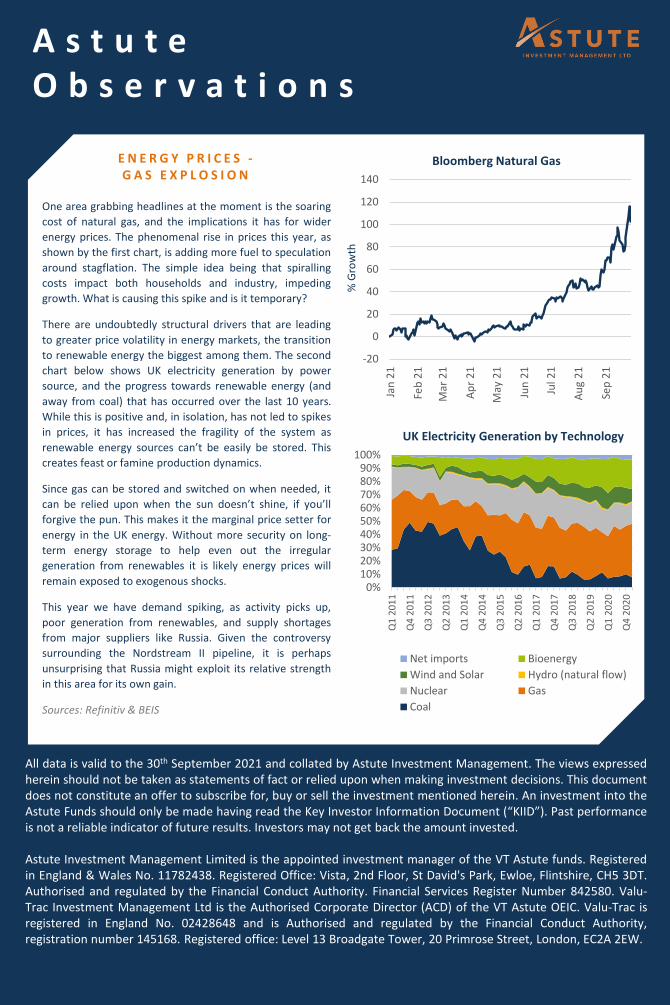
E N E R G Y P R I C E S -G A S E X P L O S I O N
One area grabbing headlines at the moment is the soaring
cost of natural gas, and the implications it has for wider
energy prices. The phenomenal rise in prices this year, as
shown by the first chart, is adding more fuel to speculation
around stagflation. The simple idea being that spiralling
costs impact both households and industry, impeding
growth. What is causing this spike and is it temporary?
There are undoubtedly structural drivers that are leading
to greater price volatility in energy markets, the transition
to renewable energy the biggest among them. The second
chart below shows UK electricity generation by power
source, and the progress towards renewable energy (and
away from coal) that has occurred over the last 10 years.
While this is positive and, in isolation, has not led to spikes
in prices, it has increased the fragility of the system as
renewable energy sources can’t be easily be stored. This
creates feast or famine production dynamics.
Since gas can be stored and switched on when needed, it
can be relied upon when the sun doesn’t shine, if you’ll
forgive the pun. This makes it the marginal price setter for
energy in the UK energy. Without more security on long-
term energy storage to help even out the irregular
generation from renewables it is likely energy prices will
remain exposed to exogenous shocks.
This year we have demand spiking, as activity picks up,
poor generation from renewables, and supply shortages
from major suppliers like Russia. Given the controversy
surrounding the Nordstream II pipeline, it is perhaps
unsurprising that Russia might exploit its relative strength
in this area for its own gain.
Sources: Refinitiv & BEIS
All data is valid to the 30th September 2021 and collated by Astute Investment Management. The views expressedherein should not be taken as statements of fact or relied upon when making investment decisions. This documentdoes not constitute an offer to subscribe for, buy or sell the investment mentioned herein. An investment into theAstute Funds should only be made having read the Key Investor Information Document (“KIID”). Past performanceis not a reliable indicator of future results. Investors may not get back the amount invested.
Astute Investment Management Limited is the appointed investment manager of the VT Astute funds. Registeredin England & Wales No. 11782438. Registered Office: Vista, 2nd Floor, St David's Park, Ewloe, Flintshire, CH5 3DT.Authorised and regulated by the Financial Conduct Authority. Financial Services Register Number 842580. Valu-Trac Investment Management Ltd is the Authorised Corporate Director (ACD) of the VT Astute OEIC. Valu-Trac isregistered in England No. 02428648 and is Authorised and regulated by the Financial Conduct Authority,registration number 145168. Registered office: Level 13 Broadgate Tower, 20 Primrose Street, London, EC2A 2EW.
-20
0
20
40
60
80
100
120
140
Jan
21
Feb
21
Mar
21
Ap
r 2
1
May
21
Jun
21
Jul 2
1
Au
g 2
1
Sep
21
% G
row
th
Bloomberg Natural Gas
0%10%20%30%40%50%60%70%80%90%
100%
Q1
201
1
Q4
201
1
Q3
201
2
Q2
201
3
Q1
201
4
Q4
201
4
Q3
201
5
Q2
201
6
Q1
201
7
Q4
201
7
Q3
201
8
Q2
201
9
Q1
202
0
Q4
202
0
UK Electricity Generation by Technology
Net imports Bioenergy
Wind and Solar Hydro (natural flow)
Nuclear Gas
Coal


![!t Y ZR BP RZ} {B8}s{ R{Y 8 PB R}s $sj I$& t{$t $t tZ8 ...arm/pubs/SC.pdf · sIZ` R 8 t } B{ RR Y R$-Y ITB 7] 3* RYbBR s RZ A stR $sj $8} ... %B ${$ k h jI ZR$t 7]3* $R } R I t $t](https://static.fdocuments.in/doc/165x107/5bfab36109d3f254508c31b7/t-y-zr-bp-rz-b8s-ry-8-pb-rs-sj-i-tt-t-tz8-armpubsscpdf-siz.jpg)