Q-dummies Report: Advanced Child Dummies and Injury Criteria for ...
122
Report obtained from EEVC web site www.eevc.org 1 Q-dummies Report Advanced Child Dummies and Injury Criteria for Frontal Impact Working Group 12 and 18 Report, Document No. 514 April 2008
Transcript of Q-dummies Report: Advanced Child Dummies and Injury Criteria for ...

Report obtained from EEVC web site www.eevc.org 1
Q-dummies Report Advanced Child Dummies and Injury Criteria for Frontal Impact Working Group 12 and 18 Report, Document No. 514 April 2008

EEVC Report – Advanced Child Dummies and Injury Criteria for Frontal Impact April 2008 Document No. 514
Report obtained from EEVC web site www.eevc.org 2
Working Group 12 – Dummies members: Jac Wismans (Chairman, Netherlands) Bernard Been (Secretary, Netherlands) Klaus Bortenschlager (Germany) Richard Damm (Germany) Johan Davidsson (Sweden) Giulio Gertosio (Italy) David Hynd (United Kingdom) Luis Martinez (Spain) Håkan Öhrn (Sweden) Silvia Peluccio (Italy) Xavier Trosseile (France) Philippe Vézin (France)
Working Group 18 – Child Safety members: Luis Martinez (Chairman, Spain) Philippe Lesire (Secretary, France) Farid Bendjellal (United Kingdom) Manuela Cataldi (Italy) Marianne Le Claire (United Kingdom) Stephan Hartweg (Germany) Jean-Philippe Lepretre (France) Bjorn Lundell (Sweden) Lex van Rooij (Netherlands) Britta Schnottale (Germany) Kosras N. Spensas (Greece) Gonzal Tejera (Spain)
Authors: Jac Wismans
Kees Waagmeester Marianne Le Claire
David Hynd Kate de Jager
Anna Palisson Michiel van Ratingen
Xavier Trosseille

EEVC Report – Advanced Child Dummies and Injury Criteria for Frontal Impact April 2008 Document No. 514
Report obtained from EEVC web site www.eevc.org 3
Table of Contents
EXECUTIVE SUMMARY .........................................................................................................................5
1 INTRODUCTION ...............................................................................................................................7
2 CHILD INJURY CAUSATION IN FRONTAL IMPACT................................................................9
3 DEVELOPMENT AND EVALUATION OF THE Q-DUMMIES.................................................13 DUMMY DESCRIPTION................................................................................................................13
ANTHROPOMETRY ..............................................................................................................15 BIOFIDELITY .........................................................................................................................16 INJURY ASSESSMENT .........................................................................................................16 DURABILITY..........................................................................................................................18 CERTIFICATION....................................................................................................................18 REPEATABILITY...................................................................................................................19
COMPARISON WITH US CHILD DUMMY SERIES..................................................................20 CONCLUSIONS...............................................................................................................................21
4 Q-DUMMIES INJURY ASSESSMENT REFERENCE VALUES.................................................23 INTRODUCTION.............................................................................................................................23 METHOD DESCRIPTION ..............................................................................................................23 INJURY CRITERIA .........................................................................................................................24 Q-DUMMIES IARVs .......................................................................................................................24 DISCUSSION and CONCLUSION .................................................................................................26
5 VALIDATION OF DUMMIES AND CRITERIA...........................................................................27 TEST PROGRAM ............................................................................................................................27 RESULTS..........................................................................................................................................28
COMPARISON OF P and Q DUMMIES IN UNECE REGULATION 44 SLED TESTS ...28 APPLICATION OF UNECE REGULATION 44 INJURY CRITERIA................................29 APPLICATION OF NEW INJURY CRITERIA ....................................................................32
CONCLUSIONS...............................................................................................................................39
6 SUMMARY, CONCLUSIONS AND RECOMMENDATIONS ....................................................41
REFERENCES ..........................................................................................................................................43
ANNEX A: ACCIDENT DATABASES FOR CHILD INJURY CAUSATION STUDY .....................45 EUROPEAN DATABASES.............................................................................................................45 NATIONAL DATABASES .............................................................................................................45 SPECIFIC DATABASES.................................................................................................................46 REFERENCES..................................................................................................................................49
ANNEX B: ANTHROPOMETRIC SPECIFICATIONS .........................................................................51
ANNEX C: BIOFIDELITY TEST RESULTS .........................................................................................55 Q0 BIOFIDELITY PERFORMANCE.............................................................................................56
HEAD .......................................................................................................................................56 NECK........................................................................................................................................57
Q1 BIOFIDELITY PERFORMANCE.............................................................................................58 HEAD .......................................................................................................................................58 NECK........................................................................................................................................59 THORAX..................................................................................................................................59 ABDOMEN ..............................................................................................................................60
Q1.5 BIOFIDELITY PERFORMANCE..........................................................................................61 HEAD .......................................................................................................................................61

EEVC Report – Advanced Child Dummies and Injury Criteria for Frontal Impact April 2008 Document No. 514
Report obtained from EEVC web site www.eevc.org 4
THORAX..................................................................................................................................62 ABDOMEN ..............................................................................................................................63
Q3 BIOFIDELITY PERFORMANCE.............................................................................................64 HEAD .......................................................................................................................................64 NECK........................................................................................................................................65 THORAX..................................................................................................................................65 ABDOMEN ..............................................................................................................................66
Q6 BIOFIDELITY PERFORMANCE.............................................................................................67 HEAD .......................................................................................................................................67 NECK........................................................................................................................................68 THORAX..................................................................................................................................68 ABDOMEN ..............................................................................................................................69
ANNEX D: Q-DUMMY SENSORS ........................................................................................................71
ANNEX E: ASSESSMENT OF DURABILITY ......................................................................................73 TEST SET-UP...................................................................................................................................73 TEST PULSE ....................................................................................................................................74 RESULTS..........................................................................................................................................74 REFERENCES..................................................................................................................................77
ANNEX F: ASSESSMENT OF REPEATABILITY ...............................................................................79 INTRODUCTION.............................................................................................................................79 RESULTS AND DISCUSSION.......................................................................................................79
COMPONENT AND IMPACTOR TESTS.............................................................................79 DURABILITY SLED TESTS ON RIDIG SEAT ...................................................................80 CHILD RESTRAINT SYSTEM TESTS ACCORDING UNECE R44 .................................81
CONCLUSIONS...............................................................................................................................85
ANNEX G: Q-DUMMIES FRONTAL INJURY CRITERIA .................................................................87 INTRODUCTION.............................................................................................................................87 METHOD..........................................................................................................................................87
SCALING METHOD...............................................................................................................87 DETERMINATION OF THE SCALING RATIOS................................................................89 CHILD PROJECT METHOD..................................................................................................92
INJURY CRITERIA .........................................................................................................................93 HEAD .......................................................................................................................................93 NECK........................................................................................................................................97 THORAX..................................................................................................................................99
REFERENCES................................................................................................................................101
ANNEX H: DETAILS OF VALIDATION TEST PROGRAM ............................................................103 PROTOCOL....................................................................................................................................103
DUMMY SELECTION AND CONFIGURATION .............................................................103 TEST MATRIX......................................................................................................................103 DATA ANALYSIS AND FOLLOW-UP..............................................................................104
ANNEX I: DETAILS OF INJURY ASSESSMENT REFERENCE VALUE VALIDATION ............105 CRS “PASS” and “FAIL” DISTRUBUTION PER SET OF IARVs ............................................105
ECE R94 SCALED IARVs....................................................................................................107 AIS3+ 20%CM and LR IARVs .............................................................................................108 AIS3+ 50%CM and LR IARVs .............................................................................................109
IN-DEPTH IARV EVALUATION ASSESSMENT .....................................................................110 INJURY CRITERIA CROSS-POLTS...................................................................................110 ANALYSIS OF GROUP 0+ CRS’s.......................................................................................113 ANALYSIS OF GROUP I CRS’s..........................................................................................115 ANALYSIS OF GROUP II CRS’s ........................................................................................120
EEVC Report – Advanced Child Dummies and Injury Criteria for Frontal Impact April 2008 Document No. 514
Report obtained from EEVC web site www.eevc.org 5
Q-dummies Report
Advanced Child Dummies and Injury Criteria for Frontal Impact
EXECUTIVE SUMMARY Each year, 700 children are killed on European roads and 80,000 are injured. This represents an unacceptably high burden on Europe’s society and economy. Although it is not known exactly how many of these deaths and injuries occur in UNECE Regulation 44 approved CRS’s (Child Restraint Systems), it is considered that there is significant scope for improvement in the design of CRS’s. Currently CRS’s are homologated through testing with the so-called P-dummies that were developed in the 1970s. These dummies were primarily designed to act as loading devices with appropriate dimensions and mass distribution but with limited measurement capability. The new generation of child dummies called Q-dummies has a much more human like behaviour in CRS impact tests with regards to anthropometry, kinematics and biomechanics and facilitates injury risk assessment in critical body parts. These new dummies are designed to bring a large step forward for impact protection of children in cars. This report describes the design and evaluation of the new generation of child dummies. These dummies are developed to replace the P-dummies in the UNECE Regulation 44. Chapter 1 gives some background on the research and development efforts that resulted in the new Q dummies and its injury assessment reference values. Chapter 2 summarizes the work of EEVC WG18 in reviewing European accident statistics. The study shows that for small children (up to 3 years of age) head and neck injury mitigation have the highest priority, shifting to head, chest and abdomen as children grow up and get taller. Consequently the new generation of child dummies should have injury assessment capabilities for the head, neck, chest and abdomen area.

EEVC Report – Advanced Child Dummies and Injury Criteria for Frontal Impact April 2008 Document No. 514
Report obtained from EEVC web site www.eevc.org 6
Chapter 3 provides an overview of the development history of the Q-dummy series since 1993 and gives a summary of the design on aspects of anthropometry, biofidelity, injury assessment capability and instrumentation, durability, certification and repeatability of the Q-dummy family in a condensed manner. Moreover the comparison of the Q-dummies with the US Hybrid III and CRABI child dummies is presented. Chapter 4 describes the research that resulted in dummy age/size specific injury assessment reference values (IARVs). A number of well document real world accidents were reconstructed in crash tests with Q-dummies. Validated Q-dummy measurements were correlated with the injuries sustained in real world accidents. Available accident data from various ages were scaled to 3 year old data and AIS3+ injury risk functions for this age were developed. For some parameters that appeared to have insufficient Q-dummy to accident correlation data, scaling techniques were applied to data available for the 50th percentile male adult dummy (Hybrid III 50th) and for the Hybrid III 3 years old dummy. Based on old AIS3+ injury risk functions for the 3 year age, injury assessment reference values for 20% and 50% injury risk are derived and scaled to the other age groups to obtain age group specific IARVs for the complete Q dummy family. Chapter 5 describes the research performed to study and quantify the effect of introduction of the Q-dummies and the new criteria in UNECE Regulation 44. Through a program with 320 UNECE R44 tests on both P- and Q dummies a comparison of their performance is made with regards to kinematics. The test program demonstrated equivalence between the P and the Q dummy series using current UNECE R44 criteria. The minor differences in the behaviour and measurement output values that are found can be contributed to the more advanced design and more human like performance of the Q-dummies. By applying the new injury criteria to the test results of the Q-dummies it was demonstrated that in all age groups, some child restraint systems comply with the new criteria. Applying the AIS3+ 50% injury risk, 83% of the Group 0+ population of child restraint systems passed and 33% of the Group I and Group II population passed the criteria. These s numbers shows that adoption of the Q dummies and the new injury criteria would pose a significant challenge for improved performance of the CRS’s in the UNECE Regulation 44 age groups I, II and III. In Chapter 6 based on the extensive evaluation and validation described in this report it is recommended to replace the current P-dummies in the test procedures of UNECE R44 with the Q-dummies. It is recommended to implement four new injury criteria complementary to the current UNECE R44 (kinematic) criteria. With regards to the injury assessment reference values (IARVs) it is recommended to apply the set based on AIS3+ 50% injury risk.

EEVC Report – Advanced Child Dummies and Injury Criteria for Frontal Impact April 2008 Document No. 514
Report obtained from EEVC web site www.eevc.org 7
1 INTRODUCTION Each year, 700 children are killed on European roads and 80,000 are injured [1]. This represents an unacceptably high burden on Europe’s society and economy. Although it is not known exactly how many of these deaths and injuries occur in UNECE Regulation 44 approved CRS’s (Child Restraint Systems), it is considered that there is significant scope for improvement in the design of CRS’s. The fact that such poor results are observed despite the normal use of UNECE Regulation 44 approved CRS’s, underlines the high social importance of continued child safety research. Regardless of many initiatives being taken in Europe and elsewhere, progress made in child safety in the last decade can be considered small, in particular compared to the advancements made in adult occupant protection in that same period. Important contributors to this situation are the lack of biomechanical knowledge on injury mechanisms and associated physical parameters, specifically for children. The European Commission (EC) has recognized that it is only through a decisive increase of the basic scientific knowledge that major steps can be achieved towards improved standards and more efficient design of CRS’s. For this reason the CREST (Child Restraint Standards, 1996-2000) and CHILD (Child Injury Led Design, 2002-2006) projects were initiated to develop the knowledge on child behaviour and tolerances. The outcomes of EC-CREST and EC-CHILD can be used to make recommendations on the Q-series dummies, and the injury criteria and injury risk functions to be used with those dummies [1] and [2]. As a result of these projects the Q-series of child dummies (see Figure 1) are currently available for CRS testing.
Figure 1: Q-series of child dummies (left to right Q1.5, Q3, Q0, Q6 and Q1)
EEVC Report – Advanced Child Dummies and Injury Criteria for Frontal Impact April 2008 Document No. 514
Report obtained from EEVC web site www.eevc.org 8
The European Enhanced Vehicle-safety Committee (EEVC) wants to promote the use of more biofidelic child dummies and biomechanical based tolerance limits in regulatory and consumer testing. It initiates the assessment of new child dummies and criteria for child occupant protection in frontal impact. Therefore, EEVC WG12 and WG18 carried out collaborative research following four basic steps:
(i) identification of child injury causation in frontal impacts based on real world data,
(ii) completion and consolidation of the specifications of the Q-series of advanced child dummies,
(iii) recommendation for new injury criteria and tolerance limits for frontal impact, and
(iv) a validation test program based on UNECE R44 test conditions, comparing P and Q dummy performance in frontal CRS tests.
For the latter part, eleven European organizations including OEMs, research institutes and child restraint manufacturers performed 320 tests covering 30 available child seats. These seats represent the majority of existing child seat categories on the European market. This report starts with an overview on child injury causation. Chapter 2 presents a synthesis of frontal crash investigations including those performed under the CREST and CHILD projects. Next, the development and evaluation of the Q-dummy family (including Q0, Q1, Q1.5, Q3 and Q6) are described (Chapter 3). In Chapter 4, the newly proposed child dummy injury criteria are defined. The comparison of P- and Q-dummies and validation of Q-dummies and their new criteria and tolerance values are reported in Chapter 5. In the latter chapter, a detailed analysis of 320 test results covering 30 child seats will be presented, showing the effect and potential benefit of introducing new test dummies and criteria into legislation. Finally in Chapter 6 a summary with conclusions and recommendations is given. Background and detailed information is provided in Annexes.

EEVC Report – Advanced Child Dummies and Injury Criteria for Frontal Impact April 2008 Document No. 514
Report obtained from EEVC web site www.eevc.org 9
2 CHILD INJURY CAUSATION IN FRONTAL IMPACT One of the first tasks of EEVC WG18 was to review the European accident statistics with respect to child car occupants and injuries in all type of car crashes. For this purpose, the most important existing databases in Europe have been examined. These databases are described in more detail in Annex A. Data from the International Road Traffic Accident Database (IRTAD) show that in 1998 on average two children were killed each day. The tendency for Europe over the past ten years is that the total number of children killed as car occupants is decreasing. This can be seen as one of the effects of the general adoption of a European regulation on child restraints. An overall positive effect of restraint use by children when travelling in cars is found in all reviewed databases (see Annex A). The rate of severe injuries is more than twice as high for unrestrained children than for restrained children in frontal impact, which is the most common crash configuration [database: LAB CSFC 1996]. The risk of being severely injured as car occupant is very small for correctly restrained children up to a delta V of 40 km/h in a frontal impact. However, special attention should be paid to avoid CRS misuse and to make sure that clear information is forwarded to the public area about child safety and injury risk related to accidents.
To draw more detailed conclusions, WG18 has accessed and examined the following databases: CREST (Child Restraint STandard, as developed in the European collaborative research project), CCIS (the Co-operative Crash Injury Study in the UK), GIDAS (German In Depth Accident Study), GDV (German Insurance), IRTAD and LAB (Laboratory of Accidentology and Biomechanics in France). All of these databases have specific definitions and data collection methods, which makes it difficult to merge the data for analysis. Nevertheless for frontal impact, generally sufficient information was available in each database to classify injury causation according to the different group of child restraint system used. The CRS’s were put in categories according to the weight group existing in the UNECE Regulation 44-03. For most of the systems, the level of protection per body segment is indicated (legend for level of protection: green = satisfying, yellow = to be improved, red = not sufficient). Carrycot (Group 0): The number of crash cases available is too low to draw conclusions about general injury mechanisms.
Rearward facing infant carrier (Group 0/0+): • Good protection in frontal impact with generally few injuries. • Head injuries are the most commonly observed severe injuries
suggesting that introduction of effective padding may further reduce injury risk.
• Three different injury mechanisms are hypothesised: 1- Impact through the shell with the dashboard (67% of rear infant
carriers are on front passenger seats) 2- Direct impact of the head on supporting object

EEVC Report – Advanced Child Dummies and Injury Criteria for Frontal Impact April 2008 Document No. 514
Report obtained from EEVC web site www.eevc.org 10
3- Rebound can also be a source of injury • Severe head injuries: 60% skull fracture and brain injury, 30% skull
fracture only, 10% brain injury without skull fracture. • Limbs are also representing a relatively high number of injuries, but
only a few are considered as severe. Therefore limb injuries are of less priority.
Rearward facing system with harness (Group I): • Severe head injuries are less frequent in frontal impact
with such devices than with rearward facing infant carriers.
• Rear facing CRS are considered more effective in frontal impact compared to forward facing CRS.
• Limb (especially arm) injuries are observed. • Most popular in Scandinavia
Forward facing system (Group I): • Head injuries are most frequently observed. • Head injuries are caused due to:
1- Direct impact 2- Angular acceleration that can occur either with or
without impact results in diffuse brain injuries. • Neck protection is important even if these injuries are not
very frequently observed. They can lead to permanent disability or fatality.
• Chest and abdominal injuries are not frequently found.
Forward facing system with shield (Group I) and shield system (Group II): • The main sources of data are from the UK and France where these
devices are not very popular. No accident data are available at this time but some observations from experts were collected.
• Head contact with the top of the shield, risk of ejection (total or partial) and/or submarining are likely scenarios causing injuries.
Forward facing seat and adult seatbelt (Group I/II/III): • In most of the analysis of databases these systems were considered
as booster seats (see below). • For children whose age is corresponding to Group I, the risk of neck
injuries is as high as for forward facing systems with harness (see forward facing systems above).

EEVC Report – Advanced Child Dummies and Injury Criteria for Frontal Impact April 2008 Document No. 514
Report obtained from EEVC web site www.eevc.org 11
Booster seat and adult seatbelt (group II/III): • Head is still the most important body area in terms of frequency of
severe injuries. • The relative importance of abdominal injuries increases with such
restraint systems. The penetration of the seatbelt in the soft organs creates injuries at the level of liver, spleen, and kidney. The protection of the abdominal area is clearly a priority to ensure a good protection of children using a CRS on which they are restrained by the adult seatbelt.
• Chest injuries are not frequently reported. Nevertheless, as the chest cavity protects vital organs, it remains an important body segment. In general chest injuries occur without rib fractures due to chest compliance of children. Chest compression is the injury mechanism.
• The pelvis is not a priority body region in frontal impact. • Limb fractures are numerous, but are not a priority in terms of child
protection for the moment.
Booster cushion and adult seatbelt (group II/III): • Injury causation is the same as for booster seats. • In comparison with booster seats an increase of the
number of chest injuries is found, due to the fact that children using these CRS are generally older (less compliant chest) than the ones using booster seats.
Adult seatbelt: • Many children were only restrained by the adult seatbelt, while they
would be better protected by using a CRS. • Injury causation for children using only the adult seatbelt are similar
to the ones using booster cushions, but with worse injury outcome, especially in the abdominal region.
CONCLUSIONS
The review of child occupant injuries related to CRS systems used in frontal impact has demonstrated that the whole priority should lie on protecting the head and neck from injury for infants and toddlers (Group 0/1), shifting to head, chest and abdomen as children grow up and starting to become taller (Group 2/3/adult belt). It is important that new dummies and criteria reflect these injuries observed in the field. Consequently, injury assessments are recommended for the head, neck, chest and abdomen area.

EEVC Report – Advanced Child Dummies and Injury Criteria for Frontal Impact April 2008 Document No. 514
Report obtained from EEVC web site www.eevc.org 12
(Left blank intentionally)

EEVC Report – Advanced Child Dummies and Injury Criteria for Frontal Impact April 2008 Document No. 514
Report obtained from EEVC web site www.eevc.org 13
3 DEVELOPMENT AND EVALUATION OF THE Q-DUMMIES The P-series is a series of crash test dummies representing children in the age of six weeks (P0), 9 months (P¾), 18 months (P1.5), three years (P3), 6 years (P6) and 10 years (P10) old. The P-dummies (‘P’ from Pinocchio) were the first European child dummies to become approved in 1981, when the UNECE Regulation 44 [3] came into force. Later, the dummies were also adopted by other standards such as EuroNCAP. The P-series, despite being simple in design and limited in measurement capability, gave a substantial contribution to the protection of children in cars. However, more knowledge on biomechanics related to children and the changing nature of exposure (airbags, belt systems) made that the P-series become less appropriate in time. During the nineties the CRABI (Child Restraint Air Bag Interaction) and Hybrid III child dummies were developed in particular to address the growing problem of child-airbag interaction in the US. In Europe, research has been focused on the development of a new child dummy series that would bring major improvements in terms of biofidelity and instrumentation and that could be used for a range of applications including side impact. In 1993, an international Child Dummy Working Group (CDWG) was formed to develop the Q-series as the successor of the P-dummy series. This group, consisting of research institutes, CRS and dummy manufacturers and OEM’s, determined the anthropometry, biofidelity, measurement capabilities and applications for the new family of dummies [4, 5, 6, 7, 8, 9 and 10]. Under its surveillance, also the development of the first Q dummy, Q3, started. In 1997, this work was continued as part of the EC sponsored CREST (Child Restraint System STandard) research program. Within the CREST and the consecutive CHILD (Child Injury Led Design) projects, the new-born (Q0), the 12-month (Q1), three-year old (Q3) and six-year-old (Q6) dummies were delivered and used in accident reconstruction. In 2003, the most recent dummy was added to the series: the Q1.5, representing a child of 18 months old. Since their original release, the Q-dummies have undergone updates, in particular to improve the overall durability in frontal impact. The Q-dummies were particularly tailored to meet the (high-end) loading demands of EuroNCAP and NPACS testing, taking into account the deceleration profile of modern day vehicles. This chapter summarises the status of the Q-dummy series today. The dummy design and performance particularly for frontal impact are described. In addition, the main differences with the US child dummy series are given.
DUMMY DESCRIPTION Specific design features of the Q-dummies are: the anatomical representation of body regions, modular design, dummy-interchangeable instrumentation, multi-directional use (frontal & side impact) (see note) and easy handling properties (limited components, easy assembly/disassembly, simple calibration). Note: The initial goal was to develop dummies for multi directional use, however, priority has been given to
reach compliance with frontal impact performance targets. As a result the side impact performance is sub-optimal. Improved side impact performance is reached through the development of dedicated side impact

EEVC Report – Advanced Child Dummies and Injury Criteria for Frontal Impact April 2008 Document No. 514
Report obtained from EEVC web site www.eevc.org 14
versions of Q-dummies in America. Recently the Q3s and Q6s are delivered to NHTSA, Transport Canada and OSRP for evaluation.
The dummy layout of the Q1, Q1.5, Q3 and Q6 is similar. The design of the head, the neck, the shoulder, the clavicle, the thorax, the lumbar spine, the abdomen and the extremities show a realistic (yet stylized) anatomy compared to the human anatomy. The head and the clavicle are made entirely from plastics. The neck and the lumbar spine are represented by a column composed of metal and a natural rubber, that allows shear and bending in all directions. The thorax consists of a deformable ribcage and a metal thoracic spine. The clavicle is connected to the thorax at the front of the ribcage and to the shoulders at the arm side. The shoulders are made of natural rubber with metal end plates which are connect to the upper arm on one side and the thoracic spine on the other side. The lumbar spine is mounted between the pelvis and the thoracic spine. The abdomen is a skin-covered foam insert, which fits in between the ribcage and the pelvis. The pelvis is made out of two parts: a metal pelvic bone representation and a soft plastic pelvis flesh. Finally, the extremities are a combination of plastics and metal. The Q1, Q1.5, Q3 and Q6 show a representation of the elbow, shoulder, hip and knee joints. The anthropometry of a new-born child makes it difficult for the design of the Q0 to maintain the dummy lay-out of the other Q-dummies. The limited space reduces the anatomical representations of body regions. For the Q0, its design therefore results into eleven body parts: head, neck, shoulder block, two arms, thoracic spine, lumbar spine, thoracic flesh, pelvis block and two legs. The materials used are similar to those used in the other Q-dummies. The legs and arms are flexible and have neither skeleton representation nor knee and elbow joints, respectively. Instead, the angles between upper and lower leg and upper and lower arm are fixed. The torso flesh foam part represents the ribcage and the abdomen. It is made of foam covered by a vinyl skin. The neck and lumbar spine are of a similar design as other Q series members [11]. The following sections on anthropometry, biofidelity and other aspects give more background to the Q dummy series. In Figure 2 a family picture of the Q-series is given as well as a picture of the Q1.5 dummy without suit.
Figure 2: Q-series of child dummies (left); Layout of Q1.5 dummy (right)

EEVC Report – Advanced Child Dummies and Injury Criteria for Frontal Impact April 2008 Document No. 514
Report obtained from EEVC web site www.eevc.org 15
ANTHROPOMETRY To establish humanlike dimensions for the Q-dummies, a special Child Anthropometry Database, CANDAT, has been built [6 and 7]. The database contains the newest available child data from birth to 18 years collected from different regions (US, Europe and Japan). The data were combined, inconsistencies solved and gaps filled to calculate the averages for important body dimensions and mass for the Q-series (Figure 3).
Figure 3: 5th, 50th and 95th Percentile child body mass (y) vs. age (x) in CANDAT. For adoption of the Q-dummy series, it is important that the body mass corresponds with the manikin body mass as defined in regulation. In UNECE R44, a child restraint system falls into one of five defined mass groups. Each mass group has a lower and upper boundary. Therefore, two child dummies are necessary to validate a child restraint system. Below, in Table 1, the body mass of the Q-dummy series is compared with the weight groups of UNECE R44. In Annex B, the main dimensions and the segment masses of each Q-dummy are compared with the manikin requirements as defined in UNECE R44. Table 1: Comparison of Q-dummy body mass with UNECE R44 weight groups.
ECE R44 mass groups with corresponding Q-dummy ECE R44
mass group Group 0 Group 0+ Group I Group II Group III
Lower (LL) and Upper (UL) limit LL UL LL UL LL UL LL UL LL UL
ECE R44 mass [kg] - <10 - <13 9 18 15 25 22 36
Q-dummy Q0 Q1 Q0 Q1.5 Q1 Q3 Q3 Q6 Q6 -
Dummy mass [kg] 3.4 9.6 3.4 11.1 9.6 14.6 14.6 22.9 22.9 -
The mass groups are covered by the Q-dummy series with exception of the Q-dummy for the upper boundary of a group III seat that is not yet available. As expected, the segment masses and the main dimensions of the Q-dummy series are slightly different from the manikins as defined in UNECE R44, which are based on the P-dummy anthropometry and not CANDAT.
Age in [years]
Body mass in [kg]

EEVC Report – Advanced Child Dummies and Injury Criteria for Frontal Impact April 2008 Document No. 514
Report obtained from EEVC web site www.eevc.org 16
BIOFIDELITY For ethical reasons, the availability of biomechanical data on children is very limited. Therefore, the scaling approach was adopted to derive a set of biomechanical response design targets for the Q dummy series. First, a set of accepted human body responses to frontal and side impact have been determined [12, 13, 14, 15, 16 and 17]. Subsequently, a study was made of the characteristics of the human body, both of adults and children [8 and 9]. Finally, scaling methods using adult data, combined with the data on human body tissue characteristics were used to derive child response characteristics from adult data [18, 19, 20 and 21]. For frontal impact, biofidelity impact response requirements have been set-up for the head, the neck, the thorax and the abdomen and the lower extremities and for lateral impact the set of biofidelity requirements is extended with requirements for the shoulder, thorax and the pelvis. It should be noted that due to the (many) assumptions made in the scaling process, these requirements should be treated as design targets rather than strict specifications. This is particularly true for the soft tissue regions i.e. child chest and abdomen, as the scaling methods do not take into account viscous behaviour. For the assessment of the biomechanical response in frontal impact, the head, the neck, the thorax and the abdomen are considered the most important body parts (head and neck only for Q0). The biomechanical target of the Q-dummy heads is based on the rigid surface cadaver drop tests conducted by Hodgson and Thomas [22]. The head biofidelity for frontal impact has been assessed by a free-fall head drop test with a drop height of 130 mm. The neck response requirement for flexion-extension has been established by scaling human volunteer and cadaver data of Mertz and Patrick [23]. Head-neck pendulum tests were performed to assess the neck biofidelity of the Q-dummy series. The thorax frontal response requirement is based on two series of blunt-frontal, mid-sagittal impactor tests reported by Kroell [24 and 25], Nahum [26] and Stalnaker [27]. Thorax impactor tests, using a dummy specific pendulum, were performed to assess the biofidelity of the thorax. For the abdomen, a frontal belt loading requirement has been defined. It is based on living porcine experiments [28] and [29]. Whilst the biofidelity targets developed by the Child Dummy Working Group have not been explicitly reviewed by WG12, the biomechanical data used are a subset of the 50th percentile male requirements recommended by WG12 [30]. Results of the biofidelity testing are given in Annex C. The biofidelity responses of the head and the neck of all Q-dummies are within the corridor. The biomechanical performance of the Q1, Q1.5, Q3 and Q6 thorax is generally above the linearly scaled targets, in particular at the lowest impact velocity. WG12 considers it to be acceptable that the thorax responses are above the corridors, because it is the best compromise in view of the biofidelity performance targets and durability and repeatability requirements.
INJURY ASSESSMENT The Q-dummy series allow the measurement of a number of responses covering the needs that follow from the field accident research (see Chapter 2). With regards to abdomen no final injury assessment capability is found yet (see note below). In UNECE R44 the application of clay between abdomen and lumbar spine in P-dummies is prescribed. In

EEVC Report – Advanced Child Dummies and Injury Criteria for Frontal Impact April 2008 Document No. 514
Report obtained from EEVC web site www.eevc.org 17
practice the deformation of the clay is not very effective to establish submarining, additional video analysis is necessary to obtain convincing evidence. In Q-dummies the application of clay is not possible, however, the use of the lower lumbar spine load cell and angular velocity sensor (ωy) in the pelvis are found to be effective to detect submarining [31]. The set of instrumentation is similar for Q1 and Q1.5 and for Q3 and Q6. The type of load cells, the head angular velocity sensors and the accelerometers are generally interchangeable between all Q-dummies. Table 2 shows the set of instrumentation per Q-dummy and Figure 4 provides an overview of the instrumentation layout in the Q1.5 dummy. In Annex D, the specifications of the Q sensors are given. Note: Various abdominal sensor systems have been developed and tested in the CHILD project on Q3 dummy.
Despite promising results, these sensors are for R&D purpose only due to their lack of robustness and their failure to show correlation with injury data. The further development of an abdominal measurement capability is addressed in a new European research project proposal called CASPER. This proposal is approved by the European Commission and currently under contact negotiation. The project will most probably start in spring 2008.
Table 2: Minimum set of instrumentation per Q-dummy. Instrumentation Dummy Sensor Region Q0 Q1 / Q1.5 Q3 / Q6
3-axis accelerometer Head Thorax Pelvis
6-axis load cell Upper neck Lower neck Lumbar spine
3-axis angular rate sensor Head
Displacement sensor Chest
Figure 4: Q1.5 instrumentation layout.

EEVC Report – Advanced Child Dummies and Injury Criteria for Frontal Impact April 2008 Document No. 514
Report obtained from EEVC web site www.eevc.org 18
DURABILITY The potential use of the Q-dummy series in EuroNCAP full-scale and NPACS body-in-white or sled testing requires that the dummies have to durable in severe loading conditions. The definition and assessment of the durability level required for the Q-series was based on a set of well defined test conditions. For this purpose, the UNECE R44 sled was equipped with a rigid wooden seat. The crash pulse for durability testing was based on vehicle B-pillar accelerations taken from actual EuroNCAP tests (64 kph frontal ODB tests). Every dummy sustained over 30 tests without any damage. A detailed report on the durability assessment for Q1, Q1.5, Q3 and Q6 is given in Annex E. From the test series it is concluded that the Q-dummy series is durable to (at least) the level of EuroNCAP test conditions. It must be noted that the dummy rib cage and extremities, being constructed from plastic materials, can show a limited life time as a result of fatigue and/or overloading. It is recommended to regularly inspect the dummy carefully and check its performance consistency with the certification procedure described in the manuals [32, 33, 34, 35 and 36].
CERTIFICATION Depending on the impact direction of the tests in which the dummy will be used the dummy needs to be certified for either frontal or side. In this report only frontal use of the Q dummies is consider. For frontal use the following body parts need to be certified: the head, neck, thorax, lumbar spine and abdomen. Figure 5 shows the certification test overview for frontal impact certification of the Q-dummies. The certification procedures and criteria for each dummy are described in full detail in the respective dummy user manuals [32, 33, 34, 35 and 36].
Figure 5: Q-dummy certification tests overview (for dummy use frontal tests). All certification tests are component tests with exception of the thorax impactor test, which is a full body test. For Q0, only the head and neck needs to be certified. To perform the certification tests special equipment is required: a head drop table, a wire suspended pendulum for the thorax impactor tests with dummy specific impactor (mass and diameter are dummy specific), an abdomen compression device, a part 572 pendulum and a dummy
EEVC Report – Advanced Child Dummies and Injury Criteria for Frontal Impact April 2008 Document No. 514
Report obtained from EEVC web site www.eevc.org 19
specific head forms for the neck and lumbar spine certifications. How frequent the Q dummies must be certified depends on the type and severity of the tests in which the dummy is used.
REPEATABILITY The level of repeatability of dummy responses is often expressed in the Coefficient of Variation (CV = Standard Deviation / Mean value). In crash tests with adult dummies the number of variables is large, therefore a CV up to 10% is considered to be acceptable. In Annex F an overview of the variables that influence the test repeatability are specified in three levels.
1. In component and full body impactor tests, that are considered to be highly repeatable the number of variables involved is small. In those tests the dummy, the impact pulse and the temperature of the setup are the main variables and a CV of 5% is considered to be acceptable.
2. In the rigid seat sled tests as described in Annex E more variables are involved. In those tests the dummy positioning and belt tightening as well as the dummy to seat interaction (stick-slip due to friction) are added to the list of variables and a CV of 7% is considered to be acceptable.
3. In UNECE R44 CRS tests the list of variable is increased with the CRS, the positioning and tightening of the CRS to the bench as well as CRS to bench interaction (stick-slip due to friction) and the bench itself. For the UNECE R44 CRS tests a CV of 10% is considered to be acceptable.
In Annex F the repeatability in all three levels of dummy testing: component, rigid seat sled and UNECE R44 CRS testing is assessed. Considering the component tests, that are done regularly in the dummy certification procedure according to the dummy manuals [32, 33, 34, 35 and 36], it is concluded that the dummies themselves show repeatability with a Coefficient of Variation between 1 and 3%. The rigid seat durability sled tests with Q1 as described in Annex E show CV’s between 6 and 12% (one parameter shows 18%). Taking into account the sled pulse CV of 5% and the large number of variables that influence the test repeatability, it is concluded that the CV for the dummy itself is for four parameters smaller than 5% (very good) for two parameters smaller than 10% (good). A more sophisticated test method repeatability assessment is possible using the large data base of 320 UNECE R44 Child Restraint System tests with P- and Q-dummies. Having two tests on each configuration allows a repeatability comparison between P- and Q dummies as well as an assessment of the repeatability of the new injury criteria parameters measured with the Q dummies. The comparison of the current UNECE R44 parameters: Head excursion in X and Z direction and the Chest resultant acceleration (3ms) shows that test with Q-dummies are slightly better repeatable (CV = 3.5%) than the tests with P dummies (CV = 4.4%). The new parameters measured with the Q-dummies show a very good overall repeatability with an overall CV of 7.8%. The Group 0+ tests show the worst values with CV = 11.1%. This may be contributed to friction (stick-slip) effects of the dummy to seat and seat to bench that are likely to occur because these tests are all rearward facing. Group II tests show next best repeatability with CV = 8.1%, while Group I tests show CV = 6.2%. From the repeatability shown in the Group

EEVC Report – Advanced Child Dummies and Injury Criteria for Frontal Impact April 2008 Document No. 514
Report obtained from EEVC web site www.eevc.org 20
I tests with Q1, Q1.5 and Q3 and age Group II with Q3 and Q6, taking into account that the dummy is only one of the items that introduce test to test variation, it can be concluded that the dummies themselves have shown excellent repeatability.
COMPARISON WITH US CHILD DUMMY SERIES In 1987, the development of the CRABI and Hybrid III child dummies was started by two SAE task groups, the Hybrid III dummy family task group and the Infant dummy task group. The CRABI (Child Restraint Air Bag Interaction) dummies represent children in the age of 6, 12 and 18 month old for use in assessing airbag interactions with rear facing child restraints. The Hybrid III child dummies are representatives of 3, 6 and 10 years old children. These dummies are designed primarily for use in frontal loading conditions, with special attention given to OOP (Out-Of-Position) test conditions [37]. The anthropometry of these dummies has been derived from children in the United States. The biofidelity requirements were obtained by scaling the biomechanical response corridors for the mid-size adult male that were used to develop the Hybrid III dummy, using dummy dimensions (ref. Irwin, [38]). The Hybrid-III and CRABI child dummies are built up from metal, vinyl and foam, similar to the adult dummies. The main differences between the US child dummies and the Q-dummy series are seen in the areas of anthropometry, the biofidelity, design and application. The anthropometry of the US child dummies is based on the US child population in the eighties, while Q-dummies have been based on US, European and Japanese data combined brought together in CANDAT. The set of biofidelity requirements as defined for the Q-dummy series is more elaborated than given for the US child dummies. The US child dummy biofidelity concerns mainly head, neck and chest requirements in frontal impact while the Q-dummy series also have requirements for the abdomen, shoulder and pelvis in front and/or side. The interpretation of biofidelity also varies: for example, the head biofidelity requirement of the Q-dummy series is based on the non-fracture zone of impact while the CRABI and HIII child dummy head requirement focuses on the fracture zone. In design the two series of dummies differ most: the US dummies represent a tradition of building dummies that became established in the seventies when the Hybrid-II was developed. The child dummy designs are derived from the adult dummies using similar materials and design principles (scaling). The Q-series signify a different design approach, using plastics and high density foams. Finally, the Q-dummy series have been primarily designed for frontal UNECE R44 and future side impact testing, while the US child dummies are used in FMVSS 208 and 213, including all kinds of out of position testing.

EEVC Report – Advanced Child Dummies and Injury Criteria for Frontal Impact April 2008 Document No. 514
Report obtained from EEVC web site www.eevc.org 21
CONCLUSIONS In this chapter, a brief description of the Q-series of child dummy was given. The dummy series currently includes the most important sizes required for testing the majority of child seats available on the market. These are the new-born (Q0), the 12-month (Q1), the 18-month (Q1.5), the three-year old (Q3) and the six-year-old (Q6) dummies. The 10-year old Q10 is not yet available but under development. Note: The development of the Q10 is addressed in a new European research project proposal called EPOCh.
This proposal is approved by the European Commission and currently under contract negotiation. The project will most probably start in spring 2008. The planned date for Q10 prototype delivery is autumn 2009, in spring 2010 the evaluation result are planed to be available.
From the start of the development, a wide scope of application for the Q-series has been taken into account. The background information on which the series was developed was collected and derived with this application in mind. Through European cooperation specifications have been agreed, dummies developed and validated. In the final phase of development most effort has gone into ensuring that the durability of the dummy series is up to the standard required for ECE, EuroNCAP and NPACS testing. It is recognized that the development phase of the Q-series largely has run parallel to the development and enhancement of the Hybrid-III series in the US. The Hybrid-III family is fundamentally different from the Q-dummy family in terms of design philosophy (scaling methodology), lay-out, and source information used. These dummies have been developed with a focus on OOP testing and FMVSS213, rather than ECE, EuroNCAP and side impact CRS testing. Besides the frontal impact capabilities as extensively reported in this document the Q-dummies have the potential to be utilised for side impact as well as. Recent developments in the US under contact of NHTSA, OSRP and Transport Canada delivered a Q3 and Q6 version optimised for side impact. These dummies called Q3s and Q6s have their main modification with respect to their frontal cousins in the shoulder, chest and pelvis area. The new Q-dummies versus the current P-dummies comparison can be summarised with the following point:
• Q-dummies design has a sound scientific base for its anthropometry requirements whereas it is for P-dummies based on estimates made back in the 1970s. New anthropometry item are: Tuned mass distribution, internal and external dimensions and joints degrees of freedom.
• Q-dummies design has a sound scientific base for its biofidelity design targets whereas the P-dummies have no biofidelity references at all. New biofidelity items are: Head impact performance, neck stiffness (moment versus flexion angle), chest force-deflection performance and abdominal stiffness.
• Q-dummies are capable to collect the measurements required in UNECE R44 tests. Head excursion in X an Z direction (through target tracking on high speed video), Chest accelerations. For the application clay as indicator for lap belt penetration in the abdomen the lower lumbar spine load cell and/or an angular rate sensor (ωy) in the pelvis can be used. In Chapter 5, three UNECE R44 measurements with Q- and P- dummies are compared in detail.

EEVC Report – Advanced Child Dummies and Injury Criteria for Frontal Impact April 2008 Document No. 514
Report obtained from EEVC web site www.eevc.org 22
• Q-dummies incorporate additional measurement capabilities that enable injury assessment on important injury criteria for head, neck and chest. In Chapter 4, injury assessment reference values are defined and in Chapter 5, their impact on CRS test results is evaluated).
The Q-dummies are considerably more advanced than the current P-dummies that were introduce in the 1970s. The old dummies were designed to act as loading devices with appropriate dimensions and mass distribution that embodied a limited measurement capability. The Q-dummies are designed to have a human like behaviour in Child Restraint System (CRS) impact tests with regards to anthropometry, kinematics and biomechanics and facilitate injury risk assessment in critical body parts. The new dummies bring about a large step forward for impact protection of children in cars.

EEVC Report – Advanced Child Dummies and Injury Criteria for Frontal Impact April 2008 Document No. 514
Report obtained from EEVC web site www.eevc.org 23
4 Q-DUMMIES INJURY ASSESSMENT REFERENCE VALUES
INTRODUCTION No child injury risk data directly usable for Q-dummies is currently available in the literature. Scaling of adult data and laboratory reconstructions of well documented real world accident provides an alternative way to establish suitable data. The CREST (1996-2000) and CHILD (2002-2006) project, co-funded by the European Commission, included a program of 98 real world accident reconstructions using P- and Q-dummies. These two projects provided information that has been used by WG12 to propose injury risk functions for the Q-series dummies. For that purpose, the injuries observed in the real world accidents were paired with the Q-dummy measurements. Injury risk curves were drawn for the head, the neck and the thorax. An extensive description of the background of this study is given in Annex G.
METHOD DESCRIPTION Two methods are used to derive the Injury Assessment Reference Values (IARVs) for Q-dummies in this chapter: Scaling technique and accident data correlation. An extensive description of the methods is given in Annex G. Scaling Technique The scaling technique is used in biomechanics to derive the response and the injury thresholds of a specimen from the response and the injury thresholds of another subject, the size and or material properties of which are different. For that purpose, the variations of stiffness, geometry and failure stress are either observed from tests or assumed, as a function of age or size of the specimen. In this study, this technique is used to derive the information regarding the Q-dummies from the information available for the 50th percentile male adult dummy (Hybrid III 50th) and for the Hybrid III 3 years old dummy. Accident Data Correlation The data used to develop the injury criteria were drawn from CHILD and CREST accident reconstruction tests, carried out by both projects. Around 70 cases were validated and made available in this way. Initially reconstructions were performed with P dummies. Further selection resulted in some 40 cases being available for the analysis for Q0, Q1, Q3, Q6 and P1½ dummies in frontal impacts with head, neck, thorax, abdomen, pelvis and lumbar spine measures. The methodology used to develop the injury criteria was to compare the injuries observed in the real world accidents with the validated crash reconstruction dummy measurements. As the reconstructions were performed with dummies ranged from 0 to 6 years old, all data were scaled to the Q3 dummy size/age in order to increase the size of the dataset to be analyzed (see note below). If the sample was considered large enough then AIS3+ injury risk curves were constructed by Certainty Method and Logistic Regression. Note: It should be noted that the scaling was based on both dummy geometrical ratios and human material
property ratios for different ages. The scaling does not account for the differences in performance of the dummies used (i.e. the dummy thoraxes of different ages may respond different relative to their stiffness corridors). Ideally this should be accounted for when combining the data to the Q3 size/age, and also when scaling the risk functions back to the other dummy sizes.

EEVC Report – Advanced Child Dummies and Injury Criteria for Frontal Impact April 2008 Document No. 514
Report obtained from EEVC web site www.eevc.org 24
INJURY CRITERIA The injury criteria for which injury risk curves and Injury Assessment Reference Values (IARVs) are derived for Q-dummies are: Head Impact Criterion (HIC), Head Acceleration exceeded for duration 3ms cumulative (Head ACC3ms), Upper Neck tension (Fz), Upper Neck bending moment in flexion (My) and Chest deflection (Dchest). The IARV corresponds with a particular risk of injury selected from the injury risk curve. For the purposes of this study, IARVs have been selected for 20% and 50% risk of injury as this brackets the range typically used in regulations. In Annex G an extensive description of the Q3 dummy IARV definition process is given per injury criterion.
Q-DUMMIES IARVs The Q3 dummy IARVs for the five injury criteria as defined in Annex G were scaled to Q0, Q1, Q1.5 and Q6 with the scaling factor specified in Annex G. For each of the dummies and for each of the injury criteria parameters the scaled adult value from UNECE R94 as well as values for AIS3+ 20% and 50% injury risk for both Certainty Method (CM) and Logistic Regression (LR) are given. In Table 3, Table 4, Table 5, Table 6 and Table 7 the various sets of IARVs based on direct scaling or through accident reconstructions are given. In Figure 6, the various sets of IARVs are plotted against the dummy size/age.
Figure 6: Summary of Injury Criteria IARVs for Q0, Q1, Q1.5, Q3 and Q6
D chest >55mm not realistic

EEVC Report – Advanced Child Dummies and Injury Criteria for Frontal Impact April 2008 Document No. 514
Report obtained from EEVC web site www.eevc.org 25
Table 3: ECE R94 (scaled) injury criteria IARVs per dummy Unit Q0 Q1 Q1.5 Q3 Q6 Head Impact Criterion HIC36 s 477 447 526 710 986 Head Acceleration 3ms A3ms g 79 67 70 75 82 Upper Neck Tension Force Fz N 433 951 1080 1350 1824 Upper Neck Flexion Moment My Nm 13 42 48 63 94 Thorax Chest Deflection Dchest mm NA 52 49 46.5 42 Table 4: AIS3+ 20%CM injury criteria IARVs per dummy Unit Q0 Q1 Q1.5 Q3 Q6 Head Impact Criterion HIC15 s 530 497 585 790 1097 Head Acceleration 3ms A3ms g 88 75 79 84 92 Upper Neck Tension Force *) Fz *) N 498 1095 1244 1555 2101 Upper Neck Flexion Moment My *) Nm 17 53 61 79 118 Thorax Chest Deflection Dchest mm NA 42 40 38 35 Table 5: AIS3+ 20%LR injury criteria IARVs per dummy Unit Q0 Q1 Q1.5 Q3 Q6 Head Impact Criterion HIC15 s 523 491 578 780 1083 Head Acceleration 3ms A3ms g 85 72 76 81 89 Upper Neck Tension Force *) Fz N 498 1095 1244 1555 2101 Upper Neck Flexion Moment *) My Nm 17 53 61 79 118 Thorax Chest Deflection Dchest mm NA 40 38 36 33 Table 6: AIS3+ 50%CM injury criteria IARVs per dummy Unit Q0 Q1 Q1.5 Q3 Q6 Head Impact Criterion HIC15 s 631 591 696 940 1306 Head Acceleration 3ms A3ms g 97 82 86 92 101 Upper Neck Tension Force *) Fz N 546 1201 1364 1705 2304 Upper Neck Flexion Moment *) My Nm 20 64 74 96 143 Thorax Chest Deflection Dchest mm NA 53 51 48 44 Table 7: AIS3+ 50%LR injury criteria IARVs per dummy Unit Q0 Q1 Q1.5 Q3 Q6 Head Impact Criterion HIC15 s 671 629 741 1000 1389 Head Acceleration 3ms A3ms g 104 88 93 99 109 Upper Neck Tension Force *) Fz N 546 1201 1364 1705 2304 Upper Neck Flexion Moment *) My Nm 20 64 74 96 143 Thorax Chest Deflection **) Dchest mm NA 59 56 53 49 Notes: *) Upper Neck Tension Force (Fz) and Flexion Moment (My) values come from literature scaling
and are not specifically associated with CM or LR statistical methods **) Thorax Chest Deflection larger than 55 mm are considered unrealistic from human point of view
and physically impossible to measure with the Q-dummies

EEVC Report – Advanced Child Dummies and Injury Criteria for Frontal Impact April 2008 Document No. 514
Report obtained from EEVC web site www.eevc.org 26
DISCUSSION and CONCLUSION The IARVs based on scaling of UNECE R94 are the most stringent (lowest values) for the Head and Upper Neck parameters, but not for Chest deflection. This may be a result of the limited amount of data that supports the Dchest injury risk function (see Annex G). Furthermore, for Head HIC15, Head Acc3ms and Thorax (Dchest), the two analysis methods, Logistic Regression (LR) and Certainty Method (CM), have a different effect at 20% or 50% injury risk, while for the Neck parameters, which IARVs are based on literature scaling, the same values are taken for both statistical methods. Also, it can be seen that some of the AIS3+ 50%LR values for the chest deflection are very large. Such high values (larger than 55mm) are considered unrealistic from a human anatomy point of view and physically impossible to measure with the Q dummies. The Certainty Method (CM) that can be used to derive an injury risk function if limited supporting data is available is considered to be statically inferior approach. When possible the IARVs must be the based on the commonly supported Logistic Regression (LR) statistical method. It is concluded that the combination of the two methodologies (scaling value from literature and data correlation based on accident reconstructions) allow assessing of new head, neck and chest injury criteria specific to Q-dummies in frontal testing. The study provides new injury assessment reference values for evaluation on the EEVC UNECE R44 test database.

EEVC Report – Advanced Child Dummies and Injury Criteria for Frontal Impact April 2008 Document No. 514
Report obtained from EEVC web site www.eevc.org 27
5 VALIDATION OF DUMMIES AND CRITERIA In order to quantify the effect and potential safety benefits of applying the Q-series and new injury criteria in the existing legislative child seat test procedure, EEVC organised a testing campaign involving several European organizations. The test series included back-to-back testing of P and Q dummies, seated in a variety of child seats approved and commercially available on the European market, according to the latest revision of the UNECE R44 test protocol. Rather than assessing the protection offered by the various seats, the objective of the test program is to study the differences in dummy results and the usefulness of the newly proposed injury criteria. In this chapter, the test program and the results are summarised.
TEST PROGRAM Between May and November 2004, EEVC has coordinated a series of 320 Child Restraint System (CRS) tests on 30 different UNECE approved and commercially available child seats with both P dummies and Q dummies. Tests were performed at the following laboratories (in alphabetical order): BASt (Germany), Britax (UK), Dorel (France), FIAT (Italy), IDIADA/INSIA (Spain), PSA (France), Team Tex (France), TNO (The Netherlands), TRL (UK), UTAC (France) and VTI (Sweden). To get the best possible insight in to the effect of new dummies and injury criteria, the test program was based on the well-known UNECE Regulation 44 protocol, in particular the dynamic test procedure as described by UNECE R44 paragraph 8.1.3, Frontal impacts. For the same reason, a test matrix was devised that covered almost all available CRS categories, including rear infant carry cot (ISOfix/universal), seats with harness (forward/rearward, ISOfix/universal), shield systems (ISOfix/universal), boosters with backrest, booster cushions and multi-group. All seats were tested using the recommended sizes of P and Q dummies, repeating each test at least once. An EEVC database was set up to collect all data generated. The total number of tests per type of CRS is given in Table 8, below. Annex H of this report provides more details about the test program. Table 8: CRS systems tested in the dummy comparison program
P dummies Test matrix Q dummies
320

EEVC Report – Advanced Child Dummies and Injury Criteria for Frontal Impact April 2008 Document No. 514
Report obtained from EEVC web site www.eevc.org 28
RESULTS The results compiled in the EEVC test database included measurement (dummy) signals, sled pulses, photographs (pre/post test) and videos, allowing a detailed comparison of dummy kinematics and dynamics. The analysis on the injury criteria was performed in two stages. In the first stage, the existing UNECE R44 criteria (head excursion, chest acceleration) were applied on the test results, for both P and Q dummies. This allows studying the effect of the dummy change only, for various CRS types, since the criteria applied for P and Q are the same. In the second stage, the extra measurements taken for the Q dummies are used to calculate additional biomechanical injury criteria, as proposed in Chapter 4. By applying (draft) Injury Assessment Reference Values (IARVs) to these criteria, an assessment can be made of the potential impact of these criteria on the safety performance of the seats tested. In this analysis, a number of IARV levels have been applied to the data to create better appreciation for the potential impact of such decision.
COMPARISON OF P and Q DUMMIES IN UNECE REGULATION 44 SLED TESTS Comparing the P- and Q dummy kinematics video analysis shows two major differences. Firstly, the Q-dummy reaches a less ‘wrapped’ or ‘pinned’ position during the whole movement compared with the movement of the P dummy. In UNECE R44 group I and II the P-dummy rotates first upwards, then flexes forward and so far downwards that the P-dummy head contacts the legs while, in most of the tests, the Q-dummy starts immediately with bending forwards and downward (see Figure 7).
Universal booster + back Group II (code 20)
Universal booster + back Group II (code 20)
FWD ISOfix + top tether Group I (code 13)
P3
P6
P3
Q3 Q6 Q3
Figure 7: P- versus Q-dummy kinematical comparison

EEVC Report – Advanced Child Dummies and Injury Criteria for Frontal Impact April 2008 Document No. 514
Report obtained from EEVC web site www.eevc.org 29
Secondly, the video analysis shows that the rebound of the Q-dummy starts earlier than for the P dummy. These differences in kinematical performance can be explained by the differences in dummy neck and lumbar spine as well as thorax design. The Q-dummy neck, being a segmented rubber column, is capable to transfer neck moments. The P-dummy neck, however, consists of an inner core of nylon rings and an outer shape made of urethane rings. This neck design makes it impossible to transfer neck moments. With regards to the lumbar spine, the Q-dummy design is also a rubber column that is also able to transfer neck moments. The lumbar spine of the P-dummy is a vertebrae representation without bending stiffness, which allows a large thorax rotation with respect to the pelvis. The thoraxes of the Q-dummies have a flexible rib cage that can be compressed through belt interaction. The thoraxes of the P-dummies are rigid. This difference leads for the Q-dummies in a significant more humanlike belt interaction especially in 3 point belt systems whereas the P-dummies in such a belt system easily rotate over the shoulder belt line. Although the P- and Q dummies show kinematic differences, the results for the UNECE R44 requirements on maximum head excursion in X and Z direction are not influenced by these findings, as can be seen in the next paragraph.
APPLICATION OF UNECE REGULATION 44 INJURY CRITERIA To investigate the effect of replacing the P dummies in UNECE Regulation 44 frontal impact tests with the Q-dummies a comparison with regards to the current UNECE R44 criteria between existing P-dummies and new Q-dummies is performed. The majority of the tests in the UNECE R44 tests available have measurements for Head Excursion in X and Z direction as well as for Chest Acceleration 3ms. In Table 9 the test sled stopping distance and the results of these parameters are expressed in Mean values with the Standard Error of the Mean (SEM) for both P- and Q-dummies per UNECE R44 group per dummy size. The Standard Error on the Mean is defined as SEM = StdDev / SQRT(n). The similarity of the sled pulses for the P- versus Q-dummy tests is evaluated by comparing the sled stopping distances. Some labs conducted the tests with the P- and Q dummy on the same trolley. It can be concluded that the sled pulse can be considered to be similar for P and Q tests. This means that if the pulses are similar for P- and Q- dummies, the dummy responses (head excursions and chest acceleration) may be compared. The maximum head excursion in X and Z direction and the chest acceleration exceeded for 3ms are compared between P- and Q-dummies in the same manner by determining the Mean value and SEM. Table 9 shows that head excursions in X and Z direction and the chest acc3ms for P- and Q-dummies are similar under similar test conditions. None of the comparisons between P- and Q-dummy head excursions show statistically significant differences. This means that P- and Q-dummies do not discriminate for head excursion under UNECE R44 conditions. Additionally in Figure 8, Figure 9 and Figure 10 cross-plots of these three parameters from P-dummy versus Q-dummy tests are given. In the cross-plots the average value per CRS-dummy combination obtained in the P- and Q-dummy tests are compared. If the data points are on the green line the P- and Q-dummy values are equivalent, if the point is above the line the P dummy value is higher than the Q dummy value and the other way round. The cross-plots show a good correlation of the Q- and P-dummy results, which indicates that the Q dummy can replace the P- dummy in UNECE R44 tests.

EEVC Report – Advanced Child Dummies and Injury Criteria for Frontal Impact April 2008 Document No. 514
Report obtained from EEVC web site www.eevc.org 30
Parts of the study summarised in this paragraph are reported earlier in the ESV conference in 2005 [39]. Table 9: Comparison of P- and Q dummy test pulse and results per UNECE R44
group and dummy type
Stopping
distance of sled [mm]
Max. Head Excursion X
[mm]
Max. Head Excursion Z
[mm]
Max. Chest Acc3ms
[g] Mean S.E.M. Mean S.E.M. Mean S.E.M. Mean S.E.M. ECE R44 Group 0+ CRS tests P0 648 10.1 465 17.5 459 29.4 - -
N 6 6 6 Not measured Q0 622 15.6 455 16.5 459 20.4 37.0 1.7
N 8 6 6 8 P1.5 662 7.0 572 25.2 588 17.9 46.5 2.4
N 10 8 8 10 Q1.5 629 12.9 573 23.3 614 12.3 44.7 1.6
N 12 8 8 12 ECE R44 Group I CRS tests P3/4 654 4.8 408 15.2 642 12.0 41.5 1.5
N 20 26 23 24 Q1 652 4.4 390 15.3 654 12.7 40.6 1.4
N 23 27 25 28 P3 669 9.1 461 14.4 675 10.4 43.4 1.4
N 28 33 33 35 Q3 655 7.0 464 12.1 690 12.4 43.6 2.3
N 29 36 32 40 ECE R44 Group II CRS tests P3 671 5.8 416 26.0 620 20.7 44.1 2.5
N 14 16 16 16 Q3 650 10.7 391 19.5 654 13.8 40.2 1.6
N 14 20 16 20 P6 648 3.7 456 25.3 613 23.2 41.7 1.8
N 16 20 20 20 Q6 628 8.4 444 17.2 631 13.2 45.2 2.1
N 14 17 15 17
Figure 8: Head excursion in X-direction cross-plots P-dummy versus Q dummy
(Parameter value is average of tests available per CRS-dummy combination)

EEVC Report – Advanced Child Dummies and Injury Criteria for Frontal Impact April 2008 Document No. 514
Report obtained from EEVC web site www.eevc.org 31
Figure 9: Head excursion in Z-direction cross-plots P-dummy versus Q dummy
(Parameter value is average of tests available per CRS-dummy combination)
Figure 10: Chest Acceleration 3ms cross-plots P-dummy versus Q dummy
(Parameter value is average of tests available per CRS-dummy combination)

EEVC Report – Advanced Child Dummies and Injury Criteria for Frontal Impact April 2008 Document No. 514
Report obtained from EEVC web site www.eevc.org 32
APPLICATION OF NEW INJURY CRITERIA
In addition to the current UNECE R44 criteria, for five new injury criteria (Head HIC and ACC3ms, upper neck tension force, upper neck flexion moment and chest deflection) a number of example Injury Assessment Reference Values (IARVs) for the Q dummies have been established in Chapter 4. For evaluation of these IARVs a total number of 152 UNECE R44 tests with Q-dummies are available: • 74 CRS – Dummy combinations (at least 2 tests per CRS-Dummy combination)
o 12 Q0 dummy tests all rearward facing (RF) o 45 Q1 dummy tests 12 RF o 28 Q1.5 dummy tests 14 RF o 48 Q3 dummy tests 2 RF o 19 Q6 dummy tests none RF
• 30 CRS types (three CRS’s types are tested as Group I and Group II, see note) o 6 Group 0+ CRS’s (all RF) 34 tests o 12 Group I CRS’s (1 RF) 62 tests o 6 Group I/II/III CRS’s tested as Group I 25 tests o 9 Group I/II/III and II/III CRS’s tested as Group II 37 tests
Note: The sum of CRS types is 33 because three of the 30 CRS’s are tested as Group I and Group II in the same configuration. Therefore these CRS types are counted in both groups. The Group I upper end Q3 tests on these CRS’s are used as Group II lower end tests. Therefore the sum of test is 158 whereas the actual number is of tests is 152. See for details Annex H.
To assess the test results relative to the IARV level for each dummy in one go, the peak response is normalised to the IARVs. If the normalised value is smaller than 1, the CRS “passes”, if it is larger than 1 the CRS “fails”. In Figure 11, the “pass” / “fail” distribution of all CRS’s is given for all five sets of IARVs. To show the “pass” and “fail” level with respect to the injury assessment reference value in the distribution, four zones are defined:
• Smaller than 50% of the criterion value Amply passed • Between 50 and 100% of the criterion value Passed • Between 100 and 150% of the criterion value Failed • Larger than 150% of the criterion value Amply failed
Although all used CRS’s are homologated according to UNECE R44, it is possible that some of the tests with P-dummies in the data base would fail to comply with the UNECE R44 criteria. The results given in Figure 11 show that application of the new criteria can have a significant effect, with only about 20 to 40% of the CRS’s complying with the proposed injury assessment reference values. Because about 60 to 80% of the CRS’s fail to comply, there would be a significant opportunity to improve the CRS designs with regards to safety offered to the child occupant. It also shows that the 20% risk IARVs are the most challenging, as one would expect. Within the sets of injury assessment reference values that are used to assess “pass” or “fail” there are 5 parameters: Head HIC, Head ACC3ms, Upper neck Fz and My and Thorax chest deflection. In Figure 12 and Figure 13, the “pass” and “fail” distribution for five parameters for AIS3+ 20%LR and 50% LR are given. (In Annex I the “pass” and “fail” distribution of all 5 test of IARVs are given in tabular a graphical form.) Figure 12 and Figure 13 demonstrate that in fact three parameters are crucial for the evaluation of the injury assessment reference

EEVC Report – Advanced Child Dummies and Injury Criteria for Frontal Impact April 2008 Document No. 514
Report obtained from EEVC web site www.eevc.org 33
values. These parameters are: Head HIC value, Upper Neck Tension (Fz) and Thorax Chest Deflection. Comparison of the CM and LR results as given in Annex I shows that the choice of the analysis methods has marginal influence on outcome of the assessment. In Figure 14 Venn-diagrams show how the crucial parameters contribute to the CRS’s failures to comply with the IARVs for AIS3+ 20%LR (left) and 50%LR (right). Summarizing HIC and Fz are dominating and critical for both injury risk levels. The statistical method CM or LR does not make significant difference.
0%
10%
20%
30%
40%
50%
60%
70%
80%
90%
100%
ECE R94 (scaled)
AIS3+ 20%CM AIS3+ 20%LR AIS3+ 50%CM AIS3+ 50%LR
CRS Pass and Fail per set of IARVs
>150% of Criterion
100-150% of Criterion
50-100% of Criterion
<50% of Criterion
Distribution of pass and fail over 33 CRS configurations152 tests74 CRS-dummy combination30 CRS types
Based on best test per CRS-Dummy combination
Figure 11: Pass and Fail of CRS’s per set of Injury Assessment Reference Values
0%
10%
20%
30%
40%
50%
60%
70%
80%
90%
100%
HIC15 ACC3ms Fz My D chest Maximum per CRS type
AIS3+ 20% LR
>150% of Criterion
100-150% of Criterion
50-100% of Criterion
<50% of Criterion
CRS Pass and Fail Parameters from best test Maximum from best testsMaximum per CRS type
152 tests74 CRS dummy combination30 CRS types
Figure 12: Pass and fail distribution per parameter for AIS3+ 20%LR IARVs

EEVC Report – Advanced Child Dummies and Injury Criteria for Frontal Impact April 2008 Document No. 514
Report obtained from EEVC web site www.eevc.org 34
0%
10%
20%
30%
40%
50%
60%
70%
80%
90%
100%
HIC15 ACC3ms Fz My D chest Maximum per CRS type
AIS3+ 50% LR
>150% of Criterion
100-150% of Criterion
50-100% of Criterion
<50% of Criterion
CRS Pass and Fail Parameters from best test Maximum from best testsMaximum per CRS type
152 tests74 CRS dummy combination30 CRS types
Figure 13: Pass and fail distribution per parameter for AIS3+ 50%LR IARVs Figure 14: Failures of CRS’s per parameter for AIS3+ 20%LR and 50%LR IARVs
Explaining example for the left diagram: 7 CRS’s passed all IARVs, 17 CRS’s failed on the HIC value, 8 failed on HIC only, 6 failed on both HIC and Fz and 3 failed on HIC, Fz and D chest.
The relatively large database of test results allows for a more detailed study into what happens for each UNECE R44 CRS group, i.e. for Group 0+, Group I and Group II CRS, respectively. In Annex I the implications of the application injury reference values for all groups are presented. The in-depth IARV evaluation in Annex I shows cross plots of new Q dummy parameters versus UNECE R44 results, cross of HIC15 versus Upper neck tension and HIC versus Chest deflection per dummy and tabular rating of CRS’s based on the compliance with the IARVs. Below the main results are presented. In Figure 15 the two cross-plots are shown in detail. The left graph HIC15 versus Upper Neck Tension (Fz) and the right graph HIC15 versus Chest Deflection. The data points are split into the UNECE R44 CRS groups: Group 0+, Group I and Group II. In the cross-plots the envelopes of the four sets of IARVs indicated.
HIC (10) Fz (14)
D chest (8)
5
8
1
5
Passed 14 No failures on other parameters
AIS3+ 50%LR
HIC (17) Fz (14)
D chest (8)
6
3
3
2
8
3 Passed 7 1 failure on other parameter
AIS3+ 20%LR

EEVC Report – Advanced Child Dummies and Injury Criteria for Frontal Impact April 2008 Document No. 514
Report obtained from EEVC web site www.eevc.org 35
Figure 15: HIC15 vs Upper neck tension and HIC vs Chest deflection for all tests
normalized to AIS3+ 20%CM with envelopes for all sets of IARVs. Group 0+ CRS’s Within the data base of 152 UNECE R44 frontal sled tests, the sample of Group 0+ CRS’s is 34 tests. Six different Group 0+ CRS’s, all in rearward facing configurations, are tested with Q0 dummy (12 tests), Q1 dummy (10 tests) and Q1.5 dummy (12 tests): Three Universal infant carriers, one Infant carrier ISOfix, one Combination CRS using seat belt and one Combination CRS with ISOfix (see also Annex H). The comparison of new criteria versus UNECE R44 results for this group does not show a significant correlation. The use of the current UNECE R44 criteria (especially the kinematical ones) and the proposed new injury criteria could therefore be complementary. As can be seen in Figure 15 the Group 0+ results for the critical parameters are almost all well within IARVs. Annex I shows that only for HIC values measured with Q1 and Q1.5 are distributed over the full ranges of IARVs for Q0 all test amply pass the IARV. In Table 10, the pass and fail results for the Group 0+ CRS’s are presented. The values given per set injury assessment reference values (IARVs) for each of the six CRS’s indicated the most critical parameter normalized with the relevant IARVs. In general, a high percentage of the Group 0+ CRS’s tested “passes” when the new criteria would be applied. Therefore Group 0+ rearward facing seats would provide good protection based on the new proposed injury criteria.
Injury Assessment Reference Values AIS3+ 20%CM AIS3+ 20%LR AIS3+ 50%CM
AIS3+ 50%LR

EEVC Report – Advanced Child Dummies and Injury Criteria for Frontal Impact April 2008 Document No. 514
Report obtained from EEVC web site www.eevc.org 36
Table 10: Group 0+ Pass and Fail results (all five parameters) Maximum Parameter/Injury Reference Value
CRS code
CRS description (see Annex H)
ECE R94 Scaled
AIS3+ 20%CM
AIS3+ 20%LR
AIS3+ 50%CM
AIS3+ 50%LR
“04” RWD ISOfix 0.58 0.52 0.54 0.47 0.44
“01” RWD Universal 0.84 0.67 0.67 0.55 0.55
“05” Combination CRS used RWD 0.85 0.68 0.68 0.56 0.56
“03” RWD Universal 0.81 0.72 0.75 0.66 0.61
“02” RWD Universal 1.08 0.96 1.00 0.88 0.82
“06” Combination CRS used RWD - ISOfix 1.60 1.39 1.39 1.27 1.27
Group I CRS’s Within the database of 152 UNECE R44 frontal sled tests, the sample of Group I CRS’s is 62 tests. Twelve different Group I CRS’s, all but one in forward facing configuration, are tested with Q1 dummy (24 tests) Q1.5 dummy (14 tests) and Q3 dummy (24 tests): Seven universal, one ISOfix with to tether, two ISOfix with support leg, one ISOfix with shield and one reward facing ISOfix (see also Annex H). The comparison of new criteria versus UNECE R44 results for this group does not show a significant correlation. The use of the current UNECE R44 criteria (especially the kinematical ones) and the proposed new injury criteria could therefore be complementary. As can be seen in Figure 15 the Group I results show that Chest deflection is never critical. Annex I shows that HIC and upper neck tension measured with all the dummies (Q1, Q1.5 and Q3) can be consider equally critical. In Table 11 the pass and fail results for the Group I CRS’s are presented. The values given per set injury assessment reference values (IARVs) for each of the six CRS’s indicated the most critical parameter normalized with the relevant IARVs. A significant amount of the 12 tested Group I CRS’s now no longer complies with the limits. Within Group I CRS’s, ISOfix systems perform on average better than universal systems. In general, this outcome would suggest that the Group I seats provide poor protection based on the new proposed injury criteria. Adoption of the new injury criteria with the new IARVs would pose a significant challenge for improved performance of the CRS’s in this group.

EEVC Report – Advanced Child Dummies and Injury Criteria for Frontal Impact April 2008 Document No. 514
Report obtained from EEVC web site www.eevc.org 37
Table 11: Group I Pass and Fail results (all five parameters) Maximum Parameter/Injury Reference Value
CRS code
CRS description (see Annex H)
ECE R94 Scaled
AIS3+ 20%CM
AIS3+ 20%LR
AIS3+ 50%CM
AIS3+ 50%LR
“17” RWD ISOfix 0.71 0.57 0.57 0.48 0.47
“12” FWD Universal 0.96 0.86 0.87 0.73 0.68
“15” FWD ISOfix + support leg 1.18 1.06 1.08 0.91 0.91
“14” FWD ISOfix + top tether 1.27 1.11 1.11 1.01 1.01
“09” FWD Universal 1.25 1.12 1.13 0.94 0.88
“19” FWD ISOfix + shield 1.30 1.13 1.13 1.03 1.03
“08” FWD Universal 1.43 1.29 1.30 1.08 1.02
“07” FWD Universal 1.45 1.31 1.32 1.10 1.03
“11” FWD Universal 1.59 1.43 1.45 1.20 1.13
“24” FWD Universal 1.66 1.44 1.44 1.31 1.31
“16” FWD Classical (non-ISOfix) 1.68 1.51 1.53 1.27 1.20
“13” FWD ISOfix + top tether 1.94 1.69 1.69 1.54 1.54
Additionally a sample of 25 tests on Group I/II/III CRS’s is tested as Group I. Six different Group I/II/III CRS’s, all forward facing, are tested with Q1 dummy (11 tests) Q1.5 dummy (2 tests) and Q3 dummy (12 tests): Multi 123 Three Universal (same configuration), one Multi 123 Universal-shield (differ configuration) and two Multi 123 Universal-harness (differ configuration) (see also Annex H). The comparison of new criteria versus UNECE R44 results for this group does not show a significant correlation. The use of the current UNECE R44 criteria (especially the kinematical ones) and the proposed new injury criteria could therefore be complementary. As can be seen in Figure 15 the Group I results show that Chest deflection is rarely critical. Annex I shows that Chest deflection is critical in the some of the Q3 tests. HIC and upper neck tension measured with all the dummies (Q1, Q1.5 and Q3) are almost all critical. In Table 12 the pass and fail results for the Group I/II/III CRS’s tested as Group I are presented. As with the standard Group I seats, the performance against the new injury criteria is generally poor. It can be concluded that Group I/II/III CRS’s that have a different configuration for Group I, II and III application showed a better performance than those that do not adapt the configuration to the age group. Adoption of the new injury criteria with the new IARVs would pose a significant challenge for improved performance of the CRS’s in this group.
EEVC Report – Advanced Child Dummies and Injury Criteria for Frontal Impact April 2008 Document No. 514
Report obtained from EEVC web site www.eevc.org 38
Table 12: Group I/II/III (tested as Group I) Pass and Fail results (all five parameters) Maximum Parameter/Injury Reference Value
CRS code
CRS description (see Annex H)
ECE R94 Scaled
AIS3+ 20%CM
AIS3+ 20%LR
AIS3+ 50%CM
AIS3+ 50%LR
“27” Multi 123 differ config. Universal - shield 0.90 1.10 1.16 0.87 0.79
“31” Multi 123 differ config. Universal - harness 1.25 1.12 1.14 0.94 0.89
“29” Multi 123 differ config. Universal - harness 1.47 1.32 1.34 1.11 1.04
“26”* Multi 123 same config. Universal 1.77 1.59 1.61 1.34 1.26
“10”* Multi 123 same config. Universal 1.97 1.71 2.03 1.56 1.56
“25”* Multi 123 same config. Universal 2.22 2.00 2.02 1.68 1.58
Note: The CRS’s marked with * are also tested as Group II (see Table 13) Group II CRS’s The last group of interest are the Group I/II/III or II/III CRS’s tested as Group II. Within the database of 152 UNECE R44 frontal sled tests, the sample of child restraint systems (CRS’s) tested as Group II is 37 tests. Nine different Group I/II/III or II/III CRS’s are tested with Q3 dummy (18 tests) and Q6 dummy (19 tests): Four Booster + Back (universal),three Multi 123 Universal (same configuration) and two Multi 123 Universal-harness (different configuration) (see also Annex H). The comparison of new criteria versus UNECE R44 results for this group does not show a significant correlation. The use of the current UNECE R44 criteria (especially the kinematical ones) and the proposed new injury criteria could therefore be complementary. As can be seen in Figure 15 the Group II results show that HIC, Upper neck tension and Chest deflection are often critical. Annex I shows that HIC and Upper neck tension are most critical in Q3 tests and Chest deflection is most critical in the Q6 tests. In Table 13 the pass and fail results for the Group I/II/III and Group II/III CRS’s tested as Group II are presented. As with the Group I seats, the Group I/II/III and Group II/III seats tested as Group II, provide poor protection based on the new proposed injury criteria. Within this group of CRS’s the Booster + Back Universal systems perform on average better than the Group I/II/III systems. In general, this outcome would suggest that the Group II seats provide poor protection based on the new proposed injury criteria. Adoption of the new injury criteria with the new IARVs would pose a significant challenge for improved performance of the CRS’s in this group.

EEVC Report – Advanced Child Dummies and Injury Criteria for Frontal Impact April 2008 Document No. 514
Report obtained from EEVC web site www.eevc.org 39
Table 13: Group I/II/III tested as Group II Pass and Fail results (all five parameters) Maximum Parameter/Injury Reference Value
CRS code
CRS description (see Annex H)
ECE R94 Scaled
AIS3+ 20%CM
AIS3+ 20%LR
AIS3+ 50%CM
AIS3+ 50%LR
“23” Booster + Back Universal 0.81 0.95 1.01 0.76 0.68
“30” Multi 123 differ config. Universal - harness 1.17 1.05 1.09 0.96 0.89
“20” Booster + Back Universal 1.37 1.19 1.19 1.08 1.08
“21” Booster + Back Universal 1.11 1.24 1.28 0.99 0.88
“26”* Multi 123 same config. Universal 1.70 1.47 1.47 1.34 1.34
“22” Booster + Back Universal 1.87 1.62 1.62 1.48 1.48
“25”* Multi 123 same config. Universal 1.88 1.63 1.63 1.49 1.49
“10”* Multi 123 same config. Universal 1.97 1.71 1.71 1.56 1.56
“32” Multi 123 differ config. Universal - harness 1.69 1.90 2.01 1.51 1.35
Note: The CRS’s marked with * are also tested as Group I (see Table 12)
CONCLUSIONS EEVC successfully completed a series of CRS tests according to the UNECE R44 protocol, applying fully instrumented P- and Q-dummies to the same test conditions. Data were gathered from 30 different versions of Child Restraint Systems (CRS’s) and 320 tests without major difficulties or dummy failures. The analysis of test results has prompted the following observations and conclusions: Assessed on the basis of the existing UNECE R44 criteria (head excursion, chest acceleration), the Q-series provides equivalent results to the P-series. Occasionally in the test program values were measured with the Q-dummies that exceeded the head excursion criterion while all seats are UNECE approved, however, this is unlikely to be a major issue in practice. Out of five new criteria proposed in Chapter 4 and Annex G, three parameters proved to be leading in changing the assessment results for the Q-dummy results. The three parameters are: Head HIC value, Upper Neck Tension (Fz) and Thorax Chest Deflection. Applying the new criteria with the suggested Injury Assessment Reference Values (IARVs) would pose a significant challenge on most UNECE R44 CRS Groups, with exception of the Group 0+. In Table 14 the number of CRS’s that pass in each UNECE R44 Group is given. Although generally poor, it is shown to be possible to comply with the proposed IARVs on 50% injury risk level in all the consider groups. Within Group I CRS’s, ISOfix seats perform on average better than universal ones. Group I/II/III CRS’s that require an adjusted configuration for

EEVC Report – Advanced Child Dummies and Injury Criteria for Frontal Impact April 2008 Document No. 514
Report obtained from EEVC web site www.eevc.org 40
Group I, II and III application showed in the Group I tests (Q1, Q1.5 and Q3 dummy) better performance than those that do not adapt the configuration to the age group. “Booster + Back” CRS’s showed on average better performance than “Multi 123” CRS’s in Group II tests (Q3 and Q6 dummy). Cross-plotting injury criteria for various seat categories showed that the new criteria are not correlated to the existing UNECE R44 criteria. The use of the current UNECE R44 criteria (especially the kinematical ones) and the proposed new injury criteria could therefore be complementary. HIC, Upper neck tension and Chest deflection yet are slightly correlated with each other, i.e. in general high HIC values and high Upper neck tension loads come together; in case of high HIC values, the Chest deflections are small and in case of large Chest deflections the HIC values are low. Table 14: Number of CRS’s that pass per set of IARVs
Set of Injury Assessment Reference Values ECE R94
Scaled
AIS3+ 20%CM
AIS3+ 20%LR
AIS3+ 50%CM
AIS3+ 50%LR
CRS age group according to UNECE Regulation 44
Number of
CRS’s Number and percentage of passed CRS’s
Group 0+ 6 4 (67%)
5 (83%)
5 (83%)
5 (83%)
5 (83%)
Group I 12 2 (17%)
2 (17%)
2 (17%)
4 (33%)
4 (33%)
Group I/II/III tested as Group I 6 1
(17%) none (0%)
none (0%)
2 (33%)
2 (33%)
Group I/II/III and II/III tested as Group II 9 1
(11%) 1
(11%) none (0%)
3 (33%)
3 (33%)
Total 33 8 (24%)
8 (24%)
7 (21%)
14 (42%)
14 (42%)

EEVC Report – Advanced Child Dummies and Injury Criteria for Frontal Impact April 2008 Document No. 514
Report obtained from EEVC web site www.eevc.org 41
6 SUMMARY, CONCLUSIONS AND RECOMMENDATIONS Each year, 700 children are killed on European roads and 80,000 are injured. This represents an unacceptably high burden on Europe’s society and economy. Although it is not known exactly how many of these deaths and injuries occur in UNECE approved CRS’s (Child Restraint Systems), it is considered that there is significant scope for improvement in the design of CRS’s. Currently CRS’s are homologated through testing with P-dummies that were developed in the 1970s. The dummies were designed to act as loading devices with appropriate dimensions and mass distribution that embodied a limited measurement capability. The new developed Q-dummies are considerably more advanced having human like behaviour in Child Restraint System (CRS) impact tests with regards to anthropometry, kinematics and biomechanics and facilitating injury risk assessment in critical body parts. The new dummies bring about a large step forward for impact protection of children in cars. Q-dummy family design and evaluation The new Q-dummy family described, evaluated and validated in this report shows a significant improvement with respect to the P-dummy family currently used in UNECE R44 frontal impact tests. The Q-dummies (Q0, Q1, Q1.5, Q3 and Q6) are well adapted to the recent child anthropometry data and their performance is tuned to comply with the most up to date biofidelity requirements. With regards to the US developed child dummies, CRABI and Hybrid III child dummies, the design of the Q-dummies signify a different design approach, using plastics and high density foams. The Q-dummy series have been primarily designed for frontal UNECE R44 and future side impact testing, while the US child dummies are developed for FMVSS 208 and 213, to evaluate the risk of out of position airbag deployment. The Q-dummies exhibited a good repeatability and reproducibility as well as durability in severe repeated sled tests. Q-dummy family performance in current UNECE Regulation 44 homologation tests A P-dummy versus Q-dummy comparison program that comprised of 320 tests shows that although sometimes significant kinematic difference are observed, on average P-dummy and Q-dummy results are similar. It is concluded that the Q-dummy family can replace the out dated P-dummy family in UNECE R44 homologation testing. The current UNECE R44 criteria can remain as they are. Q-dummy family Injury Assessment Reference Values (IARVs) The improved biofidelity of the Q-dummy family and their extensive measurement capabilities enables the introduction of enhanced extra injury assessment criteria in the homologation requirements. Within the European projects, CREST and CHILD numerous well documented accidents are reconstructed in the crash tests with the appropriate members of the Q-dummy family. The Q- dummy test measurements and the injury data obtained from real world accident reports are correlated. For five parameters, Head HIC and resultant acceleration 3ms, Upper neck tension and bending moment in flexion and thorax chest deflection, injury risk curves are established. Based on these curves Injury Assessment

EEVC Report – Advanced Child Dummies and Injury Criteria for Frontal Impact April 2008 Document No. 514
Report obtained from EEVC web site www.eevc.org 42
Reference Values (IARVs) for two injury risk levels (20% and 50%) are established for Q-dummies. Impact of Q-dummy IARVs on homologation test results The IARVs on the two injury risk levels are applied to the test results in the data base of 152 test UNECE R44 tests with Q-dummies on 30 different versions of Child Restraint Systems (CRS’s). At an injury risk level of 20% a small amount (21%) of the CRS’s comply with the criteria. If the 50% injury risk level is applied, 42% of CRS’s comply. At the 50% injury risk level, all UNECE R44 Groups show CRS’s that comply with the criteria, in Group 0+ 83% and Group I and II 33%. It is concluded that it is possible to comply with the IARVs on 50% injury risk level. Applying the new criteria with the suggested IARVs would pose a significant design challenge on most CRS Groups, with exception of the Group 0+. The new proposed injury criteria don’t correlate to the existing UNECE R44 criteria. The use of the current UNECE R44 criteria (especially the kinematical ones) and the proposed new injury criteria could therefore be complementary. Recommendations Based on the extensive evaluation and validation described in this report it is recommended to replace the current P-dummies in the test procedures of UNECE R44 with the Q-dummies. It is recommended to implement 4 new injury criteria, HIC, Upper Neck tension (Fx) and Upper Neck bending moment (My) and Chest deflection, complementary to the current UNECE R44 (kinematic) criteria. With regards to the Injury Assessment Reference Values it is recommended to apply the set base on AIS3+ 50% injury risk based on logistic regression analysis on accident reconstruction data and scaling. Adoption of the new injury criteria with the new IARVs would pose a significant challenge for improved performance of the CRS’s especially in Group I and II. (Most probably this applies also for Group III, however, for this group no test evidence with the dummy that represents the upper end occupant is available.)

EEVC Report – Advanced Child Dummies and Injury Criteria for Frontal Impact April 2008 Document No. 514
Report obtained from EEVC web site www.eevc.org 43
REFERENCES
1 CREST-project final report, CHEST - Child Restraint System for Cars, EC-Project number SMT4-CT95-
2019 2 CHILD-project final report, CHILD – Child Injury Led Design, EC-Project number G3RD-CT-2002-00791 3 ECE-Regulation 44. “Uniform Provisions Concerning the Approval of Restraining Devices for Child
Occupants of Power-Driven Vehicles (“Child Restraint System”). Version 03. United Nations. 5th June 1998. 4 Beusenberg, M.C. “Information report: The Q-series of Child Dummies – Status Report and Prospects of the
International Child Dummy Working Group.” TNO report 96.OR.BV.016.0/MB. 16th December 1996. 5 Beusenberg, M.C., Brun-Cassan, F. “Automotive Accident and Injury Data of Children – Literature Survey
and Database Analysis”. CDWG document N25-R. January 1995. 6 Twisk, D. "Anthropometric data for the development of Child Dummies". TNO report. 75161275-B
(confidential). 7th January 1994. 7 Twisk, D. "Anthropometric data for the development of Child Dummies. Part 2: Description of software and
data". TNO report 94.OR.BV.025/1DT. 1994. 8 Happee, R. “Injury biomechanics of children, a literature survey on material properties and overall organism
responses and tolerances”. TNO report 75131096. 24th September 1993. 9 Twisk, D., Ruijs, P.A.J. "Anatomical and Biomechanical descriptions of children in the 0 to 10 years age
range”. TNO report 95.OR.BV.006.1/DT. 1995. 10 De Jager, K. “Development and validation of a newborn child dummy: Q0”. JSAE Conference. 2004. 11 Van Ratingen, M.R. “Frontal and side impact biofidelity response requirements for a 3-year old 50th
percentile crash dummy: biomechanical basis and scaling”. TNO report 95.OR.BV.041.1/MVR. 1995. 12 ISO TR 9790. “Road Vehicles – Anthropometric Side Impact Dummy – Lateral Impact Response
Requirements to Assess the Biofidelity of the Dummy”. (version referenced: ISO TC22/SC12/WG5, Document N455 – Revision 2, May 1996).
13 Hodgson, V.R., Thomas, L.M. “Comparison of Head Acceleration Injury Indices in Cadaver Skull
Fractures”. Proceedings of the Nineteenth Stapp Car Crash Conference, P-39. SAE paper 710854. 1971. 14 Patrick, L.M., Chou, C. “Reponse of the human neck in flexion, extension, and lateral flexion”. Report VRI-
7-3. SAE, 1976. 15 Kroell, C.K., Schneider, D.C., Nahum, A.M. “Impact Tolerance and Response of the Human Thorax II”.
Proceedings of the 18th Stapp Car Crash Conference, SAE 741187. 1974. 16 Rouhana, S.W, Viano, D., Jedrzejcak, E.A., McCleary, J.D. “Assessing submarining and abdominal injury
risk in the Hybrid-III family of dummies”. SAE publication 892440. 1989. 17 Viano, D.C. "Biomechanical responses and injuries in blunt lateral impact". Proceedings of the 33rd Stapp
Car Crash Conference. SAE 892332. 1989. 18 Van Ratingen, M.R. “Biomechanically based design and performance targets for a 3-year old child crash
dummy for front and side impact”. Second Child Occupant Protection Symposium. SAE 973316. 1997. 19 “Human Mechanical Response Characteristics”. SAE Information report. SAE J1460 MAR 95. 1985. 20 Wolanin, M.J., Mertz, H.J. “Description and basis of a three-year old child dummy for evaluating passenger
inflatable restraint concepts”. Proceedings of the 9th ESV conference. 1982. 21 Roberts, A.K., Janssen, E.G., Cesari, D. “Review of cadaver responses to lateral impact and derived
biofidelity targets for dummies”. EEVC WG 9 report. 1990.

EEVC Report – Advanced Child Dummies and Injury Criteria for Frontal Impact April 2008 Document No. 514
Report obtained from EEVC web site www.eevc.org 44
22 Hodgson, V.R., Thomas, L.M. “Head impact response”. Vehicle Research Institute Report VRI 7.2 SAE.
1975. 23 Mertz, H.J., Patrick, L.M. “Strength and response of the human neck”, SAE 710955. 1971. 24 Kroell, C.K., Schneider, D.C., Nahum, A.M. “Impact tolerance and response of the human thorax”.
Proceedings of the 15th Stapp Car Crash Conference. SAE 710851. 1971. 25 Kroell, C.K., Schneider, D.C., Nahum, A.M. “Impact tolerance and response of the human thorax II”.
Proceedings of the 18th Stapp Car Crash Conference. SAE 741187. 1974. 26 Nahum, A.M., Gadd, C.W., Schneider, D.C., Kroell, C.K. “Deflection of the human thorax under sternal
impact”. International Automobile Safety Conference Compendium. SAE. 1970. 27 Stalnaker, R.L., McElhaney, J.H., Roberts, V.L., Trollope, M.L. “Human torso response to blunt trauma”.
Human impact response: measurement and simulation. Plenum Press. 1973. 28 Rouhana, S.W, Viano, D., Jedrzejcak, E.A., McCleary, J.D. “Assessing submarining and abdominal injury
risk in the Hybrid-III family of dummies”. SAE publication 892440. 1989. 29 Miller, M.A. “The biomechanical response of the lower abdomen to belt restraint loading”. Journal of
Trauma. 1989. 30 Don, B. van, et al., “Biofidelity Impact Response Requirements for an Advanced Mid-Sized Male Crash Test
Dummy”, 18th ESV 2003 paper no. 76, EEVC WG12 Report, Document no. 194, May 2003. 31 Stéphane Couturier, et al., “How ISOFIX Child Restraint Systems and Belt Pre-tensioner Enhance Protection
of 6-Year-Old Child in Frontal Impact”, 5th International Conference Protection of Children in Cars, Munich, December 6-7, 2007.
32 Q0 Dummy User Guide (draft version of manual), Version 3, January 2006 33 Q1 Dummy User Manual, Version 2.3, January 2007 34 Q1.5 Dummy User Manual, Version 2.5, January 2007 35 Q3 Dummy User Manual, Version 3.3, July 2007 36 Q6 Dummy User Manual, Version 2.1, July 2007 37 Berliner, J. et al. “Comparative evaluation of the Q3 and Hybrid III 3-year-old dummies in biofidelity and
static out-of-position airbag tests”. 44th Stapp Car Crash Conference. 2000. 38 Irwin, A., Mertz, H.J., “Biomechanical basis for the CRABI and Hybrid III child dummies”. SAE 973317.
1987. 39 K. de Jager et al., Assessing New Child Dummies and Criteria for Child Occupant Protection in Frontal
Impact, on behalf of EEVC WG12 & WG18, ESV Conference 2005, Paper number 05-0157.

EEVC Report – Advanced Child Dummies and Injury Criteria for Frontal Impact April 2008 Document No. 514
Report obtained from EEVC web site www.eevc.org 45
ANNEX A: ACCIDENT DATABASES FOR CHILD INJURY CAUSATION STUDY
For the child injury causation study as described in this report (Chapter 2) several European accident databases are used. This appendix gives the description and ownership of the different existing databases. Three different types of databases can be defined: European, national and specific databases. They lead to different levels of analysis. Below, the databases are explained according to this classification.
EUROPEAN DATABASES European data, collected in different European countries, are stored in a large database. These databases provide clear definitions and data have been checked before being introduced in the database. This kind of data cannot lead to in-depth analysis of the protection of children in cars. However, the data can show the size of the problem. It is possible to compare countries in terms of number of children killed as car occupants, relative risk of being killed per 100.000 of population, the trends over the last five years, etc. No data are available on restraint use, type of impact or even on the exact age of the children, who are just put in age categories. International Road Traffic Accident Database (IRTAD): the IRTAD was created in the late 80’s. It is an extension of a database from the BASt (Federal Highway Research Institute – Germany) that has been adapted to store all of the relevant data existing in the OECD countries. Its main purpose is to enhance the comparability between countries of road accidents and traffic data by giving clear definitions for all fields, to extend the amount and quality of relevant and updated data of OECD member countries, and give access to this information for different kind of analysis. In total 29 countries and regions participate in its formation and have regularly given their data to update and fill this database from the 1970’s to date. The BASt does the management of the IRTAD. Data are collected and entered into tables by each country, and checked by the database manager for consistency and compliance with the data base definitions and if necessary corrected before being introduced into the database. The IRTAD is a very general database where each person involved in a road traffic accident is included. The content can be used for the comparison between different countries but only a few fields are related to children, this does not permit an in-depth analysis. Children are put in three age categories which approximately correspond to the use of different adapted restraint systems. There is no information concerning the use of restraint systems for children in the IRTAD. The severity of injuries sustained by children is classified in three categories.
NATIONAL DATABASES National data are used for the official figures of the different European governments. An in-depth analysis has been conducted for each country taking into account specific definitions and constraints of the databases. Below, for six European countries it is explained how these national databases are built-up.

EEVC Report – Advanced Child Dummies and Injury Criteria for Frontal Impact April 2008 Document No. 514
Report obtained from EEVC web site www.eevc.org 46
- German data sources: Federal Statistical Office of Germany, Federal Highway Research Institute (BASt) and GDV. For this study, children are all car passengers and they have been divided in two categories of age, from 0 to 5 years and from 6 to 11 years, which approximately correspond to the use different type of safety restraint systems. In the first category, restrained children mostly use an additional system linked to the car with the seatbelt, in the second one, children are seated on a booster cushion, directly restrained with the adult seatbelt.
- France: data coming from the French National database containing all reports from the different police forces used for National statistics related to road accidents. For this study, children are all car passengers and the age limit of a child was 14 years old.
- United Kingdom: The national statistics have been sourced from the “Road Accidents Great Britain: 1999 The Casualty Report", published by "national Statistics" and the “DfT”. The national statistics give a good indication of where the problems may be, but they lack detail. In order to obtain more data about how children are being more injured in the more severe accidents it is necessary to query the UK CCIS database.
- Spain: Data based on annual reports of traffic statistics for the Dirección General de Trafico in Spain. Data from 1998, 1999, and 2000 are available. The data showing the distribution of the Spanish population according age groups are from National Institute of Statistics. For our study, children were divided in four age groups.
- Italy: data from Italian police forces. Data from 1996 to 2000 are available except year 1998, where the data collection system has been changed in Italy. No information on restraint use related to children is available in the Italian police forces databank. For EEVC WG18 analysis, children were divided in three age groups.
- Sweden: Swedish road institute data and analysis was used in the EEVC WG18 report. Sweden and other countries of Northern Europe are often taken as a reference in terms of child safety and have their own standard for child seats for frontal testing (T approval) which is more severe in terms of criteria than the European regulation. This regulation allows the use of these systems rearward facing for children up to 4 years, which are offering a better protection for the children’s cervical spine.
SPECIFIC DATABASES Specific databases are set-up by private institutes or European Research Projects and have specific aims related to child safety. The different databases analysed for this report are: CREST (Child REstraint STandards), CCIS (Co-operative Crash Injury Study), GIDAS (German In Depth Accident Study), GDV (German insurance association), Questionnaire database and a French study dedicated to child safety (CSFC-96). - CREST: On of the task of the CREST project, partially funded by the European
Commission, was to develop a database of in depth accident investigations. The CREST accident database contains 405 documented cases in which 628 restrained children were involved. These cases met specific criteria that were relevant to the CREST programme. This accident database is not representative of the real-world accident situation. Source of data: Five organisations involved in the CREST program collectively established the CREST accident database: The L.A.B., (France), which is common to PSA Peugeot-Citroën and Renault, ELASIS S.C.p.A. (Italy) on the behalf of FIAT Auto SpA., ,The

EEVC Report – Advanced Child Dummies and Injury Criteria for Frontal Impact April 2008 Document No. 514
Report obtained from EEVC web site www.eevc.org 47
Institute for Vehicle Safety of the German Insurance Association (GDV) (Germany), the Accident Research Unit of the Medical University of Hanover (MUH) (Germany), and the Vehicle Safety Research Centre (VSRC), Loughborough University (United Kingdom). When put together, the accident cases provided by each team made a significant contribution to the field of accidentology and injury biomechanics. Only frontal and side impacts were to be investigated and the severity of these impacts limits the conclusions that can be drawn in the majority of studies from this database.
- CCIS: The (CCIS) is concerned with the in depth analysis of road traffic accident data
collected from approximately 1500 vehicles and their occupants each year [40]. All fatal and most serious crashes from seven sample areas are investigated wherever possible, which means there is a bias towards severe accidents in this database. The CCIS database consists of the analysis of real world accidents, and provides information about how car occupants are injured. A detailed examination of vehicle damage is made by professional accident investigators, and is compared with the occupants’ medical data from hospital records, occupant questionnaires and post-mortem reports as appropriate. The injury data are encoded using the 1990 Abbreviated Injury Scale (AIS). The CCIS has been conducted in several phases, and some examples of the type of data available from Phases Vb and VI are summarised here. The database was searched to find accidents that involved child occupants (restrained or unrestrained) aged 12 or under. The results of this search identified 425 cases.
- GIDAS: GIDAS is a co-operative project between the German Federal Road Research
Institute (BASt) and the Automotive Industry Research Association (FAT) carried out in Hanover and Dresden. In depth accident investigations are conducted in order to bring additional information to the official accident statistics particularly causes and consequences of accidents. Specialist teams go directly to the scene of the accident, immediately after it has occurred. In the 70’s the first team has been established at the Medical University of Hanover (in collaboration with the Technical University of Berlin). A geographical area has been defined surrounding Hanover, including the city itself, for the collection of accidents. It gives representative results. Since 1985, a target of 1000 accidents per year was set up and all the collected data were put in database. In 1999, the geographical area was extended and a second team was set up near Dresden. Both teams are using a common methodology in order that results can be easily compared and entered in a common database. Since that date, about 2000 accidents are investigated annually and most of them are reconstructed using proven software in order to determine the exact conditions of the crash events. The number of collected data for each accident is between 500 and 3.000. Analysis is regularly conducted with this database and reports are provided. Some specific topics can be analysed if requested.
- GDV: (Gesamtverband der Deutschen Versierungswirtschaft e.V.), a German insurance
association has an Institute for Vehicle Safety which is collecting data on road accidents since 1969. Some studies were carried out specifically on child safety. Three types of material are available at GDV which correspond to different periods. The first one has been analysed at the end of the 80’s. It contains 870 accident cases in which more than 1150 children (0 – 12 years) were involved. This study was done according an accident

EEVC Report – Advanced Child Dummies and Injury Criteria for Frontal Impact April 2008 Document No. 514
Report obtained from EEVC web site www.eevc.org 48
form which contains a lot of information. The second one was collected in the years 1990 and 1991. On 16.000 accident analysed, nearly 600 restrained children were involved. These two studies have been published in 12th and 13th ESV conferences, Child occupant protection (1999 – Sitges) and in Vehicle Safety 90. The third material is a collection of accident cases between 1992 and 2002. Information sources are insurance companies, Police forces and co-operation with other institutes. The number of accidents available today is around 350. No results were published with this material up to now, but it has been used in specific projects as CREST accident database.
- QUESTIONNAIRE: This database was designed to look at child safety in vehicles. It
was created by TRL Limited for the UK Department for Transport. TRL send out blank questionnaire forms to participating child restraint system manufacturers, who include the forms with the paperwork contained within new CRS packaging. If a parent who has bought one of the seats has an accident they can fill in the form and post it to a freepost address, which returns the form to TRL. The information provided on the form is then entered onto the questionnaire database. This database gives very good information about what types of child restraint are being used for children of different ages, where the child restraints are positioned in the vehicle and the impact direction of the crash. The information about the injuries to the car occupants has to be treated with caution as it is based on the judgement of the parents. However, we can be confident that although we may not know the actual extent of the injuries, we know which body regions were effected. Adults who have caused accidents are less likely to fill in the forms so the database has a relatively large number of rear impact cases. To give an idea of the type of information we can obtain from the questionnaire database we have taken a small sample that contains data from accidents that happened between 1995 and 2000. A total of 158 vehicles were involved in which 230 were children between 0 and 12 years of age.
- CSFC-1996: During 1995 and 1996, a child safety related study was conducted in
France. During a four-month period, every police report where a child was involved in a road accident was collected. In addition, police forces and medical staff were asked to fill in a form for each children in order to collect the necessary data for an in depth analysis. Only children involved as car passengers in car to car or car to fixed obstacle accidents were included. All the police reports were analysed and coded by experts in child safety, accidentology and medical doctors. In order to do this they had access to pictures taken by police, accident sketches, statements from people involved, children’s medical reports, specific information about the child restraint systems, and height and weight of children. The information was then entered into a database. In France, three different police forces were investigating accidents, depending on the location of the accidents. Due to differences in the manner of working and charge for work, only one of them, the Gendarmerie Nationale, supplied reports with sufficient information to allow an in depth analysis. The area of the investigation of the Gendarmerie Nationale was countryside and small towns. The sample considered for the study was representative of car to car and car to fixed obstacle out of cities and in suburbs in France, where the risk of a child being killed or severely injured is highest.

EEVC Report – Advanced Child Dummies and Injury Criteria for Frontal Impact April 2008 Document No. 514
Report obtained from EEVC web site www.eevc.org 49
REFERENCES 40 The research programme used accident data from the United Kingdom’s Co-operative Crash Injury Study
(CCIS), collected during the period 1998 to 2006 (Phases 6 and 7). Currently (2008) CCIS is managed by the Transport Research Laboratory (TRL Limited), on behalf of
the United Kingdom’s Department for Transport (DfT) (Transport Technology and Standards Division) who fund the project along with Autoliv, Ford Motor Company, Nissan Motor Company and Toyota Motor Europe. Previous sponsors include Daimler Chrysler, LAB, Rover Group Ltd, Visteon, Volvo Car Corporation, Daewoo Motor Company Ltd and Honda R&D Europe (UK) Ltd.
Data was collected by teams from the Birmingham Automotive Safety Centre of the University of Birmingham; the Vehicle Safety Research Centre at Loughborough University; TRL Limited and the Vehicle & Operator Services Agency (VOSA) of the DfT
Further information on CCIS can be found at http://www.ukccis.org

EEVC Report – Advanced Child Dummies and Injury Criteria for Frontal Impact April 2008 Document No. 514
Report obtained from EEVC web site www.eevc.org 50
(Left blank intentionally)

EEVC Report – Advanced Child Dummies and Injury Criteria for Frontal Impact April 2008 Document No. 514
Report obtained from EEVC web site www.eevc.org 51
ANNEX B: ANTHROPOMETRIC SPECIFICATIONS
In this Annex, the main dimensions and the segment masses of the Q-dummy series are compared with the values as reported in the current regulations, ECE-R44. The descriptions of the manikins in ECE-R44 are based on the P-dummy series. The Q values are based on CANDAT (see Chapter 3) and the actual dummy masses and dimensions. Below, the segment masses and dimensions per dummy are given. Table 15: Q0 versus P0 “new born” UNECE R44 manikin masses and dimensions
Body Part or Dimension
Q0 P0
“new born”
Masses in [kg] Head & Neck 1.10 0.70 Torso (incl. suit) 1.50 1.10 Arms 0.27 0.50 Legs 0.58 1.10 Total 3.45 3.40 Dimensions in [mm] Seating height 355 345 Chest depth 90 100 Shoulder width (maximum) 145 150 Hip width seating 115 105
Table 16: Q1 versus P3/4 “9 month” UNECE R44 manikin masses and dimensions
Body Part or Dimension
Q1 P3/4
“9 month”
Masses in [kg] Head & Neck 2.41 2.20 Torso 4.48 3.40 Upper arms 0.45 0.70 Lower arms 0.44 0.45 Upper legs 1.00 1.40 Lower legs 0.82 0.85 Total 9.60 9.00 Dimensions in [mm] Seating height 479 450 Shoulder height (sitting) 298 280 Stature 740 708 Chest depth 114 102 Shoulder width (maximum) 227 216 Hip width (sitting) 191 166 Back of buttocks to front knee 211 195 Back of buttocks to popliteus, sitting 161 145

EEVC Report – Advanced Child Dummies and Injury Criteria for Frontal Impact April 2008 Document No. 514
Report obtained from EEVC web site www.eevc.org 52
Table 17: Q1.5 versus P1.5 “18 month” UNECE R44 manikin masses and dimensions
Body Part or Dimension
Q1.5 P1.5
“18 month”
Masses in [kg] Head & Neck 2.80 2.73 Torso (incl. suit) 5.04 5.06 Upper arms 0.58 0.54 Lower arms 0.62 0.50 Upper legs 1.14 1.22 Lower legs 0.92 0.96 Total 11.1 11.01 Dimensions in [mm] Seating height 499 495 Shoulder height (sitting) 309 305 Stature 800 820 Chest depth 113 113 Shoulder width (maximum) 227 224 Hip width (sitting) 194 174 Back of buttocks to front knee 235 239 Back of buttocks to popliteus, sitting 185 201
Table 18: Q3 versus P3 “3 years” UNECE R44 manikin masses and dimensions
Body Part or Dimension
Q3 P3
“3 years”
Masses in [kg] Head & Neck 3.17 2.70 Torso (incl. suit) 6.40 5.80 Upper arms 0.75 1.10 Lower arms 0.73 0.70 Upper legs 2.00 3.00 Lower legs 1.54 1.70 Total 14.60 15.00 Dimensions in [mm] Seating height 544 560 Shoulder height (sitting) 329 335 Stature 985 980 Chest depth 142 125 Shoulder width (maximum) 259 249 Hip width (sitting) 200 206 Back of buttocks to front knee 305 334 Back of buttocks to popliteus, sitting 253 262
EEVC Report – Advanced Child Dummies and Injury Criteria for Frontal Impact April 2008 Document No. 514
Report obtained from EEVC web site www.eevc.org 53
Table 19: Q6 versus P6 “6 years” UNECE R44 manikin masses and dimensions Body Part or Dimension
Q6 P6
“6 years”
Masses in [kg] Head & Neck 3.94 3.45 Torso (incl. suit) 9.57 8.45 Upper arms 1.27 1.85 Lower arms 1.22 1.15 Upper legs 3.98 4.10 Lower legs 2.92 3.00 Total 22.90 22.00 Dimensions in [mm] Seating height 601 636 Shoulder height (sitting) 362 403 Stature 1143 1166 Chest depth 141 135 Shoulder width (maximum) 305 295 Hip width (sitting) 223 229 Back of buttocks to front knee 366 378 Back of buttocks to popliteus, sitting 299 312

EEVC Report – Advanced Child Dummies and Injury Criteria for Frontal Impact April 2008 Document No. 514
Report obtained from EEVC web site www.eevc.org 54
(Left blank intentionally)

EEVC Report – Advanced Child Dummies and Injury Criteria for Frontal Impact April 2008 Document No. 514
Report obtained from EEVC web site www.eevc.org 55
ANNEX C: BIOFIDELITY TEST RESULTS
The head, neck, thorax and abdomen of the Q1, Q1.5, Q3 and Q6 have been evaluated according to the frontal impact biofidelity design target of each body region. For the Q0 only the performance of head and neck is taken into account. In Table 20 the biofidelity design targets are specified. In this Annex, the results of the evaluation tests are given. Table 20: Biofidelity design targets (scaled from adults data) Limit Q0 Q1 Q1.5 Q3 Q6 Head impact acceleration corridor [G] [G] [G] [G] [G] Upper 157 137 141 153 176 Lower 91 79 82 89 102 Neck flexion angle versus flexion moment corridor [degr] [Nm] [degr] [Nm] [degr] [Nm] [degr] [Nm] [degr] [Nm]
Upper
0 15 45 66 70
0.00 4.28 4.28 6.17
13.32
0 15 45 66 70
0.00 13.51 13.51 19.48 42.07
0 15 45 66 70
0.00 15.30 15.30 22.07 47.65
0 15 45 66 70
0.00 19.85 19.85 28.64 61.84
0 15 45 66 70
0.00 30.28 30.28 43.68 94.31
Lower
35 55 76 80
0.00 1.89 6.17
13.32
35 55 76 80
0.00 5.98
19.48 42.07
35 55 76 80
0.00 6.77
22.07 47.65
35 55 76 80
0.00 8.79
28.64 61.84
35 55 76 80
0.00 13.40 43.68 94.31
Thorax chest deflection versus impact force corridor for 4.27 m/s impact [mm] [kN] [mm] [kN] [mm] [kN] [mm] [kN]
Upper
3.7 14.7 22.1 30.9 36.8 33.8
0.51 0.47 0.47 0.56 0.39 0.04
3.8 15.2 22.8 31.9 38.0 34.9
0.55 0.51 0.51 0.61 0.42 0.05
4.1 16.2 24.2 33.9 40.4 37.2
0.65 0.61 0.61 0.72 0.50 0.05
4.4 17.3 26.0 36.4 43.3 39.9
0.87 0.81 0.81 0.95 0.66 0.07
Lower
3.7 14.7 22.1 27.2 25.0
0.35 0.32 0.32 0.37 0.04
3.8 15.2 22.8 28.1 25.8
0.38 0.34 0.34 0.40 0.05
4.1 16.2 24.2 29.9 27.5
0.45 0.41 0.41 0.48 0.05
4.4 17.3 26.0 32.1 29.5
0.60 0.54 0.54 0.63 0.07
Thorax chest deflection versus impact force corridor for 6.71 m/s impact [mm] [kN] [mm] [kN]
Upper
4.1 16.2 24.2 39.6 49.3 52.6 46.9
0.92 0.96 1.03 1.18 0.94 0.61 0.05
4.4 17.3 26.0 42.5 52.9 56.4 50.3
1.22 1.28 1.36 1.57 1.25 0.81 0.07
Lower
4.1 16.2 24.2 37.2 38.8 33.2
0.67 0.67 0.72 0.83 0.61 0.05
4.4 17.3 26.0 39.9 41.6 35.6
0.89 0.90 0.95 1.10 0.81 0.07
Abdomen intrusion deflection versus belt force [mm] [kN] [mm] [kN] [mm] [kN] [mm] [kN]
Upper
0.0 44.0 52.3 58.0
0.00 0.70 1.20 2.00
0.0 44.0 52.3 58.0
0.00 0.70 1.20 2.00
0.0 49.0 58.1 64.3
0.00 0.80 1.40 2.40
0.0 56.0 66.5 73.7
0.00 1.10 1.89 3.20
Lower
0.0 41.3 55.1 60.6
0.00 0.21 0.61 1.60
0.0 41.3 55.1 60.6
0.00 0.21 0.61 1.60
0.0 45.7 61.2 67.2
0.00 0.30 0.70 2.00
0.0 52.4 70.0 77.2
0.00 0.40 0.90 2.60

EEVC Report – Advanced Child Dummies and Injury Criteria for Frontal Impact April 2008 Document No. 514
Report obtained from EEVC web site www.eevc.org 56
Q0 BIOFIDELITY PERFORMANCE
HEAD
Table 1: Head frontal impact biofidelity Q0 (new born) child dummy – Head drop height 130 mm
Resultant head acceleration in [G]
Requirement = 124 ± 33 G Measured value Test number
Maximum Minimum Test in June 2003
157 91
121.3 121.6 122.8 116.6 117.6
21572 21574 21577 21579 21581
Average and maximum deviation 120.0 ± 3.4
Figure 16: Q0 frontal head drop test results – Drop height 130 mm

EEVC Report – Advanced Child Dummies and Injury Criteria for Frontal Impact April 2008 Document No. 514
Report obtained from EEVC web site www.eevc.org 57
NECK
Figure 17: Q0 frontal neck flexion test results on the neck pendulum

EEVC Report – Advanced Child Dummies and Injury Criteria for Frontal Impact April 2008 Document No. 514
Report obtained from EEVC web site www.eevc.org 58
Q1 BIOFIDELITY PERFORMANCE
HEAD
Table 2: Head frontal impact biofidelity Q1 (12 month) child dummy – Head drop height 130 mm
Resultant head acceleration in [G]
Requirement = 108 ± 29 G Measured value Test number
Maximum Minimum
137 79 111.69 112.40 111.16
420388 420389 420390
Average and maximum deviation 111.75 ± 0.65
Figure 18: Q1 frontal head drop test results – Drop height 130 mm

EEVC Report – Advanced Child Dummies and Injury Criteria for Frontal Impact April 2008 Document No. 514
Report obtained from EEVC web site www.eevc.org 59
NECK
Figure 19: Q1 frontal neck flexion test results on the neck pendulum
THORAX

EEVC Report – Advanced Child Dummies and Injury Criteria for Frontal Impact April 2008 Document No. 514
Report obtained from EEVC web site www.eevc.org 60
Figure 20: Q1 frontal thorax impactor test result – Test speed 4.3 m/s
ABDOMEN
Figure 21: Q1 frontal abdomen test results

EEVC Report – Advanced Child Dummies and Injury Criteria for Frontal Impact April 2008 Document No. 514
Report obtained from EEVC web site www.eevc.org 61
Q1.5 BIOFIDELITY PERFORMANCE
HEAD
Table 3: Head frontal impact biofidelity Q1.5 (18 month) child dummy – Head drop height 130 mm
Resultant head acceleration in [G]
Requirement = 111 ± 29 G Measured value Test number
Maximum Minimum
140 82 111.99 110.92 108.72
430573 430574 430575
Average and maximum deviation 110.54 ± 1.45
Figure 22: Q1.5 frontal head drop test results – Drop height 130 mm

EEVC Report – Advanced Child Dummies and Injury Criteria for Frontal Impact April 2008 Document No. 514
Report obtained from EEVC web site www.eevc.org 62
NECK
Figure 23: Q1.5 frontal neck flexion test results on the neck pendulum
THORAX
Figure 24: Q1.5 frontal thorax impactor test result – Test speed 4.3 m/s

EEVC Report – Advanced Child Dummies and Injury Criteria for Frontal Impact April 2008 Document No. 514
Report obtained from EEVC web site www.eevc.org 63
ABDOMEN
Figure 25: Q1.5 frontal abdomen test results

EEVC Report – Advanced Child Dummies and Injury Criteria for Frontal Impact April 2008 Document No. 514
Report obtained from EEVC web site www.eevc.org 64
Q3 BIOFIDELITY PERFORMANCE
HEAD
Table 4: Head frontal impact biofidelity Q3 (three year old) child dummy – Head drop height 130 mm
Resultant head acceleration in [G]
Requirement = 121 ± 32 G Measured value Test number
Maximum Minimum
153 89 116.61 115.14 116.23
430587 430592 430600
Average and maximum deviation 115.99 ± 0.62
Figure 26: Q3 frontal head drop test results – Drop height 130 mm

EEVC Report – Advanced Child Dummies and Injury Criteria for Frontal Impact April 2008 Document No. 514
Report obtained from EEVC web site www.eevc.org 65
NECK
Figure 27: Q3 frontal neck flexion test results on the neck pendulum
THORAX
Figure 28: Q3 frontal thorax impactor test result – Test speed 4.3 m/s

EEVC Report – Advanced Child Dummies and Injury Criteria for Frontal Impact April 2008 Document No. 514
Report obtained from EEVC web site www.eevc.org 66
Figure 29: Q1 frontal thorax impactor test result – Test speed 6.7 m/s
ABDOMEN
Figure 30: Q3 frontal abdomen test results

EEVC Report – Advanced Child Dummies and Injury Criteria for Frontal Impact April 2008 Document No. 514
Report obtained from EEVC web site www.eevc.org 67
Q6 BIOFIDELITY PERFORMANCE
HEAD
Table 5: Head frontal impact biofidelity Q6 (six year old) child dummy – Head drop height 130 mm
Resultant head acceleration in [G]
Requirement = 139 ± 37 G Measured value Test number
Maximum Minimum
176 102 121.85 122.46 121.90
421542 421543 421544
Average and maximum variation 122.07 ± 0.22
Figure 31: Q6 frontal head drop test results – Drop height 130 mm

EEVC Report – Advanced Child Dummies and Injury Criteria for Frontal Impact April 2008 Document No. 514
Report obtained from EEVC web site www.eevc.org 68
NECK
Figure 32: Q6 frontal neck flexion test results on the neck pendulum
THORAX
Figure 33: Q6 frontal thorax impactor test result – Test speed 4.3 m/s

EEVC Report – Advanced Child Dummies and Injury Criteria for Frontal Impact April 2008 Document No. 514
Report obtained from EEVC web site www.eevc.org 69
Figure 34: Q6 frontal thorax impactor test result – Test speed 6.7 m/s
ABDOMEN
Figure 35: Q6 frontal abdomen test results

EEVC Report – Advanced Child Dummies and Injury Criteria for Frontal Impact April 2008 Document No. 514
Report obtained from EEVC web site www.eevc.org 70
(Left blank intentionally)

EEVC Report – Advanced Child Dummies and Injury Criteria for Frontal Impact April 2008 Document No. 514
Report obtained from EEVC web site www.eevc.org 71
ANNEX D: Q-DUMMY SENSORS
The set of instrumentation is similar for Q1 and Q1.5 and for Q3 and Q6. This Annex gives an overview of the set of instrumentation and measurement channels per body segment for each Q-dummy. The type of accelerometers, angular velocity sensors and load cells are generally interchangeable for all Q-dummies. Channel count per region is given in Table 21. The specification per type of sensor is shown in Table 22. Special mounts are available to mount the instrumentation on the dummy. Table 21: Q dummy instrumentation and measurement channels per body segment.
Body segment Instrumentation Direction # of channels
Q0 dummy Total 15
Head Accelerometer Ax, Ay, Az 3 Neck load cell (upper neck) Fx, Fy, Fz, Mx, My, Mz 6 Chest Accelerometer Ax, Ay, Az 3 Pelvis Accelerometer Ax, Ay, Az 3 Q1 and Q1.5 dummies
Total 25
Head accelerometer angular velocity sensor
Ax, Ay, Az Wx, Wy, Wz
3 3
Neck load cell (upper neck) Fx, Fy, Fz, Mx, My, Mz 6
Thorax accelerometer spring potentiometer
Ax, Ay, Az Dx
3 1
Lumbar spine load cell Fx, Fy, Fz, Mx, My, Mz 6 Pelvis accelerometer Ax, Ay, Az 3 Q3 and Q6 dummies
Total 31
Head accelerometer angular velocity sensor
Ax, Ay, Az Wx, Wy, Wz
3 3
Neck load cell (upper neck) load cell (lower neck)
Fx, Fy, Fz, Mx, My, Mz Fx, Fy, Fz, Mx, My, Mz
6 6
Thorax accelerometer IR-TRACC
Ax, Ay, Az Dx
3 1
Lumbar spine load cell Fx, Fy, Fz, Mx, My, Mz 6 Pelvis accelerometer Ax, Ay, Az 3 Table 22: Specification per type of sensor.
Sensor type
Manufacturer
Specification Accelerometers ENTRAN EGAS-FS-50 KYOWA ASM-200BA
ENDEVCO
7267A-1500 (not in head) 7264-2000 7264C-2000 7264A-2000 7264B-2000
MSC 126M/CM
Angular velocity sensors ATA ATA ARS-01 ATA ARS-06 (flanged version)
DTS DTS ARS-12K Displacement sensors SpaceAge Control (Q1 and Q1.5) String pot series 174 FTSS (Q3 and Q6) IR-TRACC IF-362 Load cells Robert Denton Model 3715 FTSS IF-217 (350 Ohm)

EEVC Report – Advanced Child Dummies and Injury Criteria for Frontal Impact April 2008 Document No. 514
Report obtained from EEVC web site www.eevc.org 72
(Left blank intentionally)

EEVC Report – Advanced Child Dummies and Injury Criteria for Frontal Impact April 2008 Document No. 514
Report obtained from EEVC web site www.eevc.org 73
ANNEX E: ASSESSMENT OF DURABILITY
In the past the Q-dummy design showed a limited durability performance in case of severe loading. For that reason the design of Q1, Q1.5, Q3 and Q6 are improved. Subsequently, these dummies underwent a durability test program for frontal impact. The Q0 was excluded from this durability test program. During the development of Q0, its durability has thoroughly been evaluated according to the same specifications (ref. De Jager, et al. [41]). In this Annex, the Q-durability test program is described. In addition, repeatability of the dummies in these tests is investigated.
TEST SET-UP The Q-durability test program is performed on the ECE-R44 sled device of TNO Automotive. This is a deceleration sled. The test set-up is shown in Figure 36. The bench foam has been removed from the steel seat frame. Two rigid wooden seats were constructed. One seat is designed for Q1 and Q1.5 and the other one for Q3 and Q6. The installation of both seats is equal. The seat is installed forward facing under an angle of 30 degrees on the steel UNECE Regulation 44-03 seat frame, of which both the seat base and the seat back were tilted backwards over an angle of 20 degrees. The Q1 and Q1.5 are restrained to this seat with a 4-point belt over the shoulders and upper legs. The upper torso belts were placed horizontally and in the middle over the left and right shoulder and passed between the upper legs and vertically (between 60-90 degrees) through the seat base. The rigid wooden seat positively guided the "lap strap" to ensure that the loads transmitted by the "lap strap" were transmitted through the pelvis. The distance between the horizontal shoulder straps in the vicinity of the neck was at least the width of the neck of the appropriate dummy. Both shoulder straps were fixed with a controlled and equal film spool effect to two separate manual belt retractors. Both lap straps were fixed with belt plates. The belt straps had a width of 25 mm. The first tests with Q3 and Q6 were performed by using the same dummy restraint method as used for Q1 and Q1.5. In case of no visible damage, the Q3 and Q6 were restrained with a standard 3-point belt system. The belt slack and the belt tension forces were according to the UNECE Regulation 44-03 installation procedures. For each test new belt material was used.

EEVC Report – Advanced Child Dummies and Injury Criteria for Frontal Impact April 2008 Document No. 514
Report obtained from EEVC web site www.eevc.org 74
Figure 36: Test set-up for the Q-durability test program.
TEST PULSE The deceleration pulse of the sled for these tests is based on the EuroNCAP test velocity and the B-pillar acceleration. The most recent 64 EuroNCAP tests show an average peak acceleration of 36 g measured at the struck side B-pillar base, the maximum recorded value was 63 g. Based on this knowledge the deceleration pulse and ∆V for the durability tests have been derived as shown in Figure 37. In the same figure the B-pillar acceleration on struck and non-struck side of EuroNCAP test with an Opel Corsa (peak acceleration 42 g) and Jaguar X-type (peak acceleration 33 g) are presented as reference. The impact velocity is 61.0 ± 0.5 km/h. This pulse is more severe that the UNECE R44 pulse (∆V= 50 km/h, Max acc = 28 g)
Figure 37: Test pulse for the Q-durability test program.
RESULTS The durability test program can be split up in two phases. In the first phase the Q-dummies were not equipped with instrumentation. Every dummy had to withstand 30 tests without any damage. After each test the dummy was inspected thoroughly on damage. For the second phase, the Q1 and Q3 dummies were fully equipped with instrumentation to evaluate the repeatability of the dummies.

EEVC Report – Advanced Child Dummies and Injury Criteria for Frontal Impact April 2008 Document No. 514
Report obtained from EEVC web site www.eevc.org 75
A few design iterations of the shoulder and neck were necessary during the first phase of the durability evaluation to meet the durability requirements. To illustrate the consistency of the measured signals, the Q1 dummy responses for sled acceleration, head acceleration, upper neck force and moment, chest acceleration, lower lumbar spine force and moment and pelvis acceleration are presented below. The Q3 results were similar.
Figure 38: Sled acceleration in Q1 durability tests
Figure 39: Head resultant acceleration in Q1 durability tests
Figure 40: Upper neck resultant force in Q1 durability tests

EEVC Report – Advanced Child Dummies and Injury Criteria for Frontal Impact April 2008 Document No. 514
Report obtained from EEVC web site www.eevc.org 76
Figure 41: Upper neck resultant moment in Q1 durability tests
Figure 42: Chest resultant acceleration in Q1 durability tests
Figure 43: Lower lumbar spine resultant force in Q1 durability tests
EEVC Report – Advanced Child Dummies and Injury Criteria for Frontal Impact April 2008 Document No. 514
Report obtained from EEVC web site www.eevc.org 77
Figure 44: Lower lumbar spine resultant moment in Q1 durability tests
Figure 45: Pelvis resultant acceleration in Q1 durability tests
REFERENCES 41 De Jager, K. et al. “Development and validation of a newborn child dummy: Q0”, JSAE conference 2004,
paper number 20045465.

EEVC Report – Advanced Child Dummies and Injury Criteria for Frontal Impact April 2008 Document No. 514
Report obtained from EEVC web site www.eevc.org 78
(Left blank intentionally)

EEVC Report – Advanced Child Dummies and Injury Criteria for Frontal Impact April 2008 Document No. 514
Report obtained from EEVC web site www.eevc.org 79
ANNEX F: ASSESSMENT OF REPEATABILITY
INTRODUCTION For the assessment of test to test repeatability of the dummies three levels can be distinguished. With dummy component and full body impactor tests the dummy itself can be examined on it own repeatability. More variables come in play if rigid seat sled test are considered. In case of UNECE R44 Child Restraint System (CRS) testing the number of possible variations is the largest. In Table 23 the variables in the various test levels are shown and it becomes clear that the dummy is only one of the possible causes of variation.
Table 23: Variables that influence test repeatability Variable
Component and impactor tests
Rigid seat sled tests
ECE R44 CRS tests
Impact pulse Yes Yes Yes Test set-up temperature Yes Yes Yes Dummy Yes Yes Yes Dummy positioning and tightening Yes Yes Dummy interactions at interfaces Yes Yes CRS Yes CRS positioning and tightening Yes CRS interactions at interfaces Yes Bench Yes All three levels of repeatability assessment are considered in this Annex. Repeatability is generally specified in terms of Coefficient of Variation being the Standard Deviation divided by the mean value.
RESULTS AND DISCUSSION
COMPONENT AND IMPACTOR TESTS
The Q-dummies, as well as all other dummies, are regularly certified to guaranty their performance consistency. During dummy certification the parts of the dummy that determine its performance are examined to show their compliance with requirement corridors in component and full body impactor tests. The certification procedures and criteria for each dummy are described in full detail in the respective dummy user manuals [32, 33, 34, 35 and 36]. The requirement corridors are based on the variation found in tests with several batches of products. In Table 24 the requirement tolerances in percentage of the mean value are given. The possible variation seems to be large however in practice the results of certification tests are close together and the boundaries of the corridors are rarely approached. Consequently the coefficient of variation of the certification results is much smaller than half the corridor tolerance. For one dummy generally the repeatability shows a coefficient of variation between 1 and 3%. For different dummies of the same type certification tests show

EEVC Report – Advanced Child Dummies and Injury Criteria for Frontal Impact April 2008 Document No. 514
Report obtained from EEVC web site www.eevc.org 80
reproducibility with a coefficient of variation between 3 and 6%. In this Annex the repeatability of one dummy of the same type is considered. Reproducibility that involves also lab to lab variation is not considered. Table 24: Certification corridors [32, 33, 34, 35 and 36] Component Parameter
Q0 Q1 Q1.5 Q3 Q6
Head drop test Resultant acceleration
To be defined
±13.6% ±12.5%
Neck pendulum test Flexion angle Flexion moment (upper)
To be defined
±10.8% ±10.8%
±10.8% ±10.8%
Lumbar spine pendulum test Flexion angle No test
±11.1% ±12.2%
Abdomen force-deflection test Deformation static force No test
±15.4%
±14.3%
±13.3%
±25.0% Thorax pendulum impactor test Chest deflection Impactor force
No test
±10.0% ±18.8%
±10.0% ±18.8%
± 6.3% ±10.0%
±10.4% ±11.5%
DURABILITY SLED TESTS ON RIDIG SEAT
In Table 25 the repeatability of the durability test signals presented in Annex E (Figure 38 to Figure 45) are summarized in terms of coefficient of variation (CV = Standard Deviation / Mean value) of the signal at the maximum is given. Where appropriate a reassessment is motivated. Table 25: Repeatability of signals in Q1 durability sled tests (see Annex E)
CV at max’m Remark and reassessment motivation CV
Sled pulse acceleration 4.8% None 4.8%
Head resultant acceleration 23.3% Peak in StdDev occurs at maximum. Average of maximum and readings at ±5ms from the maximum becomes:
10.7%
Head HIC 11.7% Mean HIC = 650 StdDev = 76 (see Figure 39) 11.7%
Upper neck resultant Force
5.7%
None
5.7%
Moment 20.7% Peak in StdDev occurs at maximum. Average of maximum and readings at ±5ms from the maximum becomes:
18.0%
Chest resultant acceleration 6.9% None 6.9% Lower lumbar spine resultant Force
6.6%
None
6.6%
Moment 12.0% None 12.0% Pelvis resultant acceleration 6.1% None 6.1%

EEVC Report – Advanced Child Dummies and Injury Criteria for Frontal Impact April 2008 Document No. 514
Report obtained from EEVC web site www.eevc.org 81
The coefficient of variation values given in Table 25 as obtained from the measurement values taken in the durability tests are reasonable apart from two parameters: Head resultant acceleration and Upper neck resultant moment. For both parameters the standard deviation shows a temporary increase around the time that the maximum occurs. This is most probably caused by the impact contact of the head to the legs at about 60 to 70ms. To soften this effect on the repeatability the average CV is calculated with three values: The values 5 ms before, at and 5 ms after the maximum. For the Head resultant acceleration that seems to show a CV of 23.3% at the signal maximum, whereas the HIC value CV is 11.7%, the averaged CV is 10.7% which is judged to be more realistic. For the Upper neck resultant moment that shows a CV of 20.7% at the signal maximum the averaged CV becomes 18.0% which is still relatively high. The sled pulse with a CV of 5% introduces already some variation in the test. Other items that introduce variation are the harness system and its tightening and positioning of the dummy before the test as well as the dummy to seat interaction. Because no Telflon sheets were used between the dummy and the rigid seat in these tests the latter mentioned effect can be significant due to stick-slip induced by friction. Taken this into account the coefficients of variation concerning the dummy only becomes for four parameters smaller than 5% (very good) for two parameters smaller than 10% (good). One parameter, upper neck moment, seems shows a relatively marginal repeatability of smaller than 15%. A more sophisticated repeatability assessment is possible using the large data base of 320 UNECE R44 Child Restraint System tests with P- and Q-dummies. In the next paragraph this assessment is presented.
CHILD RESTRAINT SYSTEM TESTS ACCORDING UNECE R44
For the evaluation of the Q dummies a database of 320 Child Restraint System (CRS) tests according to UNECE R44 protocol with P- and Q-dummies is assembled for EEVC WG12&18. The method used and the results compiled in the database is described in Annex H and Chapter 5. This database comprises roughly 150 tests with P- and 150 tests with Q-dummies. For both dummy families the same CRS-Dummy age combinations are tested. Each CRS-dummy combination is tested twice, so roughly 150 pairs of identical tests 75 for P- and 75 for Q dummies are available to assess repeatability. Because the test pairs differ on several aspects like CRS type and dummy size the test results per parameter are spread over a wide range. The variation between the two tests in a pair can be taken relative to their mean value. For each pair of tests and for each parameter available in the test results the deviation for the mean value in a percentage is calculated with:
For the first test in the pair: (P1 - (Mean P1,P2)) / (Mean P1,P2)
For the second test in the pair: (P2 - (Mean P1,P2)) / (Mean P1,P2)
The Standard Deviation of all available percentages of deviation of the mean value can be taken. The Coefficient of Variation being StdDev/Mean becomes, as the mean of all pairs is 100%, CV=StdDev/100%. This procedure can be followed for the UNECE R44 parameters for P- and Q dummies as well as for the five new Q dummy parameters that are available in the database.

EEVC Report – Advanced Child Dummies and Injury Criteria for Frontal Impact April 2008 Document No. 514
Report obtained from EEVC web site www.eevc.org 82
It must be noted that in UNECE R44 CRS frontal test procedure many variables can influence the repeatability of the test results. In Table 23 nine variables that can influence the test to test repeatability are listed. It is obvious that the dummy itself is only one factor in the chain of variables.
ECE R44 parameters In Table 26 the Coefficients of Variation (CV) for the UNECE R44 parameters: Head excursion in X and Z direction and Chest acceleration 3ms are given per UNECE R44 age group and per dummy size for both P- and Q-dummy tests. With regards to the head excursion measurement it must be noted that these values are established through high speed video analysis with an accuracy of may be even ± 5 to 10 mm. This means that small variation may be read as no variation. From Table 26 it can be concluded that the repeatability on the UNECE R44 parameters is very good in some case it is slightly over 5% (indicated with grey shading). The tests with the Q dummies show overall slightly better repeatability (3.5%) than those with the P dummies (4.3%). Only for the chest acceleration the Q-dummy tests show slightly larger repeatability (4.9%) than the P dummy tests (4.4%). It can be concluded that the Q-dummies themselves show excellent repeatability for the current UNECE R44 parameters. Table 26: Coefficient of Variation of UNECE R44 parameters measured with P- and
Q- dummies. (Values larger than 5.0% grey shaded) P-dummies Q-dummies
Head exc. X
Head exc. Z
Chest acc3ms
All para-
meters
Head exc. X
Head exc. Z
Chest acc3ms
All para-
meters Group 0+ P0 and Q0 1.0% 1.6% not 1.3% 0.8% 1.1% 4.5% 2.8%
N 6 6 measured 12 6 6 8 20 P3/4 and Q1 0.4% 0.9% 7.6% 5.0% 0.6% 0.8% 7.1% 4.7%
N 6 6 10 23 6 6 10 23 P1.5 and Q1.5 0.3% 0.5% 4.9% 3.0% 1.0% 0.9% 6.8% 4.4%
N 8 8 10 26 8 8 12 28 All Group 0+ 0.6% 1.0% 6.2% 3.6% 0.8% 0.9% 6.2% 4.1%
N 20 20 20 60 20 20 30 70 Group I P3/4 and Q1 7.3% 1.2% 3.0% 4.7% 3.9% 1.8% 5.0% 3.8%
N 32 29 30 91 33 31 34 98 P1.5 and Q1.5 3.9% 2.9% 2.1% 3.0% 1.6% 1.1% 3.5% 2.2%
N 14 11 12 38 16 16 16 49 P3 and Q3 7.1% 3.4% 5.7% 5.6% 2.2% 1.1% 3.5% 2.5%
N 35 35 35 105 32 28 36 96 All Group I 6.7% 2.6% 4.3% 4.9% 2.9% 1.4% 4.1% 3.1%
N 81 75 77 233 81 75 86 242 Group II P3 and Q3 2.3% 1.3% 3.0% 2.3% 4.5% 3.0% 6.9% 5.1%
N 14 14 14 43 16 12 16 45 P6 and Q6 3.0% 5.0% 4.1% 4.0% 2.5% 1.3% 4.2% 2.9%
N 22 22 22 66 19 17 19 55 All Group II 2.7% 3.9% 3.7% 3.4% 3.5% 2.1% 5.5% 4.0%
N 36 36 36 108 35 29 35 99
All tests 5.3% 2.9% 4.4% 4.3% 2.9% 1.5% 4.9% 3.5% N 137 131 133 401 136 124 151 411

EEVC Report – Advanced Child Dummies and Injury Criteria for Frontal Impact April 2008 Document No. 514
Report obtained from EEVC web site www.eevc.org 83
New parameters measured with Q dummies For the new parameters measured with the Q dummies: Head HIC, Head resultant acceleration 3ms, Upper neck tension and flexion and Chest deflection cross plots of the measured values versus the mean value per pair of tests are given in Figure 46. Data points with a deviation of the mean value of more than 30% are not taken into account in the calculation of the coefficients of variation. These data point are indicated in red. The number of data points excluded are: For HIC 12, Head ACC3ms 4, Upper neck Fz 12, Upper neck My 7 and Chest deflection 8. In Table 27 the Coefficients of Variation (CV) for the new parameters measured with the Q-dummies are given per UNECE R44 age group per dummy size. From the table it can be concluded that for the new parameters in the tests with Q dummies a very good overall repeatability is shown with a CV of 7.8%. Focusing on the repeatability of the tests in the different UNECE R44 age groups it can be concluded that the repeatability in Group I tests is very good (CV = 6.2%). The Group II tests show the second best repeatability with a CV of 8.1% and the Group 0+ tests have the worst repeatability with a CV of 11.1%. The significant worse repeatability in Group 0+ tests may be contributed to the fact that these test are all rearward facing tests which are prone to friction dependant stick-slip effects of the dummy in the seat and or the seat on the bench. From the repeatability shown in tests in age Group I with Q1, Q1.5 and Q3 and age group II with Q3 and Q6, taking into account that the dummy is only one of the nine items that introduce test variations, it can be concluded that the dummies themselves have shown excellent repeatability.

EEVC Report – Advanced Child Dummies and Injury Criteria for Frontal Impact April 2008 Document No. 514
Report obtained from EEVC web site www.eevc.org 84
Head HIC Head resultant ACC3ms
Upper neck tension Fz Upper neck flexion My
Chest defection
Figure 46: Cross plots of measured versus mean value per pair of repeated tests
Explanation of the cross plots: 1. Graphs show measured value versus mean per pair of repeated tests 2. Green shaded area indicates variation of ±30% 3. Red data point >30% are excluded from the repeatability analysis
EEVC Report – Advanced Child Dummies and Injury Criteria for Frontal Impact April 2008 Document No. 514
Report obtained from EEVC web site www.eevc.org 85
Table 27: Coefficient of Variation of new parameters measured with Q- dummies CV values larger than 10% are grey shaded
Head HIC
Head res. ACC3ms
Upper Neck
Tension
Upper Neck
Flexion
Chest deflection
All para-meters
Group 0+ Q0 15.2% 10.7% 11.6% 6.7% 11.0%
N 10 8 8 10 36 Q1 7.7% 11.2% 10.5% 15.9% 2.0% 10.7%
N 10 12 10 10 4 46 Q1.5 12.0% 8.4% 9.7% 18.8% 11.7% 12.0%
N 10 10 4 8 6 38 All Group 0+ 11.6% 9.9% 10.3% 13.8% 8.8% 11.1%
N 30 30 22 28 10 120 Group I Q1 6.9% 5.3% 6.6% 8.4% 6.0% 6.6%
N 31 31 25 28 25 140 Q1.5 6.5% 5.1% 8.4% 5.7% 5.8% 6.2%
N 18 18 16 16 14 82 Q3 7.5% 4.4% 3.5% 6.2% 6.1% 5.7%
N 34 34 24 28 20 140 All Group I 7.0% 4.9% 6.1% 7.0% 5.9% 6.2%
N 83 83 65 72 59 362 Group II Q3 9.7% 5.3% 8.5% 11.4% 10.8% 8.9%
N 10 14 12 12 12 60 Q6 7.3% 5.8% 9.3% 4.7% 10.1% 7.5%
N 17 19 7 11 19 73 All Group II 8.1% 5.5% 8.5% 8.7% 10.2% 8.1%
N 27 33 19 23 31 133
All tests 8.3% 6.3% 7.5% 9.2% 7.7% 7.8% N 140 146 106 123 100 615
CONCLUSIONS In this Annex the repeatability of the Q dummies is assessed on three levels. The Coefficient of Variation in percentage (CV = Standard Deviation / Mean value) is used to express the repeatability. Dummy level On certification test level the dummy repeatability is approached the best, as the only additional variations in the system are the impact pulse and the setup temperature. At this level a general approach leads to the conclusion that the dummies themselves have repeatability between 1 and 3%. Rigid seat sled tests In this kind of tests the variation in the results can come from the sled pulse, the harness system, the dummy, the tightening and positioning of the dummy and the dummy to seat interaction. For this assessment the durability test signals as presented in Annex E are used. It is concluded that the repeatability is good (2 parameters <10%) to very good (5 parameters <5%).

EEVC Report – Advanced Child Dummies and Injury Criteria for Frontal Impact April 2008 Document No. 514
Report obtained from EEVC web site www.eevc.org 86
Child Restraint System test database The EEVC Child restraint System UNECE R44 test database contains P-and Q-dummy tests with two tests on each configuration. That allows a repeatability comparison between P- and Q- dummies as well as an assessment of the repeatability on the new injury criteria parameters measured with the Q-dummies. The comparison of the current UNECE R44 parameters: Head excursion in X and Z direction and the Chest resultant acceleration (3ms) shows that tests with Q-dummies are slightly better repeatable (CV = 3.5%) than the tests with P dummies (CV = 4.4%). The new parameters measured with the Q-dummies show a very good overall repeatability with a CV of 7.8%. The Group 0+ tests show the worse values with CV = 11.1%. This may be contributed to the dummy to seat and seat to bench stick-slip effects due to friction that are likely to occur because these tests are all rearward facing. Group II tests show next best repeatability with CV = 8.1%, while Group I tests show CV = 6.2%. From the repeatability shown in the Group I tests with Q1, Q1.5 and Q3 and age Group II with Q3 and Q6, taking into account that the dummy is only one of the nine items that introduce test to test variation, it can be concluded that the dummies themselves have shown excellent repeatability.

EEVC Report – Advanced Child Dummies and Injury Criteria for Frontal Impact April 2008 Document No. 514
Report obtained from EEVC web site www.eevc.org 87
ANNEX G: Q-DUMMIES FRONTAL INJURY CRITERIA
INTRODUCTION No child biomechanical data directly usable for Q-dummies is currently available in the literature. Only very few cadaver tests were performed using children (Kallieris 1976 [42]). Moreover those tests only provide a comparison between the child and the dummy response and do not provide any information regarding the injury mechanisms or thresholds. Studies performed using animal testing and a GM 3 year old dummy (Mertz et al. 1982 [43], Prasad and Daniel 1984 [44]) proposed animal injuries paired with dummy measurements. Tolerance data were obtained for the head, the neck, the thorax and the abdomen. However, the main limitation of these data is that the dummy used was the GM 3 year old dummy. Accident reconstructions were performed (Planath et al. 1992 [45], Newman and Dalmotas 1993 [46]). Injury criteria were derived from these tests for the dummies used in the reconstructions. The CREST project, co-funded by the European Commission, included an extensive program where 56 real world accidents were reconstructed using P and Q dummies. The project was completed in 2000. However, the number of tests using Q-dummies was not large enough to construct reliable injury risk curves. A second project of accident reconstructions called CHILD was launched in September 2002 to continue the development of the Q-dummies and to define the injury risk curves. For that purpose, the injuries observed in the real world accidents were paired with the Q-dummy measurements. Injury risk curves were drawn for the head, the neck and the thorax. This Annex is in accordance with the publication presented on the IRCOBI 2007 conference (Palisson et al. 2007 [47]) This Annex is a proposition of injury criteria specific to Q-dummies for frontal impacts correlating results of the CHILD project with scaling injury criteria available in literature.
METHOD
SCALING METHOD The scaling technique is used in biomechanics to derive the response and the injury thresholds of a specimen from the response and the injury thresholds of another subject, the size of which is different. For that purpose, the variations of stiffness, geometry and failure stress are either observed from tests or assumed, as a function of age or size of the specimen. The mass density is assumed to be equal for children and adults (Melvin 1995 [48]). In our study, this technique is used:
• To derive the information regarding the Q dummies from the information available for the 50th percentile male adult. The injury criteria, applicable for the Q-dummies are derived from the injury criteria available for the Hybrid III midsize adult male dummy.
• To derive the information regarding the Q3 dummy from the information available for the Hybrid III 3 years old dummy.
• To derive Q3 dummy values from Q dummies of different ages

EEVC Report – Advanced Child Dummies and Injury Criteria for Frontal Impact April 2008 Document No. 514
Report obtained from EEVC web site www.eevc.org 88
Reference Data
Adult and child dummy references regarding the anthropometry The Hybrid III midsize adult male and Hybrid III 3 years old dimensions are based on Irwin and Mertz (1997 [49]). The Q dummy dimensions are those used in the specs of the last version of the Q-dummies. They were provided by TNO and were based on the CANDAT database (Van Ratingen et al. 1997 [50]) Adult and child references regarding the material properties
Testing data Yamada (1970 [51]) reported an extensive study of the mechanical properties of the human soft and hard tissues. The calcaneal tendon stiffness Et and failure stress σt are reported for fetuses (5, 6, 7 and 8 gestational month old), for children (newborn, 4.5 and 14.5 years old) and for adult. Based on this data, the calcaneal tendon stiffness and stress are interpolated for the 6 month, 12 month, 18 month, 3 year old and 6 year old children (Table 28). Table 28: Calcaneal tendon stiffness ratios and failure stress ratios
0 year 1 year 1,5 year 3 years 6 years
λ Et 0,48 0,58 0,61 0,77 0,88
λ σt 0,63 0,70 0,75 0,85 0,96 Mc Pherson and Kriewall (1980 [52]) performed a study where the mechanical properties of fetal cranial bone are reported. The stiffness of the skull, Eb, was measured for fetuses and for a six-year old child. Based on this data, the skull stiffness is interpolated for the 6 month, 12 month, 18 month, 3 year old and 6 year old children (Table 29). Table 29: Skull bone stiffness ratios
0 year 1 year 1,5 year 3 years 6 years
λ Eb 0,24 0,32 0,36 0,47 0,67
Assumed Data Melvin (1995 [48]) reports that the development processes of the collagenous and ligamentous tissues are observed to be equivalent. Therefore, it is assumed that the variations of the mechanical properties of the brain (AAMA 1998 [53]) of the neck ligamentous tissue (Melvin 1995 [48]), as a function of age, are the same as those of the calcaneal tendon. The cranial bone data are also used to scale biomechanical data for bone structures (Melvin 1995 [48]). Since no age dependent failure stress data were available in literature Mertz et al. (1997 [54]) assumed the heart failure stress is independent with age. All the assumed ratios are summarized in Table 30.

EEVC Report – Advanced Child Dummies and Injury Criteria for Frontal Impact April 2008 Document No. 514
Report obtained from EEVC web site www.eevc.org 89
Table 30: Assumed ratios
Brain Neck ligamentous tissue Rib Heart
λ E / = λ Et (Calcaneal tendon)
= λ Eb (Skull bone) = 1
λ σ = λ σt
(Calcaneal tendon) = λ σt
(Calcaneal tendon) = λ σt
(Calcaneal tendon) /
DETERMINATION OF THE SCALING RATIOS
Head
The definition of head scale factors is based on (Mertz 2003 [55]): F = m γ (1) F = σ S (2)
Where: F is the force applied on the head m is the mass of the head γ is the acceleration of the center of gravity of the head σ is the head failure stress S is the head cross sectional area
Equations 1 and 2 can be combined to give the acceleration: γ = σ S / m (3) So acceleration ratio is: λ γ = λσ λS / λm (4) Since child and adults head were assumed to be of equal density λm = λx λy λz, where x is the head length, y is the head breadth and z is the chin to vertex distance. Surface ratio is λS = λy λz Irwin and Mertz (1997 [54]) have shown that the brain modulus is of first order on cranial modulus therefore the head stiffness depends on brain stiffness. Lastly as it was assumed that the variations with age of the brain tissue and of the calcaneal tendon are the same λσ = λσt So the acceleration ratio is: λ γ = λσt / λx (5) HIC ratio is: λ HIC = (λγ)2.5/λT (6) Where λT = λx/(λσ)1/2
So the combination equations 5 and 6 gives: λ HIC = (λσt)3 / (λx)1.5
(7) The head scaling factors from the Hybrid III midsize adult male dummy to the Q dummies are summarized in Table 31. Table 31: Head scaling factors from Hybrid III dummy to Q dummies
Q0 Q1 Q1.5 Q3 Q6
λ γ 0,99 0,84 0,87 0,94 1,03
λ HIC 0,49 0,45 0,53 0,71 0,98

EEVC Report – Advanced Child Dummies and Injury Criteria for Frontal Impact April 2008 Document No. 514
Report obtained from EEVC web site www.eevc.org 90
The head scaling factors from the Q dummies of different ages to the Q3 dummy are summarized in Table 32. Table 32: Head scaling factors from Q dummies to Q3 dummy
Q0 Q1 P1.5 Q3 Q6
λ γ 0,95 1,12 1,07 1 0,91
λ HIC 1,49 1,59 1,35 1 0,72 Neck The scaling method is based on muscular moment arm and cross-sectional area of the neck muscles (Mertz 1989 [56]). The axial force F can be expressed as:
F = σ S (1) Where
σ is the neck failure stress S is the neck area
The axial force ratio is: λ F = λσ λS (2)
As it was assumed that the variations with age of the neck tissue and of the calcaneal tendon are the same λ σ = λσt Surface ratio is λS =λx λy (3) Where x is neck depth and y is neck width Combining equations 2 and 3 gives:
λ F = λσt λx λy (4) The bending moment can be expressed as: M = F x (5) The moment ratio is:
λ M = λF λx (6) Combining equations 4 and 6 gives: The bending moment ratio is:
λ M = λσt λx² λy (7) The neck scaling factors from the Hybrid III midsize adult male dummy to the Q dummies are summarized in Table 33. Table 33: Neck scaling factors from Hybrid III dummy to Q dummies
Q0 Q1 Q1.5 Q3 Q6
λ F 0,13 0,29 0,33 0,41 0,56
λ M 0,07 0,22 0,25 0,33 0,50 The neck scaling factors from the Hybrid III 3 years old dummy to the Q3 dummy are summarized in Table 34.

EEVC Report – Advanced Child Dummies and Injury Criteria for Frontal Impact April 2008 Document No. 514
Report obtained from EEVC web site www.eevc.org 91
Table 34: Neck scaling factors from Hybrid III 3 years old dummy to Q3 dummy Q1
λ F 1,2
λ M 1,5 The neck scaling factors from the Q dummies of different ages to the Q3 dummy are summarized in Q-DUMMY SENSORS Table 35. Table 35: Neck scaling factors from Q dummies of different ages to Q3 dummy
Q0 Q1 P1.5 Q3 Q6
λ F 3,12 1,42 1,25 1 0,74
λ M 4,76 1,49 1,30 1 0,67
Thorax
Peak sternal deflection due to shoulder belt loading The rib is represented as a bending beam: The moment applied to the rib is: M = Fy / 4 (1) Where F is the force and y is the rib length The rib failure stress is:
σb = M c / I (2) Where c is the distance to neutral fiber and I is the inertial moment The rib deflection is δ = Fy3 / (48 Eb I) (3) Where Eb is bone modulus The combined equations 1, 2 and 3 give:
δ = σb y2 / (12 c Eb) (4) As it was assumed that λσb = λσt the rib deflection ration is:
λ δ = λy λσt / λEb (5)
Peak sternal deflection due to bag loading
Thoracic organ stress is: σ = δ / x E (1)
Where δ is the deflection x is the thoracic depth E is the thoracic organ modulus, it is assumed to be independent of age: λ E = 1
The deflection ratio is: λ δ = λx λσt (2)
Peak acceleration
The definition of acceleration factor is based on:

EEVC Report – Advanced Child Dummies and Injury Criteria for Frontal Impact April 2008 Document No. 514
Report obtained from EEVC web site www.eevc.org 92
F = m γ (1) F = σ S (2)
Where: F is the force applied on the thorax m is the thoracic mass γ is the acceleration of the center of gravity of the head σ is the rib stress S is the thoracic cross sectional area
Equations 1 and 2 can be combined to give the acceleration: γ = σ S/m (3) So acceleration ratio is: λ γ = λσ λS / λm (4) Since child and adults thorax were assumed to be of equal density λm= λx λy λz, where x is the torso depth, y is the torso width and z is the torso height Surface ratio is λS = λy λz As it was assumed that the variations with age of the bone and of the calcaneal tendon are the same λσ = λσt So the acceleration ratio is:
λ γ = λσt / λx (5) The thorax scaling factors from the Hybrid III midsize adult male dummy to the Q dummies are summarized in Table 36. Table 36: Thorax scaling factors from Hybrid III dummy to Q dummies
Q0 Q1 Q1.5 Q3 Q6
λ δ belt 0,84 1,03 0,98 0,93 0,84
λ δ bag 0,20 0,33 0,36 0,44 0,56
λ γ 1,8 1,50 1,51 1,58 1,63 The thorax scaling factors from the Q6 dummy to the Q3 dummy are summarized in Q-DUMMY SENSORS Table 37. Table 37: Thorax scaling factors from the Q6 to the Q3 dummy
Q3 Q6
λ δ belt 1 1,1
CHILD PROJECT METHOD
Data The data used to develop the injury criteria were drawn from CHILD and CREST accident reconstruction tests that had been validated by the both projects. The validation process of the reconstructions was an in-depth comparison of the reconstructions and the real world accidents including vehicle internal and external deformations, child restraint systems deformation and evidence of occupant kinematics. Around 70 cases were validated in this

EEVC Report – Advanced Child Dummies and Injury Criteria for Frontal Impact April 2008 Document No. 514
Report obtained from EEVC web site www.eevc.org 93
way. Initially reconstructions were performed with P dummies. These P dummies measures were not taken into account in the analysis except for the P1½ which is much closer to a Q dummy of that size. This process resulted in some 40 cases being available for the analysis for Q0, Q1, Q3, Q6 and P1½ dummies in frontal impacts with head, neck, thorax, abdomen, pelvis and lumbar spine measures. Data analysis The methodology used to develop the injury criteria was to compare the injuries observed in the real world accidents with the validated crash reconstruction dummy measurements. As the reconstructions were performed on dummies ranged from 0 to 6 years old, all data were scaled to a given age. The scaling methodology was the one proposed by Mertz 2003 [55] and already described in the Chapter 2 of this document, but instead of scaling adult data to child data, all age child data were scaled to a child given age. If the sample was considered large enough then injury risk curves were constructed by Certainty Method and Logistic Regression.
INJURY CRITERIA
HEAD The existing EEVC adult head injury criteria are the Head Injury Criteria HIC 36ms = 1000 and the acceleration 3ms = 80g. These values scaled to the Q3 correspond to HIC 36ms = 710 and acceleration 3ms = 75 g. Head Injury Criteria Issued From Scaling Adult Data The head reference data are the mid-size adult injury criteria reported in the Injury Assessment Reference Values (IARVs). They are defined for use with the Hybrid III midsize adult male dummy (Mertz 2003 [55]). Two criteria are used to assess the severity of head injuries: the Head Injury Criterion (HIC) and the resultant peak acceleration of the center of gravity of the head. HIC value is referred to as 15ms HIC. The 15ms HIC Injury Assessment Criteria limit is 700 for the midsize adult male. It corresponds to 5% risk of skull fracture and to 5% risk of AIS4+ brain injury (Prasad and Mertz 1985 [57], Mertz et al.1996 [58]). The peak resultant acceleration Injury Assessment Criteria is 180 G for the midsize adult male, which corresponds to 5% risk of skull fracture (Mertz et al.1996 [58]). Head Injury Criteria Issued From the CHILD Project The head data were drawn from around 40 accident reconstruction tests. The real world accident injuries were directly paired with head linear accelerations and HIC 15ms values. Data were scaled in order to correspond to the 3 years old equivalent value. Table 32 gives the head scaling factors for the 3 years old child from other age Q-dummies. In the CHILD database there are very few cases AIS4+ and very few cases with skull fracture. Head injury risk curves for 3ms acceleration and HIC 15ms were constructed with certainty method and logistic regression.
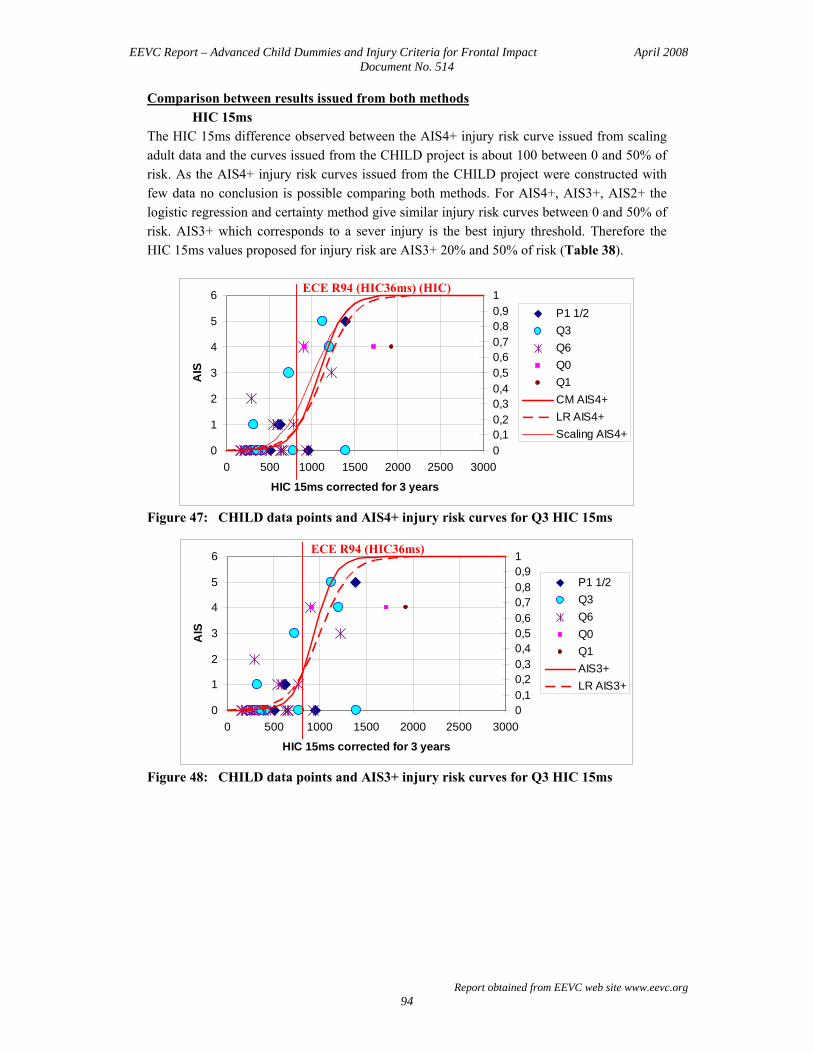
EEVC Report – Advanced Child Dummies and Injury Criteria for Frontal Impact April 2008 Document No. 514
Report obtained from EEVC web site www.eevc.org 94
Comparison between results issued from both methods HIC 15ms
The HIC 15ms difference observed between the AIS4+ injury risk curve issued from scaling adult data and the curves issued from the CHILD project is about 100 between 0 and 50% of risk. As the AIS4+ injury risk curves issued from the CHILD project were constructed with few data no conclusion is possible comparing both methods. For AIS4+, AIS3+, AIS2+ the logistic regression and certainty method give similar injury risk curves between 0 and 50% of risk. AIS3+ which corresponds to a sever injury is the best injury threshold. Therefore the HIC 15ms values proposed for injury risk are AIS3+ 20% and 50% of risk (Table 38).
0
1
2
3
4
5
6
0 500 1000 1500 2000 2500 3000
HIC 15ms corrected for 3 years
AIS
00,10,20,30,40,50,60,70,80,91
P1 1/2Q3Q6Q0Q1CM AIS4+ LR AIS4+Scaling AIS4+
Figure 47: CHILD data points and AIS4+ injury risk curves for Q3 HIC 15ms
0
1
2
3
4
5
6
0 500 1000 1500 2000 2500 3000
HIC 15ms corrected for 3 years
AIS
00,10,20,30,40,50,60,70,80,91
P1 1/2Q3Q6Q0Q1AIS3+LR AIS3+
Figure 48: CHILD data points and AIS3+ injury risk curves for Q3 HIC 15ms
ECE R94 (HIC36ms) (HIC)
ECE R94 (HIC36ms)

EEVC Report – Advanced Child Dummies and Injury Criteria for Frontal Impact April 2008 Document No. 514
Report obtained from EEVC web site www.eevc.org 95
0
1
2
3
4
5
6
0 500 1000 1500 2000 2500 3000
HIC 15ms corrected for 3 years
AIS
00,10,20,30,40,50,60,70,80,91
P1 1/2Q3Q6Q0Q1CM AIS2+LR AIS2+
Figure 49: CHILD data points and AIS2+ injury risk curves for Q3 HIC 15ms Table 38: Q3 Head AIS3+ injury risk
HIC 15ms 20% 50% ECE R94 scaled
Calculated with Certainty method 790 940 HIC36ms =710
Calculated with Logistic regression 780 1000
Head 3ms acceleration
0
1
2
3
4
5
6
0,0 50,0 100,0 150,0 200,0
Head Acc 3ms 3 years (g)
AIS
00,10,20,30,40,50,60,70,80,91
P1 1/2Q3Q6Q0Q1CM AIS4+LR AIS4+
Figure 50: CHILD data points and AIS4+ injury risk curves for Q3 Head Acc 3ms
ECE R94
ECE R94 (HIC36ms)

EEVC Report – Advanced Child Dummies and Injury Criteria for Frontal Impact April 2008 Document No. 514
Report obtained from EEVC web site www.eevc.org 96
0
1
2
3
4
5
6
0,0 50,0 100,0 150,0 200,0
Head Acc 3ms 3 years (g)
AIS
00,10,20,30,40,50,60,70,80,91
P1 1/2Q3Q6Q0Q1CM AIS3+LR AIS3+
Figure 51: CHILD data points and AIS3+ injury risk curves for Q3 Head Acc 3ms
0
1
2
3
4
5
6
0,0 50,0 100,0 150,0 200,0
Head Acc 3ms 3 years (g)
AIS
00,10,20,30,40,50,60,70,80,91
P1 1/2Q3Q6Q0Q1CM AIS2+LR AIS2+
Figure 52: CHILD data points and AIS2+ injury risk curves for Q3 Head Acc 3ms No injury head acceleration 3ms data is available in literature, therefore we just can compare the injury risk curves issued from the CHILD project and performed with the Certainty Method and the Logistic Regression. The injury risk curves are quite similar between 0 and 50% of risk. AIS3+ which corresponds to a sever injury is the best injury threshold. The acceleration 3ms values proposed for the head injury risk are AIS3+ 20% and 50% of risk (Table 39). Table 39: Q3 Head AIS3+ injury risk
Acceleration 3ms 20% 50% ECE R94 scaled
Calculated with Certainty method 84 g 92 g 75 g
Calculated with Logistic regression 81 g 99 g
ECE R94
ECE R94

EEVC Report – Advanced Child Dummies and Injury Criteria for Frontal Impact April 2008 Document No. 514
Report obtained from EEVC web site www.eevc.org 97
NECK The existing EEVC adult neck injury criteria are:
- the tension force Fz < 3,3kN at 0ms, Fz < 2,9kN at 35ms, Fz < 1,1kN at 60ms, - the shearing force Fx < 3,1kN at 0ms, Fx < 1,5kN between 25 and 35ms, Fx < 1,1kN
at 60ms - the extension moment My < 57Nm
For forward facing restraining systems, the main loading in frontal impact being flexion, the corresponding IARV (My flexion < 190 Nm) was considered as a reference.
These values scaled to the Q3 correspond to: - the tension force Fz < 1,35kN at 0ms, Fz < 1,2kN at 35ms, Fz < 0,45kN at 60ms, - the shearing force Fx < 1,27kN at 0ms, Fx < 0,6kN between 25 and 35ms, Fx <
0,45kN at 60ms - the flexion moment My < 63Nm
Neck injury criteria issued from scaling adult and child data For in-position testing the neck injury criteria are the peak values of the axial forces (tension and compression), the bending moments (extension, flexion and lateral flexion) (Mertz 2003 [55]). Peak tension and peak extension moment are based on animal testing paired with a 3 year old child dummy and correspond to 3% for the tension and to 5% for extension moment of AIS3+ injury risk. Peak flexion moment and peak compression are based on volunteer testing (Mertz and Patrick 1967 [59], 1971 [60]), and non-injurious accident reconstructions (Mertz et al. 1978 [61], Nyquist et al. 1980 [62]). These values correspond to an AIS3+ injury risk inferior to 5%. Neck injury criteria issued from the CHILD project The neck data are drawn from around 40 accident reconstruction tests. The method is a detailed analysis of the real world accident neck injuries and mechanisms in order to associate good physical parameters to each kind of injury. The physical parameters are the shearing and traction forces, and flexion moment. Data are scaled in order to correspond to the 3 years old equivalent value. Table 33 gives the neck scaling factors, force and moment factors, for the three years old child. There are very few cases with injuries for each parameter, and not enough to enable the construction of injury risk curves. Comparison between results issued from both methods The comparison between both methods is possible only for tension and flexion moment but there are not enough injury cases to do an accurate comparison. For neck tension (the scaled injury risk curve seems coherent with the CHILD data. No neck injury is observed below 1450N of traction force in the CHILD database and the scaled AIS3+ injury risk curve indicates a 3% risk for a 1220N tension (Table 40). As far as the flexion moment is concerned there is no coherence between the CHILD injury data and the scaled injury risk curve. Therefore the proposed neck injury risk values are tension values (Table 40).

EEVC Report – Advanced Child Dummies and Injury Criteria for Frontal Impact April 2008 Document No. 514
Report obtained from EEVC web site www.eevc.org 98
0
1
2
3
4
5
6
0 500 1000 1500 2000 2500 3000 3500 4000 4500
Fz 3 years (N)
AIS
0
0,2
0,4
0,6
0,8
1
P1 1/2
Q3
Q6
Q0
ScalingAIS3+
Figure 53: CHILD data points and AIS3+ injury risk curve scaled base on literature
for Q3 upper neck tension
0
1
2
3
4
5
6
0 50 100 150 200My 3 years (Nm)
AIS
0,00,10,20,30,40,50,60,70,80,91,0
P1 1/2
Q3
Q6
ScalingAIS3+
ECE94
Figure 54: CHILD data points and AIS3+ injury risk curve scaled base on literature
for Q3 upper neck flexion moment Table 40: Q3 Neck AIS3+ injury risk
3% 20% 50% CHILD project first injury
ECE R94 scaled
Fz issued from scaling 1220 N 1555 N 1705 N 1457 N 1350 N
My issued from scaling 79 Nm 96 Nm 13 Nm 63 Nm
ECE R94

EEVC Report – Advanced Child Dummies and Injury Criteria for Frontal Impact April 2008 Document No. 514
Report obtained from EEVC web site www.eevc.org 99
THORAX The existing EEVC adult thorax injury criteria are the chest deflection d = 50mm and the deflection rate VC = 1m/s. These values scaled to the Q3 correspond to d = 46,5mm and VC = 1m/s Thorax injury criteria issued from scaling adult and child data In frontal impact the thorax injury criteria are the peak sternal deflection, the peak sternal deflection rate and the peak thoracic spine acceleration. The predominant thorax injury in the AIS3+ data-base is the rib fracture. However because of the low elastic modulus of their ribs, children can undergo large sternal deflections without rib fractures but with organ injury. The risk of AIS4+ thoracic organ injury, particularly heart injury, must be taken into account.
Peak sternal deflection due to shoulder belt loading The sternal deflection risk curve of AIS3+ was defined (Mertz et al. 1997 [54]) for the 3-point-belt restrained midsize male Hybrid III dummy. The IARV of 50 mm sternal deflection due to belt loading corresponds to 50% risk thorax injury AIS3+.
Peak sternal deflection due to airbag loading Mertz et al (1997 [54]) have published an injury risk curve for AIS4+ thoracic injury. These curves, based on cadaver impact data (Kroell et al 1972 [63] et 1974 [64]), are defined for sternal deflection due to a distributed loading. The IARV of 64,3 mm sternal deflection due to distributed loading corresponds to 5% risk thorax injury AIS4+.
Peak sternal deflection rate
The injury risk curve for AIS4+ thoracic injury based on sternal deflection was developed using the animal and the GM 3-year old dummy data from Mertz et al (1997 [54]). Because of behavior differences between the GM dummy and the 3 years old Q-dummy, the injury risk curve defined on the GM dummy should not be used directly for the Q-dummy family. No peak sternal deflection rate based on adult testing exists for adults.
Peak thoracic spine acceleration
The spine acceleration provides an assessment of how well the restraint loads are balanced between the neck, lumbar spine, clavicles, ribs and internal thoracic organs (Mertz 2003 [55]). Therefore, to limit the distortion between these segments the limit thoracic acceleration for the Hybrid III midsize male dummy was defined as 60g (Mertz 1984 [65]). This value was based on the results of volunteer tests (Mertz and Gadd 1971 [66]). Thorax injury criteria issued from the CHILD project

EEVC Report – Advanced Child Dummies and Injury Criteria for Frontal Impact April 2008 Document No. 514
Report obtained from EEVC web site www.eevc.org 100
The chest data were drawn from 24 accident reconstruction test. The real world accident injuries were directly paired with the deflection dynamic measurements acquired with the Q3 and the Q6 dummies. Data were scaled in order to correspond to the 3 years old equivalent value. Table 37 gives the chest scaling factors for the Q3 dummy from the Q6 dummy. Chest injury risk curves were constructed with certainty method and logistic regression. Comparison between results issued from both methods
Chest injury risk curves - 3 years old Q dummy
0
1
2
3
4
5
6
0,0 20,0 40,0 60,0 80,0 100,0
Chest Deflection (mm) due to belt loading
AIS
00,10,20,30,40,50,60,70,80,91
Q3Q6CM AIS3+LR AIS3+Scaling
ECE94
Figure 55: CHILD data points and AIS3+ injury risk curve for Q3 chest deflection The comparison is possible only for peak sternal deflection due to shoulder belt. A good match is observed in the curve issued from scaling and the curve issued from the CHILD database calculated with Certainty Method. Therefore the chest deflection values proposed for the thorax injury risk are 20% and 50% of AIS3+ injury risk (Table 41). Table 41: Q3 Chest AIS3+ injury risk
Chest deflection 20% 50% ECE R94 scaled
Issued from scaling 33 mm 46 mm 46,5 mm
Issued from the CHILD database (CM) 38 mm 48 mm
Issued from the CHILD database (LR) 36 mm 53 mm

EEVC Report – Advanced Child Dummies and Injury Criteria for Frontal Impact April 2008 Document No. 514
Report obtained from EEVC web site www.eevc.org 101
REFERENCES 42 Kallieris “Comparison between child cadavers and child dummy by using child restraint systems in
simulated collisions” 20th Stapp Car Crash Conference, SAE 760815, 1976 43 Mertz and Weber “Interpretations of the impact responses of a 3 year old child dummy relative to child
injury potential” SAE 826048, 1982 44 Prasad and Daniel “A biomechanical analysis of head, neck, and torso injuries to child surrogates due to
sudden torso acceleration” 28th Stapp Car Crash Conference, SAE 841656, November, 1984 45 Planath et al “Synthesis of data towards neck protection criteria for children, IRCOBI Conference meeting
1992 46 Newman and Dalmotas “Atlantico-occipital fracture dislocation in lap-belt restrained children” Child
occupant protection, SAE933099, 1993 47 Palisson et al. “Estimating Q3 Dummy Injury Criteria for Frontal Impact Using the CHILD Project Results
and Scaling Reference Values”, IRCOBI Conference, September, 2007 48 Melvin “Injury assessment reference values for the crabi 6 month infant dummy in a rear-facing infant
restraint with airbag deployment” SAE 950872, February, 1995 49 Irwin and Mertz “Biomechanical bases for the Crabi and Hybrid III child dummies” 41st Stapp Car Crash
Conference, SAE 973317, November, 1997 50 Van Ratingen et al. “Biomechanically based design and performance targets for a 3-year old child crash
dummy for frontal and side impact” 41st Stapp Car Crash Conference, 973316, November, 1997 51 Yamada “Strength of biological materials” Williams&Wilkins, 1970 Mid-size adult reference regarding
injury criteria 52 Mc Pherson and Kriewall “The elastic modulus of fetal cranial bone: a first step toward an understanding of
the biomechanics of fetal head modling” Journal Biomechanics, vol 13, n°1, 1978 53 AAMA (1998) “Proposal for dummy response limits for FMSS 208 Compliance testing”, Docket No.
NHTSA 98-4405, Notice 1, AAMA S98-13 Attachment C. 54 Mertz et al “Injury risk curves for children and adults in frontal and rear collisions” 41st Stapp Car Crash
Conference, SAE, 1997 55 Mertz et al “Biomechanical and scaling bases for frontal and side impact injury assessment reference values”
47th Stapp Car Crash Conference, 2003-22-0009, October, 2003 56 Mertz “Size, Weight, and biomechanical impact response requirements for adult size small female and large
dummies” SAE890756, 1989 57 Prasad and Mertz “The position of th United States delegation to the ISO Working Group 6 on the use of
HIC in the automotive environment” SAE851246, 1985 58 Mertz et al “Head injury risk assessment for forehead impacts” SAE 960099, 1996 59 Mertz and Patrick “Investigation of the kinematics and kinetics of whiplash” 11th Stapp Car Crash
Conference, SAE, 1967 60 Mertz and Patrick “Strength and response of the human neck” 15th Stapp Car Crash Conference, SAE, 1971 61 Mertz et al “An assessment of compressive neck loads under injury–producing conditions” The physician
and sports medicine, 1978

EEVC Report – Advanced Child Dummies and Injury Criteria for Frontal Impact April 2008 Document No. 514
Report obtained from EEVC web site www.eevc.org 102
62 Nyquist, G.W., Begman, P.C., King, A.I., and Mertz, H.J., "Correlation of Field Injuries and GM Hybrid III
Dummy Response for Lap-Shoulder Belt Restraint", Journal of Biomechanical Engineering, Vol. 102, May 1980.
63 Kroell et al “Impact tolerance and response of the human thorax” 16th Stapp Car Crash Conference, SAE,
1972 64 Kroell et al “Impact tolerance and response of the human thorax II” 18th Stapp Car Crash Conference, SAE,
1974 65 Mertz ISO/TC22/SC12/WG6 Document N180 1984 66 Mertz and Gadd “Thoracic tolerance to whole body deceleration” 15th Stapp Car Crash Conference, SAE,
1971

EEVC Report – Advanced Child Dummies and Injury Criteria for Frontal Impact April 2008 Document No. 514
Report obtained from EEVC web site www.eevc.org 103
ANNEX H: DETAILS OF VALIDATION TEST PROGRAM
PROTOCOL
The test procedure used is based on the ECE-R44 protocol (status of 4th February 2004; including Supplement No. 6), in particular on the dynamic test procedure as described by ECE-R44 paragraph 8.1.3, Frontal impacts. However, on a number of points the test procedure deviated from the ECE-R44 dynamic test protocol. Firstly, only frontal impact sled tests were performed. Therefore no tests on trolley and vehicle body shell (ECE-R44 8.1.3.2) or tests with a complete vehicle (ECE-R44 8.1.3.3) have been conducted. Secondly, CRS with support legs (ECE-R44 7.1.4.9) have been tested. The test laboratory has chosen one suitable position for the support leg and has repeated this test. The position of the support leg on the floor is photographed. Thirdly, for all classes of ISOFIX CRS (ECE-R44 7.1.4.10) it was decided to perform one test with the anti-rotation device in use, if any. One change from the specification, given in Annex 6 of ECE-R44, is that the EEVC program allowed the use of a double sled with two benches on the trolley. Furthermore, acceleration and deceleration based sleds were allowed.
DUMMY SELECTION AND CONFIGURATION All Q-dummies and P dummies were used with exception of the P10. Dummy sizes were selected according to Table 42. Table 42: Selection of dummy size per CRS class.
ECE R44 Group Dummy
0+ I II III P P0 P3/4 P3 P6
Small Q Q0 Q1 Q3 Q6 P P3/4 Q1 - -
Intermediate Q Q1 Q1.5 - - P P1.5 P3 P6 -
Large Q Q1.5 Q3 Q6 -
Both dummy families were fully instrumented (see Chapter 3, Table 2). Modelling clay for the P dummies was only used for appropriate kinematics and not as injury risk assessment. Optional abdominal sensors concepts for Q3 and Q6, developed in the EC-CHILD project, were considered to be experimental at the time of testing, and therefore not included in the dummies. The temperature of each child dummy was stabilised in the range of 18°C to 22°C. To fix the dummy position in the pre crash phase, masking tapes on the heads and arms were used, if necessary. Each test was filmed to allow for analysis of the dummy kinematics and determination of the timing of the maximum head excursion.
TEST MATRIX The test matrix covers almost all existing child seat categories, including rear infant carry cot

EEVC Report – Advanced Child Dummies and Injury Criteria for Frontal Impact April 2008 Document No. 514
Report obtained from EEVC web site www.eevc.org 104
(ISOFIX/universal), seats with harness (forward/rearward, ISOFIX/universal), shield systems (ISOFIX/universal), boosters with backrest, booster cushions and multi-group. In total, 30 CRS’s were selected (1). According to the protocol each child seat was tested with two sizes of dummies, for both P and Q. Each test was repeated once with a new CRS of the same model. In case of failure of the CRS, breakage of the dummy or “large, unexpected differences” between the two conducted tests, a third test was conducted. Hence in total, 320 tests were carried out. Table 43 summarizes the test matrix. Table 43: Test matrix of P & Q-dummy family comparison.
DATA ANALYSIS AND FOLLOW-UP
For the data analysis, a database was developed to compile all test results: measurement signals, photographs and videos. In addition, a summary of all test results per laboratory was made. Each sponsor of the program has received a detailed test report of those tests performed under the contract.
1 As this program intended to study the dummies and not the performance of the child seats tested, it
was decided to remove any reference to the manufacturer of the individual child restraints in this report. Instead, the CRS have been numbered anonymously.

EEVC Report – Advanced Child Dummies and Injury Criteria for Frontal Impact April 2008 Document No. 514
Report obtained from EEVC web site www.eevc.org 105
ANNEX I: DETAILS OF INJURY ASSESSMENT REFERENCE VALUE VALIDATION
CRS “PASS” and “FAIL” DISTRUBUTION PER SET OF IARVs
In Chapter 4 the sets of IARVs obtained based on direct scaling or through accident reconstructions are given in tables and graphs. A total number of 152 UNECE R44 tests with Q-dummy is available to study the effect of the different sets of IARVs applied to the injury criteria measured: • 74 CRS – Dummy combinations (generally 2 tests per CRS – Dummy combination
available) o 12 Q0 dummy tests all rearward facing (RF) o 45 Q1 dummy tests 12 RF o 28 Q1.5 dummy tests 14 RF o 48 Q3 dummy tests 2 RF o 19 Q6 dummy tests none RF
• 30 CRS types (three CRS’s are tested as Group I and Group II, see Annex H) o 6 Group 0+ CRS’s (all RF) 34 tests o 12 Group I CRS’s (1 RF) 62 tests o 6 Group I/II/III CRS’s test as Group I 25 tests o 9 Group I/II/III and II/III CRS’s tested as Group II 37 tests
To assess the test results relative to the IARV for the different dummies, the peak response is normalised to the IARVs. If the normalised value is smaller than 1, the CRS “passes”, if it is larger than 1 the CRS “fails”. In Figure 56, the “pass” / “fail” distribution of all CRS’s is given for all five sets of IARVs is given. The figure shows the “pass” and “fail” distribution based on the best case, in other words, the best performing of the two repeated tests available per CRS-Dummy combination is taken. As each CRS is tested with at least two dummy sizes, the worst result per CRS determines the “pass” and “fail” of the CRS. To show the “pass” and “fail” level with respect to the injury assessment reference value in the distribution, four zones are defined:
• Smaller than 50% of the criterion value Amply passed • Between 50 and 100% of the criterion value Passed • Between 100 and 150% of the criterion value Failed • Larger than 150% of the criterion value Amply failed
Although all used CRS’s are homologated according to UNECE R44, it is possible that some of the tests with P-dummies in the data base would fail to comply with the UNECE R44 criteria. The results given in Figure 56 show that application of the new criteria can have a significant effect, with only about 20 to 40% of the CRS’s complying with the proposed injury assessment reference values. Because about 60 to 80% of the CRS’s fail to comply, there would be a significant opportunity to improve the CRS designs with regards to safety offered to the child occupant. It also shows that the 20% risk IARVs are the most challenging, as one would expect.

EEVC Report – Advanced Child Dummies and Injury Criteria for Frontal Impact April 2008 Document No. 514
Report obtained from EEVC web site www.eevc.org 106
0%
10%
20%
30%
40%
50%
60%
70%
80%
90%
100%
ECE R94 (scaled)
AIS3+ 20%CM AIS3+ 20%LR AIS3+ 50%CM AIS3+ 50%LR
CRS Pass and Fail per set of IARVs
>150% of Criterion
100-150% of Criterion
50-100% of Criterion
<50% of Criterion
Distribution of pass and fail over 33 CRS configurations152 tests74 CRS-dummy combination30 CRS types
Based on best test per CRS-Dummy combination
Figure 56: Pass and Fail of CRS’s per set of Injury Assessment Reference Values In the tables and figures below details of the CRS pass and fail distribution are given for all five sets of Injury Assessment Reference Values (IARVs). The following data to given per set of IARVs:
• Tabular, the absolute number of passes and failures o For all five Injury Criteria parameters normalized to the relevant IARVs in
the best result from the two available tests per CRS-Dummy combination. o For the maximum parameter normalized to the relevant IARVs in the best
test per CRS-Dummy. (74 CRS-Dummy combinations, 4 of them are used in two groups)
o Per CRS type in the best test of the relevant CRS-Dummy combinations. (Physically 30 CRS’s, 3 used in Group I and Group II, effectively 33 CRS’s)
• Pictorial the percentage of the number passes and failures, as described above, relative to the number of available data points.
• Venn-diagram on how the curial parameters (HIC, Upper Neck Tension and Chest Deflection) contribute to the CRS’s failures.

EEVC Report – Advanced Child Dummies and Injury Criteria for Frontal Impact April 2008 Document No. 514
Report obtained from EEVC web site www.eevc.org 107
ECE R94 SCALED IARVs Table 44: Number of passes and failures for UNECE R94 Scaled IARVs per
parameter, per maximum for CRS-Dummy combination and per CRS type ECE R94 scaled
<50%
50-1
00%
100-
150%
>150
%
Head HIC 18 29 21 8 Head ACC3ms 7 57 11 0 Upper Neck Fz 18 3 14 15 Upper Neck My 41 25 0 1 Thorax Chest deflection 30 19 3 1 Maximum parameter per CRS-Dummy combination 3 32 22 21
Per CRS type 0 8 12 13
0%
10%
20%
30%
40%
50%
60%
70%
80%
90%
100%
HIC15 ACC3ms Fz My D chest Maximum per CRS type
ECE R94 Scaled
>150% of Criterion
100-150% of Criterion
50-100% of Criterion
<50% of Criterion
CRS Pass and Fail Parameters from best test Maximum from best testsMaximum per CRS type
152 tests74 CRS dummy combination30 CRS types
Figure 57: Pass and fail distribution per parameter for UNECE R94 Scaled IARVs Figure 58: Failures of CRS’s per parameter for UNECE R94 Scaled IARVs
HIC (20) Fz (15)
D chest (4)
10
2
1
2
8
Passed 8 2 failures on other parameters
ECE R94 Scaled
Explanation of the adjacent Venn-diagram: 8 CRS’s comply with the IARVs 20 CRS’s failed on Head HIC value
8 failed on HIC only 10 failed on both HIC and Fz 2 failed on HIC, Fz and D chest
15 CRS’s failed on Upper Neck Tension Fz value 1 failed on Fz only 10 failed on both Fz and HIC 2 failed on both Fz and D chest 2 failed on all three: HIC, Fz and D chest
4 CRS’s failed on Chest Deflection Dchest value none failed on Dchest only or HIC and Dchest 2 failed on both Fz and D chest 2 failed on all three: HIC, Fz and D chest

EEVC Report – Advanced Child Dummies and Injury Criteria for Frontal Impact April 2008 Document No. 514
Report obtained from EEVC web site www.eevc.org 108
AIS3+ 20%CM and LR IARVs Table 45: Number of passes and failures for AIS3+ 20%CM and LR IARVs per
parameter, per maximum for CRS-Dummy combination and per CRS type AIS3+ 20%CM AIS3+ 20%LR
<50%
50-1
00%
100-
150%
>150
%
<50%
50-1
00%
100-
150%
>150
%
Head HIC 22 32 18 4 22 31 19 4 Head ACC3ms 9 63 3 0 7 64 4 0 Upper Neck Fz 18 7 18 7 18 7 18 7 Upper Neck My 55 11 1 0 55 11 1 0 Thorax Chest deflection 22 22 8 1 19 24 9 1 Maximum parameter per CRS-Dummy combination 6 31 30 11 6 30 31 11
Per CRS type 0 8 16 9 0 7 17 9
0%
10%
20%
30%
40%
50%
60%
70%
80%
90%
100%
HIC15 ACC3ms Fz My D chest Maximum per CRS type
AIS3+ 20% CM
>150% of Criterion
100-150% of Criterion
50-100% of Criterion
<50% of Criterion
CRS Pass and Fail Parameters from best test Maximum from best testsMaximum per CRS type
152 tests74 CRS dummy combination30 CRS types
Figure 59: Pass and fail distribution per parameter for AIS3+ 20%CM IARVs
0%
10%
20%
30%
40%
50%
60%
70%
80%
90%
100%
HIC15 ACC3ms Fz My D chest Maximum per CRS type
AIS3+ 20% LR
>150% of Criterion
100-150% of Criterion
50-100% of Criterion
<50% of Criterion
CRS Pass and Fail Parameters from best test Maximum from best testsMaximum per CRS type
152 tests74 CRS dummy combination30 CRS types
Figure 60: Pass and fail distribution per parameter for AIS3+ 20%LR IARVs
20%CM
20%CM

EEVC Report – Advanced Child Dummies and Injury Criteria for Frontal Impact April 2008 Document No. 514
Report obtained from EEVC web site www.eevc.org 109
Figure 61: Failures of CRS’s per parameter for AIS3+ 20%CM and LR IARVs
Explaining example for the left diagram: 8 CRS’s passed all IARVs, 16 CRS’s failed on the HIC value, 8 failed on HIC only, 5 failed on both HIC and Fz and 3 failed on HIC, Fz and D chest.
AIS3+ 50%CM and LR IARVs Table 46: Number of passes and failures for AIS3+ 50%CM and LR IARVs per
parameter, per maximum for CRS-Dummy combination and per CRS type AIS3+ 50%CM AIS3+ 50%LR
<50%
50-1
00%
100-
150%
>150
%
<50%
50-1
00%
100-
150%
>150
%
Head HIC 24 37 13 2 24 39 11 2 Head ACC3ms 12 62 1 0 20 55 0 0 Upper Neck Fz 19 8 20 3 19 8 20 3 Upper Neck My 61 5 1 8 61 5 1 0 Thorax Chest deflection 31 19 2 1 33 19 1 0 Maximum parameter per CRS-Dummy combination 11 35 26 6 13 35 25 5
Per CRS type 2 12 14 5 2 12 15 4
0%
10%
20%
30%
40%
50%
60%
70%
80%
90%
100%
HIC15 ACC3ms Fz My D chest Maximum per CRS type
AIS3+ 50% CM
>150% of Criterion
100-150% of Criterion
50-100% of Criterion
<50% of Criterion
CRS Pass and Fail Parameters from best test Maximum from best testsMaximum per CRS type
152 tests74 CRS dummy combination30 CRS types
Figure 62: Pass and fail distribution per parameter for AIS3+ 50%CM IARVs
HIC (16) Fz (14)
D chest (7)
5
3
4
2
8
2 Passed 8 1 failure on other parameter
AIS3+ 20%CM
HIC (17) Fz (14)
D chest (8)
6
3
3
2
8
3 Passed 7 1 failure on other parameter
AIS3+ 20%LR

EEVC Report – Advanced Child Dummies and Injury Criteria for Frontal Impact April 2008 Document No. 514
Report obtained from EEVC web site www.eevc.org 110
0%
10%
20%
30%
40%
50%
60%
70%
80%
90%
100%
HIC15 ACC3ms Fz My D chest Maximum per CRS type
AIS3+ 50% LR
>150% of Criterion
100-150% of Criterion
50-100% of Criterion
<50% of Criterion
CRS Pass and Fail Parameters from best test Maximum from best testsMaximum per CRS type
152 tests74 CRS dummy combination30 CRS types
Figure 63: Pass and fail distribution per parameter for AIS3+ 50%LR IARVs
Figure 64: Failures of CRS’s per parameter for AIS3+ 50%CM and LR IARVs
Explaining example for the left diagram: 14 CRS’s passed all IARVs, 10 CRS’s failed on the HIC value, 5 failed on HIC only, 4 failed on both HIC and Fz and 1 failed on HIC, Fz and D chest.
IN-DEPTH IARV EVALUATION ASSESSMENT
INJURY CRITERIA CROSS-POLTS
Below additional information with regards to the in-depth evaluation assessment is given. In Figure 65 cross-plots of all five injury criteria parameters normalized to the AIS3+ 20%CM IARVs are given to show their possible relations. It can be concluded that, apart from two parameters, there are no strong correlations. The head HIC value and the Head acceleration 3ms show a strong correlation. As the HIC value is the most critical one it can be concluded that the Head ACC 3ms does not have much added value as an injury criterion. The two yellow shaded cross plots show a slight correlation of HIC versus Upper Neck Tension and HIC versus Chest deflection. First yellow cross plot: In general high HIC values and high Upper neck tension loads come together. Second yellow cross plot: In case of high HIC values, the Chest deflections are small and in case of large Chest deflections the HIC values are low. These two yellow cross plots, that contain the three crucial injury criteria parameters, are used in the in-depth assessment of the impact of the IARVs in this Annex.
HIC (10) Fz (14)
D chest (3)
4
1
7
2
5
Passed 14 No failures on other parameters
AIS3+ 50%CM
HIC (10) Fz (14)
D chest (8)
5
8
1
5
Passed 14 No failures on other parameters
AIS3+ 50%LR
50%CM
50%CM

EEVC Report – Advanced Child Dummies and Injury Criteria for Frontal Impact April 2008 Document No. 514
Report obtained from EEVC web site www.eevc.org 111
Figure 65: Cross plots of all five injury criteria parameters relative to each other
normalized with AIS3+ 20%CM IARVs In Figure 66 the two cross-plots are shown in detail. The left graph HIC15 versus Upper Neck Tension (Fz) and the right graph HIC15 versus Chest Deflection. The data points are split into the UNECE R44 CRS groups: Group 0+, Group I and Group II. In Figure 15 the same two cross-plots are given with the envelopes of the four sets of IARVs. The following notes and observations can be helpful to interpret the graphs.
• The graphs show the results for the three parameters of all the 152 tests. (also repeat tests are shown)
• If a parameter shows up to be zero, the parameter is not measured or not reliable. This often occurs for Upper Neck Tension and Chest Deflection.
• Having HIC15 on the vertical axis in both graphs enables to get an impression of the three parameters that belong to one test. (For two tests this is indicated with arrows)

EEVC Report – Advanced Child Dummies and Injury Criteria for Frontal Impact April 2008 Document No. 514
Report obtained from EEVC web site www.eevc.org 112
• Points in the green area passed the AIS3+ 20%CM Injury Criterion. Outside the green area one or two of the parameters failed to comply. (see for envelops of the other sets of injury assessment reference values Figure 15)
• The red dash-dot-lines indicate slight correlations or trends described above • Group 0+ tests in general show results smaller than the AIS3+ 20%CM IARVs. • Group I CRS’s often fail on HIC15 and Upper neck tension. • Group I/II/III CRS’s tested as Group I (with Q1, Q1.5 and Q3 dummies) show
almost all high HIC values and Upper neck tension loads and almost all low Chest deflection.
Figure 66: HIC15 vs Upper neck tension and HIC15 vs Chest deflection for all tests
normalized to AIS3+ 20%CM IARVs for Group 0+, I and II
Figure 67: HIC15 vs Upper neck tension and HIC15 vs Chest deflection for all tests
normalized to AIS3+ 20%CM with envelopes for all sets of IARVs.
Injury Assessment Reference Values AIS3+ 20%CM AIS3+ 20%LR AIS3+ 50%CM
AIS3+ 50%LR

EEVC Report – Advanced Child Dummies and Injury Criteria for Frontal Impact April 2008 Document No. 514
Report obtained from EEVC web site www.eevc.org 113
ANALYSIS OF GROUP 0+ CRS’s
Within the data base of 152 UNECE R44 frontal sled tests with Q dummies, the sample of Group 0+ child restraint systems (CRS’s) is 34 tests. Six different Group 0+ CRS’s, all in rearward facing configurations, are tested with Q0 dummy (12 tests), Q1 dummy (10 tests) and Q1.5 dummy (12 tests). In general there are 2 tests available per CRS-Dummy combination. The six Group 0+ CRS’s can be divided in (see Annex H):
• 3 Universal infant carriers • 1 Infant carrier ISOFIX basis • 1 Combination CRS used RWD-facing • 1 Combination CRS ISOFIX use RWD-facing.
New Criteria versus UNECE R44 Results - Group 0+ CRS’s In Figure 68 in the left graph the HIC15 versus maximum UNECE R44 head excursion is shown. In the right graph, the Chest deflection versus the UNECE R44 Chest acceleration (3ms) is plotted. For each cross-plot, the new criterion and the UNECE R44 criterion are measured with a Q-dummy in the same test. The HIC15 value and the chest deflection are normalized to the AIS3+ 20%CM injury assessment reference values. The green area indicates the reference values, for UNECE R44 the limits used are 600 mm for head excursion and 55 g for chest acceleration 3ms.
Figure 68: Group 0+ New Q-dummy parameters versus UNECE R44 results
HIC value versus Head excursion and D chest versus Chest ACC3ms From the graphs it can be observed that 5 tests show too high head excursion results, yet no significant correlation between UNECE R44 results and the new criteria can be found. The use of the current UNECE R44 criteria (especially the kinematical ones) and the proposed new injury criteria could therefore be complementary.
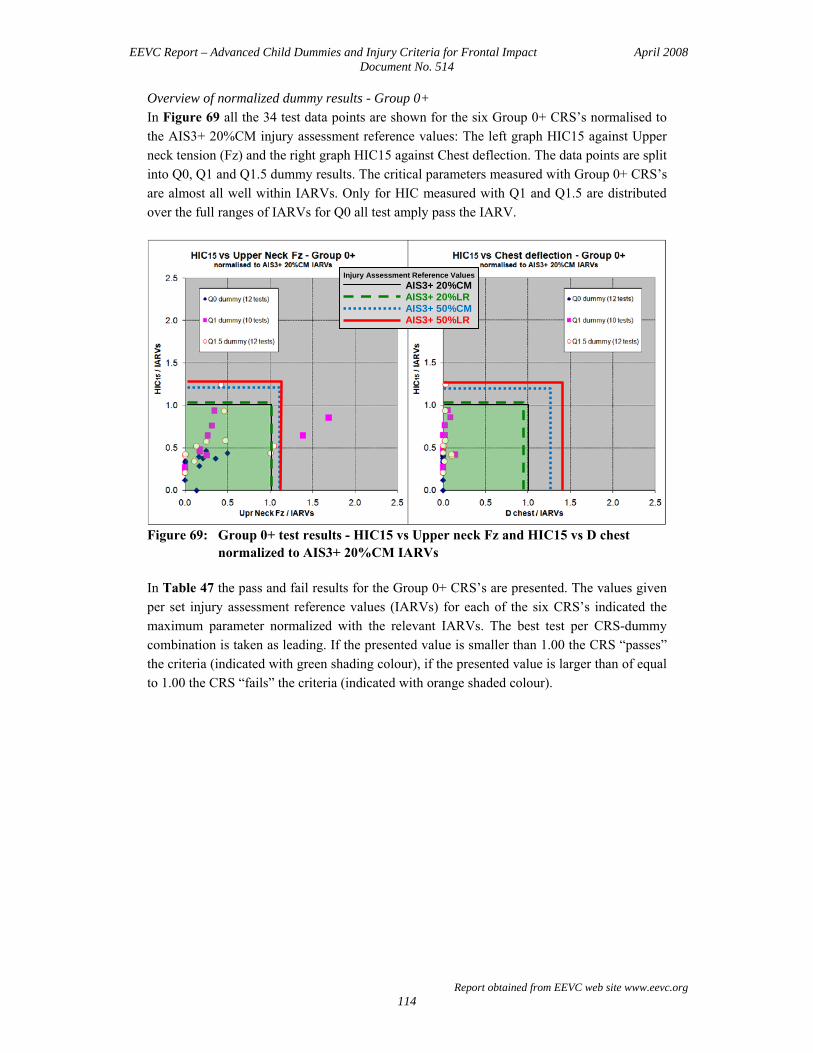
EEVC Report – Advanced Child Dummies and Injury Criteria for Frontal Impact April 2008 Document No. 514
Report obtained from EEVC web site www.eevc.org 114
Overview of normalized dummy results - Group 0+ In Figure 69 all the 34 test data points are shown for the six Group 0+ CRS’s normalised to the AIS3+ 20%CM injury assessment reference values: The left graph HIC15 against Upper neck tension (Fz) and the right graph HIC15 against Chest deflection. The data points are split into Q0, Q1 and Q1.5 dummy results. The critical parameters measured with Group 0+ CRS’s are almost all well within IARVs. Only for HIC measured with Q1 and Q1.5 are distributed over the full ranges of IARVs for Q0 all test amply pass the IARV.
Figure 69: Group 0+ test results - HIC15 vs Upper neck Fz and HIC15 vs D chest
normalized to AIS3+ 20%CM IARVs In Table 47 the pass and fail results for the Group 0+ CRS’s are presented. The values given per set injury assessment reference values (IARVs) for each of the six CRS’s indicated the maximum parameter normalized with the relevant IARVs. The best test per CRS-dummy combination is taken as leading. If the presented value is smaller than 1.00 the CRS “passes” the criteria (indicated with green shading colour), if the presented value is larger than of equal to 1.00 the CRS “fails” the criteria (indicated with orange shaded colour).
Injury Assessment Reference Values AIS3+ 20%CM AIS3+ 20%LR AIS3+ 50%CM
AIS3+ 50%LR

EEVC Report – Advanced Child Dummies and Injury Criteria for Frontal Impact April 2008 Document No. 514
Report obtained from EEVC web site www.eevc.org 115
Table 47: Group 0+ Pass and Fail results (all five parameters) Maximum Parameter/Injury Reference Value
CRS code
CRS description (see Annex H)
ECE R94 Scaled
AIS3+ 20%CM
AIS3+ 20%LR
AIS3+ 50%CM
AIS3+ 50%LR
“04” RWD ISOFIX 0.58 0.52 0.54 0.47 0.44
“01” RWD Universal 0.84 0.67 0.67 0.55 0.55
“05” Combination CRS used RWD 0.85 0.68 0.68 0.56 0.56
“03” RWD Universal 0.81 0.72 0.75 0.66 0.61
“02” RWD Universal 1.08 0.96 1.00 0.88 0.82
“06” Combination CRS used RWD - ISOFIX 1.60 1.39 1.39 1.27 1.27
In general, a high percentage of the CRS tested “passes” when the new criteria would be applied. Therefore Group 0+ rearward facing seats would provide good protection based on the new proposed injury criteria.
ANALYSIS OF GROUP I CRS’s
Within the database of 152 UNECE R44 frontal sled tests, the sample of Group I child restraint systems (CRS’s) is 62 tests. Additionally a sample of 25 tests on Group I/II/III CRS’s tested as Group I is available. This special sample of test will be reported separately in this section. Twelve different Group I CRS’s are tested with Q1 dummy (24 tests) Q1.5 dummy (14 tests) and Q3 dummy (24 tests). In general there are 2 tests available per CRS-Dummy combination. The 12 Group I CRS’s can be divided in (see Annex H):
• 7 FWD-facing universal • 1 FWD-facing ISOFIX with to tether • 2 FWD-facing ISOFIX with support leg • 1 FWD-facing ISOFIX-shield • 1 RWD-facing ISOFIX.
New Criteria versus UNECE R44 Results - Group I CRS’s In Figure 70 in the left graph the HIC15 versus maximum UNECE R44 head excursion is shown. In the right graph the Chest deflection versus the UNECE R44 Chest acceleration (3ms) is given. The HIC15 value and the chest deflection are normalized to the AIS3+ 20%CM injury reference values. The green area indicates the reference values, for UNECE R44 the values are 550 mm for head excursion and 55 g for chest acceleration 3ms.

EEVC Report – Advanced Child Dummies and Injury Criteria for Frontal Impact April 2008 Document No. 514
Report obtained from EEVC web site www.eevc.org 116
Figure 70: Group I New Q-dummy parameters versus UNECE R44 results
HIC value versus Head excursion and D chest versus Chest ACC3ms From the graphs it can be concluded that all CRS’s show compliance with UNECE R44 in the Q dummy tests. No significant correlation was seen again between UNECE R44 results and the new criteria, which means both sets could be used meaningfully side by side. Overview of normalized dummy results - Group I In Figure 71 all 66 test data points are shown for the 12 Group I CRS’s normalised to the AIS3+ 20%CM injury assessment reference values. The left graph HIC15 against Upper neck tension (Fz) and the right graph HIC15 against Chest deflection. The data points are split into Q1, Q1.5 and Q3 dummy results. It can be concluded that the results on Chest deflection are never critical in the group. The parameters HIC and Upper neck tension can be consider equally critical. (Several tests did not provide results for upper neck tension) In Table 48 the pass and fail results for the Group I CRS’s are presented. The value per injury assessment reference values (IARVs) set given for each of the 12 CRS’s indicated the maximum parameter normalized with the relevant IARVs. The best test per dummy is taken as leading. If the presented value is smaller than 1.00 the CRS “passes” the criteria (indicated with green shading colour), if the presented value is larger than of equal to 1.00 the CRS “fails” the criteria (indicated with orange shading colour).

EEVC Report – Advanced Child Dummies and Injury Criteria for Frontal Impact April 2008 Document No. 514
Report obtained from EEVC web site www.eevc.org 117
Figure 71: Group I test results - HIC15 vs Upper neck Fz and HIC15 vs D chest
normalized to AIS3+ 20%CM IARVs Table 48: Group I Pass and Fail results (all five parameters)
Maximum Parameter/Injury Reference Value CRS code
CRS description (see Annex H)
ECE R94 Scaled
AIS3+ 20%CM
AIS3+ 20%LR
AIS3+ 50%CM
AIS3+ 50%LR
“17” RWD ISOFIX 0.71 0.57 0.57 0.48 0.47
“12” FWD Universal 0.96 0.86 0.87 0.73 0.68
“15” FWD ISOFIX + support leg 1.18 1.06 1.08 0.91 0.91
“14” FWD ISOFIX + top tether 1.27 1.11 1.11 1.01 1.01
“09” FWD Universal 1.25 1.12 1.13 0.94 0.88
“19” FWD ISOFIX + shield 1.30 1.13 1.13 1.03 1.03
“08” FWD Universal 1.43 1.29 1.30 1.08 1.02
“07” FWD Universal 1.45 1.31 1.32 1.10 1.03
“11” FWD Universal 1.59 1.43 1.45 1.20 1.13
“24” FWD Universal 1.66 1.44 1.44 1.31 1.31
“16” FWD Classical (non-ISOFIX) 1.68 1.51 1.53 1.27 1.20
“13” FWD ISOFIX + top tether 1.94 1.69 1.69 1.54 1.54
A significant amount of tested seats in Group I now no longer complies with the limits. Depending on which set of IARVs are used, the limits are exceeded for HIC and Upper neck
Injury Assessment Reference Values AIS3+ 20%CM AIS3+ 20%LR AIS3+ 50%CM
AIS3+ 50%LR
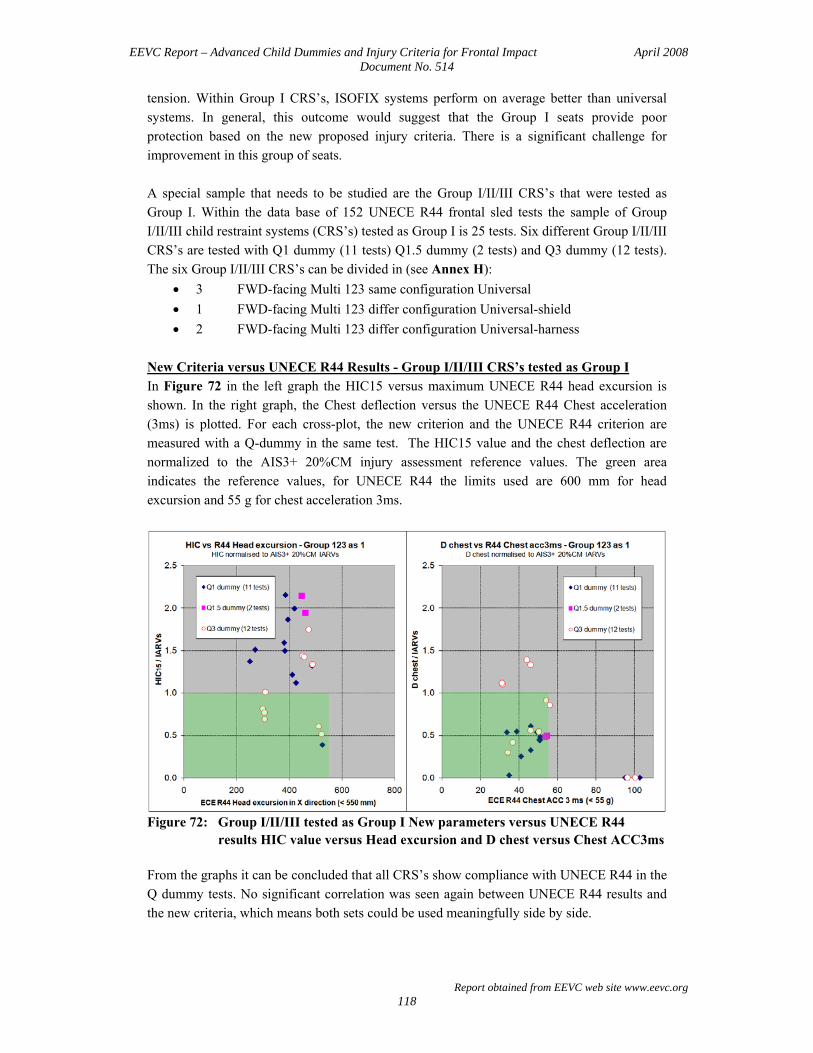
EEVC Report – Advanced Child Dummies and Injury Criteria for Frontal Impact April 2008 Document No. 514
Report obtained from EEVC web site www.eevc.org 118
tension. Within Group I CRS’s, ISOFIX systems perform on average better than universal systems. In general, this outcome would suggest that the Group I seats provide poor protection based on the new proposed injury criteria. There is a significant challenge for improvement in this group of seats. A special sample that needs to be studied are the Group I/II/III CRS’s that were tested as Group I. Within the data base of 152 UNECE R44 frontal sled tests the sample of Group I/II/III child restraint systems (CRS’s) tested as Group I is 25 tests. Six different Group I/II/III CRS’s are tested with Q1 dummy (11 tests) Q1.5 dummy (2 tests) and Q3 dummy (12 tests). The six Group I/II/III CRS’s can be divided in (see Annex H):
• 3 FWD-facing Multi 123 same configuration Universal • 1 FWD-facing Multi 123 differ configuration Universal-shield • 2 FWD-facing Multi 123 differ configuration Universal-harness
New Criteria versus UNECE R44 Results - Group I/II/III CRS’s tested as Group I In Figure 72 in the left graph the HIC15 versus maximum UNECE R44 head excursion is shown. In the right graph, the Chest deflection versus the UNECE R44 Chest acceleration (3ms) is plotted. For each cross-plot, the new criterion and the UNECE R44 criterion are measured with a Q-dummy in the same test. The HIC15 value and the chest deflection are normalized to the AIS3+ 20%CM injury assessment reference values. The green area indicates the reference values, for UNECE R44 the limits used are 600 mm for head excursion and 55 g for chest acceleration 3ms.
Figure 72: Group I/II/III tested as Group I New parameters versus UNECE R44
results HIC value versus Head excursion and D chest versus Chest ACC3ms From the graphs it can be concluded that all CRS’s show compliance with UNECE R44 in the Q dummy tests. No significant correlation was seen again between UNECE R44 results and the new criteria, which means both sets could be used meaningfully side by side.

EEVC Report – Advanced Child Dummies and Injury Criteria for Frontal Impact April 2008 Document No. 514
Report obtained from EEVC web site www.eevc.org 119
Overview of normalized dummy results - Group I II/III CRS’s tested as Group I In Figure 73 all 25 test data points are shown for the 6 Group I/II/III CRS’s tested as Group I normalised to the AIS3+ 20%CM injury assessment reference values. The left graph HIC15 against Upper neck tension (Fz) and the right graph HIC15 against Chest deflection. The data points are split into Q1, Q1.5 and Q3 dummy results.
Figure 73: Group I/II/III tested as Group I test results - HIC15 vs Upper neck Fz and
HIC15 vs D chest normalized to AIS3+ 20%CM IARVs In Table 49 the pass and fail results for the Group I/II/III CRS’s tested as Group I are presented. As with the standard Group I seats, the performance against the new injury criteria is generally poor. Failures are shown on HIC and/or Upper neck tension and/or Q3 Chest deflection. However, it can be concluded that Group I/II/III CRS’s that have a different configuration for Group I, II and III application showed a better performance than those that do not adapt the configuration to the age group. In general there would be a significant challenge for improvement for the Group I/II/III seats.
Injury Assessment Reference Values AIS3+ 20%CM AIS3+ 20%LR AIS3+ 50%CM
AIS3+ 50%LR

EEVC Report – Advanced Child Dummies and Injury Criteria for Frontal Impact April 2008 Document No. 514
Report obtained from EEVC web site www.eevc.org 120
Table 49: Group I/II/III (tested as Group I) Pass and Fail results (all five parameters) Maximum Parameter/Injury Reference Value
CRS code
CRS description (see Annex H)
ECE R94 Scaled
AIS3+ 20%CM
AIS3+ 20%LR
AIS3+ 50%CM
AIS3+ 50%LR
“27” Multi 123 differ config. Universal - shield 0.90 1.10 1.16 0.87 0.79
“31” Multi 123 differ config. Universal - harness 1.25 1.12 1.14 0.94 0.89
“29” Multi 123 differ config. Universal - harness 1.47 1.32 1.34 1.11 1.04
“26”* Multi 123 same config. Universal 1.77 1.59 1.61 1.34 1.26
“10”* Multi 123 same config. Universal 1.97 1.71 2.03 1.56 1.56
“25”* Multi 123 same config. Universal 2.22 2.00 2.02 1.68 1.58
Note: The CRS’s marked with * are also tested as Group II (see Table 50)
ANALYSIS OF GROUP II CRS’s
The last group of interest are the Group I/II/III or II/III CRS’s tested as Group II. Within the database of 152 UNECE R44 frontal sled tests, the sample of child restraint systems (CRS’s) tested as Group II is 37 tests. Nine different Group I/II/III or II/III CRS’s are tested with Q3 dummy (18 tests) and Q6 dummy (19 tests). The 9 Group I/II/III or II/III CRS’s can be divided in (see Annex H):
• 4 Booster + Back (universal) • 3 Multi 123 same configuration (universal) • 2 Multi 123 different configuration (universal – harness)
New Criteria versus UNECE R44 Results - Group I/II/III and II/III tested as Group II In Figure 74 in the left graph, again the HIC15 versus maximum UNECE R44 head excursion is shown. The green area indicates the reference values, for UNECE R44 the values are 600 mm for head excursion and 55 g for chest acceleration 3ms. All CRS’s show compliance with UNECE R44 in the Q dummy tests. Also in this case, no significant correlation was found between UNECE R44 results and the new parameters.
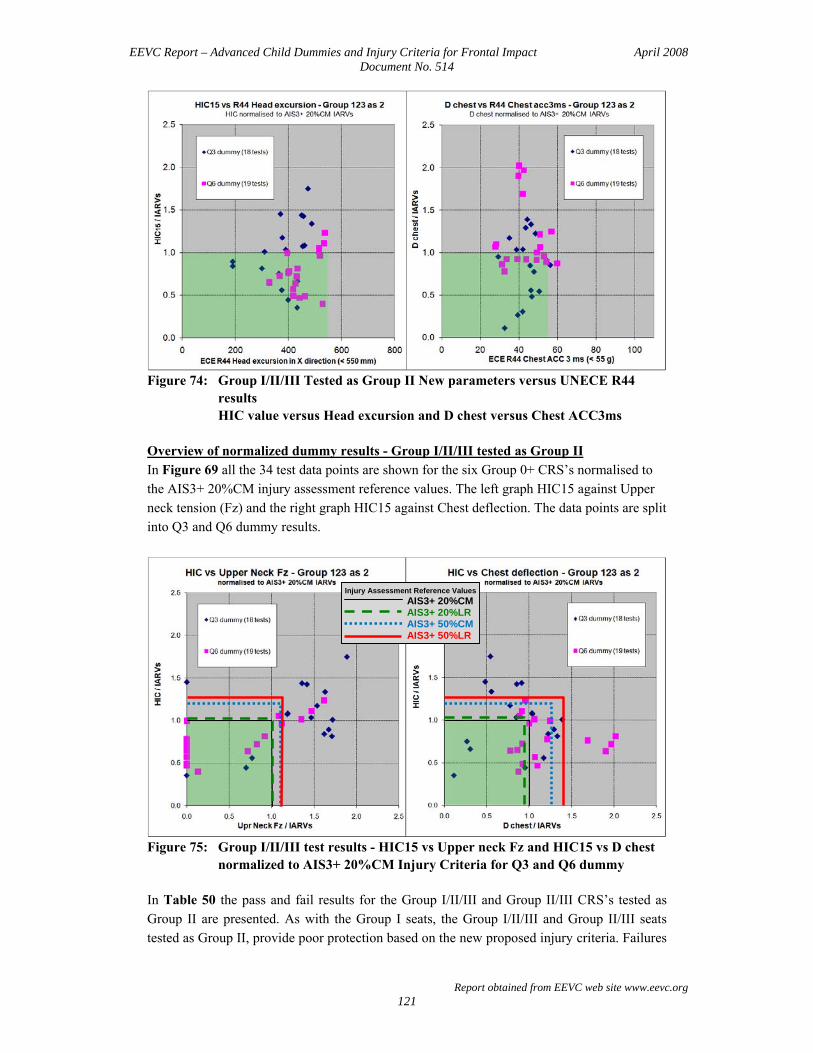
EEVC Report – Advanced Child Dummies and Injury Criteria for Frontal Impact April 2008 Document No. 514
Report obtained from EEVC web site www.eevc.org 121
Figure 74: Group I/II/III Tested as Group II New parameters versus UNECE R44
results HIC value versus Head excursion and D chest versus Chest ACC3ms
Overview of normalized dummy results - Group I/II/III tested as Group II In Figure 69 all the 34 test data points are shown for the six Group 0+ CRS’s normalised to the AIS3+ 20%CM injury assessment reference values. The left graph HIC15 against Upper neck tension (Fz) and the right graph HIC15 against Chest deflection. The data points are split into Q3 and Q6 dummy results.
Figure 75: Group I/II/III test results - HIC15 vs Upper neck Fz and HIC15 vs D chest
normalized to AIS3+ 20%CM Injury Criteria for Q3 and Q6 dummy In Table 50 the pass and fail results for the Group I/II/III and Group II/III CRS’s tested as Group II are presented. As with the Group I seats, the Group I/II/III and Group II/III seats tested as Group II, provide poor protection based on the new proposed injury criteria. Failures
Injury Assessment Reference Values AIS3+ 20%CM AIS3+ 20%LR AIS3+ 50%CM
AIS3+ 50%LR

EEVC Report – Advanced Child Dummies and Injury Criteria for Frontal Impact April 2008 Document No. 514
Report obtained from EEVC web site www.eevc.org 122
mainly shown on Q3 and Q6 dummy Upper neck tension and HIC and some on Q6 chest deflection. Within this group of CRS’s the Booster + Back Universal systems perform on average better than the Group I/II/III systems. In general, this outcome would suggest that the Group II seats provide poor protection based on the new proposed injury criteria. There would a significant challenge for improved performance in this group. Table 50: Group I/II/III tested as Group II P ass and Fail results (all five parameters)
Maximum Parameter/Injury Reference Value CRS code
CRS description (see Annex H)
ECE R94 Scaled
AIS3+ 20%CM
AIS3+ 20%LR
AIS3+ 50%CM
AIS3+ 50%LR
“23” Booster + Back Universal 0.81 0.95 1.01 0.76 0.68
“30” Multi 123 differ config. Universal - harness 1.17 1.05 1.09 0.96 0.89
“20” Booster + Back Universal 1.37 1.19 1.19 1.08 1.08
“21” Booster + Back Universal 1.11 1.24 1.28 0.99 0.88
“26”* Multi 123 same config. Universal 1.70 1.47 1.47 1.34 1.34
“22” Booster + Back Universal 1.87 1.62 1.62 1.48 1.48
“25”* Multi 123 same config. Universal 1.88 1.63 1.63 1.49 1.49
“10”* Multi 123 same config. Universal 1.97 1.71 1.71 1.56 1.56
“32” Multi 123 differ config. Universal - harness 1.69 1.90 2.01 1.51 1.35
Note: The CRS’s marked with * are also tested as Group I (see Table 49)