Python for Scientific Computing -...
28
Python for Scientific Computing Jussi Enkovaara October 2016 Scientific computing in practice Aalto University
-
Upload
truongdieu -
Category
Documents
-
view
219 -
download
1
Transcript of Python for Scientific Computing -...

Python for Scientific Computing
Jussi Enkovaara
October 2016Scientific computing in practiceAalto University

All material (C) 2011-2016 by CSC – IT Center for Science Ltd.This work is licensed under a Creative Commons Attribution-ShareAlike 4.0 Unported License, http://creativecommons.org/licenses/by-sa/4.0

Agenda
Tue 11.10. Thu 13.10 Tue 18.10
NumPy – fast arrayinterface for Python
Visualization withPython
Scipy – scientifictools for Python
Speeding upPython programs
Working knowledge of Python assumed

PERFORMANCE MEASUREMENT

Measuring application performance
Correctness is the most import factor in any application
– Premature optimization is the root of all evil!
Before starting to optimize application, one should measure where time is spent
– Typically 90 % of time is spent in 10 % of application
Applications own timers
timeit module
cProfile module
Full fedged profiling tools: TAU, Intel Vtune, …

Measuring application performance
Python time module can be used for measuring timespent in specific part of the program
– time.time(), time.clock(),
– In Python 3: time.perf_counter(), time.process_time()
import time
t0 = time.time()for n in range(niter):
heavy_calculation()t1 = time.time()
Print(‘Time spent in heavy calculation’, t1-t0)
timing.py

timeit module
Easy timing of small bits of Python code
Tries to avoid common pitfalls in measuring executiontimes
Command line interface and Python interface
%timeit magic in IPython
In [1]: from mymodule import funcIn [2]: %timeit func()10 loops, best of 3: 433 msec per loop
$ python –m timeit –s “from mymodule import func” “func()”10 loops, best of 3: 433 msec per loop

cProfile
Execution profile of Python program
– Time spent in different parts of the program
– Call graphs
Python API:
Profiling whole program from command line
import cProfile…# profile statement and save results to a file func.profcProfile.run(‘func()’, ‘func.prof’)
profile.py
$ python –m cProfile –o myprof.prof myprogram.py

Investigating profile with pstats
Printing execution time of selected functions
Sorting by function name, time, cumulative time, …
Python module interface and interactive browser
In [1]: from pstats import StatsIn [2]: p = Stats(‘myprof.prof’)In [3]: p.strip_dirs()In [4]: p.sort_stats(‘time’)In [5]: p.print_stats(5)Mon Oct 12 10:11:00 2016 my.prof…
$ python –m pstats myprof.profWelcome to the profile statistics% strip% sort time% stats 5Mon Oct 12 10:11:00 2016 my.prof…

Summary
Python has various built-in tools for measuring application performance
time module
timeit module
cProfile and pstats modules

CYTHON

Cython
Optimising static compiler for Python
Extended Cython programming language
Tune readable Python code into plain C performance by adding static type declarations
Easy interfacing to external C libraries

Python overheads
Interpreting
”Boxing ”- everything is an object
Function call overhead
Global interpreter lock – no threading benefits (CPython)

Interpreting
Cython command generates a C /C++ source file from a Cython source file
C/C++ source is then compiled into an extension module
Interpreting overhead is normally not drastic
from distutils.core import setupfrom Cython.Build import cythonize
# Normally, one compiles cython extended code with .pyx endingsetup(ext_modules=cythonize(“mandel_cyt.py”), )
setup.py
$ python setup.py build_ext --inplace
In [1]: import mandel_cyt

Case study: Mandelbrot fractal
Pure Python: 2.71 s
Compiled with Cython: 2.61 s
def kernel(zr, zi, cr, ci, lim, cutoff):
count = 0while ((zr*zr + zi*zi) < (lim*lim)) \
and count < cutoff:zr = zr * zr - zi * zi + crzi = zr * zr - zi * zi + crcount += 1
return count
mandel.py

”Boxing”
In Python, everything is an object
Object
int 7
otherstuff…
Integer
Object
int 6
otherstuff…
Integer
7 + 6
+
Check the types:
integers
int 7 int 6
=
+
int 13
Object
int 13
otherstuff…
Integer

Static type declarations
Cython extended code should have .pyx ending
– Cannot be run with normal Python
Types are declared with cdef keyword
– In function signatures only type is given
def integrate(f, a, b, N):s = 0dx = (b-a)/Nfor i in range(N):
s += f(a+i*dx)return s * dx
example.py
def integrate(f, double a, double b, int N):
cdef double s = 0cdef int icdef double dx = (b-a)/Nfor i in range(N):
s += f(a+i*dx)return s * dx
example.pyx

Static type declarations
Pure Python: 2.71 s
Type declarations in kernel: 20.2 ms

Function call overhead
Function calls in Python can involve lots of checkingand ”boxing”
Overhead can be reduced by declaring functions to be C-functions
– cdef keyword: functions can be called only fromCython
– cpdef keyword: generate also Python wrapper (canhave additional overhead in some cases)

Using C functions
Static type declarations: 20.2 ms
Kernel as C function: 12.5 ms
cdef int kernel(double zr, double zi, …):
cdef int count = 0while ((zr*zr + zi*zi) < (lim*lim)) \
and count < cutoff:zr = zr * zr - zi * zi + crzi = zr * zr - zi * zi + crcount += 1
return count
mandel.py

NumPy arrays with Cython
Cython supports fast indexing for NumPy arrays
Type and dimensions of array have to be declared
import numpy as np # Normal NumPy importcimport numpy as cnp # Import for NumPY C-API
def func(): # declarations can be made only in function scopecdef cnp.ndarray[cnp.int_t, ndim=2] datadata = np.empty((N, N), dtype=int)
…for i in range(N):
for j in range(N):data[i,j] = … # double loop is done in nearly C speed
numpy_example.py
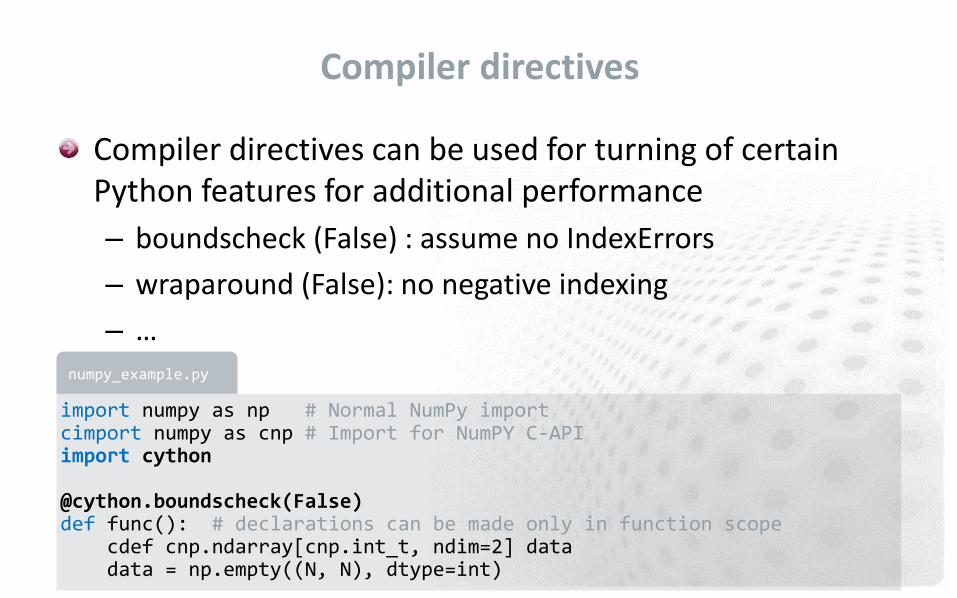
Compiler directives
Compiler directives can be used for turning of certainPython features for additional performance
– boundscheck (False) : assume no IndexErrors
– wraparound (False): no negative indexing
– …
import numpy as np # Normal NumPy importcimport numpy as cnp # Import for NumPY C-APIimport cython
@cython.boundscheck(False)def func(): # declarations can be made only in function scope
cdef cnp.ndarray[cnp.int_t, ndim=2] datadata = np.empty((N, N), dtype=int)
numpy_example.py

Final performance
Pure Python: 2.7 s
Static type declarations: 20.2 ms
Kernel as C function: 12.5 ms
Fast indexing and directives: 2.4 ms

Where to add types?
Typing everything reduces readibility and can even slowdown the performance
Profiling should be first step when optimising
Cython is able to provide annotated HTML-report
Lines are colored according to the level of “typedness”
– white lines translate to pure C
– lines that require the Python C-API are yellow (darker as they translate to more C-API interaction)
$cython –a cython_module.pyx$firefox cython_module.html

HTML-report

Profiling Cython code
By default, Cython code does not show up in profileproduced by cProfile
Profiling can be enabled for entire source file or on per function basis
# cython: profile=True
import cython…@cython.profile(False) cdef func():
…
profiling.py
# cython: profile=False
import cython…@cython.profile(True) cdef func():
…
profiling.py

Summary
Cython is optimising static compiler for Python
Possible to add type declarations with Cython language
Fast indexing for NumPy arrays
At best cases, huge speed ups can be obtained
– Some compromise for Python flexibility

Further functionality in Cython
Using C structs and C++ classes in Cython
Exceptions handling
Interfacing external libraries
Parallelisation (threading) with Cython
…


![optimizing And Interfacing With Cython - [groupe Calcul]calcul.math.cnrs.fr/Documents/Ecoles/2010/cours_cython.pdf · Optimizing and interfacing with Cython ... Cython: a fork of](https://static.fdocuments.in/doc/165x107/5ae615517f8b9a8b2b8cc93e/optimizing-and-interfacing-with-cython-groupe-calcul-and-interfacing-with-cython.jpg)