Slides from INF3331 lectures - basic GUI programming in Python

Laboratoire Interdisciplinaire sur l’Organisation Nanométrique et Supramoléculaire
DIRECTION DES SCIENCES DE LA MATIERE
IRAMIS
PySaxs A Python module and GUI for
SAXS data treatment Olivier Taché
Collaborative work with :
O. Spalla, A. Thill, D. Sen, D. Carrière, F. Testard

Olivier Taché / 22 novembre 2011
Outline
2
Context :
CEA-LIONS
Small Angle X-Rays Scattering
SAXS at LIONS
SAXS data treatment
Python
What is pySAXS ?
User Interface : GuiSAXS
plots
data treatment
fitting by models

Olivier Taché / 22 novembre 2011
SAXS at LIONS : 3 experimentals setups
3
SAXS
q range : 2x10⁻² to 7x10⁻¹ A-1
=0.154 nm
E=8 keV
2D detector
SAXS – WAXS (wide angles)
q range : 4x10⁻² to 4 A-1
=0.07 nm
E=17 keV
2D detector
USAXS ultra small angles
q range : 2x10⁻⁴ to 10-1 A-1
=0.154 nm
E=8keV
1D detector
10-4 10-3 10-2 10-1 10-0
USAXS
SAXS
WAXS
q (Å-1)

Olivier Taché / 22 novembre 2011
SAXS Data treatment : what we have to do
4
1- for Images : data reduction Using ImageJ (Java !) a software that manage images (with ROI, LUT)
With geometrical corrections
1- for USAXS (1D) : deconvolution (beam is not perfect) With specific code
2- scaling in absolute intensities (taking in acount experimental parameters) Very important if we want to compare datas from others experiments (synchrotron)
We can calculate Form factor and Structure Factor
3- merging datas and substract background or solvant (ie water) Merging datas with different scales (qrange or dq)
4- compare with predefined models minimization for finding sample parameters
Home made models
or with source code we can check…
5- non automatic data processing for calculating form factor,
structure,…
With source code optimized and tested
Home made software PySAXS
Olivier Taché / 22 novembre 2011
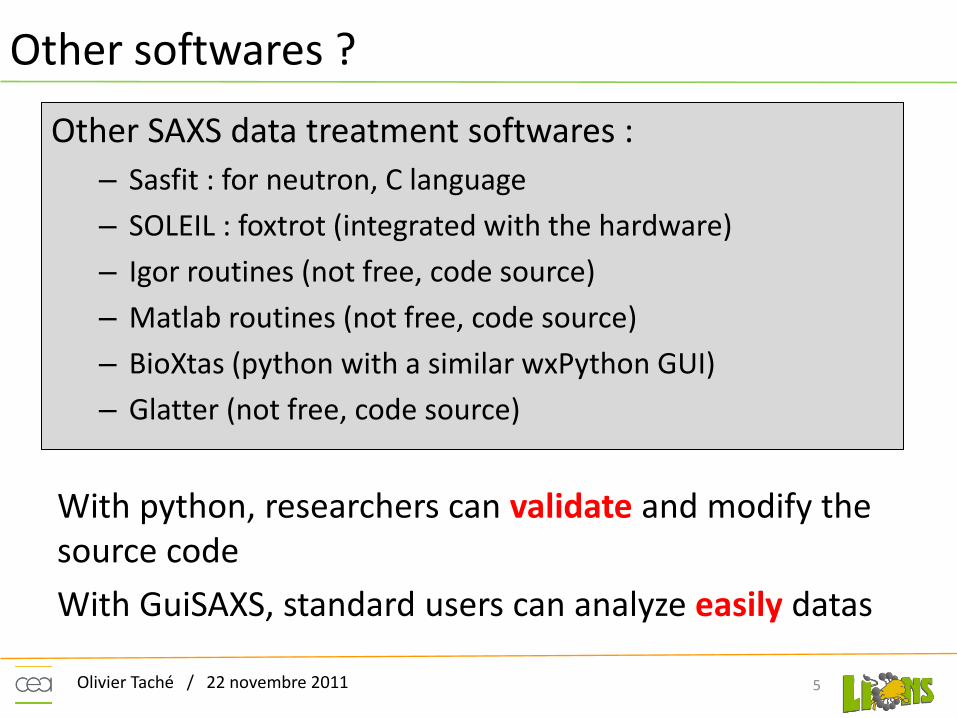
Other softwares ?
Other SAXS data treatment softwares :
– Sasfit : for neutron, C language
– SOLEIL : foxtrot (integrated with the hardware)
– Igor routines (not free, code source)
– Matlab routines (not free, code source)
– BioXtas (python with a similar wxPython GUI)
– Glatter (not free, code source)
With python, researchers can validate and modify the source code
With GuiSAXS, standard users can analyze easily datas
5

Olivier Taché / 22 novembre 2011
Python ?
6
• Langage de programmation « simple » qui permet de se concentrer sur l’application scientifique et pas la syntaxe
• Python a été conçu pour être un langage lisible. Il vise à être visuellement épuré. L’indentation est obligatoire.
• Orienté Objet, donc évolué
• modulaire, donc évolutif
• Utilisation dans de nombreux contextes
• Interface avec d’autres langages (Fortran, C,…)
• Portable (utilisable sous unix, mac, windows,…)
• Interfaçage avec de nombreuses librairies graphiques
• Nombreuses librairies scientifiques
• Open Source et gratuit
• Utilisation en ligne de commande, ou en « programme »

Olivier Taché / 22 novembre 2011
Utilisation de Python
7
1- Interpréteur Python
3- Exécution « directe » (dos, linux)
2- Exécution dans l’interpréteur
Python.exe monprogramme.py

Olivier Taché / 22 novembre 2011
Python scientifique: Les tracés avec Matplot
8
import pylab
from numpy import *
x=arange(-1.0,1,0.1)
y=x*x
fig=pylab.figure()
axes=fig.gca()
axes.plot(x, y, linewidth=1.0)
fig.show()
retrouver un environnement de
développement interactif similaire à
ceux de MATLAB ou IDL
Python
Numpy
Scipy
Gnuplot Matplotlib

Olivier Taché / 22 novembre 2011
Python scientifique :Distribution Python(x,y)
Python(x,y) est une distribution Python à l'usage des scientifiques Cinq fonctionnalités principales:
1. rassembler des bibliothèques Python et des environnements de
développement complets adaptés à un usage scientifique 2. rassembler presque toute la documentation gratuite disponible sur ces
librairies et outils ; 3. proposer un guide de démarrage en Python / Eclipse / Qt ; 4. configurer Eclipse pour qu'il soit prêt pour développer en Python, et
modifier quelques paramètres Windows (tels que les associations de fichier, l'intégration dans l'explorateur Windows, etc.) ;
5. proposer un installeur tout-en-un, afin que l'utilisateur puisse installer ou désinstaller ces outils et fonctionnalités en un seul clic de souris.
9
Pierre Raybaut (CEA / DAM)

Olivier Taché / 22 novembre 2011
Installation python xy
10

Olivier Taché / 22 novembre 2011
Installation pySAXS
• A partir du fichier zip (windows ou linux): – Décompresser le fichier zip
– Lancer une fenêtre dos :
• Dans windows 7 : executer , taper cmd
• Aller dans le dossier de décompression
– Taper Python setup.py install
• Installeur Windows
Le raccourci est dans C:\Python26\Lib\site-packages\pySAXS
startGUISAXS
11

Olivier Taché / 22 novembre 2011
Arborescence de pySAXS
12
Divers documents
Interface graphique
Cœur de pySAXS, notamment Lsca.py
Modèles
Données
Outils
Lanceur rapide de GuiSAXS

Olivier Taché / 22 novembre 2011
What is PySaxs ?
13
LS (LIONS Saxs) : A special effort for a compilation of useful functions in Python
calculating different form factors or structure factors :
Gives intensities (q range, parameters)
For absolute intensities (scaling) processing
Can be used by researcher ‘own’ routines
Olivier Taché / 22 novembre 2011
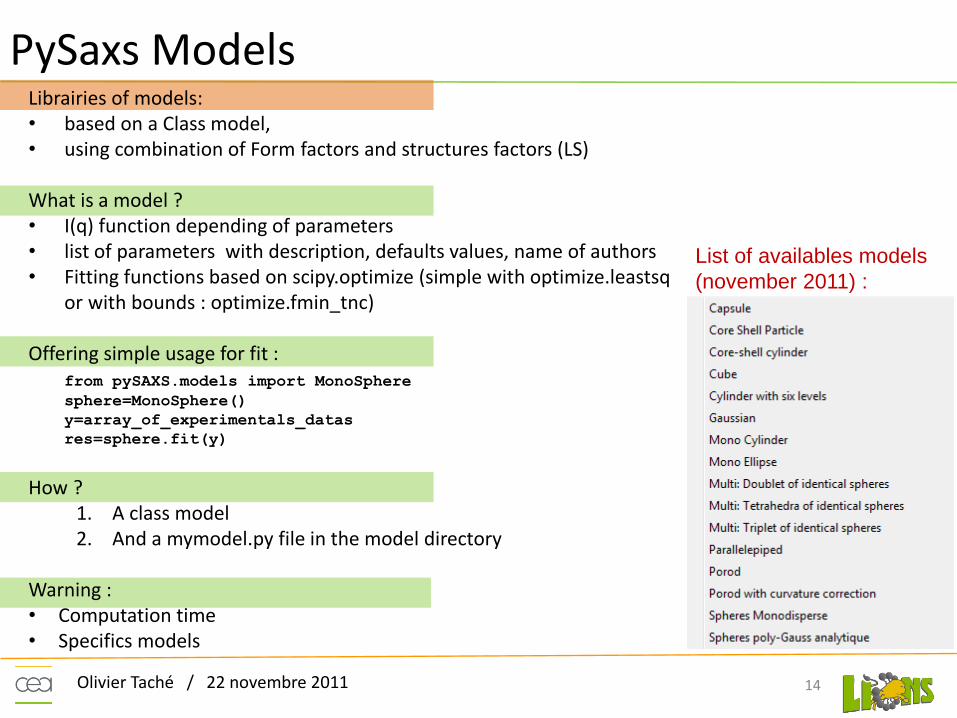
PySaxs Models
14
Librairies of models: • based on a Class model, • using combination of Form factors and structures factors (LS) What is a model ? • I(q) function depending of parameters • list of parameters with description, defaults values, name of authors • Fitting functions based on scipy.optimize (simple with optimize.leastsq
or with bounds : optimize.fmin_tnc) Offering simple usage for fit : from pySAXS.models import MonoSphere
sphere=MonoSphere()
y=array_of_experimentals_datas
res=sphere.fit(y)
How ?
1. A class model 2. And a mymodel.py file in the model directory
Warning : • Computation time • Specifics models
List of availables models
(november 2011) :

Olivier Taché / 22 novembre 2011
Models
15

Olivier Taché / 22 novembre 2011
PySAXS Graphic User interface
16
A graphic user interface : GuiSAXS no satisfaisant interface for data treatment and data manipulation
• import data from experiments (text file) • scaling • compare • substraction or manipulation datas with different scales • correct plotting tool (log scale) • gnuplot and matplotlib • modeling
• informations about data treatment
Using wxPython : Not a real choice Works on windows and linux No IDE : all the code is made by « hand » as much as possible : generic dialog boxes

Olivier Taché / 22 novembre 2011
GuiSAXS
17
List of datas
We can choose wich
datas are plotted
Plots with matplotlib
Informations about data treatment

Olivier Taché / 22 novembre 2011
GuiSAXS
18
A matplotlib frame with a menu
where you can :
• Add a grid
• Change legend and title
• Set the line format
• Set the axes scales
• Save as picture
• Colors are automatics,
it is not possible to change them
Can be improved
OR you can use gnuplot windows
Olivier Taché / 22 novembre 2011
GuiSAXS : data manipulation
19
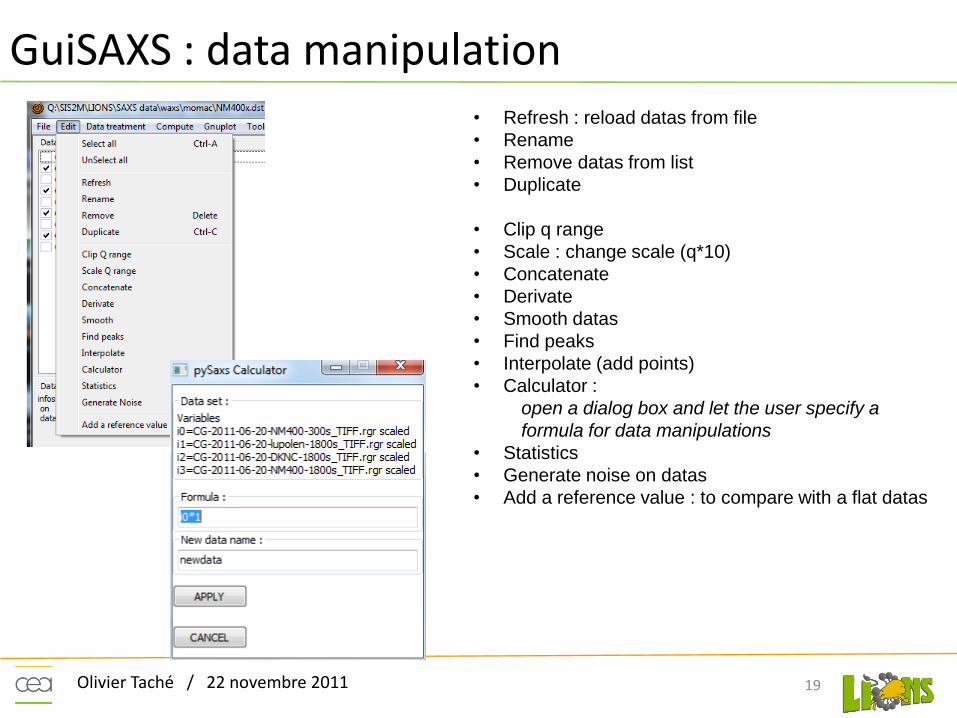
• Refresh : reload datas from file
• Rename
• Remove datas from list
• Duplicate
• Clip q range
• Scale : change scale (q*10)
• Concatenate
• Derivate
• Smooth datas
• Find peaks
• Interpolate (add points)
• Calculator :
open a dialog box and let the user specify a
formula for data manipulations
• Statistics
• Generate noise on datas
• Add a reference value : to compare with a flat datas

Olivier Taché / 22 novembre 2011
GuiSAXS : data scaling
20
edt
CqI
ij 1.
1.
.)(
0
Cij is the number of counts detected on pixel ij during dt with
background substracted
0. is the transmitted flux (photons/s) by the sample
0= incident .T.K
T is the transmission of the sample
K is the detector quantum efficiency
K= 12
1, is the detector quantum efficiency for the counts Cij
2, is the detector quantum efficiency when measuring the
incident beam.
is the solid angle covered by one pixel seen from the center of
the sample.
=𝑝2
𝐷2
p is the pixel size and D the sample to detector distance
• e is the thickness of the sample (cm)
Intensity=(n-background)/(time * DeltaOmega * Transmission *
Thickness * Flux * K)
Absolute intensities are independant from experiment

Olivier Taché / 22 novembre 2011
Data substraction
21
Data for 1mm and 2 mm
thickness of water
Substraction
(gives 1mm of water)
Reference (calculated value)
Data processing is done
by using interpolation of datas
With propagation of
measurement’s errors
How could we do that in excel ?

Olivier Taché / 22 novembre 2011
Fitting with models
22
Models integrated automatically in the menu

Olivier Taché / 22 novembre 2011
Fitting with models
23
Parameters are updated

Olivier Taché / 22 novembre 2011
Other functionalities :
• Datas saved as txt
• Datas saved by group (dataset) in xml file
• Keeping measurements error bar
• X-Ray contrasts dialog box : for calcutating transmission of sample depending on composition and x-ray energy
• PySAXS is given to users
• Easy Installation on Windows with PythonXY
24

Olivier Taché / 22 novembre 2011
Improvements
• Basic models
• Identify specific models
• Xml format for dataset (list of datas) :
– Keep definition of parameters
– Linux and windows compatible
– Linux distribution
25