Pyrolytic Behavior of Green Macro Algae and …ijcea.org/papers/196-A028.pdfPyrolytic Behavior of...
8
Abstract—In this research work, the pyrolytic and kinetic characteristics of a green macro algae, Codium Fragile (C. Fragile) as a model for marine biomass was studied using thermogravimetric analysis (TGA) method in the range of 313 K to 973 K at atmospheric pressure. Proximate analysis of the freeze dried macro algae showed 6.5% water content, 58% degradable products, 10.5% char, and 25% ash content. The influences of particle size, initial weight of the sample, and heating rate on decomposition of the algae have been investigated. Both particle size and initial weight of the sample do not have a significant effect on the TG profile of the algae pyrolysis. In addition, the TGA and DTG (differential thermogravimetric) curves of algae differed significantly for variation in heating rates. The DTG results showed that there are three zones to the pyrolysis; and mainly second zone was significantly affected with heating rates. The non-isothermic integral isoconventional methods were used to obtain the kinetic parameters from data of the pyrolysis reactions of C. Fragile in the second zone. The corresponding activation energies of pyrolysis and decomposition stage of C. Fragile were calculated based on the weight loos data obtained from DTG data using the most popular methods (Flynn-Wall-Ozawa (FWO), Kissinger-Akahira-Sunose (KAS), Fredman, and Coast-Redfren methods). Index Terms—Codium Fragile, Green Algae, Kinetic, Marine Biomass, Pyrolysis, Thermogravimetric Analysis I. INTRODUCTION The focus on the use of biomass as an alternative feedstock to fossil fuels is intensifying due to its role in reducing CO 2 emissions. Currently many technologies are under investigation for utilization of biomass both for power generation and for production of bio-oil for transportation and chemical commodities [1]. As a consequence there is interest in alternative biomass resources including biomass from an aquatic environment. Marine macroalgae is one such source of aquatic biomass and potentially represents a significant source of renewable energy in coming years. The average photosynthetic efficiency of aquatic biomass is 6–8% [2] which is much higher than terrestrial biomass ones (1.8–2.2%). Manuscript received July 25, 2012; revised August 26, 2012. This work was supported in part by the Japan Society for the Promotion of Science (JSPS) under Scientific Research Grant (A) 22246110. In addition, Somayeh Daneshvar gratefully acknowledges the JGC-S (Nikki Saneyoshi) Foundation for a scholarship award. S. Daneshvar and K. Otsuka are with the Department of Marine System Engineering, Osaka Prefecture University, Osaka, JAPAN (e-mail: [email protected], [email protected]) F. Salak was with Department of Chemical and Petroleum Engineering, University of Calgary, Calgary, AB, CANADA (f.salak @yahoo.com). Marine biomass and particularly algae is one of the most widely plant in the world, have variety of industrial applications. They have been reported to contain more than 2400 natural products of commercial importance in pharmaceutical, biomedical, and nutraceutical industries [3]. Those are the main resource materials for phytocolloids such as agar, carrageenan (derived from Rhodophyta) and alginates (derived from Phaeophyta) [4], [5]. The residues from their processing also represent as a feedstock to make renewable fuels. In fact, there is a great potential for production of bio-chemicals and energy from marine biomass [6]. The methods of conversion into various forms of energy are through several different conversions reactions (chemical, biological, and thermochemical reaction). Among them less attention has been devoted to thermochemical conversions. The different thermochemical options for macroalgae utilization include direct combustion, gasification, pyrolysis and liquefaction. Pyrolysis as one of the industrially sound process among the thermochemical conversion has been commonly used to convert the different kinds of biomass into bio-oil and bio-char [7]. One of the advanced characterization technique of pyrolysis is thermogravimetric analysis (TGA). TGA is a thermal analysis technique which measures the amount and rate of change in the weight of a material as a function of temperature or time in a controlled atmosphere. The TGA is used not only for study decomposition kinetics of organic and inorganic compounds, but also widely used for the study of composition of multicomponent systems, oxidative stability of materials, estimated lifetime of a products, the effect of reactive or corrosive atmospheres on materials, moisture and volatiles content of materials [8], [9]. Traditionally, non-isothermal and constant heating rate TGA have been used to obtain kinetic information with the constant heating rate method developed by Flynn and Wall [10] being preferred because it requires less experimental time. The present study has determined the pyrolysis behavior of C. Fragile which selected as model for green macroalgae. This green macroalgae is widely distributed along the shores of East Asia, Oceania, and Northern Europe. In Japan, C. Fragile is very familiar seaweed and has been used as a food since ancient times. In addition, its use has been recorded as a treatment for dropsy and dysuria [11], antiangiogenic effect in the prevention of cancer [12] and it shows antiviral activity [13]. We used TGA and DTG techniques in order to evaluate the kinetics of pyrolysis of C. Fragile. In addition value of the activation energies were also estimated in various Pyrolytic Behavior of Green Macro Algae and Evaluation of Its Activation Energy S. Daneshvar, \ F. Salak, and K. Otsuka International Journal of Chemical Engineering and Applications, Vol. 3, No. 4, August 2012 256 DOI: 10.7763/IJCEA.2012.V3.196
Transcript of Pyrolytic Behavior of Green Macro Algae and …ijcea.org/papers/196-A028.pdfPyrolytic Behavior of...

Abstract—In this research work, the pyrolytic and kinetic
characteristics of a green macro algae, Codium Fragile (C.
Fragile) as a model for marine biomass was studied using
thermogravimetric analysis (TGA) method in the range of 313
K to 973 K at atmospheric pressure. Proximate analysis of the
freeze dried macro algae showed 6.5% water content, 58%
degradable products, 10.5% char, and 25% ash content.
The influences of particle size, initial weight of the sample,
and heating rate on decomposition of the algae have been
investigated. Both particle size and initial weight of the sample
do not have a significant effect on the TG profile of the algae
pyrolysis. In addition, the TGA and DTG (differential
thermogravimetric) curves of algae differed significantly for
variation in heating rates. The DTG results showed that there
are three zones to the pyrolysis; and mainly second zone was
significantly affected with heating rates.
The non-isothermic integral isoconventional methods were
used to obtain the kinetic parameters from data of the pyrolysis
reactions of C. Fragile in the second zone. The corresponding
activation energies of pyrolysis and decomposition stage of C.
Fragile were calculated based on the weight loos data obtained
from DTG data using the most popular methods
(Flynn-Wall-Ozawa (FWO), Kissinger-Akahira-Sunose (KAS),
Fredman, and Coast-Redfren methods).
Index Terms—Codium Fragile, Green Algae, Kinetic, Marine
Biomass, Pyrolysis, Thermogravimetric Analysis
I. INTRODUCTION
The focus on the use of biomass as an alternative feedstock
to fossil fuels is intensifying due to its role in reducing CO2
emissions. Currently many technologies are under
investigation for utilization of biomass both for power
generation and for production of bio-oil for transportation
and chemical commodities [1].
As a consequence there is interest in alternative biomass
resources including biomass from an aquatic environment.
Marine macroalgae is one such source of aquatic biomass and
potentially represents a significant source of renewable
energy in coming years. The average photosynthetic
efficiency of aquatic biomass is 6–8% [2] which is much
higher than terrestrial biomass ones (1.8–2.2%).
Manuscript received July 25, 2012; revised August 26, 2012. This work
was supported in part by the Japan Society for the Promotion of Science
(JSPS) under Scientific Research Grant (A) 22246110. In addition, Somayeh
Daneshvar gratefully acknowledges the JGC-S (Nikki Saneyoshi)
Foundation for a scholarship award.
S. Daneshvar and K. Otsuka are with the Department of Marine System
Engineering, Osaka Prefecture University, Osaka, JAPAN (e-mail:
[email protected], [email protected])
F. Salak was with Department of Chemical and Petroleum Engineering,
University of Calgary, Calgary, AB, CANADA (f.salak @yahoo.com).
Marine biomass and particularly algae is one of the most
widely plant in the world, have variety of industrial
applications. They have been reported to contain more than
2400 natural products of commercial importance in
pharmaceutical, biomedical, and nutraceutical industries [3].
Those are the main resource materials for phytocolloids
such as agar, carrageenan (derived from Rhodophyta) and
alginates (derived from Phaeophyta) [4], [5]. The residues
from their processing also represent as a feedstock to make
renewable fuels.
In fact, there is a great potential for production of
bio-chemicals and energy from marine biomass [6].
The methods of conversion into various forms of energy
are through several different conversions reactions (chemical,
biological, and thermochemical reaction). Among them less
attention has been devoted to thermochemical conversions.
The different thermochemical options for macroalgae
utilization include direct combustion, gasification, pyrolysis
and liquefaction.
Pyrolysis as one of the industrially sound process among
the thermochemical conversion has been commonly used to
convert the different kinds of biomass into bio-oil and
bio-char [7]. One of the advanced characterization technique
of pyrolysis is thermogravimetric analysis (TGA). TGA is a
thermal analysis technique which measures the amount and
rate of change in the weight of a material as a function of
temperature or time in a controlled atmosphere.
The TGA is used not only for study decomposition kinetics
of organic and inorganic compounds, but also widely used
for the study of composition of multicomponent systems,
oxidative stability of materials, estimated lifetime of a
products, the effect of reactive or corrosive atmospheres on
materials, moisture and volatiles content of materials [8], [9].
Traditionally, non-isothermal and constant heating rate
TGA have been used to obtain kinetic information with the
constant heating rate method developed by Flynn and Wall
[10] being preferred because it requires less experimental
time.
The present study has determined the pyrolysis behavior of
C. Fragile which selected as model for green macroalgae.
This green macroalgae is widely distributed along the shores
of East Asia, Oceania, and Northern Europe. In Japan, C.
Fragile is very familiar seaweed and has been used as a food
since ancient times. In addition, its use has been recorded as a
treatment for dropsy and dysuria [11], antiangiogenic effect
in the prevention of cancer [12] and it shows antiviral activity
[13].
We used TGA and DTG techniques in order to evaluate the
kinetics of pyrolysis of C. Fragile. In addition value of the
activation energies were also estimated in various
Pyrolytic Behavior of Green Macro Algae and Evaluation
of Its Activation Energy
S. Daneshvar,\F. Salak, and K. Otsuka
International Journal of Chemical Engineering and Applications, Vol. 3, No. 4, August 2012
256DOI: 10.7763/IJCEA.2012.V3.196
combustion rates and compared in detail.
II. EXPERIMENTAL
A. Materials
Fresh macroalgae (C. Fragile) was collected from Osaka
bay near to Rinkou Town Park in Osaka, Japan on 2010.
The average water content of C. Fragile just after harvesting
was found to be 93.3%. Obviously their compositions can
vary from batch to batch and by harvesting season [14].
However the remaining solid amount, similar to other marine
biomass, is cellulose with some incorporation of
hemicelluloses and a wide variety of acidic polysaccharides
[15] proteins, lipids, chlorophylls, and other organic and
inorganic compounds.
B. Methods
The sample was washed, cleaned of foreign debris, and
towel-dried. It was then complete dried using Freeze-drying
method (TAITEC freeze dryer VD-16). All the experiments
have been performed with initial dry mass close to 20 mg. In
fact by freeze drying the moisture content of sample can be
reduced to levels acceptable for thermal processing [1].
The dried sample was ground in a laboratory mill MF 10.1
from IKA Works, Inc. USA. It was sieved into six different
particle sizes of the sample ranging between <75 and >1400
μm.
Proximate experiments were carried out using a
thermogravimetric analyzer (Seiko Exstar 6000 TG/DTA
6300, Seiko Instruments Inc.). Ceramic crucibles were used
in order to minimize any thermal lag and to optimize heat
transfer between thermocouples and crucibles.
The experiments were performed in an atmospheric
pressure and under pure nitrogen gas (99.999%) with flow
rate of 20 ml/min. It was performed in non-isothermal
condition from room temperature to 973 K.
Pyrolysis was carried out by vary the heating rates from 5
to 50 K/min. The weight losses occurring in correspondence
to temperature rises were continuously recorded with a
computer working in coordination with the instrument. Effect
of particle size (ranging between <75 and >1400 μm) and
initial sample weight (ranging between 5-25 mg dry sample)
have been studied. Most of the results are presented in TG
plot which is plot between weight reduction and temperature.
Alternative presentations of results are given as the derivative
of the TG or rate of weight reduction against temperature. In
this study, all experiments were replicated twice.
III. KINETIC PARAMETERS ESTIMATION
To estimate kinetic parameters, the isoconversional
method was used. This method is applied for the description
of more complex processes where lots of chemical reactions
are running simultaneously; however, their mechanisms are
not exactly known [16]. It also has been widely utilized when
describing decomposition of biomass [17], [18].
Under non-isothermal conditions in which a sample is
heated at constant rate [19], mass loss data from the
thermogravimetric analysis can be recalculated into
conversion which is defined as follows:
aaaTaT mmmm00
. (1)
where ma is the initial mass of sample, maT is the mass at
temperature T, and ma∞ is final mass of sample at the end of
reaction. This method employs a heating rate (β), usually
linear, to raise the temperature. A linear heating program
follows:
.0 tTT (2)
Here β is the heating rate (K/min) and T is temperature (K)
at time t (min).
Under non-isothermal conditions the explicit temperature
dependence of the rate equation is given by,
)( T
RTE
T feAdTd a . (3)
Upon integration of (3) gives
T
RTE
T dTeAg a
0
)( (4)
Which is called the “temperature integral” equation and is
the general equation of non-isothermal reaction rate
suggested first time by Doyle [20], [21].
In non-isothermal kinetics, the Flynn‐Wall‐Ozawa
(FWO) [22], [10], Kissinger‐ Akahira‐Sunose (KAS)
[23-25], Friedman (FR) [26] and Coats-Redfern [27], [28]
methods are the most popular representative of the
isoconversional methods which used in this study.
IV. RESULTS AND DISCUSSION
A. Characteristics of the Thermal Degradation Process
on C. Fragile
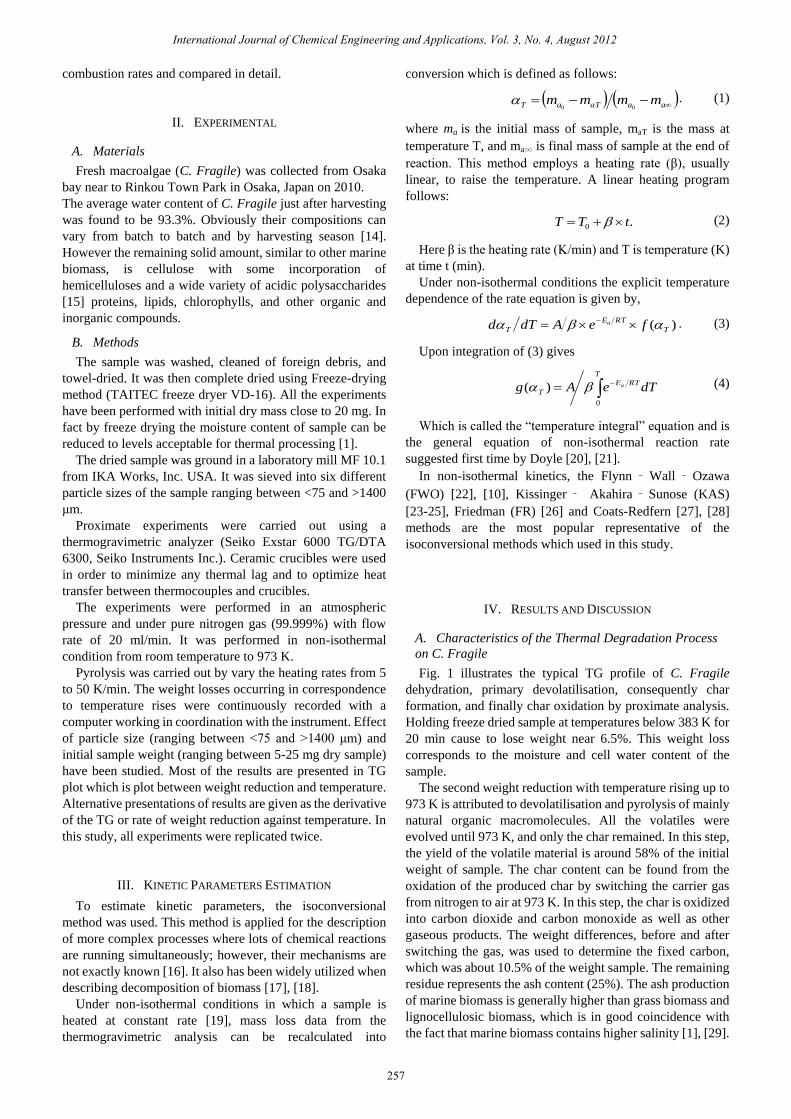
Fig. 1 illustrates the typical TG profile of C. Fragile
dehydration, primary devolatilisation, consequently char
formation, and finally char oxidation by proximate analysis.
Holding freeze dried sample at temperatures below 383 K for
20 min cause to lose weight near 6.5%. This weight loss
corresponds to the moisture and cell water content of the
sample.
The second weight reduction with temperature rising up to
973 K is attributed to devolatilisation and pyrolysis of mainly
natural organic macromolecules. All the volatiles were
evolved until 973 K, and only the char remained. In this step,
the yield of the volatile material is around 58% of the initial
weight of sample. The char content can be found from the
oxidation of the produced char by switching the carrier gas
from nitrogen to air at 973 K. In this step, the char is oxidized
into carbon dioxide and carbon monoxide as well as other
gaseous products. The weight differences, before and after
switching the gas, was used to determine the fixed carbon,
which was about 10.5% of the weight sample. The remaining
residue represents the ash content (25%). The ash production
of marine biomass is generally higher than grass biomass and
lignocellulosic biomass, which is in good coincidence with
the fact that marine biomass contains higher salinity [1], [29].
International Journal of Chemical Engineering and Applications, Vol. 3, No. 4, August 2012
257
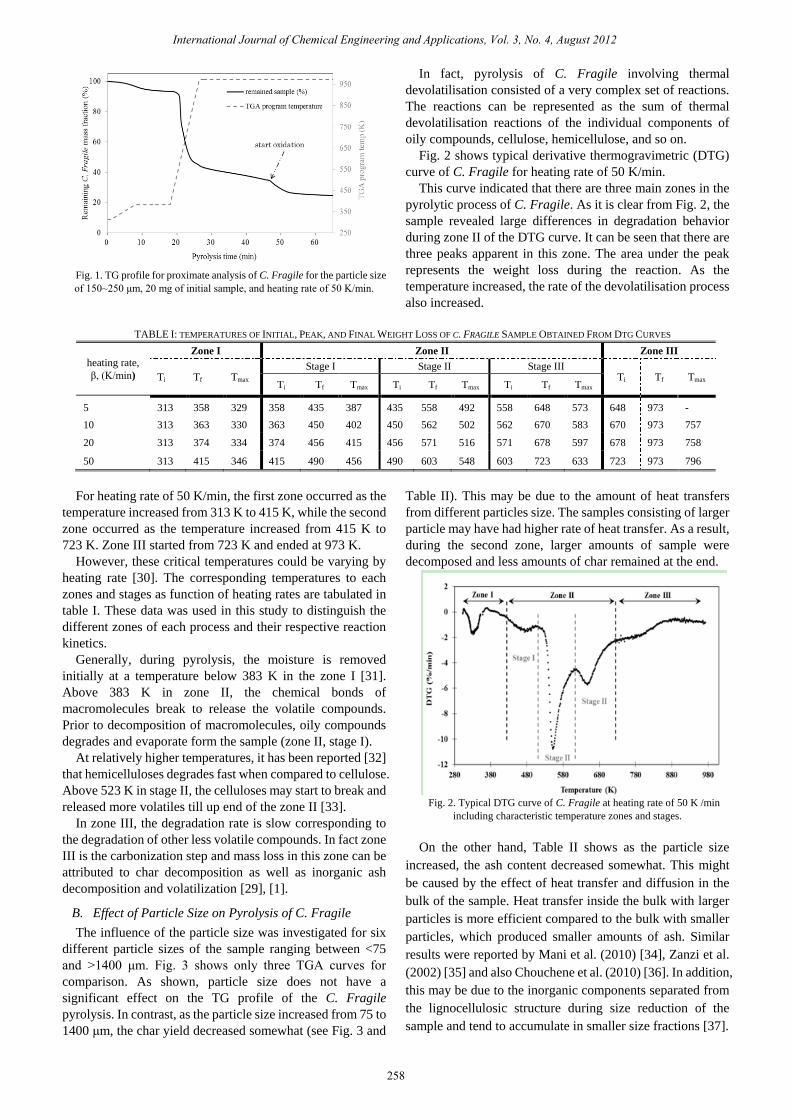
Fig. 1. TG profile for proximate analysis of C. Fragile for the particle size
of 150~250 μm, 20 mg of initial sample, and heating rate of 50 K/min.
In fact, pyrolysis of C. Fragile involving thermal
devolatilisation consisted of a very complex set of reactions.
The reactions can be represented as the sum of thermal
devolatilisation reactions of the individual components of
oily compounds, cellulose, hemicellulose, and so on.
Fig. 2 shows typical derivative thermogravimetric (DTG)
curve of C. Fragile for heating rate of 50 K/min.
This curve indicated that there are three main zones in the
pyrolytic process of C. Fragile. As it is clear from Fig. 2, the
sample revealed large differences in degradation behavior
during zone II of the DTG curve. It can be seen that there are
three peaks apparent in this zone. The area under the peak
represents the weight loss during the reaction. As the
temperature increased, the rate of the devolatilisation process
also increased.
TABLE I: TEMPERATURES OF INITIAL, PEAK, AND FINAL WEIGHT LOSS OF C. FRAGILE SAMPLE OBTAINED FROM DTG CURVES
heating rate,
β, (K/min)
Zone I Zone II Zone III
Ti Tf Tmax Stage I Stage II Stage III
Ti Tf Tmax Ti Tf Tmax Ti Tf Tmax Ti Tf Tmax
5 313 358 329 358 435 387 435 558 492 558 648 573 648 973 -
10 313 363 330 363 450 402 450 562 502 562 670 583 670 973 757
20 313 374 334 374 456 415 456 571 516 571 678 597 678 973 758
50 313 415 346 415 490 456 490 603 548 603 723 633 723 973 796
For heating rate of 50 K/min, the first zone occurred as the
temperature increased from 313 K to 415 K, while the second
zone occurred as the temperature increased from 415 K to
723 K. Zone III started from 723 K and ended at 973 K.
However, these critical temperatures could be varying by
heating rate [30]. The corresponding temperatures to each
zones and stages as function of heating rates are tabulated in
table I. These data was used in this study to distinguish the
different zones of each process and their respective reaction
kinetics.
Generally, during pyrolysis, the moisture is removed
initially at a temperature below 383 K in the zone I [31].
Above 383 K in zone II, the chemical bonds of
macromolecules break to release the volatile compounds.
Prior to decomposition of macromolecules, oily compounds
degrades and evaporate form the sample (zone II, stage I).
At relatively higher temperatures, it has been reported [32]
that hemicelluloses degrades fast when compared to cellulose.
Above 523 K in stage II, the celluloses may start to break and
released more volatiles till up end of the zone II [33].
In zone III, the degradation rate is slow corresponding to
the degradation of other less volatile compounds. In fact zone
III is the carbonization step and mass loss in this zone can be
attributed to char decomposition as well as inorganic ash
decomposition and volatilization [29], [1].
B. Effect of Particle Size on Pyrolysis of C. Fragile
The influence of the particle size was investigated for six
different particle sizes of the sample ranging between <75
and >1400 μm. Fig. 3 shows only three TGA curves for
comparison. As shown, particle size does not have a
significant effect on the TG profile of the C. Fragile
pyrolysis. In contrast, as the particle size increased from 75 to
1400 μm, the char yield decreased somewhat (see Fig. 3 and
Table II). This may be due to the amount of heat transfers
from different particles size. The samples consisting of larger
particle may have had higher rate of heat transfer. As a result,
during the second zone, larger amounts of sample were
decomposed and less amounts of char remained at the end.
Fig. 2. Typical DTG curve of C. Fragile at heating rate of 50 K /min
including characteristic temperature zones and stages.
On the other hand, Table II shows as the particle size
increased, the ash content decreased somewhat. This might
be caused by the effect of heat transfer and diffusion in the
bulk of the sample. Heat transfer inside the bulk with larger
particles is more efficient compared to the bulk with smaller
particles, which produced smaller amounts of ash. Similar
results were reported by Mani et al. (2010) [34], Zanzi et al.
(2002) [35] and also Chouchene et al. (2010) [36]. In addition,
this may be due to the inorganic components separated from
the lignocellulosic structure during size reduction of the
sample and tend to accumulate in smaller size fractions [37].
International Journal of Chemical Engineering and Applications, Vol. 3, No. 4, August 2012
258
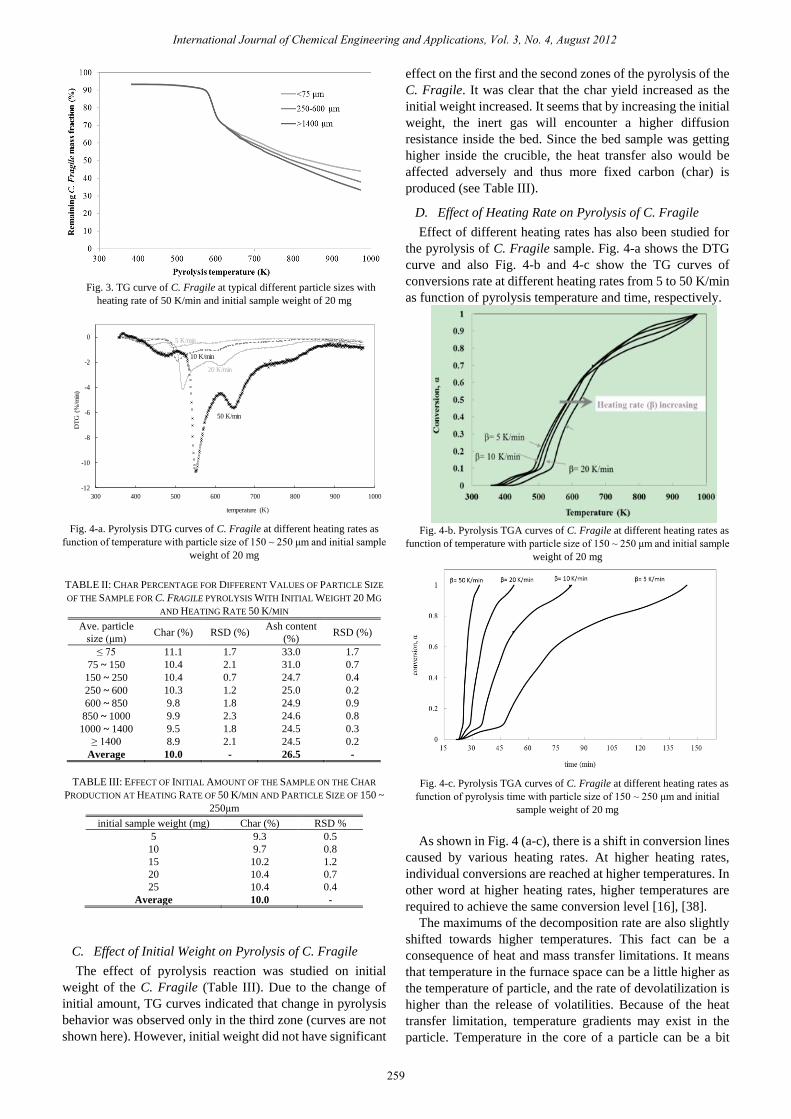
Fig. 3. TG curve of C. Fragile at typical different particle sizes with
heating rate of 50 K/min and initial sample weight of 20 mg
-12
-10
-8
-6
-4
-2
0
300 400 500 600 700 800 900 1000
DT
G (
%/m
in)
temperature (K)
5 K/min
10 K/min
20 K/min
50 K/min
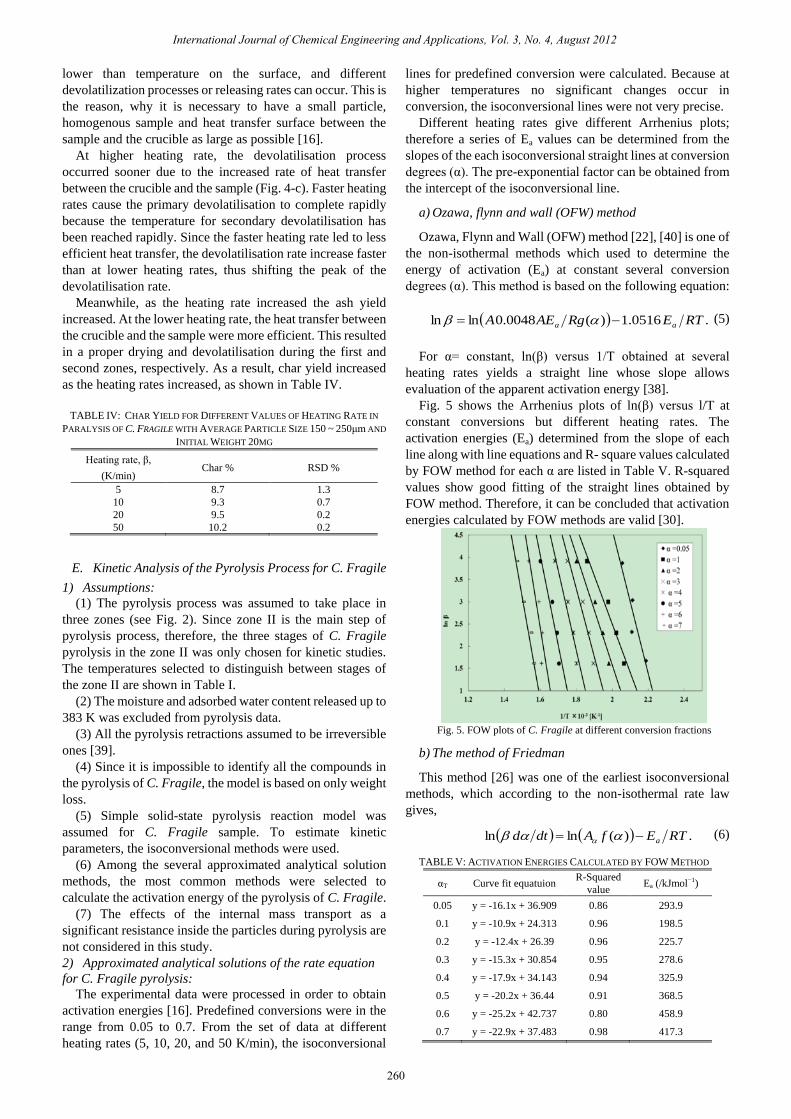
Fig. 4-a. Pyrolysis DTG curves of C. Fragile at different heating rates as
function of temperature with particle size of 150 ~ 250 μm and initial sample
weight of 20 mg
TABLE II: CHAR PERCENTAGE FOR DIFFERENT VALUES OF PARTICLE SIZE
OF THE SAMPLE FOR C. FRAGILE PYROLYSIS WITH INITIAL WEIGHT 20 MG
AND HEATING RATE 50 K/MIN
Ave. particle
size (μm) Char (%) RSD (%)
Ash content
(%) RSD (%)
≤ 75 11.1 1.7 33.0 1.7
75 ~ 150 10.4 2.1 31.0 0.7
150 ~ 250 10.4 0.7 24.7 0.4
250 ~ 600 10.3 1.2 25.0 0.2
600 ~ 850 9.8 1.8 24.9 0.9
850 ~ 1000 9.9 2.3 24.6 0.8
1000 ~ 1400 9.5 1.8 24.5 0.3
≥ 1400 8.9 2.1 24.5 0.2
Average 10.0 - 26.5 -
TABLE III: EFFECT OF INITIAL AMOUNT OF THE SAMPLE ON THE CHAR
PRODUCTION AT HEATING RATE OF 50 K/MIN AND PARTICLE SIZE OF 150 ~
250μm
initial sample weight (mg) Char (%) RSD %
5 9.3 0.5
10 9.7 0.8
15 10.2 1.2
20 10.4 0.7
25 10.4 0.4
Average 10.0 -
C. Effect of Initial Weight on Pyrolysis of C. Fragile
The effect of pyrolysis reaction was studied on initial
weight of the C. Fragile (Table III). Due to the change of
initial amount, TG curves indicated that change in pyrolysis
behavior was observed only in the third zone (curves are not
shown here). However, initial weight did not have significant
effect on the first and the second zones of the pyrolysis of the
C. Fragile. It was clear that the char yield increased as the
initial weight increased. It seems that by increasing the initial
weight, the inert gas will encounter a higher diffusion
resistance inside the bed. Since the bed sample was getting
higher inside the crucible, the heat transfer also would be
affected adversely and thus more fixed carbon (char) is
produced (see Table III).
D. Effect of Heating Rate on Pyrolysis of C. Fragile
Effect of different heating rates has also been studied for
the pyrolysis of C. Fragile sample. Fig. 4-a shows the DTG
curve and also Fig. 4-b and 4-c show the TG curves of
conversions rate at different heating rates from 5 to 50 K/min
as function of pyrolysis temperature and time, respectively.
Fig. 4-b. Pyrolysis TGA curves of C. Fragile at different heating rates as
function of temperature with particle size of 150 ~ 250 μm and initial sample
weight of 20 mg
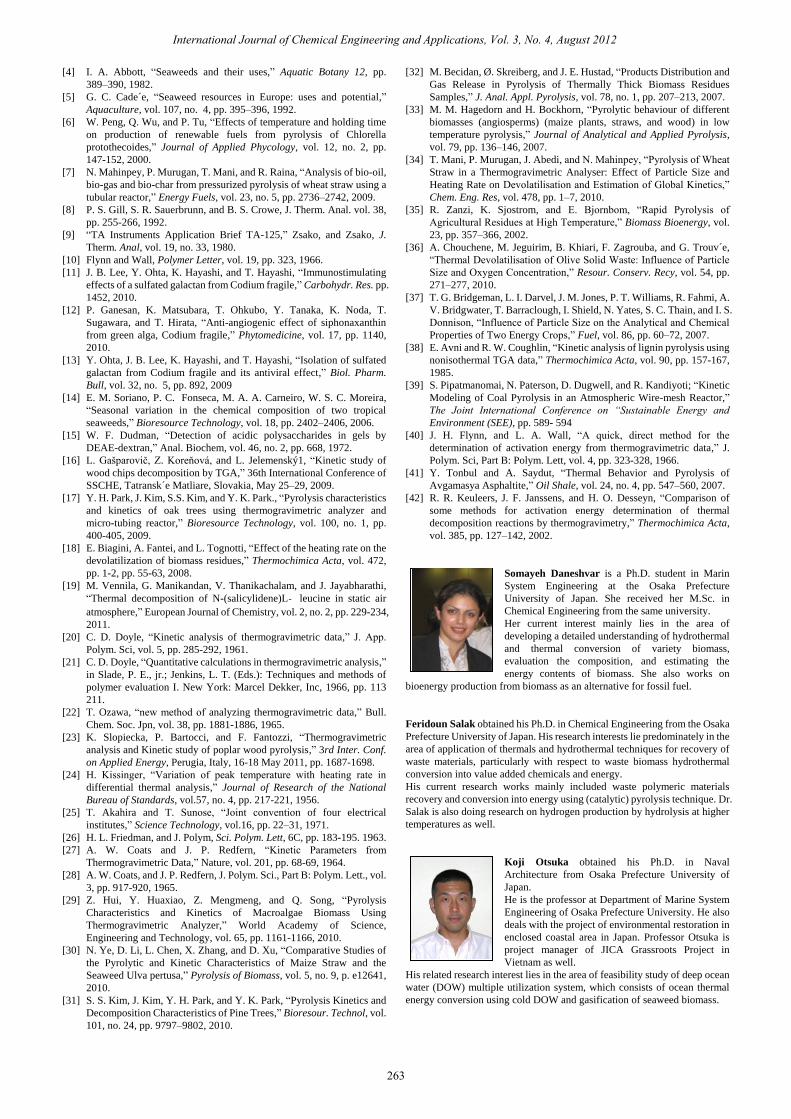
Fig. 4-c. Pyrolysis TGA curves of C. Fragile at different heating rates as
function of pyrolysis time with particle size of 150 ~ 250 μm and initial
sample weight of 20 mg
As shown in Fig. 4 (a-c), there is a shift in conversion lines
caused by various heating rates. At higher heating rates,
individual conversions are reached at higher temperatures. In
other word at higher heating rates, higher temperatures are
required to achieve the same conversion level [16], [38].
The maximums of the decomposition rate are also slightly
shifted towards higher temperatures. This fact can be a
consequence of heat and mass transfer limitations. It means
that temperature in the furnace space can be a little higher as
the temperature of particle, and the rate of devolatilization is
higher than the release of volatilities. Because of the heat
transfer limitation, temperature gradients may exist in the
particle. Temperature in the core of a particle can be a bit
International Journal of Chemical Engineering and Applications, Vol. 3, No. 4, August 2012
259
lower than temperature on the surface, and different
devolatilization processes or releasing rates can occur. This is
the reason, why it is necessary to have a small particle,
homogenous sample and heat transfer surface between the
sample and the crucible as large as possible [16].
At higher heating rate, the devolatilisation process
occurred sooner due to the increased rate of heat transfer
between the crucible and the sample (Fig. 4-c). Faster heating
rates cause the primary devolatilisation to complete rapidly
because the temperature for secondary devolatilisation has
been reached rapidly. Since the faster heating rate led to less
efficient heat transfer, the devolatilisation rate increase faster
than at lower heating rates, thus shifting the peak of the
devolatilisation rate.
Meanwhile, as the heating rate increased the ash yield
increased. At the lower heating rate, the heat transfer between
the crucible and the sample were more efficient. This resulted
in a proper drying and devolatilisation during the first and
second zones, respectively. As a result, char yield increased
as the heating rates increased, as shown in Table IV.
TABLE IV: CHAR YIELD FOR DIFFERENT VALUES OF HEATING RATE IN
PARALYSIS OF C. FRAGILE WITH AVERAGE PARTICLE SIZE 150 ~ 250μm AND
INITIAL WEIGHT 20MG
Heating rate, β,
(K/min) Char % RSD %
5 8.7 1.3
10 9.3 0.7
20 9.5 0.2
50 10.2 0.2
E. Kinetic Analysis of the Pyrolysis Process for C. Fragile
1) Assumptions:
(1) The pyrolysis process was assumed to take place in
three zones (see Fig. 2). Since zone II is the main step of
pyrolysis process, therefore, the three stages of C. Fragile
pyrolysis in the zone II was only chosen for kinetic studies.
The temperatures selected to distinguish between stages of
the zone II are shown in Table I.
(2) The moisture and adsorbed water content released up to
383 K was excluded from pyrolysis data.
(3) All the pyrolysis retractions assumed to be irreversible
ones [39].
(4) Since it is impossible to identify all the compounds in
the pyrolysis of C. Fragile, the model is based on only weight
loss.
(5) Simple solid-state pyrolysis reaction model was
assumed for C. Fragile sample. To estimate kinetic
parameters, the isoconversional methods were used.
(6) Among the several approximated analytical solution
methods, the most common methods were selected to
calculate the activation energy of the pyrolysis of C. Fragile.
(7) The effects of the internal mass transport as a
significant resistance inside the particles during pyrolysis are
not considered in this study.
2) Approximated analytical solutions of the rate equation
for C. Fragile pyrolysis:
The experimental data were processed in order to obtain
activation energies [16]. Predefined conversions were in the
range from 0.05 to 0.7. From the set of data at different
heating rates (5, 10, 20, and 50 K/min), the isoconversional
lines for predefined conversion were calculated. Because at
higher temperatures no significant changes occur in
conversion, the isoconversional lines were not very precise.
Different heating rates give different Arrhenius plots;
therefore a series of Ea values can be determined from the
slopes of the each isoconversional straight lines at conversion
degrees (α). The pre-exponential factor can be obtained from
the intercept of the isoconversional line.
a) Ozawa, flynn and wall (OFW) method
Ozawa, Flynn and Wall (OFW) method [22], [40] is one of
the non-isothermal methods which used to determine the
energy of activation (Ea) at constant several conversion
degrees (α). This method is based on the following equation:
.0516.1)(0048.0lnln RTERgAEA aa (5)
For α= constant, ln(β) versus 1/T obtained at several
heating rates yields a straight line whose slope allows
evaluation of the apparent activation energy [38].
Fig. 5 shows the Arrhenius plots of ln(β) versus l/T at
constant conversions but different heating rates. The
activation energies (Ea) determined from the slope of each
line along with line equations and R- square values calculated
by FOW method for each α are listed in Table V. R-squared
values show good fitting of the straight lines obtained by
FOW method. Therefore, it can be concluded that activation
energies calculated by FOW methods are valid [30].
Fig. 5. FOW plots of C. Fragile at different conversion fractions
b) The method of Friedman
This method [26] was one of the earliest isoconversional
methods, which according to the non-isothermal rate law
gives,
.)(lnln RTEfAdtd a (6)
TABLE V: ACTIVATION ENERGIES CALCULATED BY FOW METHOD
αT Curve fit equatuion R-Squared
value Ea (/kJmol−1)
0.05 y = -16.1x + 36.909 0.86 293.9
0.1 y = -10.9x + 24.313 0.96 198.5
0.2 y = -12.4x + 26.39 0.96 225.7
0.3 y = -15.3x + 30.854 0.95 278.6
0.4 y = -17.9x + 34.143 0.94 325.9
0.5 y = -20.2x + 36.44 0.91 368.5
0.6 y = -25.2x + 42.737 0.80 458.9
0.7 y = -22.9x + 37.483 0.98 417.3
International Journal of Chemical Engineering and Applications, Vol. 3, No. 4, August 2012
260

Hence, a plot of ln [βdα/dt] versus 1/T at each conversion
degree (αT) gives activation energy Ea from the slope of the
plot. The constructed plots are shown in Fig 6. The activation
energies (Ea) along with line equations and R- square values
calculated by Friedman method for each α are listed in Table
VI.
Fig. 6. Friedman plots of C. Fragile at different conversion fractions
TABLE VI: ACTIVATION ENERGIES CALCULATED BY FRIEDMAN
METHOD
αT Curve fit equation R-Squared
value Ea (/kJmol−1)
0.05 y = -28.0x + 56.232 0.99 233.1
0.1 y = -17.2x + 37.495 0.94 142.9
0.2 y = -26.2x + 50.464 0.96 218.0
0.3 y = -28.2x + 52.217 0.98 234.6
0.4 y = -31.8x + 55.83 0.98 264.5
0.5 y = -32.2x + 53.65 0.97 267.5
0.6 y = -33.1x + 51.743 0.98 275.3
0.7 y = -39.7x + 58.797 0.97 329.9
0.8 y = -36.2x + 48.732 0.99 301.1
Fig. 7. KAS plots of C. Fragile at different conversion fraction
c) Kissinge-akahira-SUNOSE (KAS) method
The Kissinger-Akahira-Sunose (KAS) method [24], [25]
was based on the following equation,
.)(lnln 2 RTEgEART aa (7)
The activation energies (Ea) can be determine from the
linear plots of the lnβ/T2 versus 1/T temperature
corresponding to each conversion degree (Fig. 7). Same as
the other methods the activation energies can be determined
without a precise knowledge of the reaction mechanism. The
activation energies (Ea) along with line equations and R-
square values calculated by KAS method for each α are listed
in Table VII.
d) The method of coast-redfern
This method [27], [28] is a non-isothermal model free
method and uses the integral form of the non-isothermal rate
TABLE VII: ACTIVATION ENERGIES CALCULATED BY KAS METHOD
αT Curve fit Eq. R-Squared value Ea (/kJmol−1)
0.05 y = -9.9x + 9.8623 0.96 82.3
0.1 y = -6.2x + 4.4282 0.95 51.7
0.2 y = -11.3x + 11.843 0.95 94.3
0.3 y = -14.2x + 16.235 0.94 118.1
0.4 y = -16.7x + 19.433 0.93 139.3
0.5 y = -19.0x + 21.625 0.9 158.2
0.6 y = -23.9x + 27.827 0.78 199.0
0.7 y = -20.9x + 20.766 0.86 173.455
0.8 y = -20.4x + 18.042 0.99 169.7
law which gives,
.3.221log
)1(1loglog 2)1(
RTEERTEAR
nT
aaa
n
(8)
The left-hand side of (8) versus 1/T was plotted and the
slope of these lines gave the Ea values. In the present study,
the orders 0.5, 1, and 1.5 were plotted for (8) and the best
correlation coefficients were obtained for n= 1. The straight
line plots for C. Fragile are given in Figs. 8 (a-d), and the
calculated activation energies are cited in Table VIII (and for
comparison in Fig. 9)
Fig. 8-a. Coats-redfern plots of C. Fragile (with average particle size 150 ~
250 μm, heating rate 5 min–1) for stages I, II, and III.
Fig. 8-b. Coats-redfern plots of C. Fragile (with average particle size 150 ~
250 μm, heating rate 10 min–1) for stages I, II, and III.
Fig. 8-c. Coats-redfern plots of C. Fragile (with average particle size 150 ~
250 μm, heating rate 20 min–1) for stages I, II, and III.
International Journal of Chemical Engineering and Applications, Vol. 3, No. 4, August 2012
261
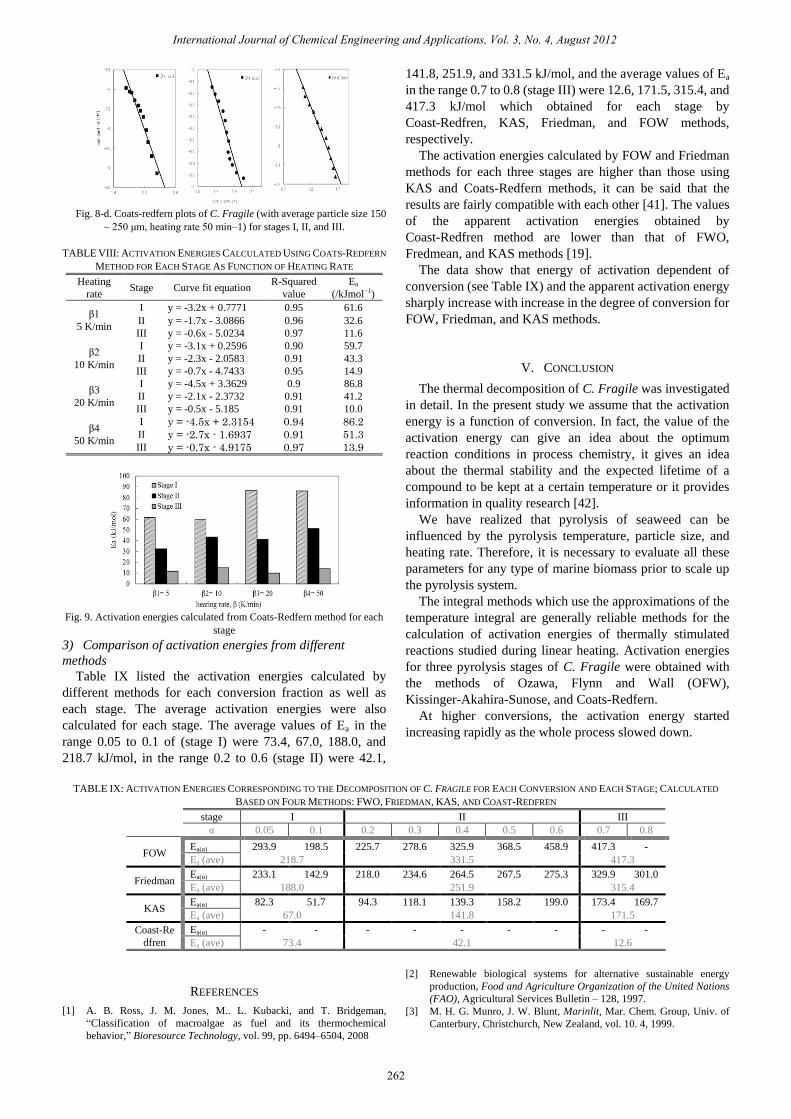
Fig. 8-d. Coats-redfern plots of C. Fragile (with average particle size 150
~ 250 μm, heating rate 50 min–1) for stages I, II, and III.
TABLE VIII: ACTIVATION ENERGIES CALCULATED USING COATS-REDFERN
METHOD FOR EACH STAGE AS FUNCTION OF HEATING RATE
Heating
rate Stage Curve fit equation
R-Squared
value
Ea
(/kJmol−1)
β1
5 K/min
I y = -3.2x + 0.7771 0.95 61.6
II y = -1.7x - 3.0866 0.96 32.6
III y = -0.6x - 5.0234 0.97 11.6
β2
10 K/min
I y = -3.1x + 0.2596 0.90 59.7
II y = -2.3x - 2.0583 0.91 43.3
III y = -0.7x - 4.7433 0.95 14.9
β3
20 K/min
I y = -4.5x + 3.3629 0.9 86.8
II y = -2.1x - 2.3732 0.91 41.2
III y = -0.5x - 5.185 0.91 10.0
β4
50 K/min
I y = -4.5x + 2.3154 0.94 86.2
II y = -2.7x - 1.6937 0.91 51.3
III y = -0.7x - 4.9175 0.97 13.9
Fig. 9. Activation energies calculated from Coats-Redfern method for each
stage
3) Comparison of activation energies from different
methods
Table IX listed the activation energies calculated by
different methods for each conversion fraction as well as
each stage. The average activation energies were also
calculated for each stage. The average values of Ea in the
range 0.05 to 0.1 of (stage I) were 73.4, 67.0, 188.0, and
218.7 kJ/mol, in the range 0.2 to 0.6 (stage II) were 42.1,
141.8, 251.9, and 331.5 kJ/mol, and the average values of Ea
in the range 0.7 to 0.8 (stage III) were 12.6, 171.5, 315.4, and
417.3 kJ/mol which obtained for each stage by
Coast-Redfren, KAS, Friedman, and FOW methods,
respectively.
The activation energies calculated by FOW and Friedman
methods for each three stages are higher than those using
KAS and Coats-Redfern methods, it can be said that the
results are fairly compatible with each other [41]. The values
of the apparent activation energies obtained by
Coast-Redfren method are lower than that of FWO,
Fredmean, and KAS methods [19].
The data show that energy of activation dependent of
conversion (see Table IX) and the apparent activation energy
sharply increase with increase in the degree of conversion for
FOW, Friedman, and KAS methods.
V. CONCLUSION
The thermal decomposition of C. Fragile was investigated
in detail. In the present study we assume that the activation
energy is a function of conversion. In fact, the value of the
activation energy can give an idea about the optimum
reaction conditions in process chemistry, it gives an idea
about the thermal stability and the expected lifetime of a
compound to be kept at a certain temperature or it provides
information in quality research [42].
We have realized that pyrolysis of seaweed can be
influenced by the pyrolysis temperature, particle size, and
heating rate. Therefore, it is necessary to evaluate all these
parameters for any type of marine biomass prior to scale up
the pyrolysis system.
The integral methods which use the approximations of the
temperature integral are generally reliable methods for the
calculation of activation energies of thermally stimulated
reactions studied during linear heating. Activation energies
for three pyrolysis stages of C. Fragile were obtained with
the methods of Ozawa, Flynn and Wall (OFW),
Kissinger-Akahira-Sunose, and Coats-Redfern.
At higher conversions, the activation energy started
increasing rapidly as the whole process slowed down.
TABLE IX: ACTIVATION ENERGIES CORRESPONDING TO THE DECOMPOSITION OF C. FRAGILE FOR EACH CONVERSION AND EACH STAGE; CALCULATED
BASED ON FOUR METHODS: FWO, FRIEDMAN, KAS, AND COAST-REDFREN
stage I II III
α 0.05 0.1 0.2 0.3 0.4 0.5 0.6 0.7 0.8
FOW Ea(α) 293.9 198.5 225.7 278.6 325.9 368.5 458.9 417.3 -
Ea (ave) 218.7 331.5 417.3
Friedman Ea(α) 233.1 142.9 218.0 234.6 264.5 267.5 275.3 329.9 301.0
Ea (ave) 188.0 251.9 315.4
KAS Ea(α) 82.3 51.7 94.3 118.1 139.3 158.2 199.0 173.4 169.7
Ea (ave) 67.0 141.8 171.5
Coast-Re
dfren
Ea(α) - - - - - - - - -
Ea (ave) 73.4 42.1 12.6
REFERENCES
[1] A. B. Ross, J. M. Jones, M.. L. Kubacki, and T. Bridgeman,
“Classification of macroalgae as fuel and its thermochemical
behavior,” Bioresource Technology, vol. 99, pp. 6494–6504, 2008
[2] Renewable biological systems for alternative sustainable energy
production, Food and Agriculture Organization of the United Nations
(FAO), Agricultural Services Bulletin – 128, 1997.
[3] M. H. G. Munro, J. W. Blunt, Marinlit, Mar. Chem. Group, Univ. of
Canterbury, Christchurch, New Zealand, vol. 10. 4, 1999.
International Journal of Chemical Engineering and Applications, Vol. 3, No. 4, August 2012
262
[4] I. A. Abbott, “Seaweeds and their uses,” Aquatic Botany 12, pp.
389–390, 1982.
[5] G. C. Cade e, “Seaweed resources in Europe: uses and potential,”
Aquaculture, vol. 107, no. 4, pp. 395–396, 1992.
[6] W. Peng, Q. Wu, and P. Tu, “Effects of temperature and holding time
on production of renewable fuels from pyrolysis of Chlorella
protothecoides,” Journal of Applied Phycology, vol. 12, no. 2, pp.
147-152, 2000.
[7] N. Mahinpey, P. Murugan, T. Mani, and R. Raina, “Analysis of bio-oil,
bio-gas and bio-char from pressurized pyrolysis of wheat straw using a
tubular reactor,” Energy Fuels, vol. 23, no. 5, pp. 2736–2742, 2009.
[8] P. S. Gill, S. R. Sauerbrunn, and B. S. Crowe, J. Therm. Anal. vol. 38,
pp. 255-266, 1992.
[9] “TA Instruments Application Brief TA-125,” Zsako, and Zsako, J.
Therm. Anal, vol. 19, no. 33, 1980.
[10] Flynn and Wall, Polymer Letter, vol. 19, pp. 323, 1966.
[11] J. B. Lee, Y. Ohta, K. Hayashi, and T. Hayashi, “Immunostimulating
effects of a sulfated galactan from Codium fragile,” Carbohydr. Res. pp.
1452, 2010.
[12] P. Ganesan, K. Matsubara, T. Ohkubo, Y. Tanaka, K. Noda, T.
Sugawara, and T. Hirata, “Anti-angiogenic effect of siphonaxanthin
from green alga, Codium fragile,” Phytomedicine, vol. 17, pp. 1140,
2010.
[13] Y. Ohta, J. B. Lee, K. Hayashi, and T. Hayashi, “Isolation of sulfated
galactan from Codium fragile and its antiviral effect,” Biol. Pharm.
Bull, vol. 32, no. 5, pp. 892, 2009
[14] E. M. Soriano, P. C. Fonseca, M. A. A. Carneiro, W. S. C. Moreira,
“Seasonal variation in the chemical composition of two tropical
seaweeds,” Bioresource Technology, vol. 18, pp. 2402–2406, 2006.
[15] W. F. Dudman, “Detection of acidic polysaccharides in gels by
DEAE-dextran,” Anal. Biochem, vol. 46, no. 2, pp. 668, 1972.
[16] L. Gašparovič, Z. Koreňová, and L. Jelemenský1, “Kinetic study of
wood chips decomposition by TGA,” 36th International Conference of
SSCHE, Tatransk e Matliare, Slovakia, May 25–29, 2009.
[17] Y. H. Park, J. Kim, S.S. Kim, and Y. K. Park., “Pyrolysis characteristics
and kinetics of oak trees using thermogravimetric analyzer and
micro-tubing reactor,” Bioresource Technology, vol. 100, no. 1, pp.
400-405, 2009.
[18] E. Biagini, A. Fantei, and L. Tognotti, “Effect of the heating rate on the
devolatilization of biomass residues,” Thermochimica Acta, vol. 472,
pp. 1-2, pp. 55-63, 2008.
[19] M. Vennila, G. Manikandan, V. Thanikachalam, and J. Jayabharathi,
“Thermal decomposition of N-(salicylidene)L‐ leucine in static air
atmosphere,” European Journal of Chemistry, vol. 2, no. 2, pp. 229-234,
2011.
[20] C. D. Doyle, “Kinetic analysis of thermogravimetric data,” J. App.
Polym. Sci, vol. 5, pp. 285-292, 1961.
[21] C. D. Doyle, “Quantitative calculations in thermogravimetric analysis,”
in Slade, P. E., jr.; Jenkins, L. T. (Eds.): Techniques and methods of
polymer evaluation I. New York: Marcel Dekker, Inc, 1966, pp. 113
211.
[22] T. Ozawa, “new method of analyzing thermogravimetric data,” Bull.
Chem. Soc. Jpn, vol. 38, pp. 1881-1886, 1965.
[23] K. Slopiecka, P. Bartocci, and F. Fantozzi, “Thermogravimetric
analysis and Kinetic study of poplar wood pyrolysis,” 3rd Inter. Conf.
on Applied Energy, Perugia, Italy, 16-18 May 2011, pp. 1687-1698.
[24] H. Kissinger, “Variation of peak temperature with heating rate in
differential thermal analysis,” Journal of Research of the National
Bureau of Standards, vol.57, no. 4, pp. 217-221, 1956.
[25] T. Akahira and T. Sunose, “Joint convention of four electrical
institutes,” Science Technology, vol.16, pp. 22–31, 1971.
[26] H. L. Friedman, and J. Polym, Sci. Polym. Lett, 6C, pp. 183-195. 1963.
[27] A. W. Coats and J. P. Redfern, “Kinetic Parameters from
Thermogravimetric Data,” Nature, vol. 201, pp. 68-69, 1964.
[28] A. W. Coats, and J. P. Redfern, J. Polym. Sci., Part B: Polym. Lett., vol.
3, pp. 917-920, 1965.
[29] Z. Hui, Y. Huaxiao, Z. Mengmeng, and Q. Song, “Pyrolysis
Characteristics and Kinetics of Macroalgae Biomass Using
Thermogravimetric Analyzer,” World Academy of Science,
Engineering and Technology, vol. 65, pp. 1161-1166, 2010.
[30] N. Ye, D. Li, L. Chen, X. Zhang, and D. Xu, “Comparative Studies of
the Pyrolytic and Kinetic Characteristics of Maize Straw and the
Seaweed Ulva pertusa,” Pyrolysis of Biomass, vol. 5, no. 9, p. e12641,
2010.
[31] S. S. Kim, J. Kim, Y. H. Park, and Y. K. Park, “Pyrolysis Kinetics and
Decomposition Characteristics of Pine Trees,” Bioresour. Technol, vol.
101, no. 24, pp. 9797–9802, 2010.
[32] M. Becidan, Ø. Skreiberg, and J. E. Hustad, “Products Distribution and
Gas Release in Pyrolysis of Thermally Thick Biomass Residues
Samples,” J. Anal. Appl. Pyrolysis, vol. 78, no. 1, pp. 207–213, 2007.
[33] M. M. Hagedorn and H. Bockhorn, “Pyrolytic behaviour of different
biomasses (angiosperms) (maize plants, straws, and wood) in low
temperature pyrolysis,” Journal of Analytical and Applied Pyrolysis,
vol. 79, pp. 136–146, 2007.
[34] T. Mani, P. Murugan, J. Abedi, and N. Mahinpey, “Pyrolysis of Wheat
Straw in a Thermogravimetric Analyser: Effect of Particle Size and
Heating Rate on Devolatilisation and Estimation of Global Kinetics,”
Chem. Eng. Res, vol. 478, pp. 1–7, 2010.
[35] R. Zanzi, K. Sjostrom, and E. Bjornbom, “Rapid Pyrolysis of
Agricultural Residues at High Temperature,” Biomass Bioenergy, vol.
23, pp. 357–366, 2002.
[36] A. Chouchene, M. Jeguirim, B. Khiari, F. Zagrouba, and G. Trouv e,
“Thermal Devolatilisation of Olive Solid Waste: Influence of Particle
Size and Oxygen Concentration,” Resour. Conserv. Recy, vol. 54, pp.
271–277, 2010.
[37] T. G. Bridgeman, L. I. Darvel, J. M. Jones, P. T. Williams, R. Fahmi, A.
V. Bridgwater, T. Barraclough, I. Shield, N. Yates, S. C. Thain, and I. S.
Donnison, “Influence of Particle Size on the Analytical and Chemical
Properties of Two Energy Crops,” Fuel, vol. 86, pp. 60–72, 2007.
[38] E. Avni and R. W. Coughlin, “Kinetic analysis of lignin pyrolysis using
nonisothermal TGA data,” Thermochimica Acta, vol. 90, pp. 157-167,
1985.
[39] S. Pipatmanomai, N. Paterson, D. Dugwell, and R. Kandiyoti; “Kinetic
Modeling of Coal Pyrolysis in an Atmospheric Wire-mesh Reactor,”
The Joint International Conference on “Sustainable Energy and
Environment (SEE), pp. 589- 594
[40] J. H. Flynn, and L. A. Wall, “A quick, direct method for the
determination of activation energy from thermogravimetric data,” J.
Polym. Sci, Part B: Polym. Lett, vol. 4, pp. 323-328, 1966.
[41] Y. Tonbul and A. Saydut, “Thermal Behavior and Pyrolysis of
Avgamasya Asphaltite,” Oil Shale, vol. 24, no. 4, pp. 547–560, 2007.
[42] R. R. Keuleers, J. F. Janssens, and H. O. Desseyn, “Comparison of
some methods for activation energy determination of thermal
decomposition reactions by thermogravimetry,” Thermochimica Acta,
vol. 385, pp. 127–142, 2002.
Somayeh Daneshvar is a Ph.D. student in Marin
System Engineering at the Osaka Prefecture
University of Japan. She received her M.Sc. in
Chemical Engineering from the same university.
Her current interest mainly lies in the area of
developing a detailed understanding of hydrothermal
and thermal conversion of variety biomass,
evaluation the composition, and estimating the
energy contents of biomass. She also works on
bioenergy production from biomass as an alternative for fossil fuel.
Feridoun Salak obtained his Ph.D. in Chemical Engineering from the Osaka
Prefecture University of Japan. His research interests lie predominately in the
area of application of thermals and hydrothermal techniques for recovery of
waste materials, particularly with respect to waste biomass hydrothermal
conversion into value added chemicals and energy.
His current research works mainly included waste polymeric materials
recovery and conversion into energy using (catalytic) pyrolysis technique. Dr.
Salak is also doing research on hydrogen production by hydrolysis at higher
temperatures as well.
Koji Otsuka obtained his Ph.D. in Naval
Architecture from Osaka Prefecture University of
Japan.
He is the professor at Department of Marine System
Engineering of Osaka Prefecture University. He also
deals with the project of environmental restoration in
enclosed coastal area in Japan. Professor Otsuka is
project manager of JICA Grassroots Project in
Vietnam as well.
His related research interest lies in the area of feasibility study of deep ocean
water (DOW) multiple utilization system, which consists of ocean thermal
energy conversion using cold DOW and gasification of seaweed biomass.
Author’s formal
photo
Author’s formal
photo
International Journal of Chemical Engineering and Applications, Vol. 3, No. 4, August 2012
263