Pyramis Global Advisors International Growth · * Source: FMR LLC, Pyramis Global Advisors,...
44
Chris Steward, CFA Institutional Portfolio Manager Brian Hoesly, CFA Institutional Portfolio Manager For Institutional Use Only © 2010 FMR LLC. All rights reserved. 549491.6.0 Pyramis Global Advisors Stanislaus County Employees Retirement Association October 26, 2010 Pyramis Global Advisors International Growth
Transcript of Pyramis Global Advisors International Growth · * Source: FMR LLC, Pyramis Global Advisors,...
Chris Steward, CFAInstitutional Portfolio Manager
Brian Hoesly, CFAInstitutional Portfolio Manager
For Institutional Use Only© 2010 FMR LLC. All rights reserved.549491.6.0
Pyramis Global Advisors
Stanislaus County Employees Retirement AssociationOctober 26, 2010
Pyramis Global Advisors International Growth
Table of Contents
I. Pyramis International Growth Investment Process
II. Investment Performance & Positioning
III. AppendixA. Important InformationB. Biographies
See "Important Information" for a discussion of performance data some of the principal risks related to any of the investment strategies referred to in thisSee Important Information for a discussion of performance data, some of the principal risks related to any of the investment strategies referred to in this presentation and other information related to this presentation.
2For Institutional Use Only201010-8385
P i I i l G h I PPyramis International Growth Investment Process

Pyramis International Growth—Investment Team
Total PortfolioMichael Strong
Lead Portfolio Manager23 Years Industry23 Years Industry
12 Years at Pyramis/Fidelity Investments
Chris StewardInstitutional Portfolio Manager
22 Years Industry 4 Years at Pyramis
Brian HoeslyInstitutional Portfolio Manager
21 Years Industry 4 Years at Pyramis
Regional Sub-Portfolios
Pacific Basin Ex Japan Emerging Markets Equity JapanEurope Canadap
John Lo16 Years Industry
16 Years at Fidelity International
g g q y
Bob Von Rekowsky19 Years Industry 19 Year at Fidelity
p
Eileen Dibb13 Years Industry 5 Years at Fidelity
p
Joe Overdevest 8 Years Industry
8 Years at Fidelity International
Cedric De la Chaise
13 Years Industry 13 Years at Fidelity
International
45 Research Professionals 5 Research Professionals33 Research Professionals96 Research Professionals 10 Research Professionals
This information reflects the combined resources of Pyramis, Fidelity Investments and Fidelity Investment Managers as of June 30, 2010.
4For Institutional Use Only201010-8385
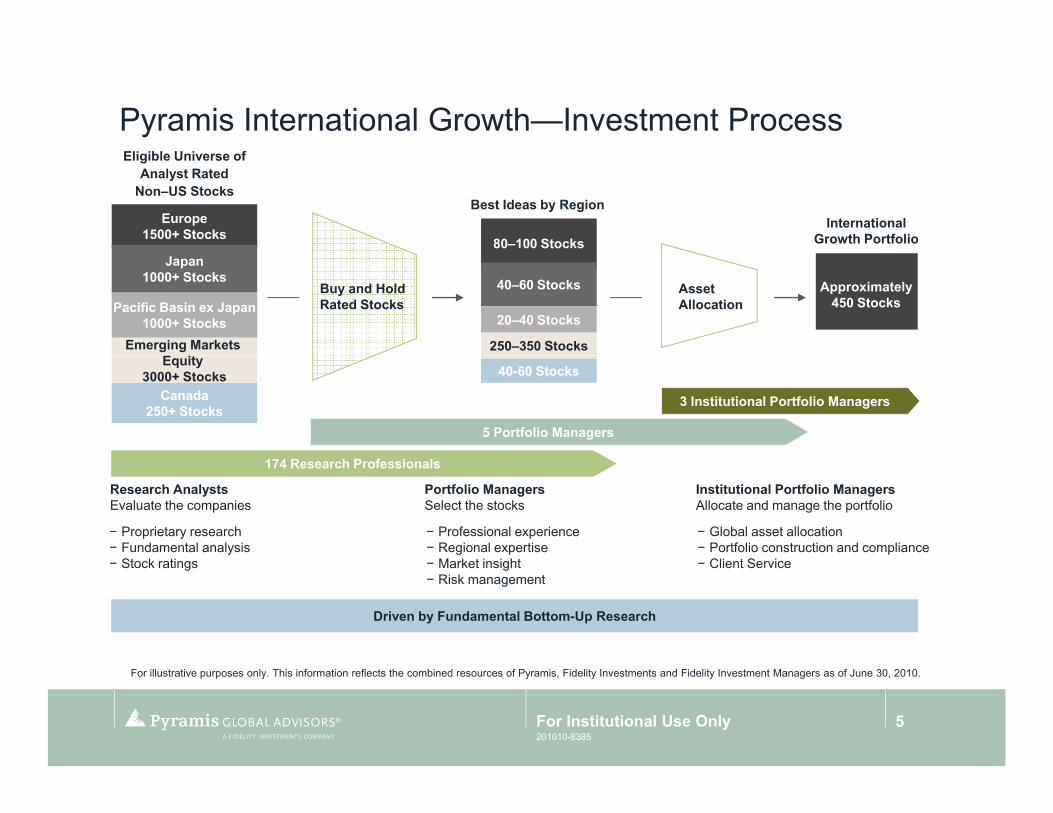
Pyramis International Growth—Investment Process
International Growth Portfolio
Best Ideas by Region
Eligible Universe of Analyst Rated
Non–US Stocks
Europe1500+ Stocks
80–100 Stocks
Approximately450 Stocks
Buy and Hold Rated Stocks
Asset Allocation
Japan1000+ Stocks
Pacific Basin ex Japan1000+ Stocks
Emerging Markets
40–60 Stocks
20–40 Stocks
250–350 Stocks
5 Portfolio Managers
3 Institutional Portfolio Managers
Equity 3000+ Stocks
Canada250+ Stocks
40-60 Stocks
174 Research Professionals
Research AnalystsEvaluate the companies
− Proprietary research− Fundamental analysis
St k ti
Portfolio ManagersSelect the stocks
− Professional experience− Regional expertise
M k t i i ht
Institutional Portfolio ManagersAllocate and manage the portfolio
− Global asset allocation− Portfolio construction and compliance
Cli t S i− Stock ratings − Market insight− Risk management
− Client Service
Driven by Fundamental Bottom-Up Research
For illustrative purposes only. This information reflects the combined resources of Pyramis, Fidelity Investments and Fidelity Investment Managers as of June 30, 2010.
5For Institutional Use Only201010-8385

Proprietary Research
Fundamental Research Company
Company meetings
Written notes
Face to faceFace-to-face
Analyst ratings
Analyst model portfolio
F ill t ti l R h d i t d i l d th bi d f P i Fid lit I t t d Fid lit I t t M f
6For Institutional Use Only
For illustrative purposes only. Research resources depicted include the combined resources of Pyramis, Fidelity Investments and Fidelity Investment Managers as of September 30, 2010.
201010-8385

Stock Selection
Identify Best Ideas
Selection Process:Total return target based on proprietary 2–3 yr forward earnings potential and target valuation metrics
Fundamental prospects:Fundamental prospects:– Top line growth: volume, pricing– Operating profit margin evolution– Porter Competitive Analysis– Secular story tied to company– Potential for increasing cash flow– Management quality and use of capital
Balance sheet strength– Balance sheet strength– Strategy and economics of M&A– Ownership structure
Target valuation metrics for company fundamentals
For illustrative purposes only. Research resources depicted include the combined resources of Pyramis, Fidelity Investments and Fidelity Investment Managers as of
7
p p y p y , y y gSeptember 30, 2010.
For Institutional Use Only201010-8385

Portfolio Construction
Disciplined Portfolio Construction andRisk Management
Buy/Sell Discipline:
Region, sector and liquidity exposures
Return potential to targetReturn potential to target price = “upside”
Seek to exit positions when full valuations are reached, investment thesis deteriorates or better potential elsewhere
Monitor investment thesis
Realization of catalysts
Monitor liquidity and tradeMonitor liquidity and trade execution
For illustrative purposes only. Research resources depicted include the combined resources of Pyramis, Fidelity Investments and Fidelity Investment Managers as of
8
p p y p y , y y gSeptember 30, 2010.
For Institutional Use Only201010-8385

Fidelity's Global Research Resources
Local market coverage
Proprietary research
Research Professionals manage
Japan33 Research Professionals
Team France(2)
T
Pan Europe116 Research Professionals
Research Professionals manage industry / country funds
Main investment offices in London, Tokyo, Hong Kong & Boston with sub-investment offices in Paris, Frankfurt,
North/South America296 Research Professionals
Team Korea (3)
Team India (12)
Team Singapore (6)
Pacific ex-Japan52 Research Professionals
Mumbai, Seoul, Singapore & Sydney Team Australia (3)
Equity Research Professionals* International Equity Research Professionals**Since 1989
Europe 96Japan 33Pacific Ex-Japan 45Total International 174A i 206 60
80100120140160180200
Americas 206Total Worldwide 380
0204060
89 90 91 92 93 94 95 96 97 98 99 00 01 02 03 04 05 06 07 08 09 10YTD
* Source: FMR LLC, Pyramis Global Advisors, Fidelity Investment Managers as of June 30, 2010.** These figures reflect the combined resources of Pyramis, Fidelity Investments, and Fidelity Investment Managers. NB: Teams France, Germany and Italy are constituents of the Pan European total. Teams India, Korea, Singapore & Australia are constituents of the Pacific ex-Japan total.
9For Institutional Use Only201010-8385

Pyramis International Growth—Investment Parameters
Factors Parameters
Regional weights Benchmark weight ± 5.0%
Country weights Benchmark weight ± 5.0%
Industry group weights Benchmark weight ± 5.0%
Security weights Benchmark weight ± 3.0%
Market capitalization Benchmark weighted average ± 15.0%
201010-838510For Institutional Use Only
Investment Performance & Positioning
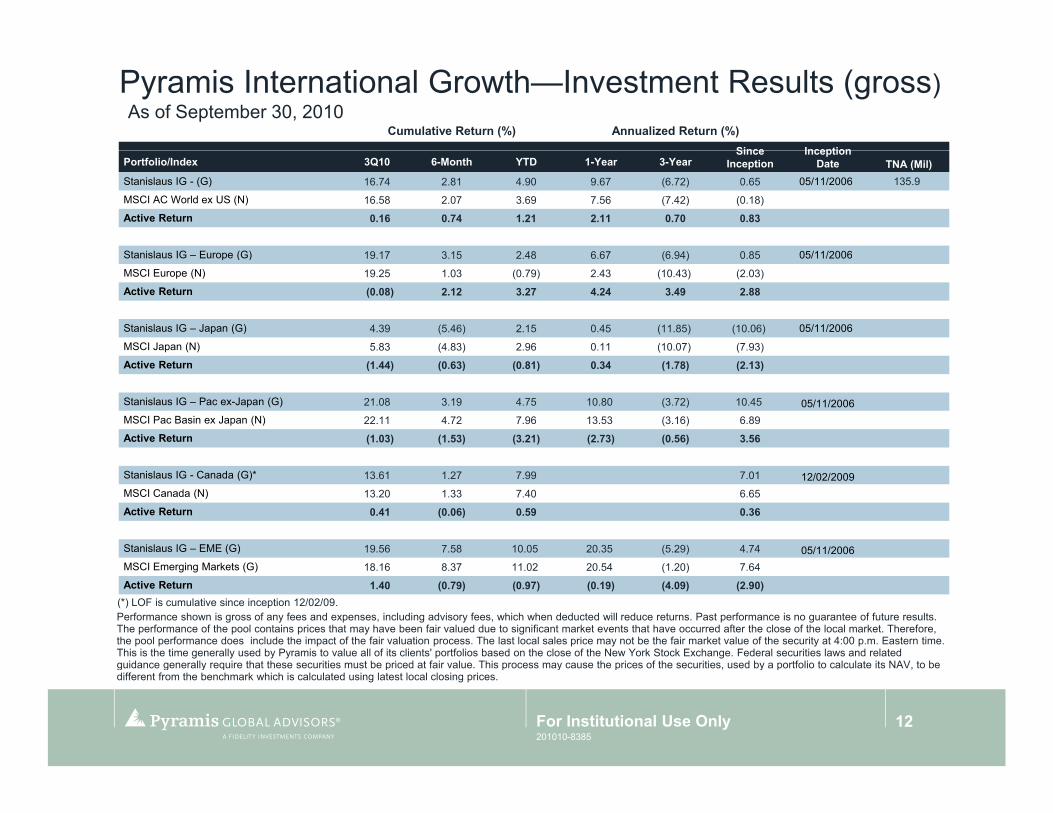
Pyramis International Growth—Investment Results (gross)As of September 30, 2010
Cumulative Return (%) Annualized Return (%)Since Inception
Portfolio/Index 3Q10 6-Month YTD 1-Year 3-YearSince
InceptionInception
Date TNA (Mil)Stanislaus IG - (G) 16.74 2.81 4.90 9.67 (6.72) 0.65 05/11/2006 135.9
MSCI AC World ex US (N) 16.58 2.07 3.69 7.56 (7.42) (0.18)
Active Return 0.16 0.74 1.21 2.11 0.70 0.83
Stanislaus IG Europe (G) 19 17 3 15 2 48 6 67 (6 94) 0 85 05/11/2006Stanislaus IG – Europe (G) 19.17 3.15 2.48 6.67 (6.94) 0.85 05/11/2006
MSCI Europe (N) 19.25 1.03 (0.79) 2.43 (10.43) (2.03)
Active Return (0.08) 2.12 3.27 4.24 3.49 2.88
Stanislaus IG – Japan (G) 4.39 (5.46) 2.15 0.45 (11.85) (10.06) 05/11/2006
MSCI Japan (N) 5.83 (4.83) 2.96 0.11 (10.07) (7.93)
Active Return (1.44) (0.63) (0.81) 0.34 (1.78) (2.13)
Stanislaus IG – Pac ex-Japan (G) 21.08 3.19 4.75 10.80 (3.72) 10.45 05/11/2006MSCI Pac Basin ex Japan (N) 22.11 4.72 7.96 13.53 (3.16) 6.89
Active Return (1.03) (1.53) (3.21) (2.73) (0.56) 3.56
Stanislaus IG - Canada (G)* 13.61 1.27 7.99 7.01 12/02/2009MSCI Canada (N) 13.20 1.33 7.40 6.65
Active Return 0.41 (0.06) 0.59 0.36
Stanislaus IG – EME (G) 19.56 7.58 10.05 20.35 (5.29) 4.74 05/11/2006
Performance shown is gross of any fees and expenses, including advisory fees, which when deducted will reduce returns. Past performance is no guarantee of future results. The performance of the pool contains prices that may have been fair valued due to significant market events that have occurred after the close of the local market. Therefore, the pool performance does include the impact of the fair valuation process. The last local sales price may not be the fair market value of the security at 4:00 p.m. Eastern time. This is the time generally used by Pyramis to value all of its clients' portfolios based on the close of the New York Stock Exchange. Federal securities laws and related guidance generally require that these securities must be priced at fair value This process may cause the prices of the securities used by a portfolio to calculate its NAV to be
MSCI Emerging Markets (G) 18.16 8.37 11.02 20.54 (1.20) 7.64
Active Return 1.40 (0.79) (0.97) (0.19) (4.09) (2.90)(*) LOF is cumulative since inception 12/02/09.
12For Institutional Use Only
guidance generally require that these securities must be priced at fair value. This process may cause the prices of the securities, used by a portfolio to calculate its NAV, to be different from the benchmark which is calculated using latest local closing prices.
201010-8385
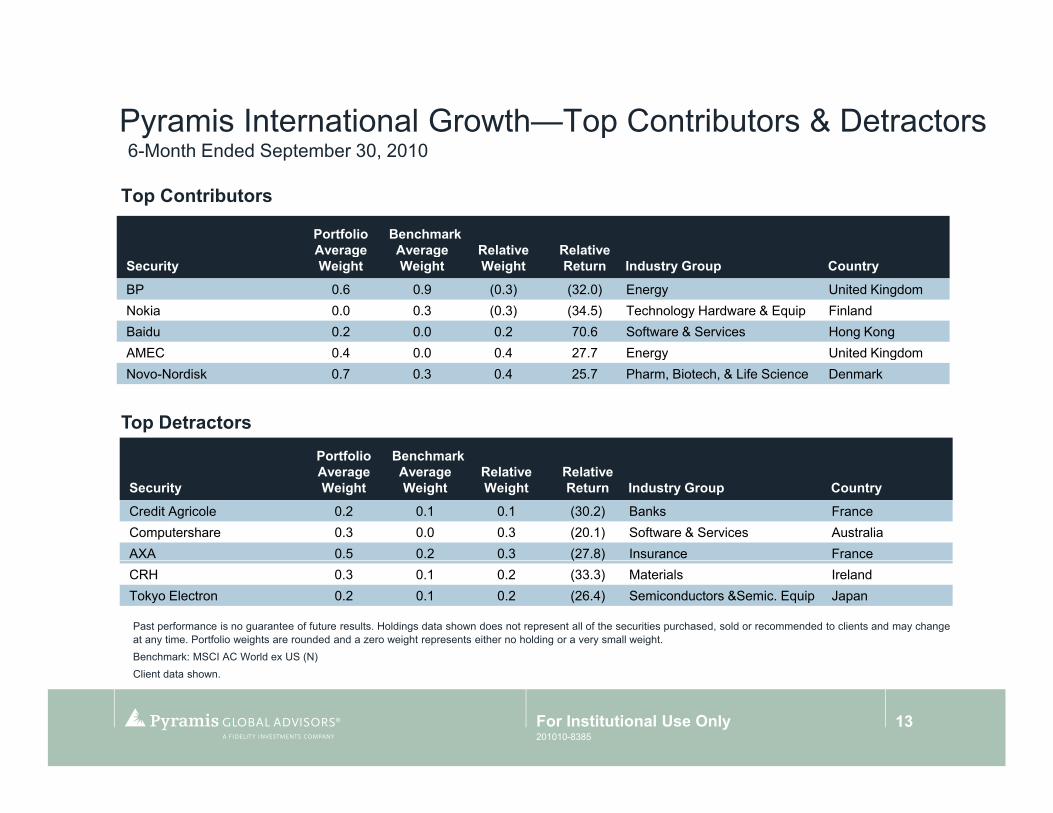
Pyramis International Growth—Top Contributors & Detractors6 Month Ended September 30 20106-Month Ended September 30, 2010
Top Contributors
Portfolio Average
Benchmark Average Relative Relative
SecurityAverage Weight
Average Weight
RelativeWeight
RelativeReturn Industry Group Country
BP 0.6 0.9 (0.3) (32.0) Energy United KingdomNokia 0.0 0.3 (0.3) (34.5) Technology Hardware & Equip FinlandBaidu 0.2 0.0 0.2 70.6 Software & Services Hong KongAMEC 0 4 0 0 0 4 27 7 Energy United KingdomAMEC 0.4 0.0 0.4 27.7 Energy United KingdomNovo-Nordisk 0.7 0.3 0.4 25.7 Pharm, Biotech, & Life Science Denmark
Top DetractorsPortfolio Benchmark
Security
Portfolio Average Weight
Benchmark Average Weight
RelativeWeight
RelativeReturn Industry Group Country
Credit Agricole 0.2 0.1 0.1 (30.2) Banks FranceComputershare 0.3 0.0 0.3 (20.1) Software & Services AustraliaAXA 0.5 0.2 0.3 (27.8) Insurance France
Past performance is no guarantee of future results. Holdings data shown does not represent all of the securities purchased, sold or recommended to clients and may change at any time. Portfolio weights are rounded and a zero weight represents either no holding or a very small weight. Benchmark: MSCI AC World ex US (N)
( )CRH 0.3 0.1 0.2 (33.3) Materials IrelandTokyo Electron 0.2 0.1 0.2 (26.4) Semiconductors &Semic. Equip Japan
Client data shown.
13For Institutional Use Only201010-8385
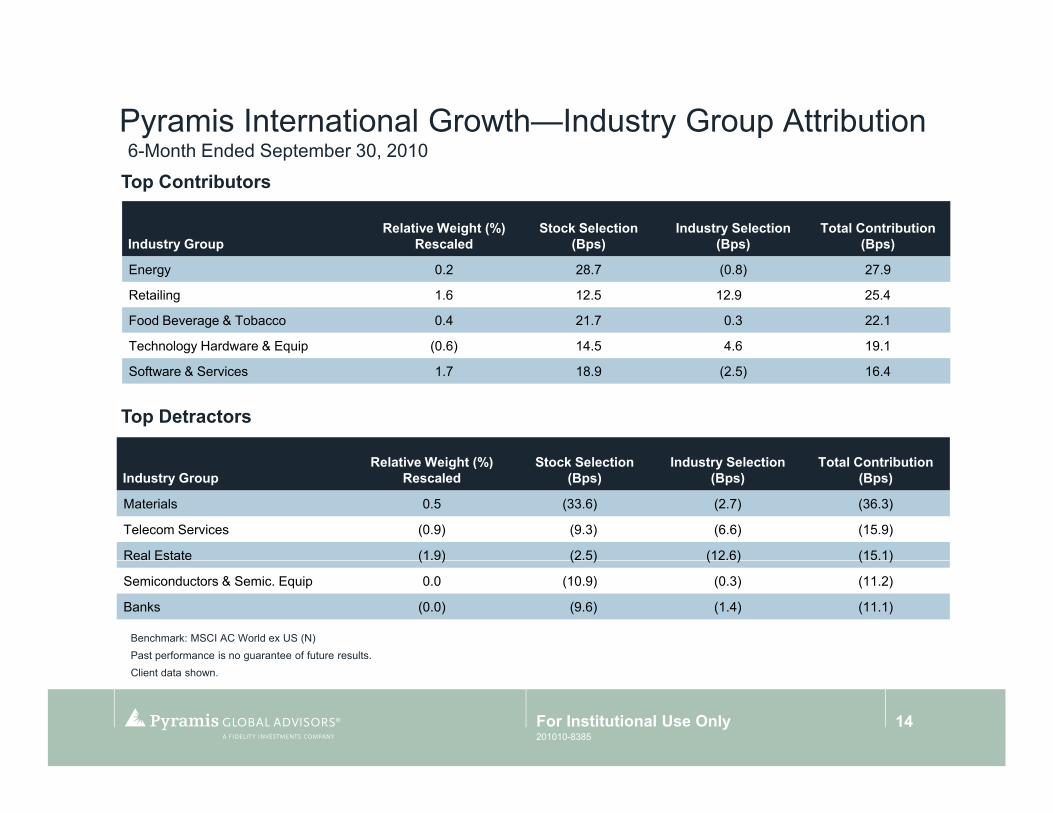
Pyramis International Growth—Industry Group Attribution6 Month Ended September 30 20106-Month Ended September 30, 2010
Industry GroupRelative Weight (%)
RescaledStock Selection
(Bps)Industry Selection
(Bps)Total Contribution
(Bps)
Top Contributors
Energy 0.2 28.7 (0.8) 27.9
Retailing 1.6 12.5 12.9 25.4
Food Beverage & Tobacco 0.4 21.7 0.3 22.1
Technology Hardware & Equip (0.6) 14.5 4.6 19.1
Software & Services 1.7 18.9 (2.5) 16.4
Top Detractors
R l ti W i ht (%) St k S l ti I d t S l ti T t l C t ib tiIndustry Group
Relative Weight (%) Rescaled
Stock Selection (Bps)
Industry Selection (Bps)
Total Contribution (Bps)
Materials 0.5 (33.6) (2.7) (36.3)
Telecom Services (0.9) (9.3) (6.6) (15.9)
Real Estate (1.9) (2.5) (12.6) (15.1)
Benchmark: MSCI AC World ex US (N)Past performance is no guarantee of future results.
( ) ( ) ( ) ( )
Semiconductors & Semic. Equip 0.0 (10.9) (0.3) (11.2)
Banks (0.0) (9.6) (1.4) (11.1)
Client data shown.
14For Institutional Use Only201010-8385

Pyramis International Growth—Regional and Country AllocationsAs of September 30 2010As of September 30, 2010
Regional AllocationPortfolio Weight (%) MSCI EAFE (N) (%) Difference
Europe 43.9 45.2 (1.3)
Japan 13.7 14.5 (0.8)
Pacific Ex Japan 9.1 9.0 0.1
Canada 7.7 7.6 0.1
EME 25.6 23.7 1.9
Active Weight Versus Index* (%)
EME 25.6 23.7 1.9
3.03.5
ht
-0.50.00.51.01.52.02.5
Perc
ent A
ctiv
e W
eigh
-1.5-1.0
P
*Relative to the MSCI AC World ex US (N)
15For Institutional Use Only201010-8385

International Growth—Top/Bottom 5 Industry Active Weights As of September 30 2010
4.0
As of September 30, 2010
Active Weight Versus Index* (%)
1.8 1.6 1.2 1.1 1.0
-1.0
0.0
1.0
2.0
3.0
rcen
t Act
ive
Wei
ght
(1.0) (1.1)(1.5)
(2.3)(2.3)-3.0
-2.0Per
*Relative to the MSCI AC World ex US (N)Client data shown.
16For Institutional Use Only201010-8385
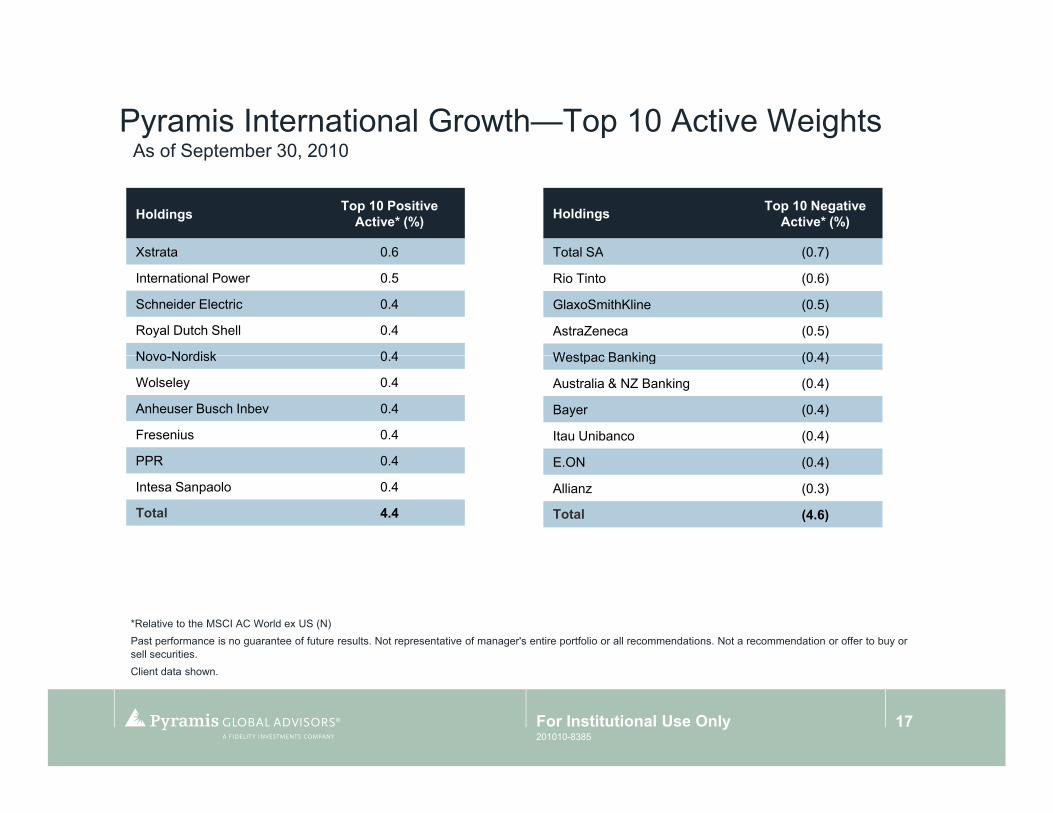
Pyramis International Growth—Top 10 Active WeightsAs of September 30 2010As of September 30, 2010
Holdings Top 10 Positive Active* (%)
Xstrata 0 6
Holdings Top 10 Negative Active* (%)
Total SA (0 7)Xstrata 0.6
International Power 0.5
Schneider Electric 0.4
Royal Dutch Shell 0.4
Novo Nordisk 0 4
Total SA (0.7)
Rio Tinto (0.6)
GlaxoSmithKline (0.5)
AstraZeneca (0.5)
Westpac Banking (0 4)Novo-Nordisk 0.4
Wolseley 0.4
Anheuser Busch Inbev 0.4
Fresenius 0.4
PPR 0 4
Westpac Banking (0.4)
Australia & NZ Banking (0.4)
Bayer (0.4)
Itau Unibanco (0.4)
E ON (0 4)PPR 0.4
Intesa Sanpaolo 0.4
Total 4.4
E.ON (0.4)
Allianz (0.3)
Total (4.6)
*Relative to the MSCI AC World ex US (N)Past performance is no guarantee of future results. Not representative of manager's entire portfolio or all recommendations. Not a recommendation or offer to buy or sell securities.Client data shown.
17For Institutional Use Only201010-8385

Appendix

Europe Growth—Top Contributors & Detractors6 Month Ended September 30 20106-Month Ended September 30, 2010
Top Contributors
Security
Portfolio Average W i ht
Benchmark Average W i ht
Relative W i ht
Relative R t I d t C tSecurity Weight Weight Weight Return Industry Country
BP 1.4 2.1 (0.7) (31.0) Energy United Kingdom
Nokia 0.0 0.6 (0.6) (33.4) Technology Hardware & Equip Finland
AMEC 1.0 0.1 0.9 28.8 Energy United Kingdom
Novo Nordisk 1 5 0 6 0 9 26 7 Pharm Biotech & Life Science Denmark
Portfolio Benchmark
Top Detractors
Novo-Nordisk 1.5 0.6 0.9 26.7 Pharm, Biotech, & Life Science Denmark
Centrica 1.4 0.4 1.0 18.3 Utilities United Kingdom
Security
Portfolio Average Weight
Benchmark Average Weight
Relative Weight
Relative Return Industry Country
AXA 1.1 0.5 0.6 (26.7) Insurance France
Credit Agricole 0.4 0.2 0.2 (29.2) Banks France
CRH 0 7 0 2 0 5 (32 3) Materials IrelandCRH 0.7 0.2 0.5 (32.3) Materials Ireland
AstraZeneca 0.0 1.1 (1.1) 14.8 Pharm, Biotech, & Life Science United Kingdom
Bayer 0.8 0.8 0.0 (12.5) Pharm, Biotech, & Life Science Germany
Past performance is no guarantee of future results. Holdings data shown does not represent all of the securities purchased, sold or recommended to clients and may change at any time. Portfolio weights are rounded and a zero weight represents either no holding or a very small weight.Benchmark: MSCI Eur/MSCI Eur & ME (N) IndexBenchmark: MSCI Eur/MSCI Eur & ME (N) Index
Client data shown.
19For Institutional Use Only201010-8385

Europe Growth—Industry Group Attribution 6 Month Ended September 30 20106-Month Ended September 30, 2010
I d t GRelative Weight (%)
R l dStock Selection
(B )Industry Selection
(B )Total Contribution
(B )
Top Contributors
Industry Group Rescaled (Bps) (Bps) (Bps)
Energy 1.2 80.9 (7.4) 73.5
Utilities (1.7) 36.2 12.0 48.1
Food Beverage & Tobacco 1.0 26.4 0.3 26.7
H lth C E i t & S 1 1 22 7 (1 0) 21 7Health Care Equipment & Svcs. 1.1 22.7 (1.0) 21.7
Retailing 0.6 14.4 6.3 20.7
Top Detractors
Industry GroupRelative Weight (%)
RescaledStock Selection
(Bps)Industry Selection
(Bps)Total Contribution
(Bps)
Pharm, Biotech, & Life Science (1.0) (25.5) (10.0) (35.5)
Materials 0.1 (28.2) (4.4) (32.6)
Telecom Services (1 8) (3 6) (15 1) (18 6)Telecom Services (1.8) (3.6) (15.1) (18.6)
Banks 0.5 (13.9) (3.6) (17.6)
Insurance (0.2) (13.1) (1.0) (14.2)
Past performance is no guarantee of future results.
Benchmark: MSCI Eur/MSCI Eur & ME (N) Index
Client data shown.
20For Institutional Use Only201010-8385

Europe Growth—Sector Relative WeightsAs of September 30 2010As of September 30, 2010
Active Weight Versus Index* (%)
2.0 1.7 1.6
0.4
(0.4) (0.6) (0.7) (0.9)-1.0
0.0
1.0
2.0
3.0
ent A
ctiv
e W
eigh
t
( )
(2.0)
(2.9)-3.0
-2.0
Perc
e
*Relative to the MSCI Eur/MSCI Eur & ME (N) Index
21For Institutional Use Only201010-8385

Europe Growth—Top 10 Active WeightsAs of September 30 2010As of September 30, 2010
Holdings Top 10 Positive Active* (%)
International Power 1 1
Holdings Top 10 Negative Active* (%)
Total SA (1 6)International Power 1.1
Royal Dutch Shell 1.1
Schneider Electric 1.0
Xstrata 1.0
Novo Nordisk 1 0
Total SA (1.6)
Rio Tinto (1.3)
GlaxoSmithKline (1.2)
Astrazeneca (1.1)
Bayer (0 9)Novo-Nordisk 1.0
Anheuser Busch Inbev 1.0
Wolseley 1.0
Intesa Sanpaolo 0.9
PPR 0 9
Bayer (0.9)
E.ON (0.8)
Allianz (0.8)
Deutsche Bank (0.8)
U il (0 7)PPR 0.9
Fresenius 0.9
Total 9.8
Unilever (0.7)
Banco Bilbao Viz Argentaria (0.7)
Total (9.7)
*Relative to the MSCI Eur/MSCI Eur & ME (N) Index Past performance is no guarantee of future results. Not representative of manager's entire portfolio or all recommendations. Not a recommendation or offer to buy or sell securities. Client data shown.
22For Institutional Use Only201010-8385
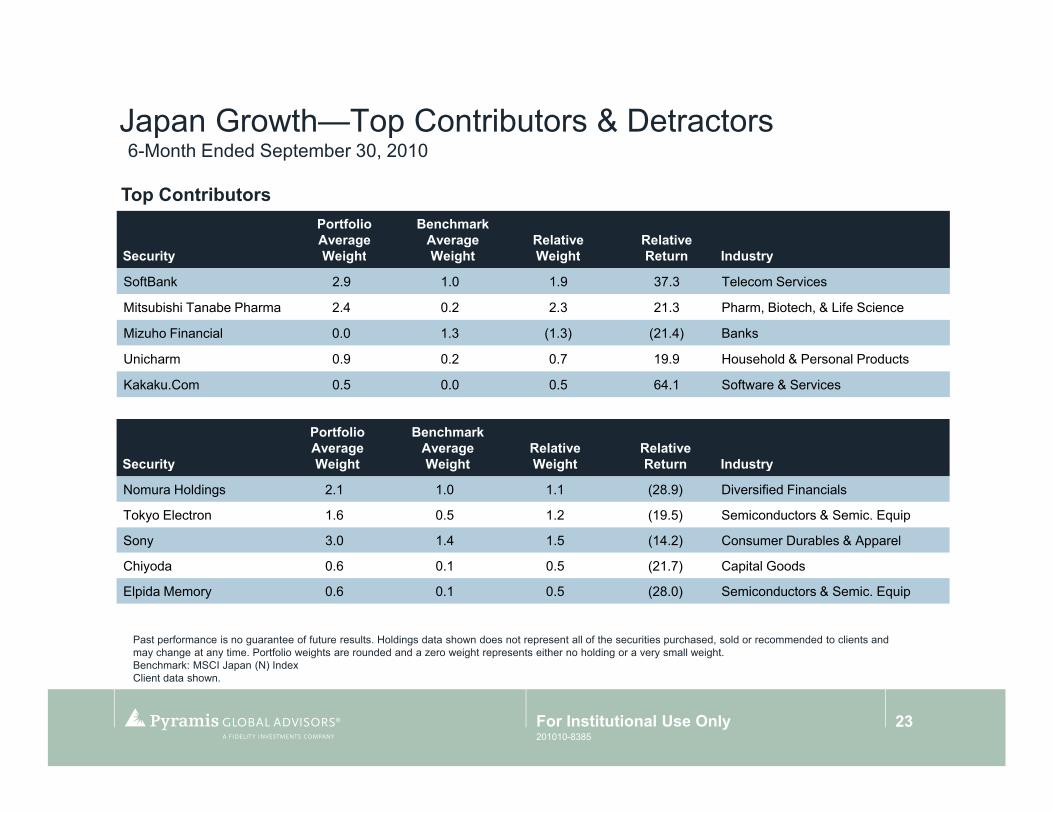
Japan Growth—Top Contributors & Detractors6 Month Ended September 30 20106-Month Ended September 30, 2010
S it
Portfolio Average W i ht
Benchmark Average W i ht
RelativeW i ht
RelativeR t I d t
Top Contributors
Security Weight Weight Weight Return Industry
SoftBank 2.9 1.0 1.9 37.3 Telecom Services
Mitsubishi Tanabe Pharma 2.4 0.2 2.3 21.3 Pharm, Biotech, & Life Science
Mizuho Financial 0.0 1.3 (1.3) (21.4) Banks
U i h 0 9 0 2 0 7 19 9 H h ld & P l P d tUnicharm 0.9 0.2 0.7 19.9 Household & Personal Products
Kakaku.Com 0.5 0.0 0.5 64.1 Software & Services
Top Detractors Portfolio Average
Benchmark Average Relative Relative
Security Weight Weight Weight Return Industry
Nomura Holdings 2.1 1.0 1.1 (28.9) Diversified Financials
Tokyo Electron 1.6 0.5 1.2 (19.5) Semiconductors & Semic. Equip
Sony 3.0 1.4 1.5 (14.2) Consumer Durables & Apparel
Past performance is no guarantee of future results. Holdings data shown does not represent all of the securities purchased, sold or recommended to clients and may change at any time. Portfolio weights are rounded and a zero weight represents either no holding or a very small weight.B h k MSCI J (N) I d
Chiyoda 0.6 0.1 0.5 (21.7) Capital Goods
Elpida Memory 0.6 0.1 0.5 (28.0) Semiconductors & Semic. Equip
Benchmark: MSCI Japan (N) IndexClient data shown.
23For Institutional Use Only201010-8385

Japan Growth—Industry Group Attribution 6 Month Ended September 30 2010
I d t GRelative Weight (%)
R l dStock Selection
(b )Industry Selection
(b )Total Contribution
(b )
6-Month Ended September 30, 2010
Top Contributors
Industry Group Rescaled (bps) (bps) (bps)
Telecom Services 0.2 43.1 1.3 44.4
Software & Services (0.0) 43.1 (4.3) 38.9
Household & Personal Products 0.7 21.7 10.3 32.0
Banks (0 9) 28 7 (1 2) 27 5Banks (0.9) 28.7 (1.2) 27.5
Insurance (0.3) 21.4 3.9 25.3
R l ti W i ht (%) St k S l ti I d t S l ti T t l C t ib ti
Top Detractors
Industry GroupRelative Weight (%)
RescaledStock Selection
(bps)Industry Selection
(bps)Total Contribution
(bps)
Semiconductors & Semic. Equip 2.2 (8.3) (50.3) (58.6)
Materials 0.8 (34.7) (6.4) (41.1)
Diversified Financials 2.0 17.2 (53.6) (36.4)( ) ( )
Capital Goods 1.0 (26.4) (5.9) (32.4)
Transportation (3.1) (12.5) (18.2) (30.7)
Past performance is no guarantee of future results. Benchmark: MSCI Japan (N) IndexBenchmark: MSCI Japan (N) IndexClient data shown.
24For Institutional Use Only201010-8385

Japan Growth—Sector Relative WeightsAs of September 30 2010
2 7
As of September 30, 2010
Active Weight Versus Index* (%)
2.7
1.0 0.5 0.3
(0.1)0.0
1.0
2.0
3.0
Act
ive
Wei
ght
(0.1) (0.4)
(1.2) (1.4) (1.5)
(2.7)-3.0
-2.0
-1.0
Per
cen
t
*Relative to the MSCI Japan (N) Index
25For Institutional Use Only201010-8385
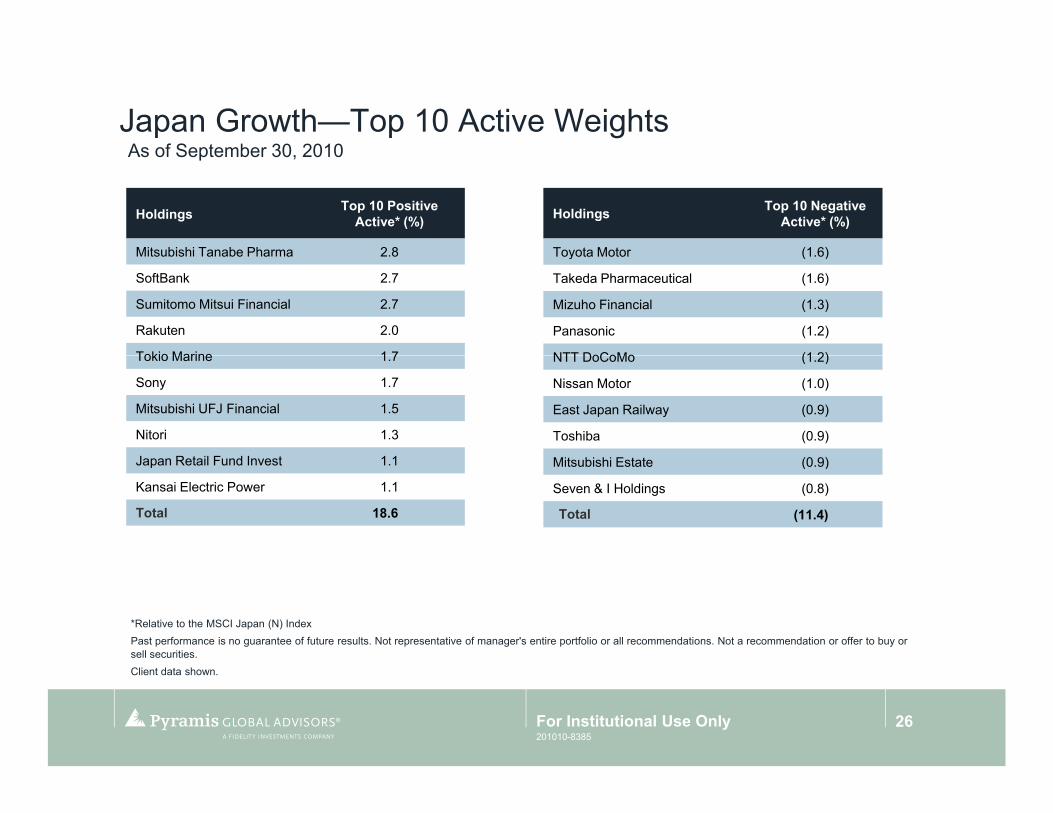
Japan Growth—Top 10 Active WeightsAs of September 30 2010As of September 30, 2010
Holdings Top 10 Positive Active* (%)
Mitsubishi Tanabe Pharma 2 8
Holdings Top 10 Negative Active* (%)
Toyota Motor (1 6)Mitsubishi Tanabe Pharma 2.8
SoftBank 2.7
Sumitomo Mitsui Financial 2.7
Rakuten 2.0
Tokio Marine 1 7
Toyota Motor (1.6)
Takeda Pharmaceutical (1.6)
Mizuho Financial (1.3)
Panasonic (1.2)
NTT DoCoMo (1 2)Tokio Marine 1.7
Sony 1.7
Mitsubishi UFJ Financial 1.5
Nitori 1.3
J R t il F d I t 1 1
NTT DoCoMo (1.2)
Nissan Motor (1.0)
East Japan Railway (0.9)
Toshiba (0.9)
Mit bi hi E t t (0 9)Japan Retail Fund Invest 1.1
Kansai Electric Power 1.1
Total 18.6
Mitsubishi Estate (0.9)
Seven & I Holdings (0.8)
Total (11.4)
*Relative to the MSCI Japan (N) IndexPast performance is no guarantee of future results. Not representative of manager's entire portfolio or all recommendations. Not a recommendation or offer to buy or sell securities.Client data shown.
26For Institutional Use Only201010-8385
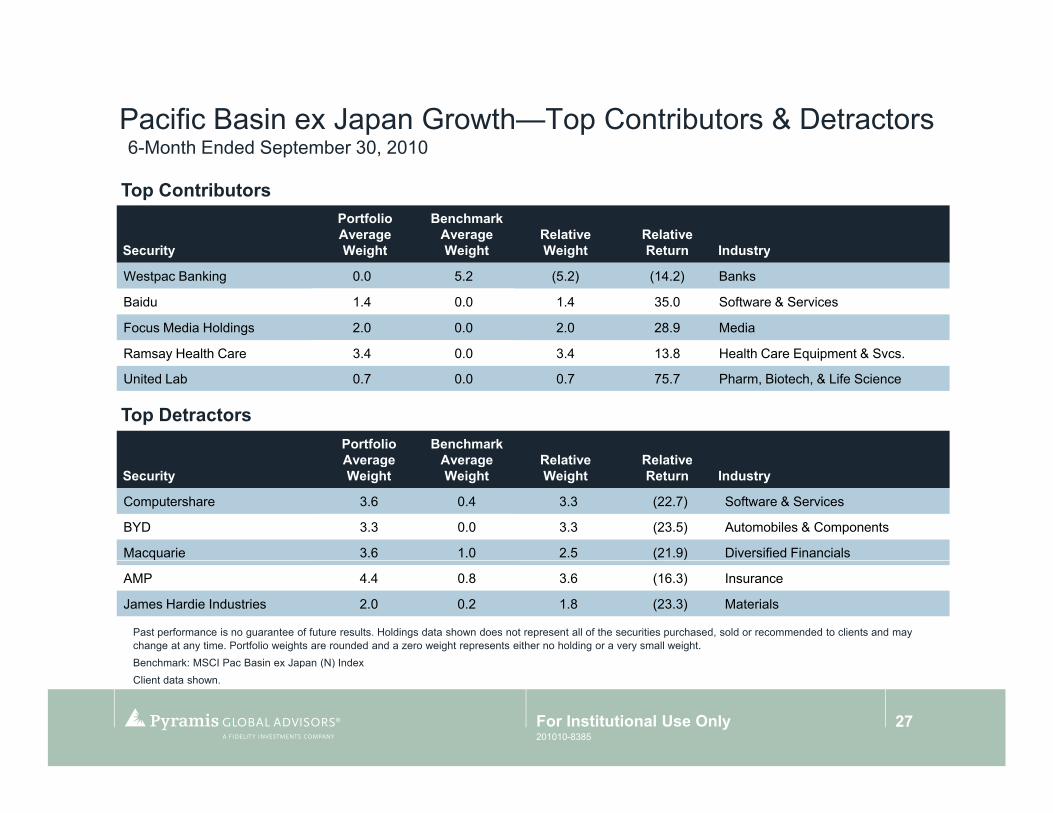
Pacific Basin ex Japan Growth—Top Contributors & Detractors6-Month Ended September 30 20106 Month Ended September 30, 2010
Security
Portfolio Average Weight
Benchmark Average Weight
Relative Weight
RelativeReturn Industry
Top Contributors
Security Weight Weight Weight Return Industry
Westpac Banking 0.0 5.2 (5.2) (14.2) Banks
Baidu 1.4 0.0 1.4 35.0 Software & Services
Focus Media Holdings 2.0 0.0 2.0 28.9 Media
Ramsay Health Care 3 4 0 0 3 4 13 8 Health Care Equipment & SvcsRamsay Health Care 3.4 0.0 3.4 13.8 Health Care Equipment & Svcs.
United Lab 0.7 0.0 0.7 75.7 Pharm, Biotech, & Life Science
Top DetractorsPortfolio Average
Benchmark Average Relative Relative
SecurityAverage Weight
Average Weight
Relative Weight
RelativeReturn Industry
Computershare 3.6 0.4 3.3 (22.7) Software & Services
BYD 3.3 0.0 3.3 (23.5) Automobiles & Components
Macquarie 3.6 1.0 2.5 (21.9) Diversified Financials
AMP 4.4 0.8 3.6 (16.3) Insurance
James Hardie Industries 2.0 0.2 1.8 (23.3) Materials
Past performance is no guarantee of future results. Holdings data shown does not represent all of the securities purchased, sold or recommended to clients and may change at any time. Portfolio weights are rounded and a zero weight represents either no holding or a very small weight.Benchmark: MSCI Pac Basin ex Japan (N) IndexBenchmark: MSCI Pac Basin ex Japan (N) IndexClient data shown.
27For Institutional Use Only201010-8385
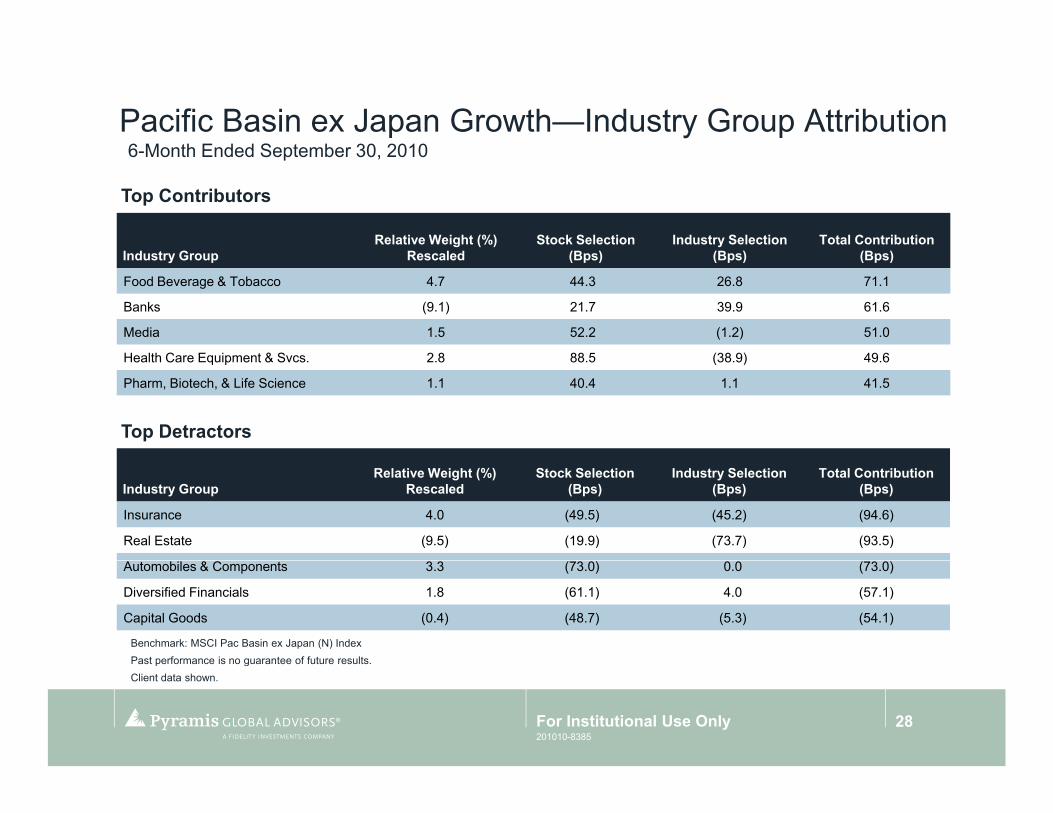
Pacific Basin ex Japan Growth—Industry Group Attribution6 Month Ended September 30 20106-Month Ended September 30, 2010
I d t GRelative Weight (%)
R l dStock Selection
(B )Industry Selection
(B )Total Contribution
(B )
Top Contributors
Industry Group Rescaled (Bps) (Bps) (Bps)
Food Beverage & Tobacco 4.7 44.3 26.8 71.1
Banks (9.1) 21.7 39.9 61.6
Media 1.5 52.2 (1.2) 51.0
Health Care Equipment & Svcs 2 8 88 5 (38 9) 49 6Health Care Equipment & Svcs. 2.8 88.5 (38.9) 49.6
Pharm, Biotech, & Life Science 1.1 40.4 1.1 41.5
Top Detractors
Industry GroupRelative Weight (%)
RescaledStock Selection
(Bps)Industry Selection
(Bps)Total Contribution
(Bps)
Insurance 4.0 (49.5) (45.2) (94.6)
Real Estate (9.5) (19.9) (73.7) (93.5)
Benchmark: MSCI Pac Basin ex Japan (N) IndexPast performance is no guarantee of future results.
Automobiles & Components 3.3 (73.0) 0.0 (73.0)
Diversified Financials 1.8 (61.1) 4.0 (57.1)
Capital Goods (0.4) (48.7) (5.3) (54.1)
Past performance is no guarantee of future results.Client data shown.
28For Institutional Use Only201010-8385
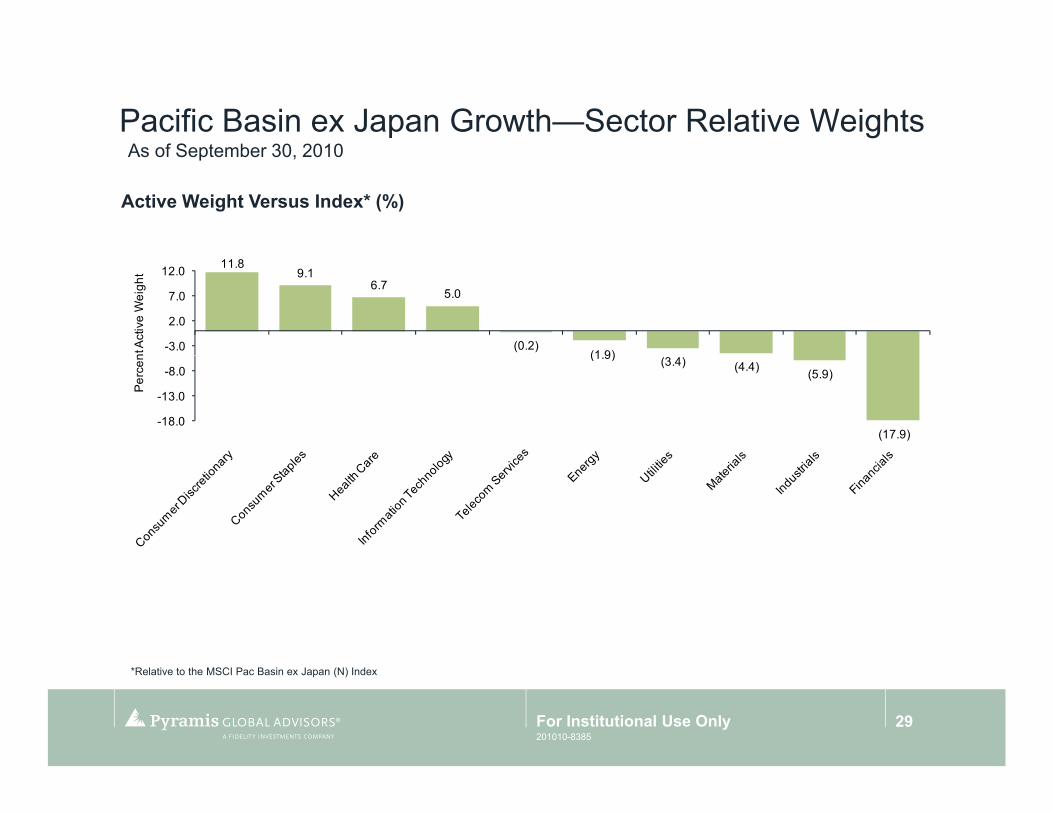
Pacific Basin ex Japan Growth—Sector Relative WeightsAs of September 30 2010As of September 30, 2010
Active Weight Versus Index* (%)
11.8 9.1
6.7 5.0
(0.2)(1 9)
-3.0
2.0
7.0
12.0
nt A
ctiv
e W
eigh
t
(1.9) (3.4) (4.4) (5.9)
(17.9)-18.0
-13.0
-8.0
Per
cen
*Relative to the MSCI Pac Basin ex Japan (N) Index
29For Institutional Use Only201010-8385

Pacific Basin ex Japan Growth—Top 10 Active WeightsAs of September 30 2010As of September 30, 2010
Holdings Top 10 Positive Active* (%)
BYD 4 2
Holdings Top 10 Negative Active* (%)
Westpac Banking (5 0)BYD 4.2
Tencent 4.2
Ramsay Health Care 3.5
Coca Cola Amatil 2.9
AMP 2 9
Westpac Banking (5.0)
Australia & NZ Banking (4.3)
Newcrest Mining (2.2)
Westfield Group (1.9)
Sun Hung Kai Properties (1 8)AMP 2.9
Li & Fung 2.9
CSL Limited 2.6
Genting Singapore 2.2
F t G 2 2
Sun Hung Kai Properties (1.8)
Cheung Kong (1.6)
Hutchison Whampoa (1.5)
DBS Group Holdings (1.4)
U it d O B k (1 3)Fosters Group 2.2
Singapore Exchange 2.2
Total 29.8
United Overseas Bank (1.3)
Oversea-Chinese Banking (1.2)
Total (22.1)
*Relative to the MSCI Pac Basin ex Japan (N) IndexPast performance is no guarantee of future results. Not representative of manager's entire portfolio or all recommendations. Not a recommendation or offer to buy or sell securities.Client data shown.
30For Institutional Use Only201010-8385
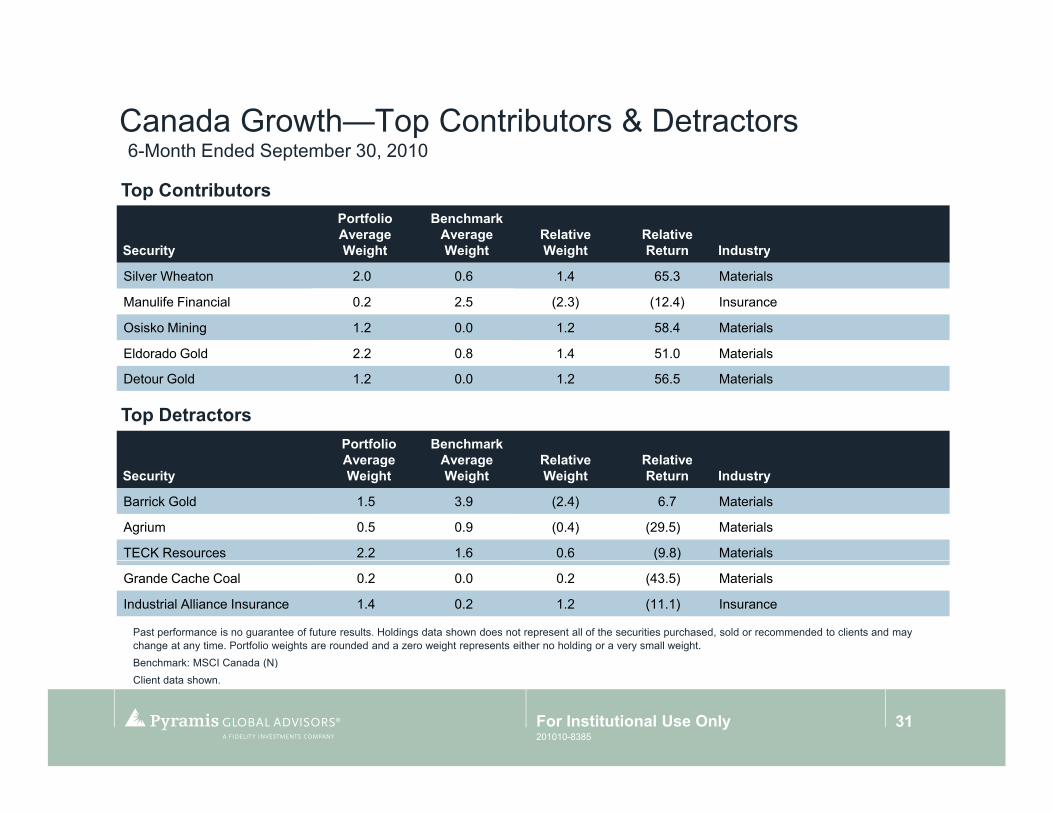
Canada Growth—Top Contributors & Detractors6 Month Ended September 30 20106-Month Ended September 30, 2010
Security
Portfolio Average Weight
Benchmark Average Weight
Relative Weight
RelativeReturn Industry
Top Contributors
Security Weight Weight Weight Return Industry
Silver Wheaton 2.0 0.6 1.4 65.3 Materials
Manulife Financial 0.2 2.5 (2.3) (12.4) Insurance
Osisko Mining 1.2 0.0 1.2 58.4 Materials
Eldorado Gold 2 2 0 8 1 4 51 0 MaterialsEldorado Gold 2.2 0.8 1.4 51.0 Materials
Detour Gold 1.2 0.0 1.2 56.5 Materials
Top DetractorsPortfolio Average
Benchmark Average Relative Relative
SecurityAverage Weight
Average Weight
Relative Weight
RelativeReturn Industry
Barrick Gold 1.5 3.9 (2.4) 6.7 Materials
Agrium 0.5 0.9 (0.4) (29.5) Materials
TECK Resources 2.2 1.6 0.6 (9.8) Materials
Grande Cache Coal 0.2 0.0 0.2 (43.5) Materials
Industrial Alliance Insurance 1.4 0.2 1.2 (11.1) Insurance
Past performance is no guarantee of future results. Holdings data shown does not represent all of the securities purchased, sold or recommended to clients and may change at any time. Portfolio weights are rounded and a zero weight represents either no holding or a very small weight.Benchmark: MSCI Canada (N)Benchmark: MSCI Canada (N)Client data shown.
31For Institutional Use Only201010-8385

Canada Growth—Industry Group Attribution6 Month Ended September 30 20106-Month Ended September 30, 2010
I d t GRelative Weight (%)
R l dStock Selection
(B )Industry Selection
(B )Total Contribution
(B )
Top Contributors
Industry Group Rescaled (Bps) (Bps) (Bps)
Insurance (4.0) (3.5) 77.0 73.4
Technology Hardware & Equip (1.2) (8.9) 36.7 27.8
Pharm, Biotech, & Life Science 0.6 1.1 15.5 16.6
Materials (0 1) 11 6 (0 1) 11 6Materials (0.1) 11.6 (0.1) 11.6
Consumer Services 1.1 (0.9) 9.4 8.4
Top Detractors
Industry GroupRelative Weight (%)
RescaledStock Selection
(Bps)Industry Selection
(Bps)Total Contribution
(Bps)
Food & Staples Retailing 0.4 (26.1) (2.4) (28.5)
Banks 1.1 (13.2) (11.5) (24.8)
Benchmark: MSCI Canada (N)Past performance is no guarantee of future results.
Energy (0.5) (13.8) (9.4) (23.2)
Telecom Services 0.1 (16.3) (3.7) (20.0)
Diversified Financials 0.6 (6.0) (12.1) (18.1)
Past performance is no guarantee of future results.Client data shown.
32For Institutional Use Only201010-8385

Canada Growth—Sector Relative WeightsAs of September 30 2010As of September 30, 2010
Active Weight Versus Index* (%)
4.5
2.2 2.0
0.1 0.0
2.5
5.0
nt A
ctiv
e W
eigh
t
(0.4) (0.7) (1.2) (1.7) (1.8)
(3.7)-5.0
-2.5Per
cen
*Relative to the MSCI Canada (N) Index
33For Institutional Use Only201010-8385

Canada Growth—Top 10 Active WeightsAs of September 30 2010As of September 30, 2010
Holdings Top 10 Positive Active* (%)
Silver Wheaton 2 9
Holdings Top 10 Negative Active* (%)
Barrick Gold (4 0)Silver Wheaton 2.9
Toronto-Dominion Bank 2.5
Potash Corp of Saskatchewan 2.5
Cenovus Energy 2.4
Osisko Mining 2 3
Barrick Gold (4.0)
Canadian Natl Resources (3.3)
Bank of Montreal (2.8)
Goldcorp (2.8)
Canadian Bank of Commerce (2 5)Osisko Mining 2.3
Keyera Facilities Income 2.2
Detour Gold 2.1
Baytex Energy 2.0
Eldorado Gold 1 9
Canadian Bank of Commerce (2.5)
TransCanada (2.2)
Research In Motion (2.1)
Encana (2.0)
M lif Fi i l (1 9)Eldorado Gold 1.9
Crescent Point Energy 1.8
Total 22.6
Manulife Financial (1.9)
Kinross Gold (1.8)
Total (25.5)
*Relative to the MSCI Canada (N) IndexPast performance is no guarantee of future results. Not representative of manager's entire portfolio or all recommendations. Not a recommendation or offer to buy or sell securities.Client data shown.
34For Institutional Use Only201010-8385

Emerging Markets Growth—Top Contributors & Detractors6 Month Ended September 30 20106-Month Ended September 30, 2010
Security
Portfolio Average Weight
Benchmark Average Weight
Relative Weight
RelativeReturn Industry
Top Contributors
Security Weight Weight Weight Return Industry
Gudang Garam 0.4 0.1 0.4 106.8 Food Beverage & Tobacco
China Life Insurance 0.0 1.0 (1.0) (24.1) Insurance
HTC 0.7 0.3 0.4 73.5 Technology Hardware & Equip
Baidu 0 5 0 0 0 5 62 8 Software & ServicesBaidu 0.5 0.0 0.5 62.8 Software & Services
Hyundai Mobis 0.8 0.4 0.4 61.3 Automobiles & Components
Top DetractorsPortfolio Average
Benchmark Average Relative Relative
SecurityAverage Weight
Average Weight
Relative Weight
RelativeReturn Industry
OTP Bank 0.7 0.2 0.5 (42.8) Banks
Evraz Group 0.5 0.0 0.5 (32.7) Materials
Rosneft 1.1 0.3 0.7 (24.1) Energy
VimpelCom 0.4 0.0 0.4 (26.4) Telecom Services
Ternium 0.5 0.0 0.5 (28.6) Materials
Past performance is no guarantee of future results. Holdings data shown does not represent all of the securities purchased, sold or recommended to clients and may change at any time. Portfolio weights are rounded and a zero weight represents either no holding or a very small weight.Benchmark: MSCI Emerging Markets (G)Benchmark: MSCI Emerging Markets (G)Client data shown.
35For Institutional Use Only201010-8385
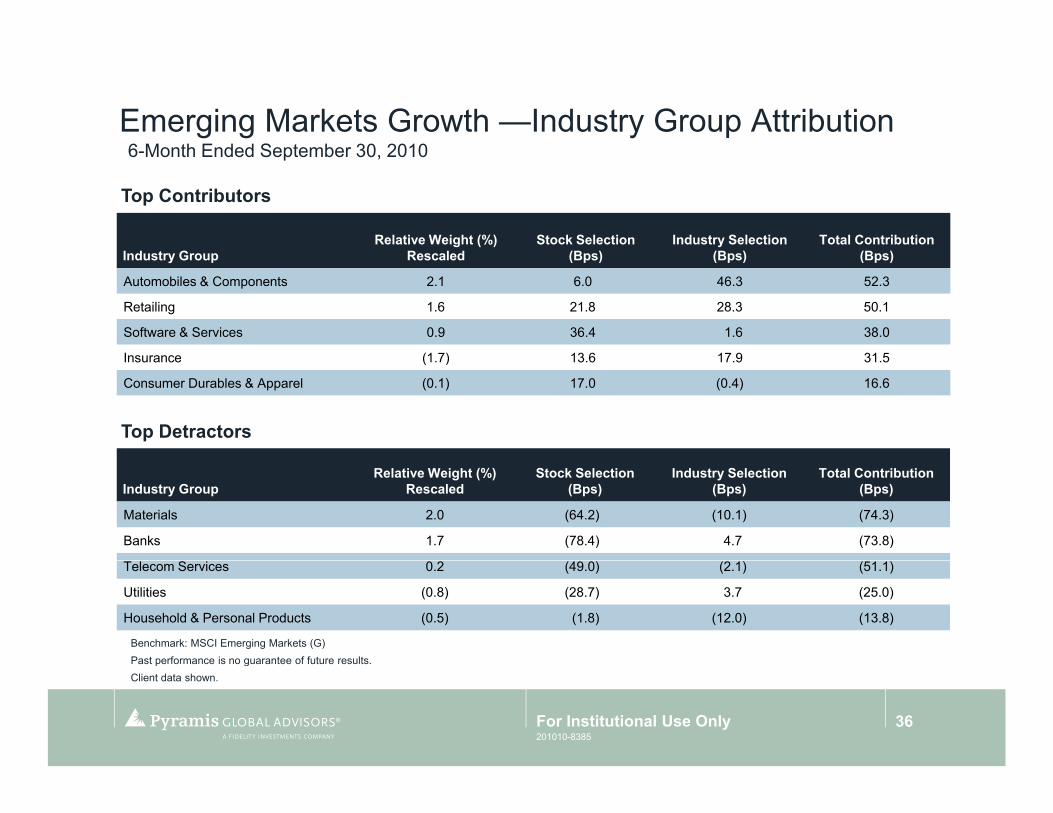
Emerging Markets Growth —Industry Group Attribution6 Month Ended September 30 20106-Month Ended September 30, 2010
I d t GRelative Weight (%)
R l dStock Selection
(B )Industry Selection
(B )Total Contribution
(B )
Top Contributors
Industry Group Rescaled (Bps) (Bps) (Bps)
Automobiles & Components 2.1 6.0 46.3 52.3
Retailing 1.6 21.8 28.3 50.1
Software & Services 0.9 36.4 1.6 38.0
Insurance (1 7) 13 6 17 9 31 5Insurance (1.7) 13.6 17.9 31.5
Consumer Durables & Apparel (0.1) 17.0 (0.4) 16.6
Top Detractors
Industry GroupRelative Weight (%)
RescaledStock Selection
(Bps)Industry Selection
(Bps)Total Contribution
(Bps)
Materials 2.0 (64.2) (10.1) (74.3)
Banks 1.7 (78.4) 4.7 (73.8)
Benchmark: MSCI Emerging Markets (G)Past performance is no guarantee of future results.
Telecom Services 0.2 (49.0) (2.1) (51.1)
Utilities (0.8) (28.7) 3.7 (25.0)
Household & Personal Products (0.5) (1.8) (12.0) (13.8)
Past performance is no guarantee of future results.Client data shown.
36For Institutional Use Only201010-8385

Emerging Markets Growth—Sector Relative WeightsAs of September 30 2010As of September 30, 2010
Active Weight Versus Index* (%)
3.7
1.7 0.8 0.4
0.0
2.5
5.0
nt A
ctiv
e W
eigh
t
(0.3)(1.1) (1.4) (1.5) (1.9) (2.1)
-5.0
-2.5Per
cen
*Relative to the MSCI Emerging Markets (G)
37For Institutional Use Only201010-8385

Emerging Markets Growth—Top 10 Active WeightsAs of September 30 2010As of September 30, 2010
Holdings Top 10 Positive Active* (%)
HTC 0 9
Holdings Top 10 Negative Active* (%)
Itau Unibanco (1 5)HTC 0.9
Turkiye Garanti Bankasi 0.8
Banco Bradesco 0.8
NOVATECK 0.8
CNOOC 0 7
Itau Unibanco (1.5)
Petroleo Brasileiro-Petrobras (1.2)
Gazprom (1.1)
Hon Hai Precision (0.9)
MTN (0 8)CNOOC 0.7
Commercial Intl Bk Egypt 0.7
Hyundai Motor 0.7
Rosneft 0.7
T rk Ha a Yollari 0 7
MTN (0.8)
Bank of China (0.8)
POSCO (0.8)
China Life Insurance (0.8)
T i S i d t (0 8)Turk Hava Yollari 0.7
Industrial & Com Bank of China 0.6
Total 7.5
Taiwan Semiconductor (0.8)
Lukoil (0.7)
Total (9.6)
*Relative to the MSCI Emerging Markets (G)Past performance is no guarantee of future results. Not representative of manager's entire portfolio or all recommendations. Not a recommendation or offer to buy or sell securitiesClient data shown.
38For Institutional Use Only201010-8385

Important InformationRead this important information carefully before making any investment. Speak with your relationship manager if you have any questions.
Risks
Past performance is no guarantee of future results. An investment may be risky and may not be suitable for an investor's goals, objectives and risk tolerance. Investors should be aware that an investment's value may be volatile and any investment involves the risk that you may lose money.
Performance results for individual accounts will differ from performance results for composites and representative accounts due to factors including but not limited to portfolio size, especially if currently only funded with affiliated fee paying seed capital, timing of investments, market conditions, account objectives and restrictions, and factors specific to a particular investment structure.
The value of a strategy's investments will vary day to day in response to many factors, including in response to adverse issuer, political, regulatory, market or economic developments. The value of an individual security or a particular type of security can be more volatile than the market as a whole and can perform differently from the value of the market as a whole.
The performance of international strategies depends upon currency values, political and regulatory environments, and overall economic factors in the countries in which they invest Foreign markets particularly emerging markets can be more volatile than the U S market due to increased risks of adverse issuer political regulatory market orinvest. Foreign markets, particularly emerging markets, can be more volatile than the U.S. market due to increased risks of adverse issuer, political, regulatory, market, or economic developments and can perform differently from the U.S. market. The risks are particularly significant for strategies that focus on a single country or region
These materials contain statements that are “forward-looking statements,” which are based on certain assumptions of future events. Forward-looking statements are based on information available on the date hereof, and Pyramis does not assume any duty to update any forward-looking statement. Actual events may differ from those assumed. There can be no assurance that forward-looking statements, including any projected returns, will materialize or that actual market conditions and/or performance results will not be materially different or worse than those presented.
201010-838539For Institutional Use Only

Important Information, continuedPerformance DataUnless otherwise indicated performance data shown is client data. Performance data is generally presented gross of any fees and expenses, including advisory fees, which when deducted will reduce returns. All results reflect realized and unrealized appreciation and the reinvestment of dividends and investment income, if applicable. Taxes have not been deducted. In conducting its investment advisory activities, Pyramis utilizes certain assets, resources and investment personnel of FMR Co., which does not claim compliance with the Global Investment Performance Standards (GIPS®).
If representative account information is shown, it is based on an account in the subject strategy’s composite that generally reflects that strategy’s management and is not p , j gy p g y gy gbased on performance.
Index or benchmark performance shown does not reflect the deduction of advisory fees, transaction charges and other expenses, which if charged would reduce performance. Investing directly in an index is not possible.
* * * *
The business unit of Pyramis Global Advisors (Pyramis) consists of: Pyramis Global Advisors Holdings Corp., a Delaware corporation; Pyramis Global Advisors Trust Company, a non-depository limited purpose trust company (PGATC); Pyramis Global Advisors, LLC, a U.S. registered investment adviser (PGA LLC); Pyramis Global Advisors (Canada) ULC, an Ontario registered investment adviser; Pyramis Global Advisors (UK) Limited, a U.K. registered investment manager (Pyramis-UK); Pyramis Global Advisors (Hong Kong) Limited, a Hong Kong registered investment adviser (Pyramis-HK); Pyramis Distributors Corporation LLC, a U.S. registered broker-dealer; and Fidelity Investments Canada ULC, an Alberta corporation (FIC). Investment services are provided by PGATC, PGA LLC, Pyramis Global Advisors (Canada) ULC, Pyramis-UK and/or Pyramis-HK.
"Fidelity Investments" refers collectively to FMR LLC, a US company, and its subsidiaries, including but not limited to Fidelity Management & Research Company (FMR Co.), and Pyramis. “Fidelity Investment Managers” refers collectively to FIL Limited, a non-US company, and its subsidiaries. “Fidelity” refers collectively to Pyramis and Fidelity Investments.
Certain data and other information in this presentation have been supplied by outside sources and are believed to be reliable as of the date of this document. Data and information from third-party databases, such as those sponsored by eVestment Alliance and Callan, are self-reported by investment management firms that generally pay a subscription fee to use such databases, and the database sponsors do not guarantee or audit the accuracy, timeliness or completeness of the data and information provided including any rankings. Rankings or similar data reflect information at the time rankings were retrieved from a third-party database, and such rankings may vary significantly as additional data from managers are reported. Pyramis has not verified and cannot verify the accuracy of information from outside sources, and potential investors should be aware that such information is subject to change without notice. Information is current as of the date noted.
Pyramis has prepared this presentation for and only intends to provide it to institutional sophisticated and/or qualified investors in one on one or comparablePyramis has prepared this presentation for, and only intends to provide it to, institutional, sophisticated and/or qualified investors in one-on-one or comparable presentations. Do not distribute or reproduce this report.
All trademarks and service marks included herein belong to FMR LLC or an affiliate, except third-party trademarks and service marks, which belong to their respective owners. Pyramis does not provide legal or tax advice and we encourage you to consult your own lawyer, accountant or other advisor before making an investment.
Not FDIC Insured • No Bank Guarantee • May Lose Value
201010-838540For Institutional Use Only

Biographies
Chris Steward, CFAInstitutional Portfolio ManagerChris Steward is an institutional portfolio manager at Pyramis Global Advisors, a unit of Fidelity Investments. He is a member of
Brian Hoesly, CFAInstitutional Portfolio ManagerBrian Hoesly is an institutional portfolio manager at Pyramis Global Advisors a unit of Fidelity Investments He is a memberGlobal Advisors, a unit of Fidelity Investments. He is a member of
the portfolio management teams for the Pyramis International Growth and Select International Small Cap strategies.
Prior to joining Pyramis in 2006, Chris was a vice president and portfolio advisor at Wellington Management. In that role, he conducted investment reviews with prospects and clients on a
Global Advisors, a unit of Fidelity Investments. He is a member of the portfolio management team for the Pyramis International Growth and International Value strategies.
Prior to joining Pyramis in 2006, Brian was vice president at Wellington Management, working with clients invested in multiple strategies, including international equities and asset
broad range of equity, fixed income, and asset allocation products. Chris also worked with the global asset allocation group at Putnam Investments, served as a portfolio manager for five years in the global bond group at Scudder, Stevens & Clark, and was an analyst in various capacities with the Federal Reserve Bank of New York for five years.
allocation. He actively conducted portfolio reviews on a wide array of strategies articulating performance, process, holdings, and investment themes on behalf of portfolio management teams. Prior to that, he served in the product and investment areas of Mellon Trust, the global data research group at Interactive Data Corporation, and with Kidder, Peabody & Co.,
Chris earned a Bachelor of Arts degree from Vassar College and a Master of Arts degree in Economics from Cambridge University in England. In addition to being a Chartered Financial Analyst charterholder, Chris also has authored and co-authored numerous texts on international investing, one of which is a required reading for Level III of the CFA program
p , , y ,Inc. He has more than 19 years of investments industry experience.
Brian earned a Bachelor of Science degree from the University of Wisconsin and a Master’s degree in Business Administration from Boston University. He is a Chartered Financial Analyst h t h ld d b f th B t S itirequired reading for Level III of the CFA program. charterholder and a member of the Boston Securities
Analysts Society.
201010-838541For Institutional Use Only
Biographies
John LoPortfolio Manager, Pacific Basin ex-Japan EquitiesJohn is a Portfolio Manager at Fidelity International. Based in Hong Kong he is responsible for managing Pacific Basin ex-
Eileen M. Dibb, CFAPortfolio ManagerEileen Dibb is a portfolio manager at Pyramis Global Advisors, a unit of Fidelity Investments She manages the Japan equity Hong Kong, he is responsible for managing Pacific Basin ex
Japan accounts. Prior to assuming his current role, he managed the Asian equities portion of global emerging market portfolios and other institutional accounts. Previously, John was a select leader for Asian emerging markets, managed a Malaysia equity fund, and worked as an equity research analyst covering the tobacco food and gaming sectors in Asian emerging markets
unit of Fidelity Investments. She manages the Japan equity portion of the Pyramis International Growth strategy.
Prior to assuming her current role at Pyramis, Eileen was responsible for research and analysis of Asian stocks. In this role, she researched and analyzed stocks with a core focus on Japan and made stock recommendations for holdings in a global equity
tobacco, food, and gaming sectors in Asian emerging markets. Before joining Fidelity International in 1993, John was a corporate advisory executive at Ernst & Young in Malaysia. John has 14 years of industry experience.
John earned his B.Sc. in Economics from the University of Wales College Cardiff and his M.B.A. from Manchester
portfolio managed by Fidelity Investments. Prior to joining Fidelity in 2005, Eileen was vice president and regional analyst at Wellington Management Company where she managed dedicated Japan portfolios. Prior to joining Wellington in 1999, she was an international equity analyst at DuPont Pension Fund beginning in 1997. Eileen also served in a number of roles at The g
Business School.g g
Dai-ichi Mutual Life Insurance Company from 1992 through 1996.
Eileen earned a Bachelor of Arts degree in International Relations and Japanese Studies from Bucknell University and a Master’s degree in Business Administration from The Wharton School at the University of Pennsylvania. She is a Chartered Financial A l t (CFA) h t h ld Sh l t dAnalyst (CFA) charterholder. She completed a one-year program of study at the Center for Japanese Studies at Nanzan University in Nagoya, Japan and is fluent in Japanese.
201010-838542For Institutional Use Only

Biographies
Michael C. Strong Portfolio ManagerMike Strong is an institutional portfolio manager at Pyramis Global Advisors a unit of Fidelity Investments He is lead portfolio
Cedric De La ChaisePortfolio Manager, European EquitiesCedric is a Portfolio Manager in the European Equities Group at Fidelity International Based in London he is responsible forGlobal Advisors, a unit of Fidelity Investments. He is lead portfolio
manager for the Pyramis International Growth strategy.
Prior to assuming his current role, Mike was an investment director responsible for Fidelity’s institutional international equity strategies. Prior to joining Fidelity in 1998, he spent almost 10 years as a senior investment consultant at Watson Wyatt in
at Fidelity International. Based in London, he is responsible for managing pan-European equity portfolios on behalf of institutional clients. Prior to assuming his current role, he was an assistant portfolio manager for Fidelity’s European Growth fund. Previously, Cedric served as sector leader for the Consumer Team and managed the Global Consumer Sector Fund was a sector leader for European Financials andLondon. Prior to that, Mike was the investment manager for Ford
Motor Company’s European Pension Plans.
Mike earned a Bachelor of Arts degree in Economics from the University of Manchester, England.
Fund, was a sector leader for European Financials, and worked as an equity analyst covering European media, insurance, retailers, and micro-cap stocks. He joined Fidelity International in 1995.
Cedric earned his M.Sc. from Warwick Business School.
201010-838543For Institutional Use Only
BiographiesJoe OverdevestPortfolio ManagerJoe Overdevest is Portfolio Manager for the Canadian equity sub-portfolio of Pyramis International Growth strategy and Fidelity Global Fund and co-portfolio manager of Fidelity Global Natural
Bob von RekowskyPortfolio ManagerBob manages all of Fidelity’s emerging markets equity funds. He also manages several institutional and retail funds available to domestic and overseas investors Global Fund, and co portfolio manager of Fidelity Global Natural
Resources Fund. He is also Assistant Portfolio Manager of Pyramis Canadian Systematic Equity at Pyramis Global Advisors, a unit of Fidelity Investments ULC.
Prior to assuming his current role, Joe was a Research Analyst with Team Canada, the research and portfolio management team
domestic and overseas investors.
Bob joined Fidelity’s Fixed Income Division in 1989. In 1995, he moved along with the emerging markets debt group into the company’s high income division as a sovereign debt analyst. Bob continued in that role while working out of Fidelity’s London office from 1996 to mid-1998, when he then transitioned into European
for investment products sold through Fidelity Investments Canada ULC. Previous areas of coverage include: Canadian oil and gas, diversified financials, telecommunications, retail, consumer durables, and automotive parts.
Joe earned a Bachelor of Business Administration honors degree from Wilfrid Laurier University
equity research. From mid-1998 to 2002, Bob split his time as a research analyst between Emerging and pan-European equities. During that time, Bob was sector leader for emerging markets in London.
From 2002 to 2004, Bob was an associate fund manager for the emerging markets funds responsible for the EMEA region In from Wilfrid Laurier University.emerging markets funds, responsible for the EMEA region. In January 2004, Bob relocated to Boston to take over management of all of Fidelity’s global emerging market equity funds.
Bob received his B.A. from the University at Albany, SUNY, his M.A. from Northeastern University, and his M.S. in Finance from Brandeis University. Bob is a member of the Boston Economic yClub, the Boston Committee on Foreign Relations and World Boston. He is also a coordination board member for the Armenia 2020 project.
Bob authored “Investor’s Outlook” in Russian Investment Review’s June to October 2003 edition. He was voted “Best of the Buyside”
201010-838544For Institutional Use Only
in Institutional Investor magazine in 2001, 2002 and 2003.