PXRD WITH RAMAN SPECTROSCOPY, DSC AND IR...
60
PXRD with RAMAN SPECTROSCOPY, DSC and IR DATA Chris Gilmore, Gordon Barr and Gordon Cunningham
Transcript of PXRD WITH RAMAN SPECTROSCOPY, DSC AND IR...

PXRD with RAMAN SPECTROSCOPY, DSC and IR DATA
Chris Gilmore, Gordon Barr and Gordon
Cunningham

This document was presented at PPXRD -Pharmaceutical Powder X-ray Diffraction Symposium
Sponsored by The International Centre for Diffraction Data
This presentation is provided by the International Centre for Diffraction Data in cooperation with the authors and presenters of the PPXRD symposia for the express purpose of educating the scientific community.
All copyrights for the presentation are retained by the original authors.
The ICDD has received permission from the authors to post this material on our website and make the material available for viewing. Usage is restricted for the purposes of education and scientific research.
ICDD Website - www.icdd.comPPXRD Website – www.icdd.com/ppxrd

Classifying Data• Statistics/data mining problem: put patterns
(PXRD, spectra) into clusters where each cluster contains patterns which are most similar to each other.
• Not always a unique solution.
• Problems with:
• Data quality.
• Sample quality.
• Data quantity.
• Need for automation, and speed.

Correlation
• Forget peaks.• Match every data point.• Use correlation coefficients:
• Pearson correlation coefficient (parametric).
• Spearman correlation coefficient (non-parametric).

Pearson correlation coefficient
( )( )
( ) ( )allpoints
2 2
allpoints allpoints
i i
Pearson
i i
x x y yr
x x y y
− −=
− −
∑
∑ ∑
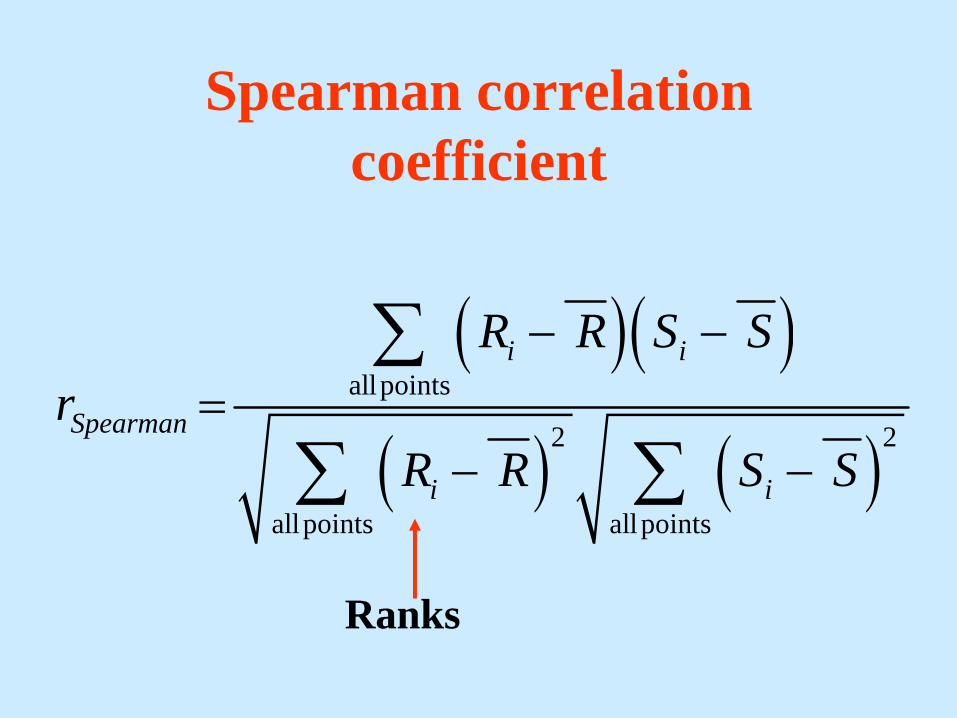
Spearman correlation coefficient
( )( )
( ) ( )allpoints
2 2
allpoints allpoints
i i
Spearman
i i
R R S Sr
R R S S
− −=
− −
∑
∑ ∑
Ranks

Combine them
1 2Pearson Spearmanr w r w r= +Use Fischer transforms:
( ) ( )1 1tanh tanhtanh
2Pearson Spearmanr r
r− −⎛ ⎞+
⎜ ⎟=⎜ ⎟⎝ ⎠
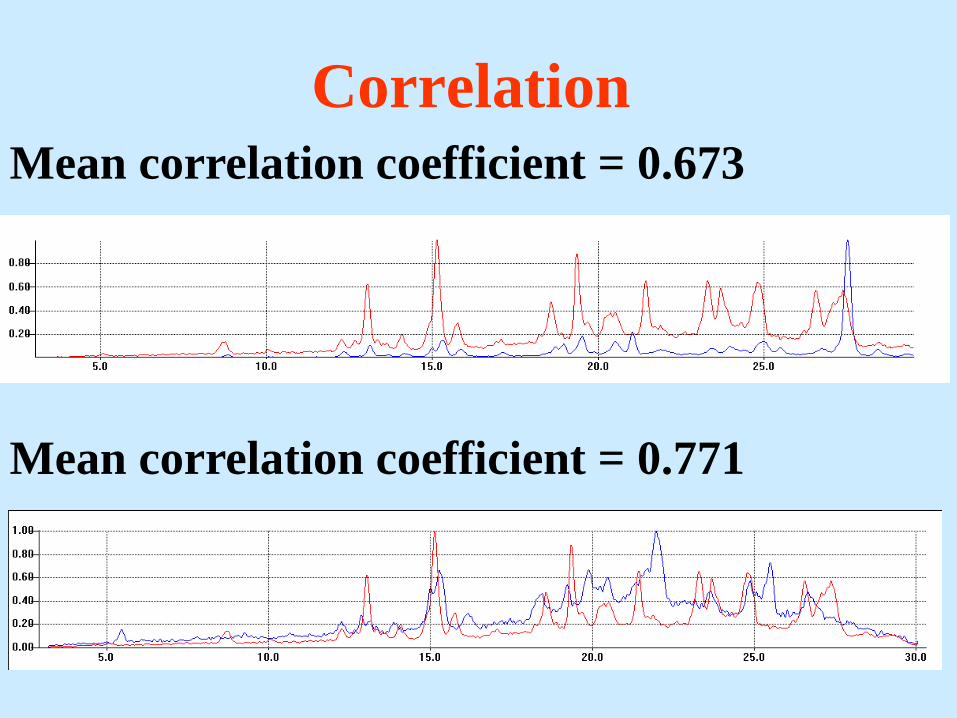
CorrelationMean correlation coefficient = 0.673
Mean correlation coefficient = 0.771
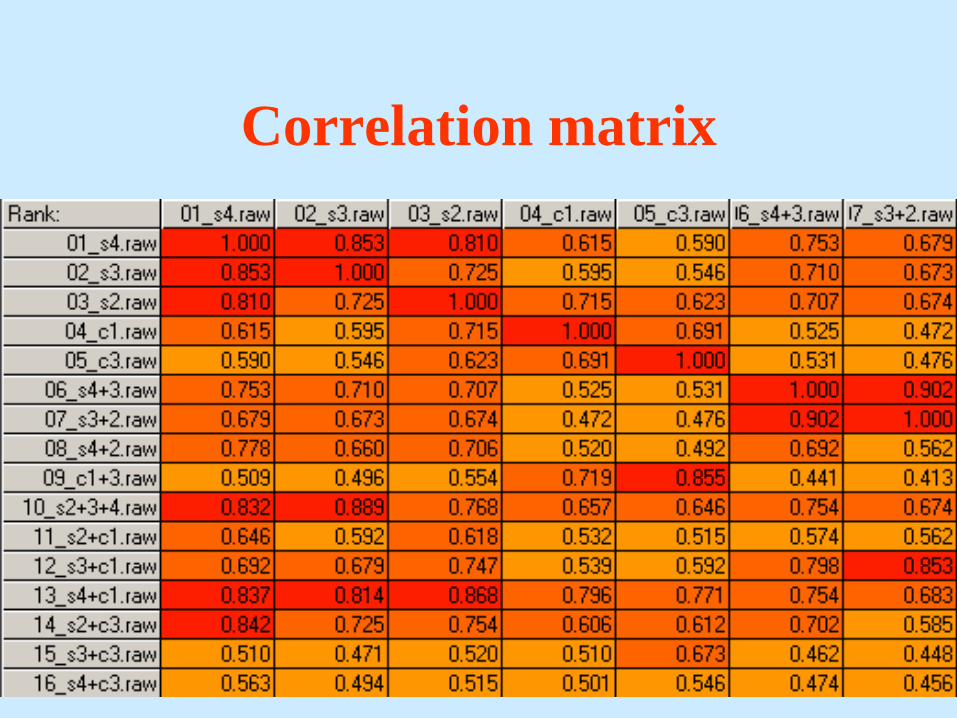
Correlation matrix
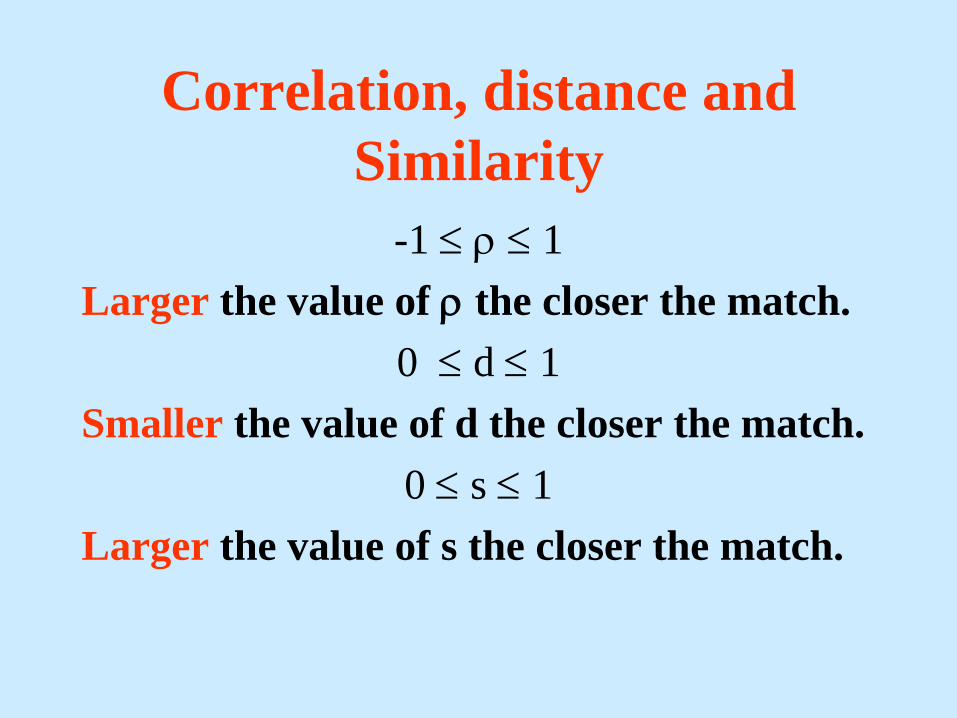
Correlation, distance and Similarity
-1 ≤ ρ ≤ 1Larger the value of ρ the closer the match.
0 ≤ d ≤ 1Smaller the value of d the closer the match.
0 ≤ s ≤ 1Larger the value of s the closer the match.

Correlation, distance and Similarity
correlation matrix, ρij
distance matrix
dij = 0.5(1- ρij)
similarity matrix
sij = 1 – dij/dijmax)
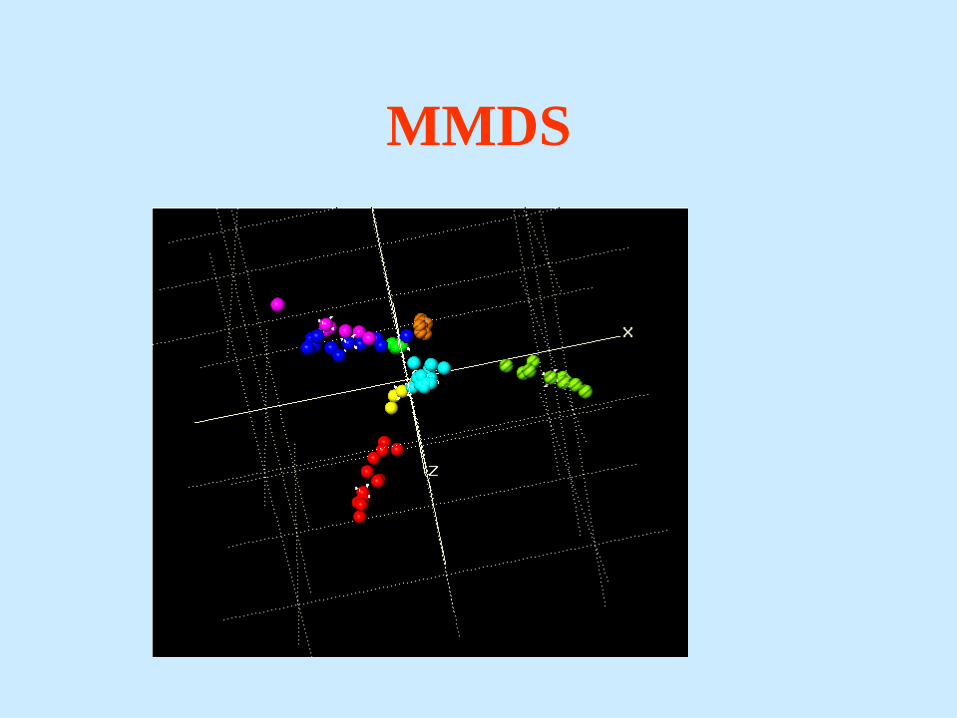
MMDS
Dendrogram

Example: Phase Transitions in Ammonium Nitrate
Work with • Michael Hermannn (Fraunhofer-
Institut Chemische Technologie)• Karsten Knorr (Bruker AXS, Karlsruhe)See Hermann & Engel Propellants,
Explosives, Pyrotechnics 22, 143-147 (1997).

Ammonium Nitrate
• 5 phases I – V• Start with a mixture of IV + V that
transforms to IV, II and I.


Ammonium Nitrate
• 75 PXRD data sets. • How to visualize and interpret these
data?

Dendrogram
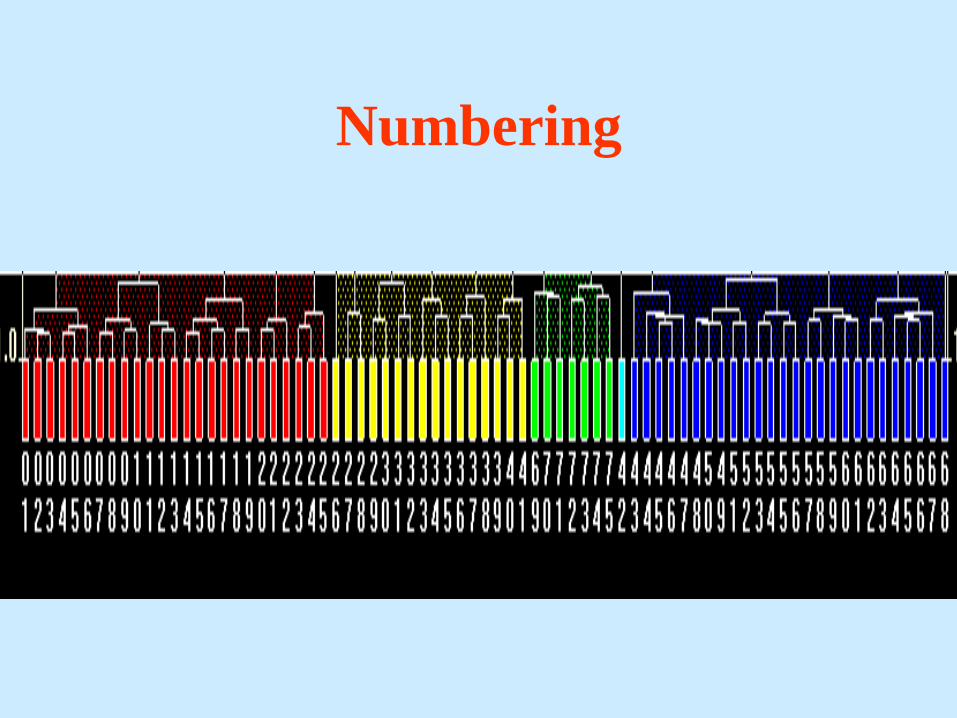
Numbering

Metric Multidimensional Scaling (MMDS)
Each sphere is a single sample

Metric Multidimensional Scaling
IV + V
IV
II
I
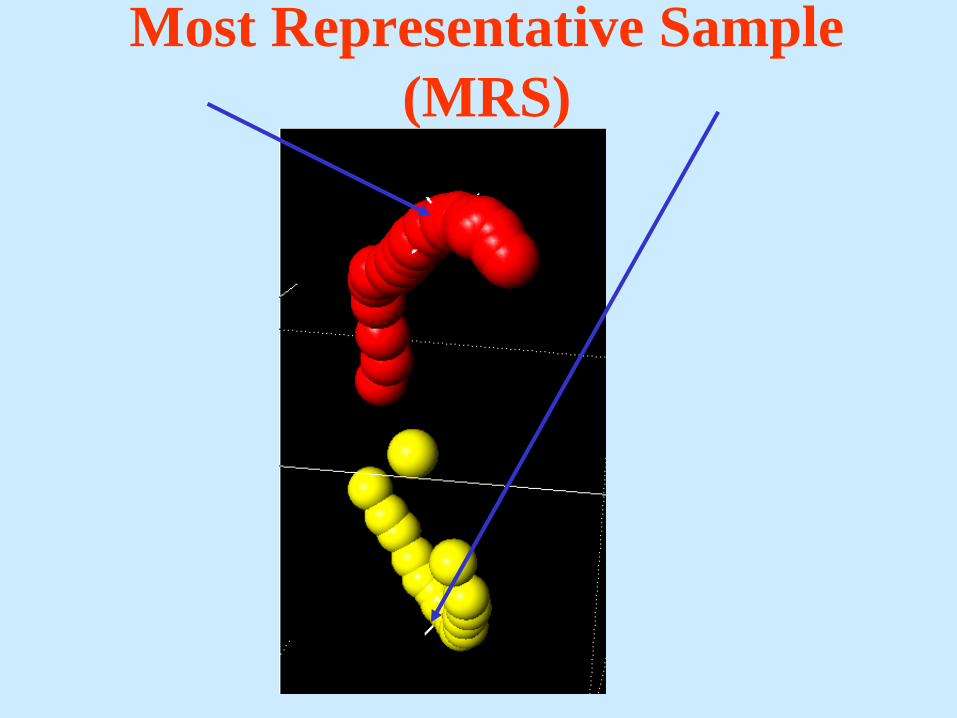
Most Representative Sample (MRS)

Simple Quantitative Analysis
• We know the sequence IV + V → IV → II → I
• Take MRS of IV+V, IV, II, I and use in quantitative analysis.

Simple Quantitative Analysis
IV + V
IV
II
I
53% I + 47% II
56% II + 44% IV
57% IV+V + 43% V

Parallel Coordinate Plots
• The MMDS (or PCA) calculation gives results in > 3 dimensions, and we merely select the 1st 3 (e.g. the first 3 eigenvectors for each eigenvalue)
• Consider the 6 dimensional coordinates(0.1, 0.2, 0.3, 0.2, 0.0, 0.2) = (x1, x2, x3, x4, x5,
x6)
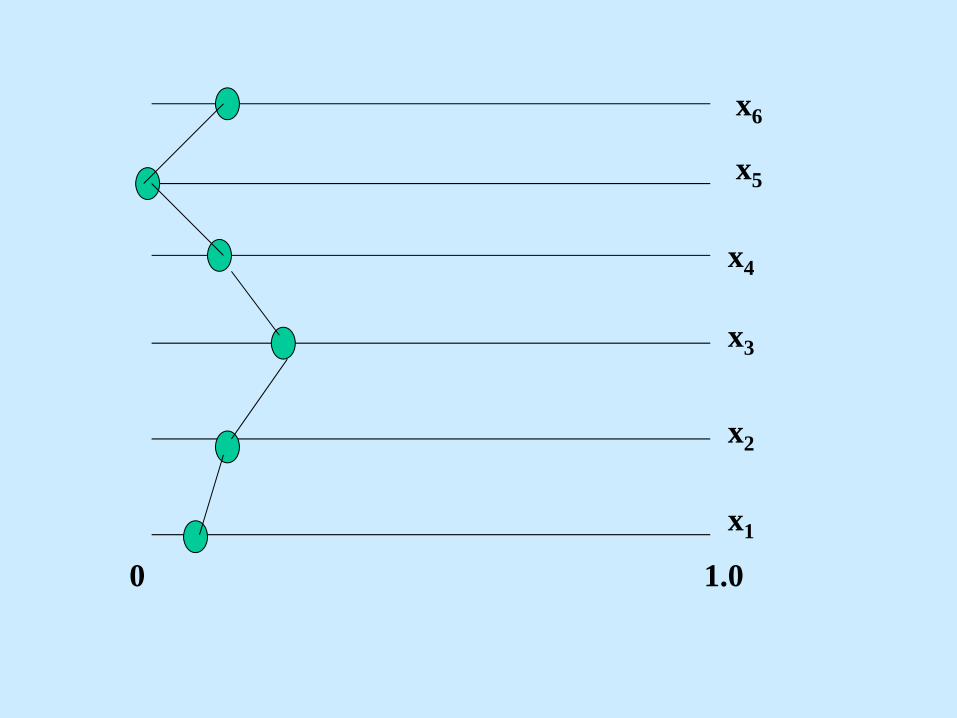
x6
x5
x4
x3
x2
x1
0 1.0

Other Visualization Tools: Parallel Coordinate Plots –
More than 3 Dimensions

Another View
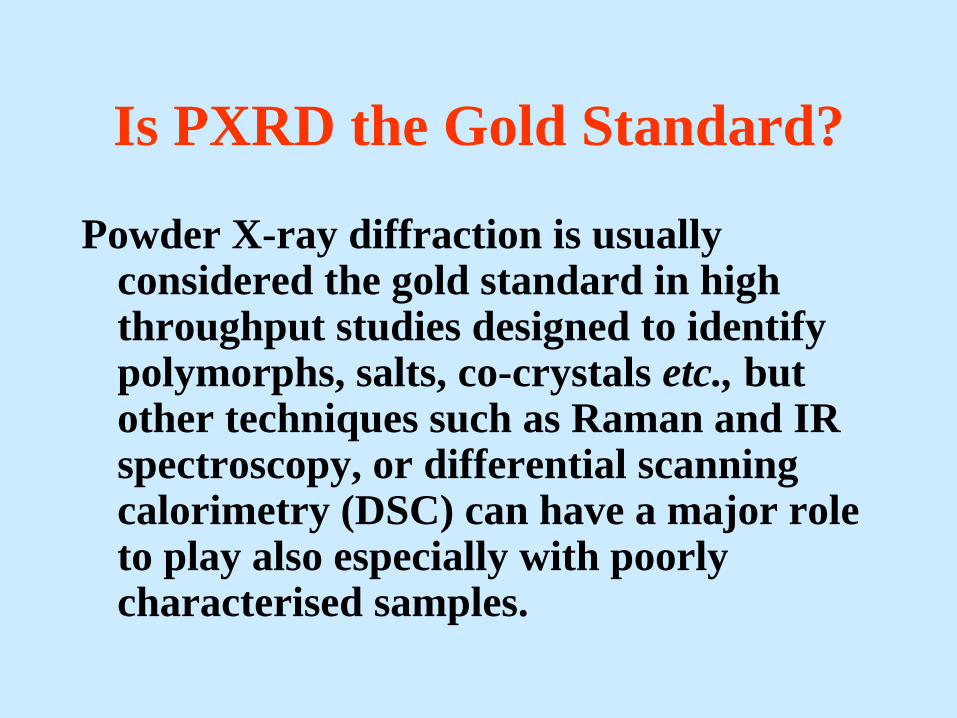
Is PXRD the Gold Standard?
Powder X-ray diffraction is usually considered the gold standard in high throughput studies designed to identify polymorphs, salts, co-crystals etc., but other techniques such as Raman and IR spectroscopy, or differential scanning calorimetry (DSC) can have a major role to play also especially with poorly characterised samples.

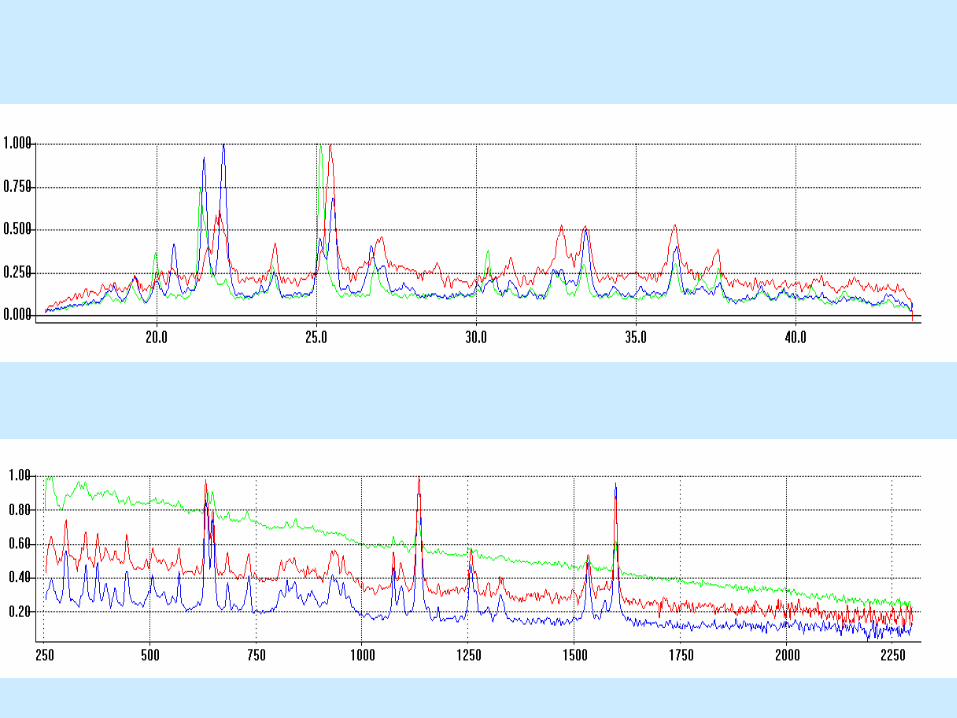
Raman Data• Raman spectroscopy is well suited to screening: good
quality spectra can be collected in a few minutes, and sample preparation is straightforward and flexible, although the resulting spectra are not always as distinct as the PXRD equivalent
High-throughput powder diffraction V: the use of Raman spectroscopy with and without X-ray powder diffraction dataBarr, Cunningham, Dong, Gilmore & Kojima J. Appl. Cryst. (2009). 42, 706–714

carbamazepine
cimetidene
furosemide
mefenamicacid
phenylbutazone
sulfamerazine
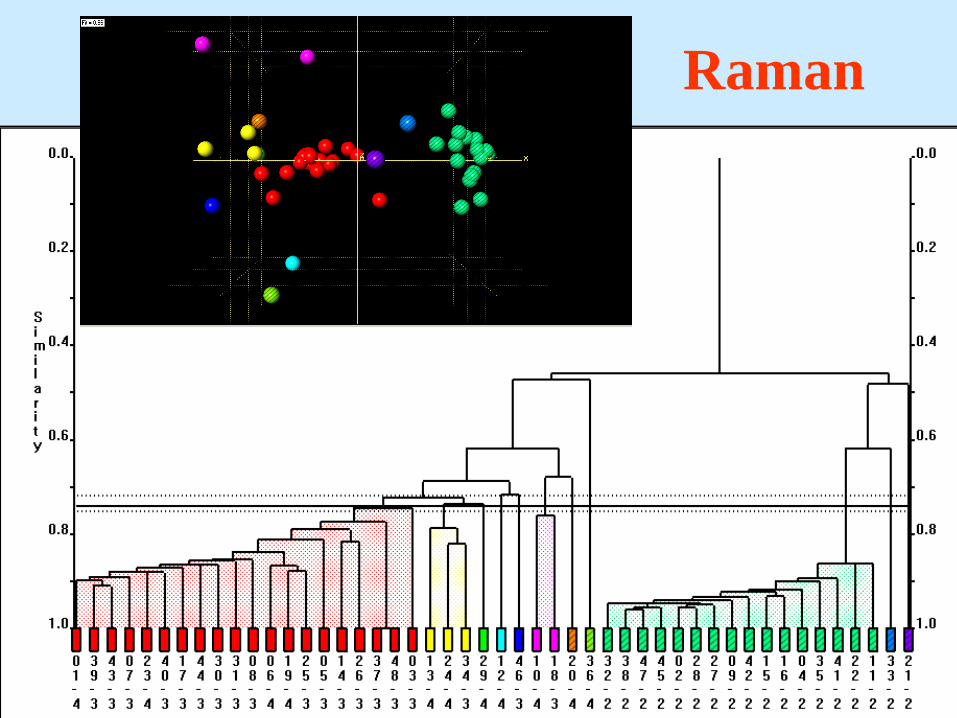
MMDS
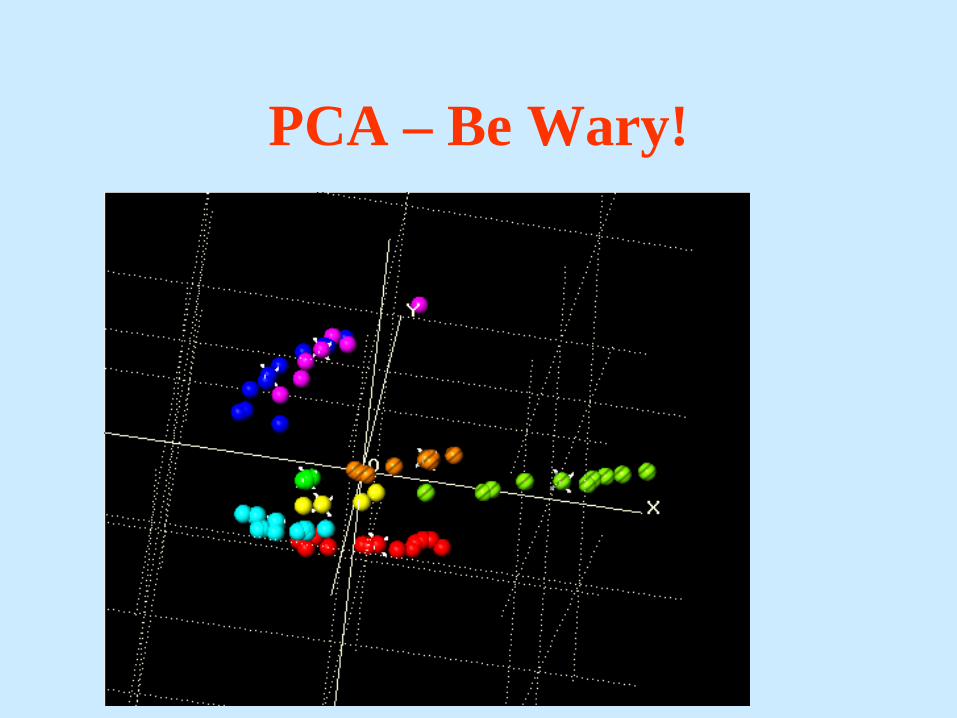
PCA – Be Wary!
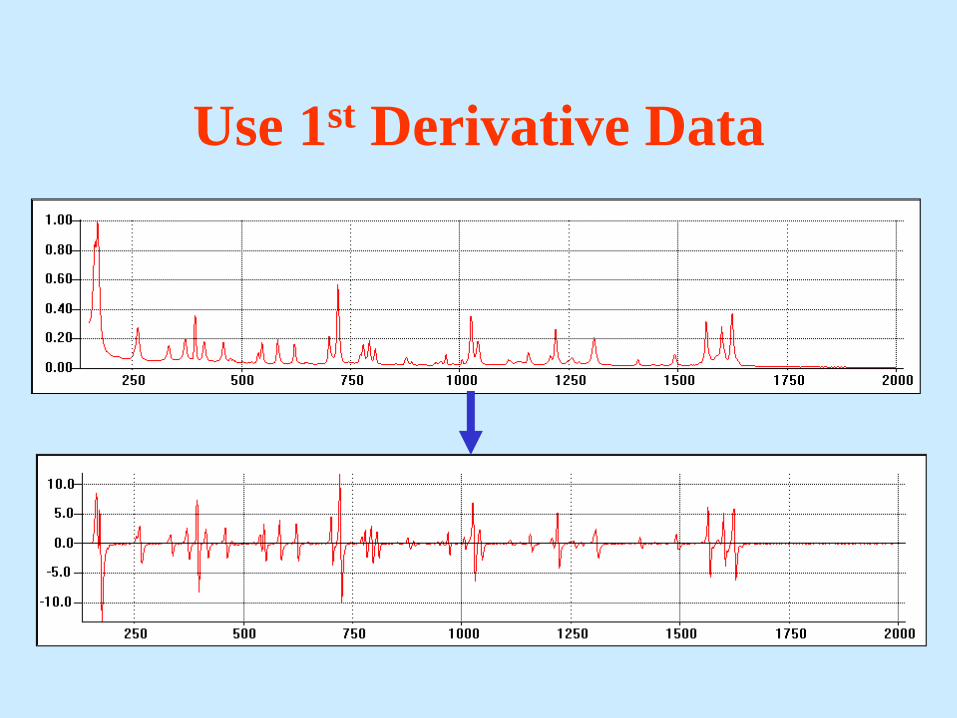
Use 1st Derivative Data
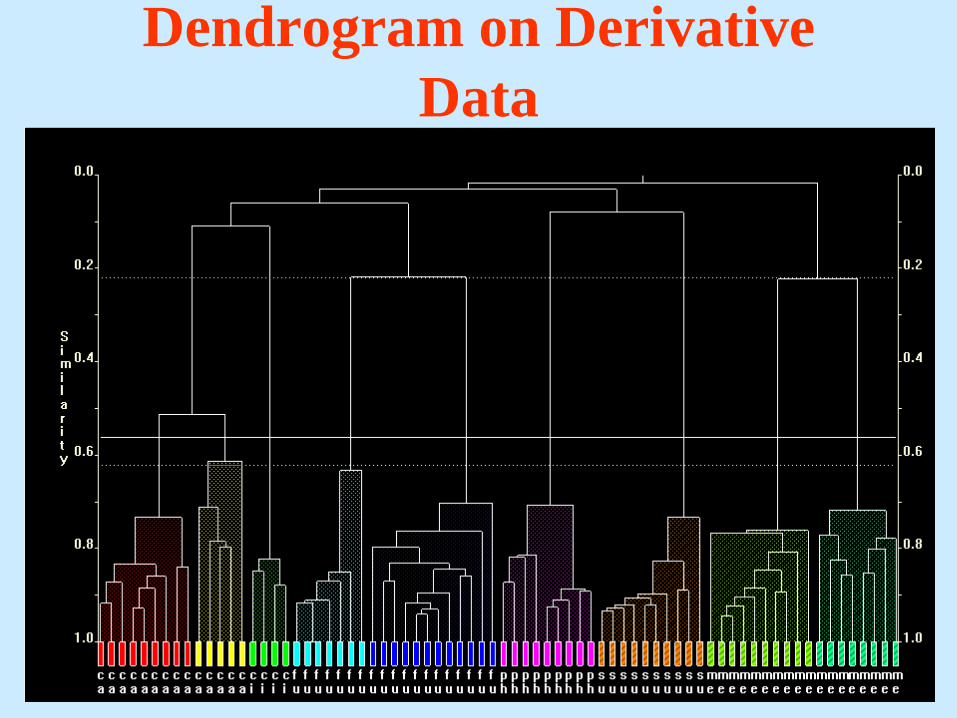
Dendrogram on Derivative Data
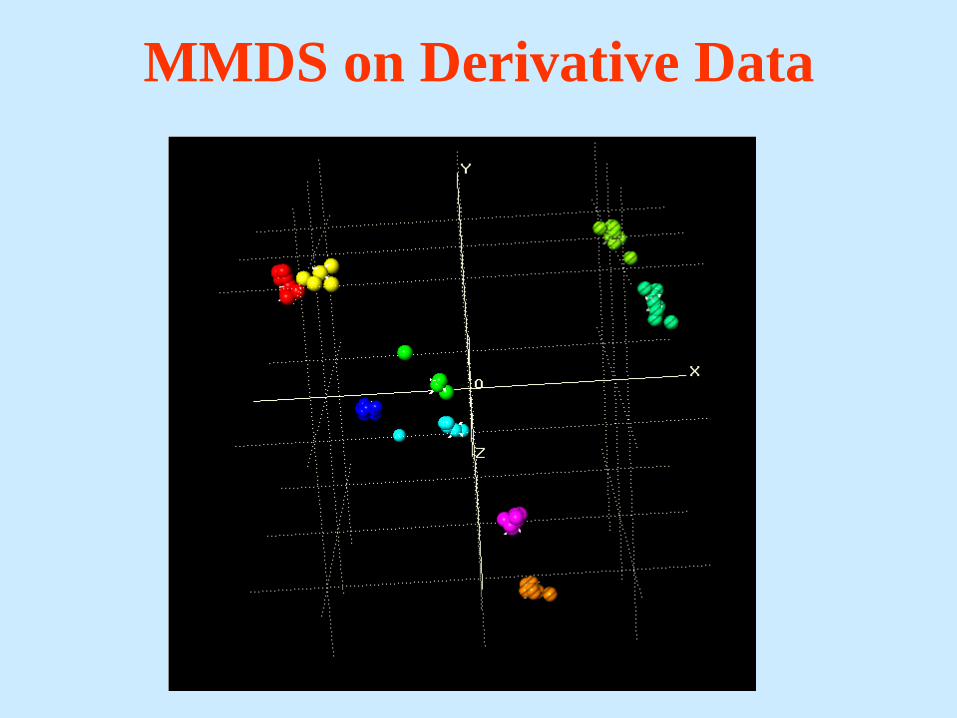
MMDS on Derivative Data
How Do You Combine Different Data Types?
• Combined XRPD + Raman instruments now available
• Applying multiple techniques to the same samples gives additional information
• How would we actually combine results from two (or more) such different techniques ?
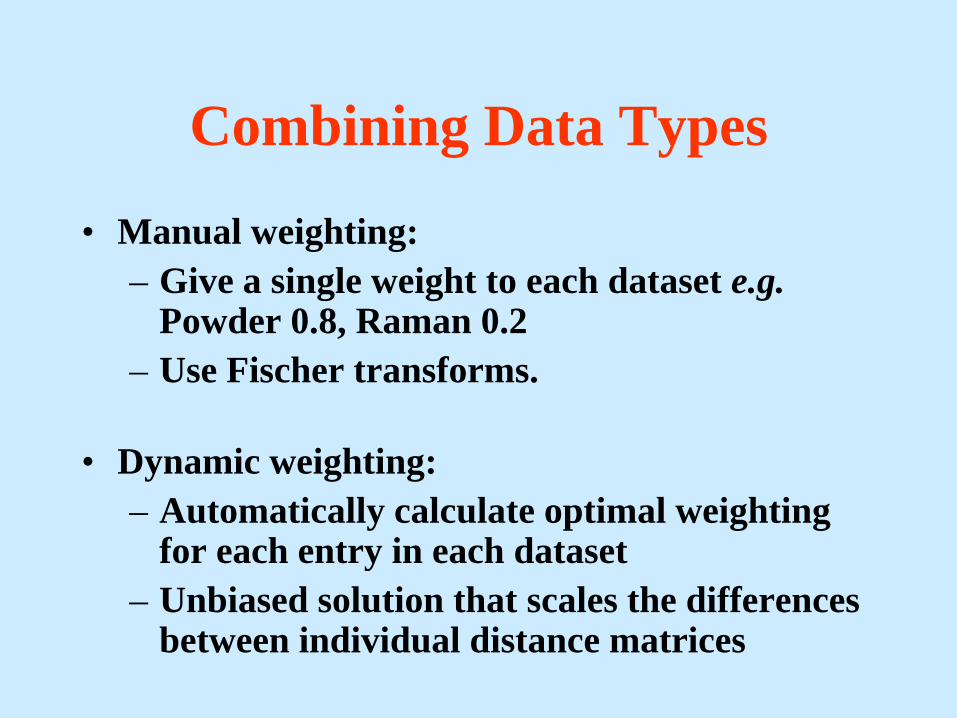
Combining Data Types
• Manual weighting:– Give a single weight to each dataset e.g.
Powder 0.8, Raman 0.2– Use Fischer transforms.
• Dynamic weighting:– Automatically calculate optimal weighting
for each entry in each dataset– Unbiased solution that scales the differences
between individual distance matrices

Dynamic weighting• Dynamic Weighting using INDSCAL:
Independent Scaling of DifferencesCarroll & Chang, (1970) Psychometrica 35, 283-319
• Each data set has a 2-D distance matrix d• Dk is squared (n × n) distance matrix for
dataset ke.g. we have Raman and XRPD data on 20 samples,
so k = 2, n=20.• We want a Group Average Matrix, G, to
optimally describe our data• Specify diagonal weight matrices Wk which can
vary over the k datasets
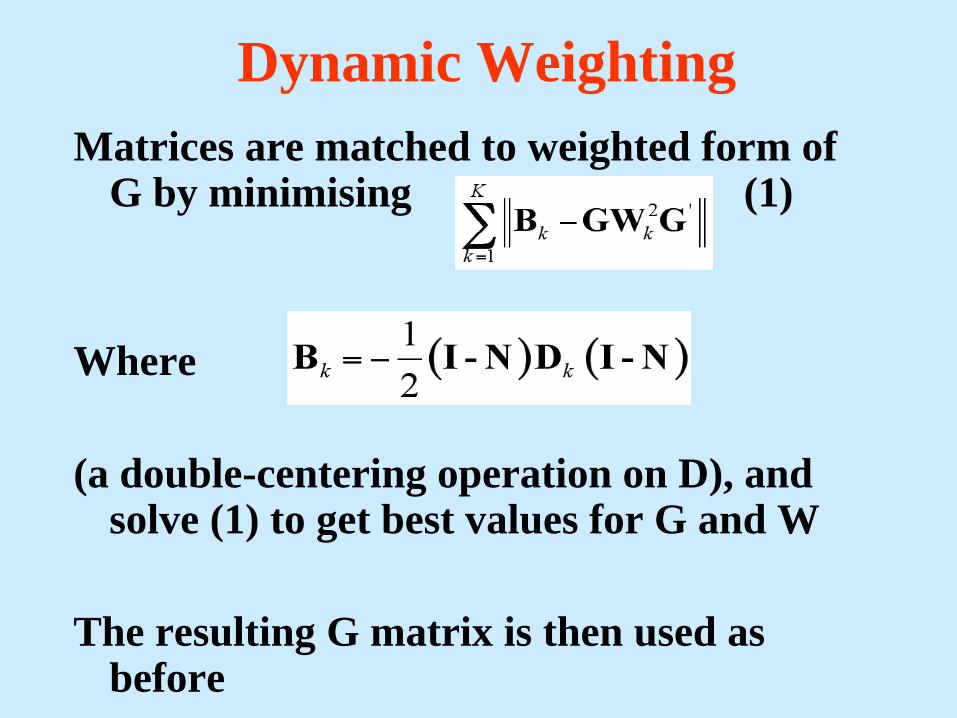
Dynamic WeightingMatrices are matched to weighted form of
G by minimising (1)
Where
(a double-centering operation on D), and solve (1) to get best values for G and W
The resulting G matrix is then used as before

Full profile matching all patterns against all
patterns
n
XRPD Patterns
nxn
correlation matrix
Full profile matching all patterns against all
patterns
n
Raman Patterns
nxn
correlation matrix
nxn
distance datrix
Combine
XRD results
Raman results
Combined results
nxn
distance matrix
nxn
distance matrix
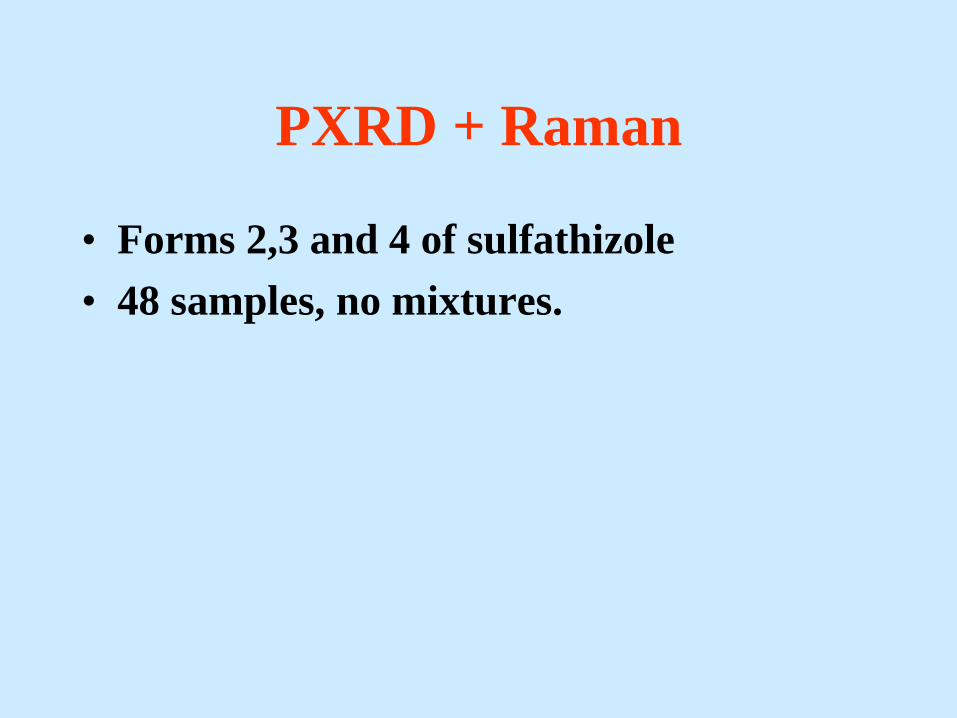
PXRD + Raman
• Forms 2,3 and 4 of sulfathizole• 48 samples, no mixtures.

PXRD
Raman
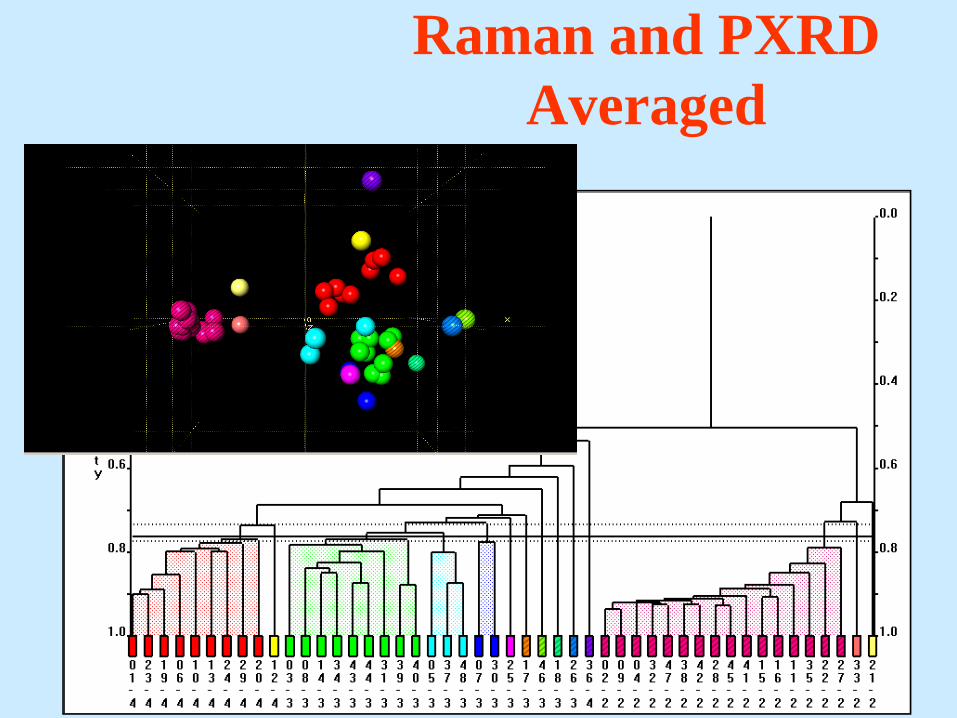
Raman and PXRD Averaged

INDSCAL

Other Combinations
• Raman + Raman derivative data.• Different data collection
protocols/apparatus on the same samples.• You can include numeric data as a data
type e.g. image analysis data.

Numeric data – get the distance matrix directly.
12 2
1
m
ij k ik jkk
d w x x=
⎛ ⎞= − ⇒⎜ ⎟⎜ ⎟⎝ ⎠∑ d
Sample 1: 113.431 58.531 155.845 … {x11, x12 , x13…….}
Sample 2: 113.44 58.328 153.602 … {x21, x22 , x23…….}
Sample 3: 117.873 60.117 93.686 … {x31, x32 , x33…….}

Raman + Derivative
Data

PXRD, Raman, IR + DSC
16 samples containing 3 forms of sulfathiazole and carbamazepine + mixtures:
• PXRD: Bruker C2 GADDS,• IR: JASCO FT/IR 4100,• DSC: TA instruments Q100.• Raman: Renishaw inVia Reflex
Spectrometer System.
PXRD, Raman, IR + DSC
• 15 different data sets and combinations!• You need good software to explore all
these options.


PXRD + IR + Raman + DSC
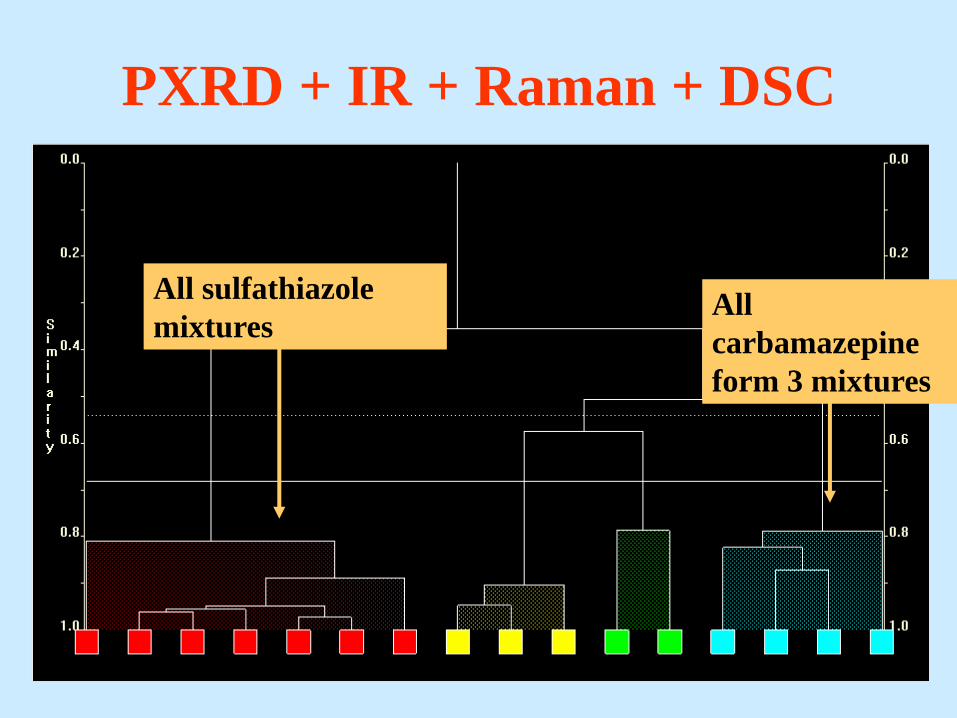
PXRD + IR + Raman + DSC
All carbamazepine form 3 mixtures
All sulfathiazole mixtures

PXRD + XRF
Lowe-Ma, et al.
Ford Motor Company

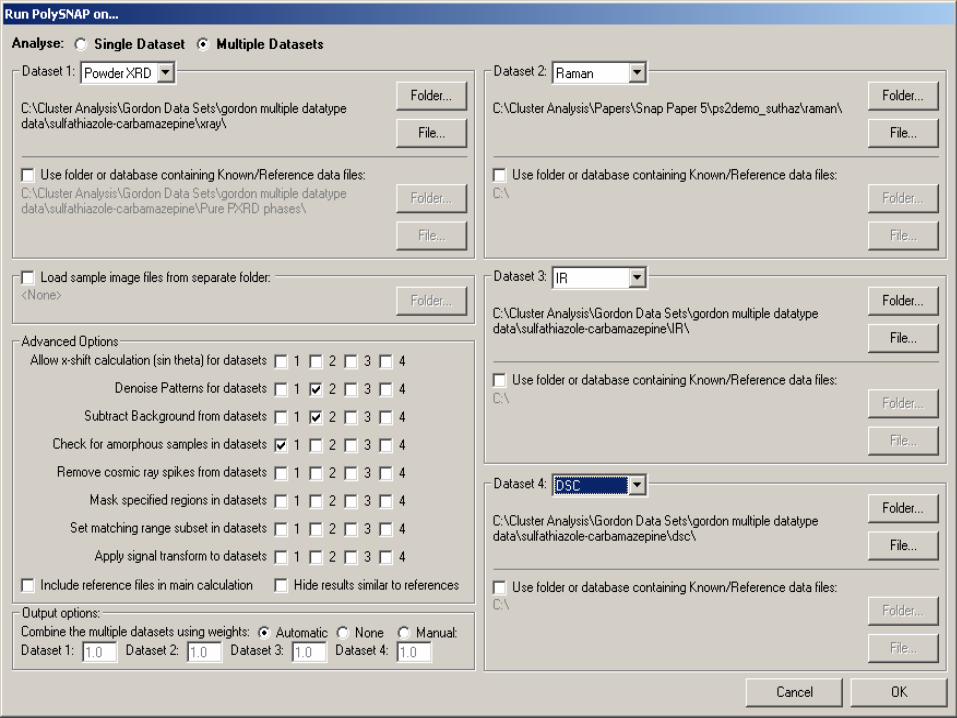
PolySNAP 3
You can do this with PolySNAP3http://www.chem.gla.ac.uk/snap/
PolySNAP_index.htmlSee:Barr, Dong & Gilmore, J. Appl.
Cryst., (2009), 42, 965-974.orUse MATLAB/R/Sage
In progress
• Missing data.• DSC processing• Non numeric data

dSNAP: A New Way of Analysing the Results of Cambridge Data
Base Searches
It’s free:
www.chem.gla.ac.uk/snap
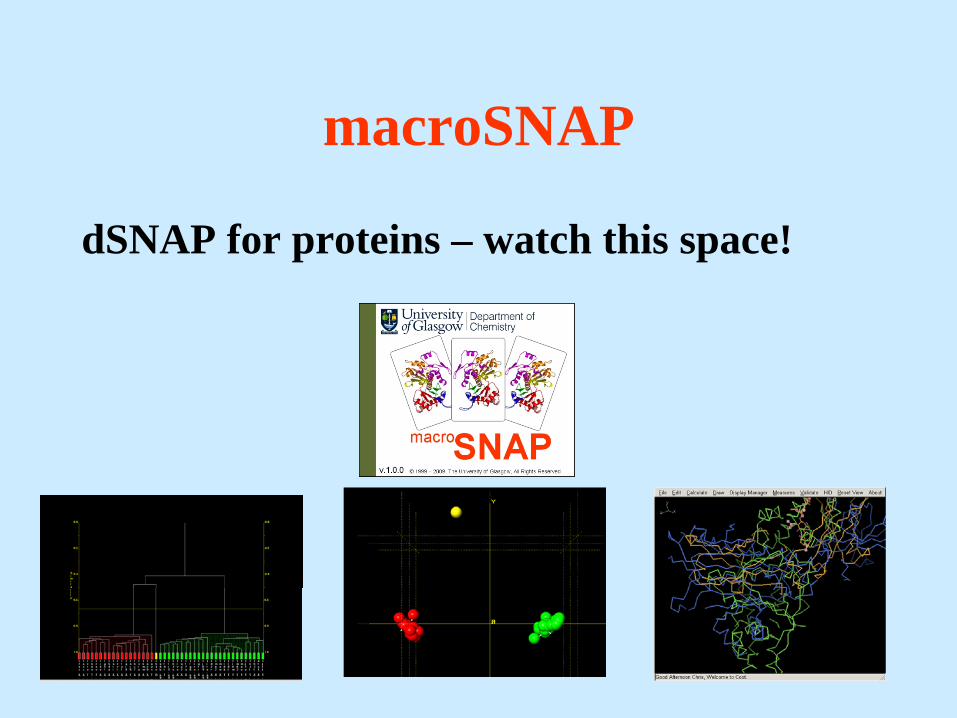
macroSNAP
dSNAP for proteins – watch this space!
Acknowledgements
• Michael Hermannn (Fraunhofer-Institut Chemische Technologie)
• Karsten Knorr & Arnt Kern (Bruker AXS, Karlsruhe)
• Chris Frampton & Susie Buttar, Pharmorphix